Accurate Metallicities for Very Metal-Poor Stars from the Ca II Infrared Triplet
Abstract
The Ca II H & K lines are among the few features available to infer the metallicity of extremely metal-poor stars from medium-resolution spectroscopy. Unfortunately, these lines can overlap with absorption produced in the intervening interstellar medium, introducing systematic errors in the derived metallicities. The strength of the Ca II infrared triplet lines can also be measured at extremely low metallicities, and it is not affected by interstellar absorption, but suffers significant departures from Local Thermodynamical Equilibrium (LTE). We investigate the feasibility of adopting the Ca II infrared triplet as a metallicity indicator in extremely metal-poor stars using state-of-the art Non-LTE models including the most recent atomic data. We find that the triplet lines exhibit Non-LTE abundance corrections that can exceed 0.5 dex. When interstellar absorption affecting the Ca II resonance lines is accounted for using high-resolution observations, the agreement between Non-LTE abundances for the triplet and those for the resonance lines, with only minor departures from LTE, is excellent. Non-LTE effects strengthen the Ca II IR triplet lines, facilitating measurements at very low metallicities, compared with LTE estimates, down to . This result has important implications for the discovery of primitive stars in our Galaxy and others, since instruments are most sensitive at red/near-infrared wavelengths, and tens of millions of spectra covering the Ca II IR triplet will soon become available from the Gaia, DESI, WEAVE, and PFS missions.
1 Introduction
The first stars born in the Galaxy inherited the composition of the pristine gas in the early interstellar medium, with basically no metals. We do not yet know whether there is a metallicity threshold for the formation of low-mass stars (e.g. Bromm & Loeb, 2003; Chiaki et al., 2017; Stacy et al., 2016; Magg et al., 2018, and references therein), but there are low-mass stars with metal-to-hydrogen ratios as low as (see, e.g., Ishigaki et al., 2014; Komiya et al., 2016), and even lower ratios when calcium or iron abundances are taken as a proxy for metallicity.
Very-old low-mass stars that have survived until today offer us a way to track the early chemical evolution of the Milky Way, and sample the nucleosynthetic yields of the first massive stars and their supernovae (e.g., Umeda & Nomoto, 2005; Hartwig et al., 2018). But to do so we need first to find suitable samples– they are truly rare, with only half a dozen known at [Fe/H] (Christlieb et al., 2004; Frebel et al., 2005; Keller et al., 2014; Bonifacio et al., 2015; Aguado et al., 2018b, a; Nordlander et al., 2019a), and second, learn to read their spectra, which challenge simplified models of stellar atmospheres.
At low metallicity the overall atmospheric structure is affected by the lack of metal-line absorption. This has been shown to have dramatic consequences for the formation of molecules (García Pérez et al., 2006). Lower metal line opacity, together with a lower density due to a lower mean molecular weight. leads to a larger number of scatterings experienced by photons in spectral lines and consequently to more pronounced deviations from LTE.
At extremely low metallicities, stellar spectra, especially for warm F-type halo turnoff stars, appear void of metal lines, and only the abundances of a few elements can be measured. Searches for extremely metal-poor stars exploit the formidable strength of the Ca II H & K lines at 3934 and 3969 Å, which can be detected down to very low abundances at modest spectral resolution (e.g., Beers et al., 1985; Caffau et al., 2013; Aguado et al., 2016). However, calcium atom in the warm interstellar medium, with typical temperatures in the range 6000–10000 K, are mainly sitting in the ground level of Ca II, and contribute absorption in the vicinity of the stellar lines. The interstellar medium absorption may have multiple components from individual clouds, which are narrower and usually shifted in velocity from the stellar lines. These contributions are hard to resolve and take into account when deriving stellar calcium abundances from low- and medium-resolution spectra.
The Ca II triplet lines at 8498, 8542 and 8662 Å are somewhat weaker than the resonance lines, but still fairly strong and not affected by interstellar absorption. They are in a spectral window that is nearly optimal for CCD detector efficiency, and remain visible in a wide variety of spectral types, which has motivated their choice for the Gaia’s Radial Velocity Spectrograph (Cropper et al., 2018). Their use for metallicity estimation in extremely metal-poor stars has been hampered by the fact that the levels connected by the triplet are affected by departures from Local Thermodynamical Equilibrium (LTE), and a reliable description of the effect of inelastic collisions with atomic hydrogen was lacking and is critical. This issue has been addressed in the recent calculations by Belyaev et al. (2018).
Sitnova et al. (2019) have studied in detail the formation of calcium lines in very metal-poor stars, upgrading the model from Mashonkina et al. (2007) including the recent data for collisions with hydrogen atoms for Ca II from Belyaev et al. (2018) as well as those from Belyaev et al. (2017) for Ca I. The main Non-LTE effect is an overpopulation of the lower level and photon losses in the cores of the triplet lines, which strengthens the lines. Sitnova et al. (2019) find that Non-LTE abundance corrections for the triplet depend mainly on line strength.
We have updated our model atoms, including the best possible collisional and radiative data, and put then to the test using existing and new, unpublished, observations of several extremely metal-poor stars. Section 2 reports on the observational material. Section 3 gives an account of the atomic data, model atmospheres, and line formation calculations. The last two sections describe our results (§4) and conclusions (§7).
2 Observations
There are 3 sets of observations used in this work: medium-resolution spectroscopy with ISIS, on the 4-m William Herschel Telescope (WHT), and high-resolution data obtained with HORuS, installed at the 10.4-m Gran Telescopio Canarias (GTC), and UVES, in operation at the Very Large Telescope (VLT).
The observations taken with ISIS span the ranges 3500–5200 Å and 7420–9180 Åand therefore cover both, the Ca II H&K lines and the IR triplet at low resolution. Unfortunately, the Ca II H line (3968 Å) is not resolved in the ISIS observations. HORuS covers approximately the range between 3800 and 6900 Å, missing the infrared triplet, but allowing for a more detailed study of the H&K lines since both lines are resolved at the spectral resolution of this instrument (about 25,000). The resolving power for the UVES observations is higher (R45,000), and the spectral coverage is wider and includes the infrared triplet lines. More details are given below.
2.1 HORuS
G64-12 was observed with HORuS (Tabernero et al., 2020; Allende Prieto, 2021) at GTC111http://research.iac.es/proyecto/abundancias/horus/index.php on March 11 and July 2, 2019, HD122563 on January 13th 2020; and SDSS 134338 was observed on December 3, 2019. Data reduction was carried out with the chain222Available from github.com/callendeprieto/chain, which performs bias and flatfield correction, order tracing, extraction, and wavelength calibration. The observed spectra of the same target were combined in order to increase the signal-to-noise ratio (S/N). These spectra include some Ca I lines as well.
2.2 UVES
The high resolution Ultraviolet and Visual Echelle Spectrograph (Dekker et al., 2000, UVES) spectra of HE 13272326 and HD 122563 were extracted from the ESO archive333Based on data from the ESO Science Archive Facility. Program ID: 077.D-0035(A). Radial velocities for individual spectra were determined by cross correlation with a synthetic template, and after correcting for it, the exposures were co-added to obtain a final spectrum with a S/N of .
2.3 ISIS
Both G6412 and HE 13272326 were previously studied by Aguado et al. (2017), using medium-resolution data taken at the 4.2 m William Herschel Telescope (WHT) with the Intermediate dispersion Spectrograph and Imaging System spectrograph (ISIS, Jorden, 1990). The setup included the R600B and R600R gratings with the default dichroic, allowing us to measure the Ca II H&K resonance doublet and the Ca II infrared triplet. Each target was observed for a total of 3600 s, leading to a S/N of about 300 and 130 at 3940 Å and 8550 Å, respectively.
3 Calculations
We carried out NLTE calculations with the latest version of Tlusty (version 208444link to iac cloud), which can calculate NLTE populations in the trace-element approach using precomputed opacity tables, and Synspec (version 54555Same link.) which generates opacity tables and detailed LTE and NLTE synthetic spectra (Hubeny & Lanz, 2017a, b, c; Hubeny et al., 2021).
The stellar parameters adopted for G64-12 and HE1327-2326 were taken from Aoki et al. (2006). In the case of SDSS134338, the parameters were calculated by some of us (Aguado et al., 2017). The parameters for HD 122563 were extracted from Heiter et al. (2015), where they obtained the parameters via bolometric flux and isochrone calibrations (see also, Amarsi et al., 2016). Effects of the stellar parameters on our NLTE results are presented below.
All the synthetic spectra were calculated in the same fashion: Model atmospheres were computed afresh using the ATLAS9 (Kurucz, 2005) posix port from Sbordone et al. (2007). For each model atmosphere an opacity table was constructed with Synspec, adopting the same abundances as the model atmosphere, but removing the contribution from Ca and Mg. The metallicity indicator we used in the calculations is the usual, [Fe/H]. It is known that in metal poor stars [Ca/Fe]0.4 dex but at [Fe/H] -4.0 dex, the scatter of [Ca/Fe] increase (see e.g., François et al., 2020). The (T, ) pairs in the opacity table match those of the atmosphere, avoiding interpolation. The tables include 100 000 frequency points, sampled logarithmically in wavelength between 900 and 100 000 Å, and were used in Tlusty for the calculation of the NLTE populations for Ca and Mg. Those populations were fed back to Synspec to produce detailed NLTE and LTE spectra to be compared with observations666The model atmospheres could have been computed by Tlusty as well, using an analogous full opacity table, but due to historical reasons [and for a comparison to previous studies] we have opted to stick with the ATLAS code..
| Teff | [Fe/H] | [C/Fe] | [O/Fe] | Parameters source | ||||
|---|---|---|---|---|---|---|---|---|
| Target | Instrument | (K) | (cm/s2) | (dex) | (dex) | (dex) | km/s | |
| G64-12 | ISIS/HORuS | 6390 | 4.4 | -3.2 | 1.0 | 1.0 | 1.6 | Aoki et al. (2006) |
| SDSS134338 | HORuS | 5888 | 4.1 | -3.3 | 1.0 | 1.0 | 1.5 | Aguado et al. (2017) |
| HE1327-2326 | ISIS/UVES | 6180 | 3.7 | -5.6 | 4.0 | 3.0 | 1.7 | Aoki et al. (2006) |
| HD 122563 | UVES | 4587 | 1.6 | -2.6 | 1.0 | 1.0 | 1.0 | Amarsi et al. (2016) |
3.1 Model atom
We adopted the model atom described in Osorio et al. (2019), with updates in the hydrogen interactions with Ca I and II presented by Belyaev et al. (2018). This update includes charge exchange between protons and calcium atoms and between H and singly-ionized calcium.
The model atom has 66 levels for Ca I, 24 for Ca II, and the ground level of Ca III. These figures are different to those presented in Osorio et al. (2019) since, for this run, we merged all fine-structure components into single levels. This saves computing time without degrading accuracy777The calculations in Osorio et al. (2019) and other works showed that NLTE populations of fine-structure components of the same level share nearly identical departures from LTE, and can be treated as a single level..
The radiative data used were the same as in Osorio et al. (2019). The transitions involving fine-structure components were merged accordingly (see Osorio et al., 2019, §2.1). This leads to 912 and 89 bound-bound transitions for Ca I and Ca II, respectively.
The electron collisional data are the same as in Osorio et al. (2019) i.e., Cox (2000); Bely & van Regemorter (1970); Vrinceanu (2005) for electron collisional ionisation, while for electron collisional excitation we adopted Zatsarinny et al. (2019); Seaton (1962) for Ca I and Meléndez et al. (2007) and Burgess et al. (1977) for Ca II.
In Osorio et al. (2019), Hydrogen collisions were considered only for Ca I and neglected for Ca II. For Ca I + H, they used Barklem (2016, 2017) and Kaulakys (1986). In this work we also implemented charge exchange between Ca I and excited H(); hydrogen collisional excitation of Ca II (for transitions involving levels up to 4f 2F∗) and charge exchange with Ca II
These new data come from Belyaev et al. (2018). The importance for this work of these new processes lies on the fact that we focus our study on Ca II features, and the new collisional data directly affect the statistical balance of the levels involved in these transitions.
We also studied Mg and Ca inter-species NLTE effects by simultaneously calculating NLTE populations of Mg and Ca (neutral and singly-ionized), as in Osorio et al. (2020).
4 Results
For the three most metal-poor stars studied in this work, assuming LTE leads to overestimated calcium abundances. NLTE effects strengthen the Ca II lines, making their detection easier at lower calcium abundances. We also found negligible inter-species NLTE effects between calcium and magnesium. Only for the coolest model (SDSS 134338, 5888 K), the population of the highest levels of Ca II and the ground level of Ca III are perturbed by a few percent due to NLTE effects of Mg in the outermost atmospheric layers. Our observations do not include lines of Ca II involving those levels, but inter-species effects with other ions should be studied.
Using the HORuS observations of G64-12 we derived the calcium abundance in this star from three transitions: the Ca II H&K lines and Ca I 4227 (see Table 2). The first thing to notice is the consistency between the Ca I and Ca II NLTE abundances. In the LTE case, the abundances from the Ca II resonance doublet are 0.1. dex greater than the values from the Ca I 4227 transition.
We studied the effects of spectral resolution on the derived LTE abundances and NLTE abundance corrections for G64-12 and SDSS 134338. At the resolving power of HORuS (), the best-fitting NLTE profile for the Ca II K line reproduces more closely the observations than the LTE one. This is no longer the case at the lower resolution of the ISIS data, which are fit equally well in LTE and NLTE. The NLTE correction for this line doubles between HORuS and ISIS resolution: while the NLTE abundances derived from fitting the line profile are the same, the inferred LTE abundance increases between the HORuS and the ISIS best fittings. This is simply the result of lower resolution spreading the NLTE effects affecting the line core over a wider range of frequencies, enhancing the systematic error in the LTE-based abundance.
5 Formation depth and line formation, the case of HD122563.
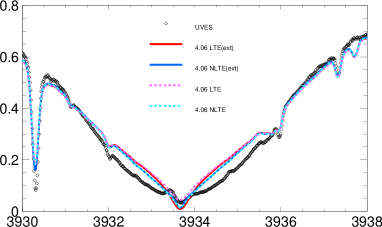
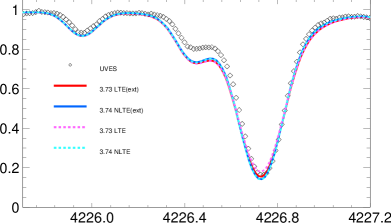
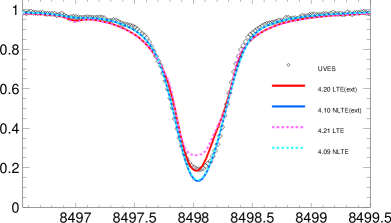
We included HD122563 in the analysis, the most metal rich star in our sample, as illustrated in table 1. We found that the core of Ca-II H&K, Ca-I 4227 Å and the Ca-II IR triplet lines form at layers beyond the limits of our model atmospheres () and special care must be taken for the derived abundances from these lines.
The core of the H&K and the lines form at the top layers of our model atmospheres, but we expect those regions to be less realistic due to NLTE effects on the structure of the atmospheres and temperature inversions which are not accounted for in standard models of late type stellar atmospheres.
The dependency of the calculated line profile on the extension of the model atmosphere used in the calculation is most clear in the Ca I 4227 Å line, shown in the middle panel of fig. 1. The core of this line is formed at in LTE and at in NLTE. The gf value of this particular line comes from Hulpke et al. (1964) with an error of around 3% (0.013 dex for ) which can not explain the difference between the synthetic profile and observations.
NLTE corrections of strong lines computed by comparison of equivalent widths are sensitive to the extent of the stellar atmosphere because the core of the LTE profile of strong lines gets deeper with more extended atmospheres, which does not happen with the NLTE profile.
It is known that the LTE approximation gradually loses validity with atmospheric height until it is no longer useful in the highest layers. Lines with weak wings and with cores that form at very high atmospheric layers (like the Ca I 4227 Å line) should not be used for abundance determination because the region where the core forms is not modelled correctly due to the extension of the model atmosphere and problems in the modelling of the highest layers of cool stellar atmospheres. These problems appear in both, 1D and 3D atmospheric models.
6 Most extreme metal-poor stars
For the other stars in this study, the cores of the Ca II H&K, the Ca I 4227 and the Ca II IR triplet lines do not form at the highest layers and therefore the differences between the LTE and NLTE line profiles can not be attributed to the extent of the model atmospheres.

| line(Å) | Ca II 3934 | Ca II 3968 | Ca I 4227 | Ca II 8497 | Ca II 8542 | Ca II 8662 | ||||||
|---|---|---|---|---|---|---|---|---|---|---|---|---|
| Star | LTE | NLTE | LTE | NLTE | LTE | NLTE | LTE | NLTE | LTE | NLTE | LTE | NLTE |
| HD122563 | 4.06(05) | 4.06(04) | 3.73(05) | 3.74(05) | 4.20(05) | 4.10(04) | ||||||
| G64-12 | 3.64(06) | 3.60(04) | 3.66(09) | 3.57(06) | 3.53(12) | 3.63(09) | 4.08(12) | 3.63(09) | 4.04(10) | 3.61(11) | 4.11(10) | 3.64(12) |
| SDSS 134338 | 3.42(04) | 3.41(03) | 3.35(07) | 3.40(07) | 3.82(08) | 3.38(06) | 3.80(06) | 3.41(06) | 3.85(11) | 3.42(11) | ||
| HE1327-2326 | 1.31(11) | 1.15(09) | 1.32(30) | 1.11(21) | 1.22(24) | 1.16(19) | ||||||
6.1 Ca II H & K lines
The Ca II resonance lines are resolved in the HORuS observations of G64-12. The line profiles are nicely reproduced in NLTE, while in LTE the models miss absorption in the line cores, as illustrated in Figure 2.
The Ca I 4266 line has been reported to give discrepant abundances compared to other Ca I lines when the line is strong (with an equivalenth width 50 mÅ) (Mashonkina et al., 2007, 2017; Sitnova et al., 2019). This disagreement was reported both in LTE and NLTE analyses. We do not find this issue in our analysis of G64-12, where 100 mÅ. We derive a NLTE abundance correction of 0.1 dex, and our NLTE determination is consistent with the values from the other calcium lines, as can seen in Table 2. We believe the reported discrepancy is related to the limited extension of the atmospheric models used by Mashonkina et al. (2007, 2017) and Sitnova et al. (2019). The core of the resonance lines forms in very high layers of the photosphere, and the Kurucz model atmospheres we adopt typically reach optical depths two orders of magnitude smaller than the MARCS model atmospheres used in those previous studies, as discussed by Osorio et al. (2019).
At the resolving power of HORuS, we cannot find signs of contamination from the interstellar medium (ISM) in the spectra of G64-12. For this star the Ca II resonance lines and the IR triplet treated in NLTE lead to consistent calcium abundances, while an LTE analysis of the triplet results in a discrepancy of 0.4 dex.
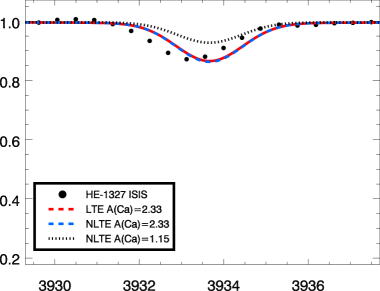
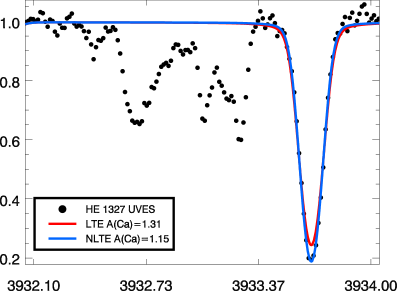
The UVES observations of HE 1327 show at least three lines blue-shifted from the stellar Ca II H and K lines, as illustrated for the K line in the right-hand panel of Fig. 3. The LTE and NLTE best fittings for these lines give an NLTE abundance correction888defined here as A(Ca) = A(Ca)A(Ca)LTE. of dex for this star. At the lower resolution of the ISIS data, the interstellar components are blended with the stellar K line (left-hand panel). Ignoring the ISM contribution would lead to a higher calcium abundance by more than 1.0 dex.
The dotted line in the left-hand panel of Fig. 3 shows the NLTE line profile of the K line using the NLTE abundance derived from the UVES observations (right panel) at the resolution of ISIS. By looking at the UVES observations, one would expect the of the resulting blend at ISIS resolution to have around twice the value of the stellar component alone. If the K line were in the linear region of the curve of growth in this star we expect an increase in abundance of dex, The strength of the line at the resolution of UVES shows that this line is saturated.
6.2 Ca II IR triplet
The IR triplet lines do not suffer from ISM contamination, but the levels involved in the IR triplet transitions (3d 2D - 4p 2Po), the first two excited levels of Ca II, are more suitable to exhibit populations that differ from LTE predictions. There are ISIS observations of these lines for all three stars studied in this work. The LTE and NLTE values are significantly different, and in all cases our derived NLTE abundances exhibit less dispersion than the LTE ones.
The NLTE corrections for the IR triplet in G64-12 and SDSS 134338 are 0.4 dex. The NLTE abundances are consistent with those from other calcium lines. In contrast, the derived LTE abundances for these lines are higher.
There are multiple factors that complicate the abundance determination from the Ca II IR-Triplet lines. Two of those lines (8497, 8662) are on the blue wings of hydrogen lines that are stronger than the calcium lines. The limited signal-to-noise ratio of the ISIS data makes the same two lines lie within the noise level. Thus, for HE 1327, we derived the calcium abundance only from the 8542 Å line. The NLTE abundance correction in this case is small, of about 0.05 dex.
We performed NLTE calculations on an small grid (Teff K ; dex ; dex) and present together with this work abundance corrections for the triplet IR lines (see Table LABEL:tab:acorr).
7 Conclusions
Absorption produced in the interstellar medium (ISM) can lead to systematic errors in the determination of stellar abundances of calcium from the Ca II resonance lines. The Ca II IR triplet offers an alternative way of measuring the metallicity of these stars, free from ISM absorption, but afflicted by significant departures from LTE. Earlier analysis reported inconsistencies between the abundances derived from these transitions, as well as those from neutral calcium lines, and we consider whether recent updates in the data available for the relevant physical processes have improved the situation.
We perform Mg+Ca multi-species NLTE (NLTE-m) calculations, including the most relevant collisional processes. The new H+Ca+ collisional data from Belyaev et al. (2018) do have significant effects on our NLTE calculations. NLTE effects strengthen the core of the Ca II infrared triplet lines, reducing the inferred abundance, and getting it into agreement with the values from the resonance lines, mostly free from NLTE effects, whenever the latter can be isolated from ISM contributions.
We conclude that our state-of-the-art NLTE calculations, similarly to those recently published by Sitnova et al. (2019), are mature enough to standardize the use of the Ca II IR triplet to infer reliably the calcium abundance in very metal-poor stars from medium-resolution observations. Furthermore, we make public all the necessary data and tools for anyone to repeat and extend our calculations to any other star.
Together with this paper, we release scripts, line lists, model atoms, and the versions of Tlusty/Synspec deployed for this work (Hubeny et al., 2021). Additional calculations are possible by running these scripts.
This paper is focused on NLTE, however, it is well-known that 3D effects can be important for the accurate inference of atmospheric parameters and the abundances of some species at low metallicity (Asplund, 2005; Ruchti et al., 2013; Amarsi et al., 2016; Nordlander et al., 2019b). G64-12 in particular was analysed by (Bergemann et al., 2012) in NLTE using MARCS and horizontaly averaged 3D atmospheres, and this star and HD 122563 were studied by (Amarsi et al., 2016) et al. using full 3D NLTE. Serenelli et al. (2013) include a useful discussion of the influence of LTE and NLTE model atmospheres in the Ca near-IR triplet lines at low metallicity.
Our conclusions, together with the actual data and tools to extend our calculations to other stars, have important implications for the discovery of extremely metal-poor stars in the new future. As demonstrated in this letter, the triplet can be reliably used to infer stellar metallicities in these stars when departures from LTE are accounted for. In addition, Nordlander et al. (2017) have shown that 3D effects are not likely to change the calcium abundances derived in 1D from Ca II lines in extremely metal-poor stars by more than 0.1 dex.
Several massive spectroscopic surveys of the Milky Way covering the Ca II infrared lines are underway or close to start (SDSS, LAMOST, DESI, WEAVE, PFS, …). Next year the 3rd Gaia Data Relase will make public millions of spectra covering the Ca II IR triplet. The tools presented in this paper can be use to mine with confidence these data for identifying new extremely metal-poor stars.
| Teff | logg | Fe/H | 8498Å | 8542Å | 8662Å |
|---|---|---|---|---|---|
| 4500 | 1.0 | -2.5 | -0.171 | -0.224 | -0.175 |
| 4500 | 1.0 | -3.0 | -0.158 | -0.122 | -0.135 |
| 4500 | 1.0 | -3.5 | -0.152 | -0.114 | -0.140 |
| 4500 | 1.0 | -4.0 | -0.222 | -0.191 | -0.213 |
| 4500 | 1.0 | -4.5 | -0.276 | -0.298 | -0.311 |
| 4500 | 1.0 | -5.0 | -0.349 | -0.430 | -0.424 |
| 4500 | 1.0 | -5.5 | -0.412 | -0.554 | -0.526 |
| 4500 | 1.0 | -6.0 | -0.383 | -0.609 | -0.575 |
| 4500 | 2.0 | -2.5 | -0.195 | -0.290 | -0.222 |
| 4500 | 2.0 | -3.0 | -0.155 | -0.143 | -0.146 |
| 4500 | 2.0 | -3.5 | -0.112 | -0.083 | -0.100 |
| 4500 | 2.0 | -4.0 | -0.202 | -0.159 | -0.183 |
| 4500 | 2.0 | -4.5 | -0.246 | -0.247 | -0.262 |
| 4500 | 2.0 | -5.0 | -0.291 | -0.353 | -0.349 |
| 4500 | 2.0 | -5.5 | -0.295 | -0.454 | -0.436 |
| 4500 | 2.0 | -6.0 | -0.283 | -0.499 | -0.454 |
| 4500 | 3.0 | -2.5 | -0.208 | -0.423 | -0.293 |
| 4500 | 3.0 | -3.0 | -0.161 | -0.201 | -0.180 |
| 4500 | 3.0 | -3.5 | -0.160 | -0.148 | -0.157 |
| 4500 | 3.0 | -4.0 | -0.188 | -0.168 | -0.180 |
| 4500 | 3.0 | -4.5 | -0.218 | -0.226 | -0.233 |
| 4500 | 3.0 | -5.0 | -0.223 | -0.297 | -0.293 |
| 4500 | 3.0 | -5.5 | -0.220 | -0.354 | -0.327 |
| 4500 | 3.0 | -6.0 | -0.222 | -0.323 | -0.278 |
| 4500 | 4.0 | -2.5 | -0.232 | -0.546 | -0.371 |
| 4500 | 4.0 | -3.0 | -0.178 | -0.281 | -0.234 |
| 5000 | 1.0 | -2.5 | -0.272 | -0.248 | -0.244 |
| 5000 | 1.0 | -3.0 | -0.280 | -0.214 | -0.253 |
| 5000 | 1.0 | -3.5 | -0.283 | -0.255 | -0.292 |
| 5000 | 1.0 | -4.0 | -0.293 | -0.337 | -0.351 |
| 5000 | 1.0 | -4.5 | -0.287 | -0.427 | -0.418 |
| 5000 | 1.0 | -5.0 | -0.348 | -0.560 | -0.522 |
| 5000 | 1.0 | -5.5 | -0.336 | -0.624 | -0.571 |
| 5000 | 1.0 | -6.0 | -0.276 | -0.610 | -0.537 |
| 5000 | 2.0 | -2.5 | -0.310 | -0.294 | -0.294 |
| 5000 | 2.0 | -3.0 | -0.318 | -0.261 | -0.303 |
| 5000 | 2.0 | -3.5 | -0.329 | -0.296 | -0.331 |
| 5000 | 2.0 | -4.0 | -0.317 | -0.364 | -0.382 |
| 5000 | 2.0 | -4.5 | -0.302 | -0.458 | -0.444 |
| 5000 | 2.0 | -5.0 | -0.271 | -0.523 | -0.479 |
| 5000 | 2.0 | -5.5 | -0.220 | -0.544 | -0.481 |
| 5000 | 2.0 | -6.0 | -0.194 | -0.456 | -0.352 |
| 5000 | 3.0 | -2.5 | -0.283 | -0.344 | -0.304 |
| 5000 | 3.0 | -3.0 | -0.288 | -0.259 | -0.279 |
| 5000 | 3.0 | -3.5 | -0.297 | -0.260 | -0.287 |
| 5000 | 3.0 | -4.0 | -0.280 | -0.303 | -0.318 |
| 5000 | 3.0 | -4.5 | -0.227 | -0.361 | -0.349 |
| 5000 | 3.0 | -5.0 | -0.154 | -0.395 | -0.357 |
| 5000 | 3.0 | -5.5 | -0.136 | -0.366 | -0.285 |
| 5000 | 3.0 | -6.0 | -0.131 | -0.233 | -0.179 |
| 5000 | 4.0 | -2.5 | -0.240 | -0.422 | -0.314 |
| 5000 | 4.0 | -3.0 | -0.228 | -0.252 | -0.243 |
| 5000 | 4.0 | -3.5 | -0.223 | -0.220 | -0.228 |
| 5000 | 4.0 | -4.0 | -0.047 | -0.080 | -0.070 |
| 5000 | 4.0 | -4.5 | -0.127 | -0.254 | -0.239 |
| 5000 | 4.0 | -5.0 | -0.096 | -0.242 | -0.196 |
| 5000 | 4.0 | -5.5 | -0.089 | -0.157 | -0.121 |
| 5000 | 4.0 | -6.0 | -0.083 | -0.106 | -0.091 |
| 5500 | 1.0 | -2.5 | -0.302 | -0.244 | -0.268 |
| 5500 | 1.0 | -3.0 | -0.310 | -0.263 | -0.305 |
| 5500 | 1.0 | -3.5 | -0.312 | -0.332 | -0.360 |
| 5500 | 1.0 | -4.0 | -0.295 | -0.413 | -0.418 |
| 5500 | 1.0 | -4.5 | -0.294 | -0.515 | -0.490 |
| 5500 | 1.0 | -5.0 | -0.301 | -0.600 | -0.544 |
| 5500 | 1.0 | -5.5 | -0.255 | -0.628 | -0.557 |
| 5500 | 1.0 | -6.0 | -0.196 | -0.516 | -0.407 |
| 5500 | 2.0 | -2.5 | -0.363 | -0.302 | -0.341 |
| 5500 | 2.0 | -3.0 | -0.377 | -0.342 | -0.390 |
| 5500 | 2.0 | -3.5 | -0.375 | -0.414 | -0.440 |
| 5500 | 2.0 | -4.0 | -0.333 | -0.491 | -0.492 |
| 5500 | 2.0 | -4.5 | -0.292 | -0.565 | -0.521 |
| 5500 | 2.0 | -5.0 | -0.230 | -0.587 | -0.521 |
| 5500 | 2.0 | -5.5 | -0.179 | -0.536 | -0.438 |
| 5500 | 2.0 | -6.0 | -0.140 | -0.317 | -0.231 |
| 5500 | 3.0 | -2.5 | -0.350 | -0.318 | -0.345 |
| 5500 | 3.0 | -3.0 | -0.383 | -0.345 | -0.383 |
| 5500 | 3.0 | -3.5 | -0.380 | -0.404 | -0.430 |
| 5500 | 3.0 | -4.0 | -0.329 | -0.473 | -0.471 |
| 5500 | 3.0 | -4.5 | -0.222 | -0.505 | -0.463 |
| 5500 | 3.0 | -5.0 | -0.143 | -0.481 | -0.407 |
| 5500 | 3.0 | -5.5 | -0.118 | -0.337 | -0.236 |
| 5500 | 3.0 | -6.0 | -0.093 | -0.157 | -0.123 |
| 5500 | 4.0 | -2.5 | -0.279 | -0.306 | -0.296 |
| 5500 | 4.0 | -3.0 | -0.301 | -0.287 | -0.303 |
| 5500 | 4.0 | -3.5 | -0.294 | -0.311 | -0.326 |
| 5500 | 4.0 | -4.0 | -0.226 | -0.346 | -0.340 |
| 5500 | 4.0 | -4.5 | -0.113 | -0.346 | -0.305 |
| 5500 | 4.0 | -5.0 | -0.075 | -0.266 | -0.189 |
| 5500 | 4.0 | -5.5 | -0.056 | -0.119 | -0.085 |
| 5500 | 4.0 | -6.0 | -0.034 | -0.055 | -0.041 |
| 6000 | 2.0 | -2.5 | -0.386 | -0.340 | -0.395 |
| 6000 | 2.0 | -3.0 | -0.397 | -0.419 | -0.466 |
| 6000 | 2.0 | -3.5 | -0.370 | -0.502 | -0.523 |
| 6000 | 2.0 | -4.0 | -0.320 | -0.577 | -0.561 |
| 6000 | 2.0 | -4.5 | -0.265 | -0.627 | -0.568 |
| 6000 | 2.0 | -5.0 | -0.201 | -0.624 | -0.548 |
| 6000 | 2.0 | -5.5 | -0.142 | -0.455 | -0.342 |
| 6000 | 2.0 | -6.0 | -0.098 | -0.200 | -0.154 |
| 6000 | 3.0 | -2.5 | -0.398 | -0.364 | -0.417 |
| 6000 | 3.0 | -3.0 | -0.419 | -0.442 | -0.481 |
| 6000 | 3.0 | -3.5 | -0.383 | -0.525 | -0.544 |
| 6000 | 3.0 | -4.0 | -0.312 | -0.592 | -0.561 |
| 6000 | 3.0 | -4.5 | -0.199 | -0.589 | -0.521 |
| 6000 | 3.0 | -5.0 | -0.143 | -0.514 | -0.407 |
| 6000 | 3.0 | -5.5 | -0.100 | -0.253 | -0.179 |
| 6000 | 3.0 | -6.0 | -0.061 | -0.101 | -0.083 |
| 6000 | 4.0 | -2.5 | -0.321 | -0.312 | -0.335 |
| 6000 | 4.0 | -3.0 | -0.342 | -0.362 | -0.385 |
| 6000 | 4.0 | -3.5 | -0.316 | -0.429 | -0.435 |
| 6000 | 4.0 | -4.0 | -0.216 | -0.470 | -0.438 |
| 6000 | 4.0 | -4.5 | -0.117 | -0.432 | -0.354 |
| 6000 | 4.0 | -5.0 | -0.088 | -0.283 | -0.192 |
| 6000 | 4.0 | -5.5 | -0.056 | -0.107 | -0.080 |
| 6000 | 4.0 | -6.0 | -0.016 | -0.033 | -0.022 |
| 6500 | 3.0 | -2.5 | -0.407 | -0.430 | -0.494 |
| 6500 | 3.0 | -3.0 | -0.395 | -0.524 | -0.570 |
| 6500 | 3.0 | -3.5 | -0.345 | -0.609 | -0.618 |
| 6500 | 3.0 | -4.0 | -0.271 | -0.658 | -0.612 |
| 6500 | 3.0 | -4.5 | -0.178 | -0.630 | -0.554 |
| 6500 | 3.0 | -5.0 | -0.126 | -0.464 | -0.346 |
| 6500 | 3.0 | -5.5 | -0.075 | -0.170 | -0.134 |
| 6500 | 3.0 | -6.0 | -0.022 | -0.049 | -0.041 |
| 6500 | 4.0 | -2.5 | -0.333 | -0.362 | -0.394 |
| 6500 | 4.0 | -3.0 | -0.327 | -0.442 | -0.464 |
| 6500 | 4.0 | -3.5 | -0.279 | -0.520 | -0.504 |
| 6500 | 4.0 | -4.0 | -0.178 | -0.539 | -0.479 |
| 6500 | 4.0 | -4.5 | -0.062 | -0.263 | -0.190 |
| 6500 | 4.0 | -5.0 | -0.089 | -0.243 | -0.169 |
| 6500 | 4.0 | -5.5 | -0.042 | -0.071 | -0.058 |
| 6500 | 4.0 | -6.0 | 0.010 | -0.004 | 0.005 |
| 7000 | 4.0 | -2.5 | -0.312 | -0.424 | -0.465 |
| 7000 | 4.0 | -3.0 | -0.282 | -0.509 | -0.523 |
| 7000 | 4.0 | -3.5 | -0.218 | -0.565 | -0.527 |
| 7000 | 4.0 | -4.0 | -0.112 | -0.462 | -0.396 |
| 7000 | 4.0 | -4.5 | -0.100 | -0.398 | -0.288 |
| 7000 | 4.0 | -5.0 | -0.073 | -0.176 | -0.136 |
| 7000 | 4.0 | -5.5 | -0.028 | -0.057 | -0.050 |
| 7000 | 4.0 | -6.0 | 0.065 | 0.053 | 0.062 |
References
- Aguado et al. (2016) Aguado, D. S., Allende Prieto, C., González Hernández, J. I., et al. 2016, A&A, 593, A10
- Aguado et al. (2018a) Aguado, D. S., Allende Prieto, C., González Hernández, J. I., & Rebolo, R. 2018a, ApJ, 854, L34
- Aguado et al. (2017) Aguado, D. S., González Hernández, J. I., Allende Prieto, C., & Rebolo, R. 2017, A&A, 605, A40
- Aguado et al. (2018b) —. 2018b, ApJL, 852 L20, doi:10.1086/498131
- Allende Prieto (2021) Allende Prieto, C. 2021, Nature Astronomy, 5, 105
- Amarsi et al. (2016) Amarsi, A. M., Lind, K., Asplund, M., Barklem, P. S., & Collet, R. 2016, MNRAS, 463, 1518
- Aoki et al. (2006) Aoki, W., Frebel, A., Christlieb, N., et al. 2006, ApJ, 639, 897
- Asplund (2005) Asplund, M. 2005, ARA&A, 43, 481
- Barklem (2016) Barklem, P. S. 2016, Phys. Rev. A, 93, 042705
- Barklem (2017) —. 2017, Phys. Rev. A, 95, 069906
- Beers et al. (1985) Beers, T. C., Preston, G. W., & Shectman, S. A. 1985, AJ, 90, 2089
- Bely & van Regemorter (1970) Bely, O., & van Regemorter, H. 1970, Annu. Rev. Astro. Astrophys., 8, 329
- Belyaev et al. (2018) Belyaev, A. K., Voronov, Y. V., & Gadéa, F. X. 2018, ApJ, 867, 87
- Belyaev et al. (2017) Belyaev, A. K., Voronov, Y. V., Yakovleva, S. A., et al. 2017, ApJ, 851, 59
- Bergemann et al. (2012) Bergemann, M., Lind, K., Collet, R., Magic, Z., & Asplund, M. 2012, MNRAS, 427, 27
- Bonifacio et al. (2015) Bonifacio, P., Caffau, E., Spite, M., et al. 2015, A&A, 579, A28
- Bromm & Loeb (2003) Bromm, V., & Loeb, A. 2003, Nature, 425, 812
- Burgess et al. (1977) Burgess, A., Summers, H. P., McWhirter, R. W. P., & Cochrane, D. M. 1977, Monthly Notices of the Royal Astronomical Society, 179, 275
- Caffau et al. (2013) Caffau, E., Bonifacio, P., Sbordone, L., et al. 2013, A&A, 560, A71
- Chiaki et al. (2017) Chiaki, G., Tominaga, N., & Nozawa, T. 2017, MNRAS, 472, L115
- Christlieb et al. (2004) Christlieb, N., Gustafsson, B., Korn, A. J., et al. 2004, ApJ, 603, 708
- Cox (2000) Cox, A. N. 2000, Allen’s astrophysical quantities (Springer)
- Cropper et al. (2018) Cropper, M., Katz, D., Sartoretti, P., et al. 2018, A&A, 616, A5
- Dekker et al. (2000) Dekker, H., D’Odorico, S., Kaufer, A., Delabre, B., & Kotzlowski, H. 2000, in Proc. SPIE, Vol. 4008, Optical and IR Telescope Instrumentation and Detectors, ed. M. Iye & A. F. Moorwood, 534–545
- François et al. (2020) François, P., Wanajo, S., Caffau, E., et al. 2020, A&A, 642, A25
- Frebel et al. (2005) Frebel, A., Aoki, W., Christlieb, N., et al. 2005, Nature, 434, 871
- García Pérez et al. (2006) García Pérez, A. E., Asplund, M., Primas, F., Nissen, P. E., & Gustafsson, B. 2006, A&A, 451, 621
- Hartwig et al. (2018) Hartwig, T., Yoshida, N., Magg, M., et al. 2018, Monthly Notices of the Royal Astronomical Society, 478, 1795. https://doi.org/10.1093/mnras/sty1176
- Heiter et al. (2015) Heiter, U., Jofré, P., Gustafsson, B., et al. 2015, A&A, 582, A49
- Hubeny et al. (2021) Hubeny, I., Allende-Prieto, C., Osorio, Y., & Lanz, T. 2021, arXiv e-prints, arXiv:2102.01937
- Hubeny & Lanz (2017a) Hubeny, I., & Lanz, T. 2017a, arXiv e-prints, arXiv:1706.01859
- Hubeny & Lanz (2017b) —. 2017b, arXiv e-prints, arXiv:1706.01935
- Hubeny & Lanz (2017c) —. 2017c, arXiv e-prints, arXiv:1706.01937
- Hulpke et al. (1964) Hulpke, E., Paul, E., & Paul, W. 1964, Zeitschrift für Physik, 177, 257. https://doi.org/10.1007/BF01375498
- Ishigaki et al. (2014) Ishigaki, M. N., Tominaga, N., Kobayashi, C., & Nomoto, K. 2014, ApJ, 792, L32
- Jorden (1990) Jorden, P. R. 1990, in Society of Photo-Optical Instrumentation Engineers (SPIE) Conference Series, Vol. 1235, Instrumentation in Astronomy VII, ed. D. L. Crawford, 790–798
- Kaulakys (1986) Kaulakys, B. P. 1986, Journal of Experimental and Theoretical Physics, 91, 391
- Keller et al. (2014) Keller, S. C., Bessell, M. S., Frebel, A., et al. 2014, Nature, 506, 463
- Komiya et al. (2016) Komiya, Y., Suda, T., & Fujimoto, M. Y. 2016, ApJ, 820, 59
- Kurucz (2005) Kurucz, R. L. 2005, Memorie della Societa Astronomica Italiana Supplementi, 8, 14
- Magg et al. (2018) Magg, M., Hartwig, T., Agarwal, B., et al. 2018, MNRAS, 473, 5308
- Mashonkina et al. (2007) Mashonkina, L., Korn, A. J., & Przybilla, N. 2007, A&A, 461, 261
- Mashonkina et al. (2017) Mashonkina, L., Sitnova, T., & Belyaev, A. K. 2017, A&A, 605, A53
- Meléndez et al. (2007) Meléndez, M., Bautista, M. A., & Badnell, N. R. 2007, A&A, 469, 1203
- Nordlander et al. (2017) Nordlander, T., Amarsi, A. M., Lind, K., et al. 2017, A&A, 597, A6
- Nordlander et al. (2019a) Nordlander, T., Bessell, M. S., Da Costa, G. S., et al. 2019a, MNRAS, 488, L109
- Nordlander et al. (2019b) —. 2019b, MNRAS, 488, L109
- Osorio et al. (2020) Osorio, Y., Allende Prieto, C., Hubeny, I., Mészáros, S., & Shetrone, M. 2020, A&A, 637, A80
- Osorio et al. (2019) Osorio, Y., Lind, K., Barklem, P., Allende-Prieto, C., & Zatsarinny, O. 2019, A&A, 623, 17
- Ruchti et al. (2013) Ruchti, G. R., Bergemann, M., Serenelli, A., Casagrande, L., & Lind, K. 2013, MNRAS, 429, 126
- Sbordone et al. (2007) Sbordone, L., Bonifacio, P., & Castelli, F. 2007, in Convection in Astrophysics, ed. F. Kupka, I. Roxburgh, & K. L. Chan, Vol. 239, 71–73
- Seaton (1962) Seaton, M. J. 1962, Atomic and Molecular Processes. Edited by D. R. Bates. Library of Congress Catalog Card Number 62-13122. Published by Academic Press, 375
- Serenelli et al. (2013) Serenelli, A. M., Bergemann, M., Ruchti, G., & Casagrande, L. 2013, MNRAS, 429, 3645
- Sitnova et al. (2019) Sitnova, T. M., Mashonkina, L. I., Ezzeddine, R., & Frebel, A. 2019, MNRAS, 485, 3527
- Stacy et al. (2016) Stacy, A., Bromm, V., & Lee, A. T. 2016, MNRAS, 462, 1307
- Tabernero et al. (2020) Tabernero, H. M., Allende Prieto, C., Zapatero Osorio, M. R., et al. 2020, MNRAS, 498, 4222
- Umeda & Nomoto (2005) Umeda, H., & Nomoto, K. 2005, ApJ, 619, 427
- Vrinceanu (2005) Vrinceanu, D. 2005, Phys. Rev. A, 72
- Zatsarinny et al. (2019) Zatsarinny, O., Parker, H., & Bartschat, K. 2019, Phys. Rev. A, 99, 012706. https://link.aps.org/doi/10.1103/PhysRevA.99.012706