- discovery of very high obscuration in the candidate Supergiant Fast X-ray Transient AX J1714.13912††thanks: Based on observations (ObsID 0804300901) obtained with XMM-Newton, an ESA science mission with instruments and contributions directly funded by ESA Member States and NASA.
Abstract
We have analysed an archival - EPIC observation that serendipitously covered the sky position of a variable X-ray source AX J1714.13912, previously suggested to be a Supergiant Fast X-ray Transient (SFXT). During the - observation the source is variable on a timescale of hundred seconds and shows two luminosity states, with a flaring activity followed by unflared emission, with a variability amplitude of a factor of about 50. We have discovered an intense iron emission line with a centroid energy of 6.4 keV in the power law-like spectrum, modified by a large absorption (NH1024 cm-2), never observed before from this source. This X-ray spectrum is unusual for an SFXT, but resembles the so-called “highly obscured sources”, high mass X-ray binaries (HMXBs) hosting an evolved B[e] supergiant companion (sgB[e]). This might suggest that AX J1714.13912 is a new member of this rare type of HMXBs, which includes IGR J16318-4848 and CI Camelopardalis. Increasing this small population of sources would be remarkable, as they represent an interesting short transition evolutionary stage in the evolution of massive binaries. Nevertheless, AX J1714.13912 appears to share X-ray properties of both kinds of HMXBs (SFXT vs sgB[e] HMXB). Therefore, further investigations of the companion star are needed to disentangle the two hypothesis.
keywords:
X-rays: binaries – X-rays: individual: AX J1714.139121 Introduction
One of the legacies of every X-ray mission is the production of source catalogues. They always include a significant fraction of unidentified sources, whose nature remains unknown or controversial for several years, awaiting further investigations. This is the case of AX J1714.13912, a source discovered during ASCA observations (performed in 1996) of the Galactic supernova remnant (SNR) RX J1713.73946 (Uchiyama et al., 2002), a shell-like SNR site of production of synchrotron X-ray emission (Koyama et al., 1997; Slane et al., 1999). AX J1714.13912 is located beyond the northern rim of the shell, and at first it was suggested to be associated with a molecular cloud (Uchiyama et al., 2002). The ASCA spectrum is well modeled by a hard powerlaw with a photon index =0.98 and an absorbing column density NH= 1022 cm-2. This absorption was very similar to the one measured from other regions of the SNR, consistent with the total Galactic one in the source direction (NH=1.51022 cm-2; HI4PI Collaboration et al. 2016). The absorption-corrected flux was 4 erg cm-2 s-1(1-10 keV). Given the spatial overlap of the ASCA source with the cloud, Uchiyama et al. (2002) interpreted the flat X-ray spectrum as produced by non-thermal bremsstrahlung from particles accelerated in the SNR, then impacting the molecular gas as a target. This hypothesis assumes the physical proximity of the SNR with the molecular cloud, and that AX J1714.13912 is an extended X-ray source.
An observation performed in 2015 with the telescope proved the point-like character of AX J1714.13912 (named CXOU J171343.9391205, Miceli & Bamba 2018), excluding the association with the molecular cloud. A relatively low X-ray flux was observed, 7(10-14 erg cm-2 s-1(2-10 keV; corrected for the absorption). Miceli & Bamba (2018) reported also on a Suzaku observation of the field containing AX J1714.13912 performed in 2011, where the source showed a variable X-ray emission, with a short (2 ks) hard X-ray flare. The separate spectroscopy of the quiescent emission and the flare resulted into a quite high absorption (NH in the range 3.6-12.2 1022 cm-2 for emission in quiescence, and NH=6111022 cm-2 during the flare) and flat power law spectra (photon index, , in the range 0.6-2.3 during quiescence, and ranging from 0.7 to 1.6 during the flare, at 90% confidence level). The observed (not corrected for the absorption) fluxes (2-10 keV) were F=610-13 erg cm-2 s-1 and F=3.610-12 erg cm-2 s-1 for the quiescent and flare emission, respectively.
On this basis, Miceli & Bamba (2018) proposed that AX J1714.13912 is a high mass X-ray binary (HMXB) belonging to the sub-class of the Supergiant Fast X-ray Transients (SFXTs; Sguera et al. 2005, 2006; Negueruela et al. 2006). The positional overlap with the near-infrared (NIR) point source 2MASS 17134391-3912055 further supported the identification with a massive X-ray binary (Miceli & Bamba, 2018).
2 Observations and Data Analysis
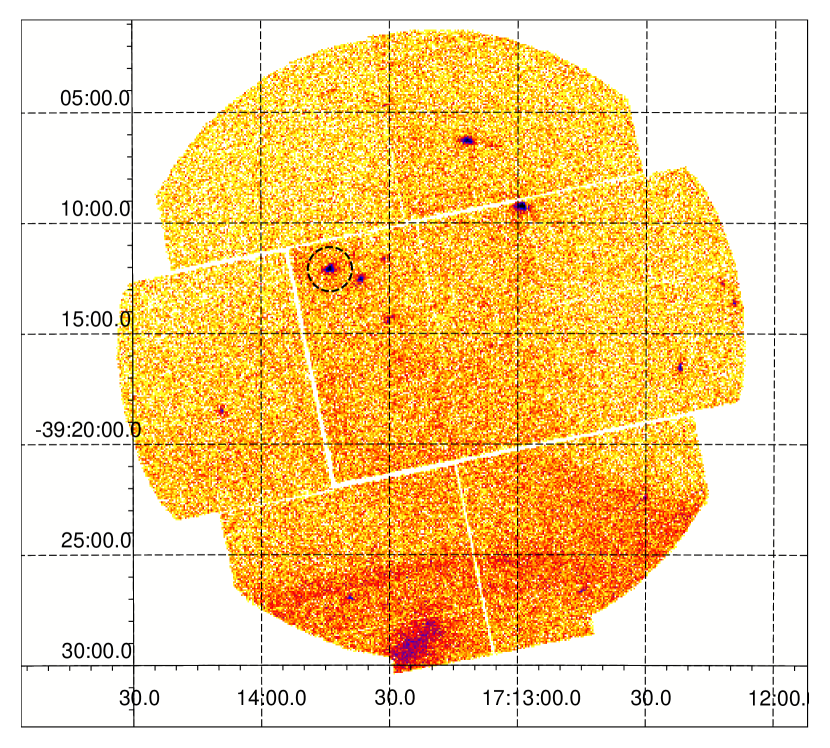
The sky position of AX J1714.13912 was serendipitously covered by - (Jansen et al., 2001) during an observation performed in 2017, from 29 August (at 15:28, UTC) to 30 August (at 04:08), with an on-time exposure of 41.6 ks (pn) and 45.5 ks (MOS). The observation (Obs.ID 0804300901) was targeted at the northern region of the SNR RX J1713.73946 and imaged AX J1714.13912 at an offaxis angle of about 5 arcmin. In Fig. 1 we show the MOS2 field-of-view (FOV), where AX J1714.13912 is marked by a dashed black circle.
The three European Photon Imaging Cameras (EPIC) (Strüder et al., 2001; Turner et al., 2001) operated with the medium filter, with the pn in full frame extended window, and the two MOS in full frame mode. EPIC data were reprocessed using the version 18 of the - Science Analysis Software (SAS), with standard procedures. The tools rmfgen and arfgen, available in the SAS, were used to generate the response and ancillary matrices, respectively. High background levels were filtered-out before extracting EPIC spectra. Light curves and spectra were extracted from circles centered on the source emission, adopting a 30′′ radius, selecting patterns from 0 to 4 (EPIC pn), and from 0 to 12 (MOS). Similar size regions, offset from the source position but lying on the same CCD, were used to extract background spectra. Source spectra from the pn, MOS1 and MOS2 were simultaneously fitted using xspec (version 12.10.1; Arnaud 1996) in the energy range 0.3-12 keV, allowing for free cross-calibration constants, to take into account calibration uncertainties. All fluxes were estimated in the 1-10 keV range. The models TBabs and TBpcf were adopted to account for the absorbing column density along the line of sight, assuming the photoelectric absorption cross sections of Verner et al. (1996) and the interstellar abundances of Wilms et al. (2000). The spectra were rebinned to have at least 20 counts per bin, to apply the statistics. All uncertanties are computed at 90% confidence level, for one interesting parameter. The uncertainty on the X-ray fluxes have been calculated using cflux in xspec.
3 Results
3.1 Temporal analysis
The EPIC source light curve is reported in Fig. 2, before and after filtering for high background levels. The source displays a significant variability on timescales of a few hundred seconds, with a dynamic range of 50. Although formally the energy range is 0.3-12 keV, we note that most of the source counts lies in the 2-12 keV energy band. We have identified two source states: a high state (or “flare”, hereafter) and a low one, named “quiescence”, indicated in the lowest panel in Fig. 2.
We searched the data for periodic signals by means of Fourier transforms and Rayleigh periodograms, but we did not find any statistically significant signal. The 3 upper limit on the pulsed fraction, computed by extensive Monte Carlo simulations, is 25% for a sinusoidal signal between 0.4 and 5.4 s, using only the pn data (2-12 keV), and 20% between 5.4 and 1000 s, using also the data from the MOS cameras. Above 1000 s, the strong red noise does not allow us to set meaningful limits.

3.2 Spectroscopy
We performed the spectroscopic analysis during the flare and in quiescence separately, extracting two sets of EPIC spectra, covering the time intervals shown in Fig. 2 (bottom panel). The EPIC spectra extracted during the flare are highly absorbed and with large positive residuals around 6.4 keV, very evident when fitting the spectra with a simple, absorbed power law model (Fig. 3), resulting in a reduced =1.928 (for 117 degrees of freedom, dof; see Table 1 for the spectral parameters). The addition of a narrow Gaussian line accounted for these residuals (/dof=1.445/114; Table 1). However, a mild soft excess remained below 4 keV. This suggested to consider an additional absorption model, a partial covering fraction absorption (TBpcf in xspec), where the additional column density is applied to a fraction of the power law emission. This final model provides a good description of the flare spectrum (Model 3 in Table 1). The counts spectra and the residuals to this best fit model are shown in Fig. 3.
We note that the model TBpcf resulted into an almost complete covering (98%) of the X-ray emission, leading to an absorption of 1.51024 cm-2 during the flare, considering both absorbing components (TBabs and TBpcf). This is 2 dex larger than the Galactic absorption (NH=1.51022 cm-2; HI4PI Collaboration et al. 2016). The centroid of the emission line is very well constrained in a narrow range around 6.4 keV in both states, clearly indicative of fluorescence from neutral iron.
The Fe Kα line is produced when a direct hard X-ray radiation illuminates neutral matter around the source. This reprocessing results into a fluorescent iron line emission together with a Compton component. The final spectrum is a composition of a reflection component together with the direct (power law) X-ray emission. However, adopting reflection models like pexrav (Magdziarz & Zdziarski, 1995) and pexmon (Nandra et al., 2007) in xspec did not yield better fits. We note that disentangling the incident and the reflected component is made difficult due to the limited energy band and the low counting statistics. This results into a quite hard power law slope measured in the total spectrum below 10 keV, also because of a reflected hump (Fabian et al., 1990) that is expected beyond the - energy band.
The spectrum in quiescence shows a prominent positive excess around 6.4 keV as well, when fitted with a simple absorbed power law (/dof=2.85/6). The addition of a Gaussian line to the absorbed power law model resulted in a good fit to the data, with no need to adopt further partial covering absorption (Fig. 4). During the fit, a narrow iron emission line is assumed, fixing its width to zero. The best fit parameters are listed in Table 1 (last column).
| Parameters | Flare | Quiescence | ||
|---|---|---|---|---|
| Model 1 | Model 2 | Model 3 | ||
| NH (1022 cm-2) | ||||
| —– Partial covering fraction absorption ——- | ||||
| NHTBpcf (1022 cm-2) | ||||
| covering fraction | ||||
| —– POWER LAW——- | ||||
| norm | ||||
| —– GAUSSIAN LINE——- | ||||
| Eline (keV) | ||||
| (keV) | 0.10 | 0.08 | 0.0 (fixed) | |
| norm (photons cm-2 s-1) | ||||
| EW (eV) | ||||
| F1-10keV (erg cm-2 s-1) | 9.2 | 9.3 | 9.4 | 4.3 |
| UF1-10keV (erg cm-2 s-1) | 5.4 | 3.4 | 6.2 | 4.4 |
| L1-10keV (erg s-1) | 6.5 d | 4.1 d | 7.4 d | 5.3 d |
| /dof | 1.928/117 | 1.445/114 | 1.076/112 | 0.854/4 |


4 Discussion
We have reported on the discovery of a prominent FeK line and a large intrinsic absorption (NH=1.51024 cm-2) from AX J1714.13912 during an - observation performed in 2017. The source shows a variable X-ray emission with a brighter state (flare) at the beginning of the observation, followed by a fainter state (quiescence). Spectra extracted from both states are well described by hard power law models with similar slopes, within the uncertainties. The X-ray emission is significantly more absorbed during the flare than during the following fainter state, suggesting a variability in the circumstellar absorbing matter on short timescale, correlated with the X-ray flux.
The FeK is detected in both states, with a larger equivalent width during the quiescent emission. This might suggest that the unflared state is due to the eclipse by the companion star: the less absorbed X-ray spectrum can be due to scattering into the line of sight by the stellar wind matter of the central (eclipsed) X-ray radiation (e.g. Haberl 1991). However, the flux of the iron line is significantly different in the two states and correlates with the continuum flux, disfavouring this hypothesis, and suggests an intrinsic variability. Moreover, this correlation indicates a close proximity of the reprocessing matter to the compact object.
The source is also variable on long timescales of years: previous X-ray observations (ASCA in 1996, Suzaku in 2011, in 2015) caught different X-ray fluxes (Fig. 5) and a significantly lower absorbing column density (NH in the range 1022-1023 cm-2) than during the - observation. This indicates a long-term changing aspect of the absorbing matter local to the source, possibly with an inhomogeneous distribution or a variability due to the orbital motion in a binary system.
In light of the new - results, we discuss the possible source nature in the following sub-sections.

4.1 Is AX J1714.13912 an active galactic nucleus?
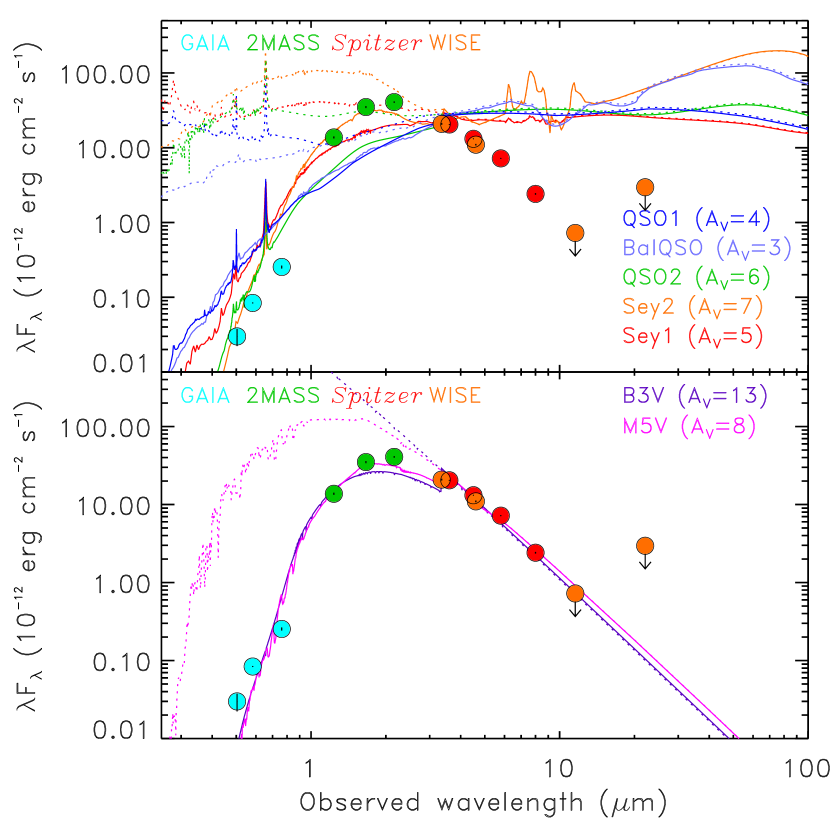
The point-like appearance, the large intrinsic absorption and the presence of an FeK line in AXJ 1714.13912 are reminiscent of the X-ray properties of obscured active galactic nuclei (AGN; see e.g., Guainazzi et al., 2005). To investigate such a hypothesis we examine the broad-band spectral energy distribution (SED) of the optical-infrared (IR) counterpart to AXJ 1714.13912. To build the broadband SED we collected optical data from GAIA DR3 (Gaia Collaboration et al., 2016, 2021), near-IR data from 2MASS (Skrutskie et al., 2006), and mid-IR data from WISE (Wright et al., 2010) and (Werner et al., 2004; Benjamin et al., 2003). The optical-IR SED, shown in Fig. 6, peaks at 2m and decreases steadily towards longer wavelengths up to 10m. Such a behaviour is inconsistent with what is observed in AGN, whose SEDs typically rise long-ward of 1–5m (Polletta et al., 2007; Hickox et al., 2017) due to the emission from AGN-heated hot dust. Therefore, the broad-band SED rules out the AGN hypothesis. The mid-IR ( = 3–10m) SED of AXJ 1714.13912 is instead consistent with stellar radiation. The full optical-IR SED of AXJ 1714.13912 can be reproduced with various reddened stellar templates (Kurucz, 1993). We apply a standard Galactic reddening law (Cardelli et al., 1989). The amount of required optical extinction depends on the stellar type, for example an AV of 13 mag, corresponding to N2.31022 cm-2, is required for a B-type star, and an AV of 8 mag (N1.41022 cm-2) for a red-giant M-type star. The estimated column densities are consistent or slightly larger than the Galactic value measured along the line of sight towards AXJ 1714.13912 (i.e., 1.51022 cm-2; HI4PI Collaboration et al., 2016). Spectroscopic observations and a more detailed analysis would be necessary to better characterise the stellar type and determine whether intrinsic dust absorption is present in AXJ 1714.13912.
4.2 Is AX J1714.13912 an SFXT?
Miceli & Bamba (2018) excluded an extragalactic origin as well, based on the rapid timescale (thousands seconds) of the X-ray flux variability. They suggested that AX J1714.13912 is a Galactic HMXB belonging to the sub-class of SFXTs, based on the point-like appearence, the amplitude of the X-ray variability and the hard power law spectrum, indicative of accretion of matter onto a compact object.
In light of the flare caught by -, the source dynamic range (Fmax/Fmin) increases to 900, compared with the faint flux detected by (Fig. 5). This range of variability is not as extreme as the one shown by the prototypical members of the SFXT class (Fmax/Fmin from 104 to 106) but still consistent with less variable, “intermediate” SFXTs (see Table 2 in Sidoli & Paizis 2018). However it is possible that we missed the brightest flares, since the duty cycle of SFXT outbursts is very small (lower than 5%, see Table 1 in Sidoli & Paizis 2018). On the other hand, the source field has been monitored by /IBIS (above 20 keV) for a total exposure time of 6.7 Ms (Bird et al., 2016), with no detections reported in the literature. If we assume a typical flare duration of 2 ks we calculate a duty cycle lower than 0.03% for AX J1714.13912 (percentage of time spent in bright flaring activity, i.e. with a peak flux F1.5-310-10 erg cm-2 s-1; Sidoli & Paizis 2018), to reconcile with the lack of reported outbursts with . This would imply that AX J1714.13912 is the SFXT with the lowest duty cycle: to date, the SFXT with the rarest outbursts is IGR J08408-4503, showing a duty cycle of 0.09% (Sidoli & Paizis, 2018). Alternatively, AX J1714.13912 could be located at large distance: a short (duration 2 ks) flare with a peak luminosity of 1036 erg s-1 (18-50 keV) implies a source distance d8 kpc, to not be detected by .
The non detection with poses also a 3 upper limit to the persistent (quiescent) emission F2.3 erg cm-2 s-1 (20-40 keV; Bird et al. 2016). If we assume that the quiescent - spectrum is representative of the long-term source state, we can use this upper limit to constrain the presence of a high energy cutoff, despite the large uncertainty in the measured power law slope. In particular, if the true photon index of the quiescent spectrum is 0.8, the extrapolation of the power law model at higher energies leads to F1.3 erg cm-2 s-1 (20-40 keV), with no need for a cutoff. If harder power law photon indexes are assumed, variable cutoff values are needed to reconcile with the upper limit. For instance, for a photon index in the quiescent spectrum, a cutoff Ecut10 keV is needed, to match the upper limit to the 20-40 keV flux (where Ecut is the e-folding energy of exponential rolloff in the cutoffpl model in xspec).
4.3 Is AX J1714.13912 a supergiant B[e] HMXB?
Although the long-term X-ray light curve is compatible with an SFXT with very rare outbursts (and/or located at large distance), we note that the - spectral properties reported here for the first time are unusual for an SFXT (Sidoli, 2017; Martínez-Núñez et al., 2017; Kretschmar et al., 2019): so far, no members of this class are known to be so highly absorbed. Even in the SFXT IGR J184100535, where an intense flare was suggested to be produced by accretion of a very massive wind clump, the associated absorbing column density was significantly lower (Bozzo et al., 2011). The most extreme absorption among SFXTs has been observed in SAX J1818.61703 (51023 cm-2; Boon et al. 2016), but it is a unique case. In general, SFXTs show a circumstellar environment less dense than in persistent HMXBs (Kretschmar et al., 2019). We note that large absorbing column densities, variable on timescales of ten days, have been measured in the Be X-ray transient SXP 1062 (González-Galán et al., 2018) during the decline of the outburst, but with no detection of FeK line emission.
On the other hand, the AX J1714.13912 spectrum observed with - strongly resembles those of the so-called “highly obscured sources” (Walter et al., 2003). The latter are HMXBs where the compact object is enshrouded in a dense circumstellar environment produced by the outflowing matter from an evolved, early type massive star, such as a sgB[e]. In particular, the huge absorbing column density of 1.51024 cm-2 we deduce from the flare emission, makes AX J1714.13912 one of the most absorbed sources ever observed in our Galaxy, together with IGR J16318-4848 (Ibarra et al., 2007).
SgB[e] stars (Zickgraf et al., 1985; Kraus, 2019) are evolved massive stars characterized by disk-like, dusty circumstellar envelopes fed by dense outflows from the B supergiant. Their optical spectra show a twofold behaviour: broad Balmer emission lines plus narrow emission lines from permitted and forbidden transitions. HMXBs with a supergiant B[e] donor stars are a rare type of X-ray binaries, with CI Camelopardalis (CI Cam, aka XTE J0421+560; Bartlett et al. 2013) as a prototype, being the first Galactic sgB[e] star observed during an X-ray outburst whose X-ray luminosity implied a clear binarity nature. Chaty et al. (2019) suggest that sgB[e] HMXBs are at the short evolutionary stage when a binary system is entering a common envelope phase of binary evolution. At present, this is a small class of rare HMXBs that, besides the Galactic sources CI Cam, IGR J163184848, and Wd1-9, includes a couple of candidates in the Magellanic Clouds and, remarkably, two ultra luminous X-ray sources, Holmberg II X-1 and NGC300 ULX-1/supernova imposter SN2010da (Bartlett et al., 2019).
CI Cam and IGR J163184848 show variable absorbing column densities in the range 1023-1024 cm-2, intense FeK line emission and X-ray flux variability (Bartlett et al., 2019). But while IGR J16318-4848 is bright above 20 keV (Bird et al., 2016) with some level of flaring activity (Sidoli & Paizis, 2018), CI Cam has never been detected by (Bird et al., 2016). Nevertheless, IGR J163184848 has never undergone an X-ray outburst similar to the one experienced by CI Cam in 1998: CI Cam displayed a dynamic range in excess of 500 in 8 days (from 510-8 erg cm-2 s-1 to 910-11 erg cm-2 s-1), with a decline of five orders of magnitude, back to quiescence, in a few months (Belloni et al., 1999; Orlandini et al., 2000). Their X-ray luminosities cannot be determined as their distances are very uncertain. The nature of the compact object is unknown as X-ray pulsations have not been observed.
5 Conclusions
We have reported here on an - observation of AX J1714.13912, leading to the discovery of a remarkable new behavior of this source. The new findings can be summarized as follows:
-
•
a high intrinsic obscuration (1.51024 cm-2) is observed during the flaring emission, implying a large variability of two orders of magnitude in the absorbing column density towards the source, on timescales of years;
-
•
a prominent FeK line emission is evident both during the flare and the unflared (quiescent) emission, with variable fluxes in the two source states;
-
•
the flare caught by - increases the source range of flux variability to 900, when compared to a observation performed two years before.
In view of these new findings we have discussed different viable scenarios for the source nature. AX J1714.13912 was previously suggested to be a SFXT. The short term variability during the - observation is consistent with a SFXT nature, as well as the long-term dynamic range.
On the other hand, the - spectrum is remarkable, as no SFXT has ever shown an obscuration as large as 1024 cm-2. This spectrum shows many similarities with those typically observed in the so-called “highly obscured sources”, a rare sub-class of HMXBs with a sgB[e] companion. This might pose the SFXT identification into question and leads us to propose an alternative origin for the X–ray emisison, a sgB[e] HMXB. To confirm its membership further investigations of the companion star are needed.
Acknowledgements
Based on observations (ObsID 0804300901) obtained with -, a European Space Agency science mission with instruments and contributions directly funded by ESA Member States and NASA. This work has made use of data and software provided by the High Energy Astrophysics Science Archive Research Center (HEASARC), which is a service of the Astrophysics Science Division at NASA/GSFC. This work has made use of data from the ESA mission Gaia (https://www.cosmos.esa.int/gaia), processed by the Gaia Data Processing and Analysis Consortium (DPAC, https://www.cosmos.esa.int/web/gaia/dpac/consortium). Funding for the DPAC has been provided by national institutions, in particular the institutions participating in the Gaia Multilateral Agreement. This publication makes use of data products from the Two Micron All Sky Survey, the Wide-field Infrared Survey Explorer, and Spitzer Space Telescope. 2MASS is a joint project of the University of Massachusetts and the Infrared Processing and Analysis Center/California Institute of Technology, funded by the National Aeronautics and Space Administration and the National Science Foundation. WISE is a joint project of the University of California, Los Angeles, and the Jet Propulsion Laboratory/California Institute of Technology, funded by the National Aeronautics and Space Administration. Spitzer was operated by the Jet Propulsion Laboratory, California Institute of Technology under a contract with NASA. PE acknowledges financial support from the Italian Ministry for Education and Research through the PRIN grant 2017LJ39LM.
Data Availability
The - data analysed here are publicly available by means of the HEASARC (ObsID 0804300901) and the ESA archive at the link https://doi.org/10.5270/esa-nai97jb
References
- Arnaud (1996) Arnaud K. A., 1996, in Jacoby G. H., Barnes J., eds, Astronomical Society of the Pacific Conference Series Vol. 101, Astronomical Data Analysis Software and Systems V. p. 17
- Bartlett et al. (2013) Bartlett E. S., Clark J. S., Coe M. J., Garcia M. R., Uttley P., 2013, MNRAS, 429, 1213
- Bartlett et al. (2019) Bartlett E. S., Clark J. S., Negueruela I., 2019, A&A, 622, A93
- Belloni et al. (1999) Belloni T., et al., 1999, ApJ, 527, 345
- Benjamin et al. (2003) Benjamin R. A., et al., 2003, PASP, 115, 953
- Bird et al. (2016) Bird A. J., et al., 2016, ApJS, 223, 15
- Boon et al. (2016) Boon C. M., et al., 2016, MNRAS, 456, 4111
- Bozzo et al. (2011) Bozzo E., et al., 2011, A&A, 531, A130
- Cardelli et al. (1989) Cardelli J. A., Clayton G. C., Mathis J. S., 1989, ApJ, 345, 245
- Chaty et al. (2019) Chaty S., Fortin F., García F., Fogantini F., 2019, IAU Symposium, 346, 161
- Fabian et al. (1990) Fabian A. C., George I. M., Miyoshi S., Rees M. J., 1990, MNRAS, 242, 14P
- Gaia Collaboration et al. (2016) Gaia Collaboration et al., 2016, A&A, 595, A1
- Gaia Collaboration et al. (2021) Gaia Collaboration et al., 2021, A&A, 649, A1
- González-Galán et al. (2018) González-Galán A., Oskinova L. M., Popov S. B., Haberl F., Kühnel M., Gallagher J., Schurch M. P. E., Guerrero M. A., 2018, MNRAS, 475, 2809
- Guainazzi et al. (2005) Guainazzi M., Matt G., Perola G. C., 2005, A&A, 444, 119
- HI4PI Collaboration et al. (2016) HI4PI Collaboration et al., 2016, A&A, 594, A116
- Haberl (1991) Haberl F., 1991, A&A, 252, 272
- Hickox et al. (2017) Hickox R. C., Myers A. D., Greene J. E., Hainline K. N., Zakamska N. L., DiPompeo M. A., 2017, ApJ, 849, 53
- Ibarra et al. (2007) Ibarra A., Matt G., Guainazzi M., Kuulkers E., Jiménez-Bailón E., Rodriguez J., Nicastro F., Walter R., 2007, A&A, 465, 501
- Jansen et al. (2001) Jansen F., et al., 2001, A&A, 365, L1
- Koyama et al. (1997) Koyama K., Kinugasa K., Matsuzaki K., Nishiuchi M., Sugizaki M., Torii K., Yamauchi S., Aschenbach B., 1997, PASJ, 49, L7
- Kraus (2019) Kraus M., 2019, Galaxies, 7, 83
- Kretschmar et al. (2019) Kretschmar P., et al., 2019, New Astron. Rev., 86, 101546
- Kurucz (1993) Kurucz R. L., 1993, VizieR Online Data Catalog, p. VI/39
- Magdziarz & Zdziarski (1995) Magdziarz P., Zdziarski A. A., 1995, MNRAS, 273, 837
- Martínez-Núñez et al. (2017) Martínez-Núñez S., et al., 2017, Space Science Reviews, 212, 59
- Miceli & Bamba (2018) Miceli M., Bamba A., 2018, A&A, 612, A32
- Nandra et al. (2007) Nandra K., O’Neill P. M., George I. M., Reeves J. N., 2007, MNRAS, 382, 194
- Negueruela et al. (2006) Negueruela I., Smith D. M., Reig P., Chaty S., Torrejón J. M., 2006, in Wilson A., ed., Proceedings of the “The X-ray Universe 2005”, 26-30 September 2005, El Escorial, Madrid, Spain. Ed. by A. Wilson. ESA SP-604, Volume 1, Noordwijk: ESA Publications Division, ISBN 92-9092-915-4, 2006. p. 165
- Orlandini et al. (2000) Orlandini M., et al., 2000, A&A, 356, 163
- Polletta et al. (2007) Polletta M., et al., 2007, ApJ, 663, 81
- Sguera et al. (2005) Sguera V., et al., 2005, A&A, 444, 221
- Sguera et al. (2006) Sguera V., et al., 2006, ApJ, 646, 452
- Sidoli (2017) Sidoli L., 2017, in XII Multifrequency Behaviour of High Energy Cosmic Sources Workshop (MULTIF2017). p. 52 (arXiv:1710.03943)
- Sidoli & Paizis (2018) Sidoli L., Paizis A., 2018, MNRAS, 481, 2779
- Skrutskie et al. (2006) Skrutskie M. F., et al., 2006, AJ, 131, 1163
- Slane et al. (1999) Slane P., Gaensler B. M., Dame T. M., Hughes J. P., Plucinsky P. P., Green A., 1999, ApJ, 525, 357
- Strüder et al. (2001) Strüder L., et al., 2001, A&A, 365, L18
- Turner et al. (2001) Turner M. J. L., et al., 2001, A&A, 365, L27
- Uchiyama et al. (2002) Uchiyama Y., Takahashi T., Aharonian F. A., 2002, PASJ, 54, L73
- Verner et al. (1996) Verner D. A., Ferland G. J., Korista K. T., Yakovlev D. G., 1996, ApJ, 465, 487
- Walter et al. (2003) Walter R., et al., 2003, A&A, 411, L427
- Werner et al. (2004) Werner M. W., et al., 2004, ApJS, 154, 1
- Wilms et al. (2000) Wilms J., Allen A., McCray R., 2000, ApJ, 542, 914
- Wright et al. (2010) Wright E. L., et al., 2010, AJ, 140, 1868
- Zickgraf et al. (1985) Zickgraf F. J., Wolf B., Stahl O., Leitherer C., Klare G., 1985, A&A, 143, 421