colorlinks, linkcolor=red!90!red, citecolor=blue!50!black, urlcolor=cyan!100!black
DeepAutoPIN: An automorphism orbits based deep neural network for characterizing the organizational diversity of protein interactomes across the tree of life
Abstract
The enormous diversity of life forms thriving in drastically different environmental milieus involves a complex interplay among constituent proteins interacting with each other. However, the organizational principles characterizing the evolution of protein interaction networks (PINs) across the tree of life are largely unknown. Here we study 4,738 PINs belonging to 16 phyla to discover phyla-specific architectural features and examine if there are some evolutionary constraints imposed on the networks’ topologies. We utilized positional information of a network’s nodes by normalizing the frequencies of automorphism orbits appearing in graphlets of sizes 2-5. We report that orbit usage profiles (OUPs) of networks belonging to the three domains of life are contrastingly different not only at the domain level but also at the scale of phyla. Integrating the information related to protein families, domains, subcellular location, gene ontology, and pathways, our results indicate that wiring patterns of PINs in different phyla are not randomly generated rather they are shaped by evolutionary constraints imposed on them. There exist subtle but substantial variations in the wiring patterns of PINs that enable OUPs to differentiate among different superfamilies. A deep neural network was trained on differentially expressed orbits resulting in a prediction accuracy of .
Keywords: Automorphism orbits, Graphlets, Protein interaction networks, Deep neural network, Tree of life.
Significance statement
The organizational principles characterizing the evolution of protein interaction networks (PINs) across the tree of life are largely unknown. In this study, we have characterized evolutionarily conserved topologies across the three domains of life, along with phylum-specific restrictively conserved wiring patterns. Using functional information and statistical testing, we deduced that the evolutionary constraints had shaped the wiring patterns of PINs across the tree of life.
Introduction
Life manifests itself in fundamentally diverse forms ranging from microbes to plants thriving in vastly different environmental milieus (?). Underlying this utmost diversity, there exists a universal cellular machinery that is governed by a population of small, self-organising molecules called proteins. The complex interplay among constituent proteins of a cell that interact with each other to control vital biological processes, like, metabolic reactions, molecular transport, immunity, gene expression, signaling etc. produces different phenotypes that allow sustenance of life in varying environmental conditions (?). The mechanistic details of how evolutionary constraints shape the topology of interacting proteins in an organism are still elusive despite a large number of sequence-based studies on genomic evolution (?). Recent advancements in high-throughput technologies have provided a large volume of biological data, including protein-protein interactions (PPI), from different domains that can be analyzed using the principles of networks science to gain insights into the mechanisms underlying these complex systems (?, ?, ?). Fundamental to each network type is the connectivity patterns giving rise to a specific topology. The topology of complex networks represents their underlying generative phenomena, and it varies across the systems of different disciplines (inter-disciplinary) (?) as well as within the classes of systems belonging to a particular discipline (intra-disciplinary) (?). For example, the topological characteristics of different types of biological networks, like, Protein interaction networks (PINs), residue interaction networks (RINs), food webs, brain networks etc. are different.
Inter-disciplinary networks, such as PINs, can further be sub-categorized at any level of taxonomic rank such as phyla, order, class etc. (intra-disciplinary networks). This variability is due to the existence of inherent similarities along with unique characteristic features among networks belonging to different classes (?). PINs are conspicuous as they provide structural and functional elucidation of interacting proteins. Much research has been devoted to application of either single node properties, like, various types of node centrality measures (?, ?) called microscopic structural features or global network properties, like, small-world, scale-free, average path length (?) called macroscopic structural features to characterize the topological diversity of PINs and other classes of networks. However, delving deeper into the networks’ structures shows that there are small assemblages of subsystems which are functioning independently. Although these subsystems have their own functions, their amalgamation give rise to complex systems behavior (?, ?). So, deciphering these interconnection patterns is very crucial to gaining insights into the system’s structure and function (?).
In the past few decades, attempts have been made to compare PINs with other classes of networks and cluster different networks into their respective classes using mesoscopic structural features, like, modularity, motifs and graphlets, resulting from network properties computed on groups of nodes, which offer much higher topological information (?, ?, ?). Local sub-structures of a large complex network, namely, the network motifs and graphlets are core elements of its constituent design, which impose constraints and govern many aspects of the emergent systems dynamics (?). Network motifs, that are over-represented, partial, small subgraphs, have been used for inter-disciplinary network characterization and clustering (?). Graphlets that are defined as small non-isomorphic subgraphs and are induced on large networks, have also been used extensively to identify network commonalities and alignment (?, ?, ?, ?). Similarly, communities, that are the densely connected subgroups of nodes with very sparse edges among the members of other subgroups, have also been implemented to differentiate inter-disciplinary classification of various types of networks (?).
Although a large volume of research is available on exploiting PIN’s architecture, however, most of the studies have been performed on either intra-disciplinary pairwise network comparison of very few PINs or inter-disciplinary comparison with networks belonging to other categories. A systems scale extensive study leveraging topological diversity to characterize PINs across three domains of life or any other biological taxonomic hierarchy is still lacking. Here we study PINs belonging to phyla from three domains of life to characterize the organizational diversity underlying them by utilizing normalized frequencies of automorphism orbits appearing in graphlets of sizes 2-5. We report that orbit usage profiles (OUPs) of networks are contrastingly different across the three domains of life as well as at the scale of phyla. Integrating the biological information of five functional annotations we found that wiring patterns of PINs in different phyla shaped by evolutionary constraints imposed on them.
Materials and Methods
Network Data
All the available protein interaction networks (PINs) in STRING (v11) (?) were denoted as PIN data set. This data set was classified into three domains of life (superfamilies) viz. Archaea, Bacteria and Eukaryota using NCBI’s Taxonomy database (?). In any individual network, we considered only interactions having STRING confidence score or above. Further, using the taxonomy database, second data set of PINs was created by dividing the networks at phylum rank in the biological taxonomy. All the phyla with or more networks, resulting in categories, were considered for further studies.
Random network models
Two ensembles of random networks based on Erdős-Rényi (ER) and density dependent scale-free (DDSF) algorithms were generated corresponding to each network belonging to phyla considered here. ER networks () with same number of nodes and links corresponding to real networks were generated by randomly selecting a set of edges among possible edges (?). Since the PINs used in this study have varying densities so we modified the original Barabási-Albert (BA) model of stochastic, scale free growth (?) in such a way that it accounts for density of the networks. This method maintains both the essential ingredients of BA model that are growth and preferential attachment, however, the growth is now dependent on density of the real network. A random network corresponding to real network is generated by introducing new nodes with degree or such that is a function of average degree of the real network. The algorithm completes in two steps, namely, (i) generation of the seed network, and (ii) extension of the seed network. Initially the seed network contains a single edge between two nodes thus have and grows by consecutively adding new nodes with degree unless the order of seed network becomes larger than average degree of real network . After the construction of seed, subsequent nodes are added to it consecutively where each incoming node connects to or number of nodes such that , with probabilities and respectively. is the average degree of the remaining network and is recomputed for every node added to growing network (Algo 1).
Orbit Usage Profile (OUP)
Orbits are sets of symmetrically equivalent nodes present in each graphlet (?). In graphlets of order up to nodes, there exist sets of automorphism groups. To define OUP, first the number of occurrences of the node in orbit, where , were enumerated for all the real networks. This dimensional orbit count vector characterizes the local neighborhood of each node in the network. Since large sized orbits inherently contain some of the smaller orbits as well as the orbit itself, for example the orbit contains orbit and itself, therefore a redundancy is introduced in the orbit count. To deal with this, a weight is assigned to the orbit by counting the number of other orbits present in the orbit and the orbit itself denoted as that is further normalized as follows
Greater the value of , more the importance of the orbit as it is less redundant (?). Finally, weight adjusted relative orbit frequency (WAROF) for a network of order and size was computed for every orbit as , where is the total orbit count for the orbit in all nodes of network and, is total orbit count of (?). In this way, WAROFs were calculated for all the orbits and the resulting dimensional vector represents an orbit usage profile (OUP) corresponding to each network. Similarly, OUPs were computed for each of the networks in the ER and DDSF ensembles.
Differential orbits expression
To identify diffferentially expressing orbits, we first took all the OUPs belonging to a phylum and then for every orbit , the mean and standard deviation of its counts were calculated that were used to further compute the Z-statistic for network as follows
and are the mean and standard deviation of orbit of the PINs of species belonging to phylum . Orbits for which i) for both ER and DDSF, and ii) the condition (i) was satisfied by at least of networks belonging to that phylum were considered as diffferentially expressed orbits (DEO). We then averaged orbit counts of differentially expressing orbits for every phylum and pairwise distance correlation between these phyla was computed. The advantage of using distance correlation (?) as similarity index is mainly due to its ability to measure non-monotonic relationship between two variables. Two variables and are independent if , and a value of implies equal linear subspaces of the variables. It is defined as
Where the distance covariance is defined as . and are the elements of double centered distance matrices and computed in an dimensional Euclidean space.
Functional validation
To further assess the functional similarity between wiring patterns of different species, we constructed sets, each containing networks selected uniformly at random, from every phyla and identified orbit proteins touching differentially expressed orbits by reverse mapping orbit frequency information to network data. Orbit proteins (set of proteins touching the respective orbit) for orbit of network in phylum were identified and then pooled all the orbit proteins of orbit from all the networks in phyla and constructed sets of orbit proteins each representing a differentially expressed orbit (DEO) for every phyla. We then obtained five functional annotations namely, gene ontology (GO) terms, pathways, protein domains, protein family and subcellular localization (SL) corresponding to each orbit protein from UniProt KB (?). It is based on the premise that PPIs having similar wiring pattern are evolutionarily conserved across species and hence should have high similarity score for PINs within phylum and low similarity values otherwise. Furthermore, between every pair of phyla we computed pairwise Jaccard Coefficient (JC) among all the DEOs ( orbit protein annotation coverage) and obtained their average to construct a average similarity matrix for all but SL functional annotations. Since loosely connected regions (low degree nodes) in the network represent substantial lack of PPIs information in those regions, so functional information encoded from these proteins may also be incomplete that may lead to false conclusions. In order to avoid this situation and draw consistent patterns across species, we introduce a concept of orbit protein annotation coverage (OPAC). For that, first the number of orbit proteins covered by a particular functional annotation term were enumerated. Top of the orbit proteins that are covered by at least one functional annotation term (i.e. OPAC 80%) were selected for further analysis.
Preprocessing of OUPs and classification into different phyla
Each of the above computed feature vector (OUP) from phyla are used for the network classification. The input data was split into training () and test () sets stratified according to proportion of each class in the complete data set. Every feature of the two sets was then standardized to have and . A deep neural network (DeepAutoPIN) consisting of one input, one softmax and four dense hidden layers, comprising of and units, respectively, was learned using 5-fold cross validation approach. The hyper-parameters, rectified linear unit (relu) activation function, stochastic gradient-based adam optimizer and regularization were used to train the classifier. Class label of each unknown network in held out of the test data was then predicted using multiclass classifier .
Results and Discussion
From a total of PINs in STRING v11, we could associate networks with phyla by leveraging taxonomic information from NCBI taxonomy database (?). Since, a large number of phyla were having very few networks so to ensure that the classification task retain sufficient statistical power a threshold of networks per phyla was set and only phylum having or more networks were considered for further study (?). This results in phyla including networks among which are Archaeal, are Bacterial and are Eukaryotic networks (Table S1). Small subgraphs have been used extensively to describe a node’s local neighborhood (?, ?), its position in a network and quantify the topological similarity between different networks (?, ?). Their applications are based upon the basic premise that wiring patterns of proteins involved in a particular function are conserved to a large extent, suggesting that proteins having similar wiring patterns (topological signatures) may have similar physiological properties (?, ?). Several graph based approaches leveraging conserved wiring patterns of proteins to establish relationship between network topology and protein function have already been successfully used (?, ?). A basic assumption made by all these studies is that the wiring patterns of annotated proteins for each function are similar which, however, may vary due to varying effects of evolution on different parts of the networks (?). Therefore, essential functions that are vital for organisms growth and development may experience evolutionary constraints on their wiring pattern. However, functions that are more specific to species may experience less conservative forces on their topology and their wiring pattern can vary. Thus in this study we are proposing a more robust approach to identify most prominent topological patterns conserved across different species. Orbit count distributions corresponding to every node of a network were enumerated and were further normalized (see Methods) to a single dimensional feature vector called orbit usage profile (OUP) that is representative of whole network. Same process is repeated for every PIN resulting in profiles for real networks and same number of OUPs for corresponding ER and DDSF based random networks.
Orbit enrichment and differential orbit expression analysis
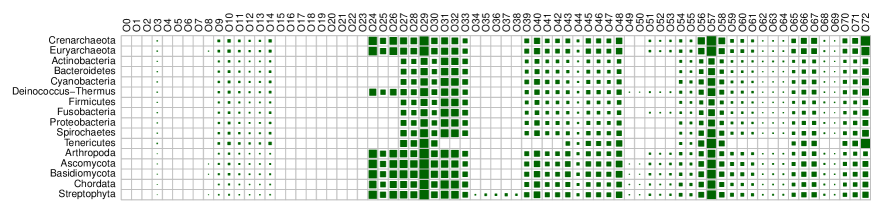
As we have discussed in the methods section orbit counts have dependencies on each other and we are averaging the orbit counts of a networks this may over represent some trivial patterns (?). Also, since OUP is a dimensional vector and all the orbit signatures may not be of equal evolutionary importance, some of them may be artifacts of network topology and their over expression may be due to shear random chance. Therefore, to identify the statistically significant wiring patterns we compared the OUPs of real PINs with their corresponding random ensembles (both ER and DDSF) by computing Z-scores. Significantly overexpressed (see Methods) orbits having Z-score or more, for at least of the networks belonging to a phyla, were considered differentially expressed and that particular phyla was enriched for these orbits. Differential orbit expression has revealed that orbits , instances of graphlets and ; orbits , instances of graphlets and ; orbits , instances of graphlets have orbit counts comparable to their random counterparts in all the OUPs (Fig 1). This suggests that these out of orbit topologies are not significantly overexpressing and are less or not informative from evolutionary prospective. Remaining differentally overexpressed orbit profiles constitute our evolutionarily informative set of features. As observed from differentially expressed OUPs, within a domain of life the orbit usage is similar for most of phyla, however, it varies for phyla belonging to different domains of life. Simplest and most contrasting OUPs are of Bacterial phyla, most of them lack orbits - and - , except for Deinococcus-Thermus, that highly resemble to OUP of Streptophyta. Archaeal OUPs differentially express additional obits -
Evolutionary relevance of OUPs
There exist several example in biology where certain vital functions are conserved across different species that experience greater conservative forces (?, ?, ?). The proteins involved in these functions may have changes at their sequence or structural level in different species, however, their overall connectivity (wiring) pattern is same across species. For example, the core circadian clock proteins have variations in their sequences and structures of different species, however, the overall clock is preserved across different domains of life (?), cellular information processing machineries (?) and metabolic processes (?) etc. As explained in previous section the wiring patterns of different phyla are not obtained by random chance, so to further explore the biological basis of variations in the wiring patterns of different phyla and to know if these patterns are shaped by evolutionary forces, we selected five functional annotations viz. gene ontology (GO) terms, pathways, protein family, sub-cellular localization and protein domains to test the evolutionary relevance of OUPs. Pathway and protein family annotation data revealed that Archaeal proteins involved in differentially expressed orbits are participating mainly in fundamental cellular processes like replication, transcription, translation, carbohydrate, lipids, amino acid, purine and pyrimidine metabolism. Pathways data revealed a significant proportion of proteins, covering on average of total proteins per orbit, are enriching only nine fundamental Archaeal pathways, namely, Amino-acid biosynthesis, Cofactor biosynthesis, Purine metabolism, Pyrimidine metabolism, Carbohydrate degradation, Metabolic intermediate biosynthesis, Porphyrin-containing compound metabolism, Protein modification, Carbohydrate biosynthesis. Similarly most of the pathways enriched in Archaea are also among the most enriched pathways in Bacterial (OPAC ) and Eukaryotic (OPAC ) domains of life. Furthermore, protein family data also revealed most of the Archaeal, Bacterial and Eukaryotic orbit proteins (OPAC and , respectively) are enriching families functioning in fundamental processes, like, transport, replication, transcription, translation, carbohydrate, lipids, amino acid, nucleic acid metabolism etc. Subcellular information revealed that of Archaeal and Bacterial orbit proteins respectively localize in only cytoplasm and membrane. While of Eukaryotic orbit proteins localize in nucleus, membrane and endoplasmic reticulam membrane. This analysis also suggests that these orbit proteins are mostly involved in fundamental processes (S2).
As observed from the pathways, protein family and sucellular location data, most of the orbit proteins are involved in fundamental cellular processes responsible for organism’s growth and development. These processes are essential for organism’s survival, and their over-all topologies (wiring patterns) remain conserved at large across the three domains of life (?, ?) with subtle variations at molecular level (?). In an earlier study orbit groups , , , , , and have been linked with processes, like, ‘Proteasome Assembly’, ‘Transcription Initiation’ and ‘Transcription Elongation’ (?). The differentially expressed OUPs obtained in this work, encompass most of these orbits. These consistently appearing wiring patterns indicate that OUPs represent topological features which are conserved across three domains of life and they also establish a relationship between network topology and function by capturing functionally similar (conserved) regions of different networks
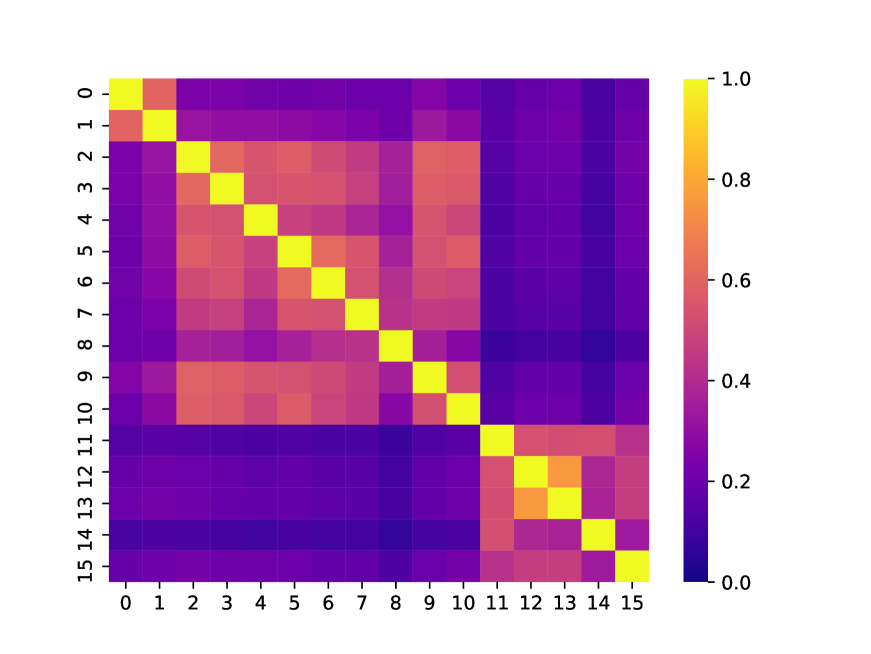
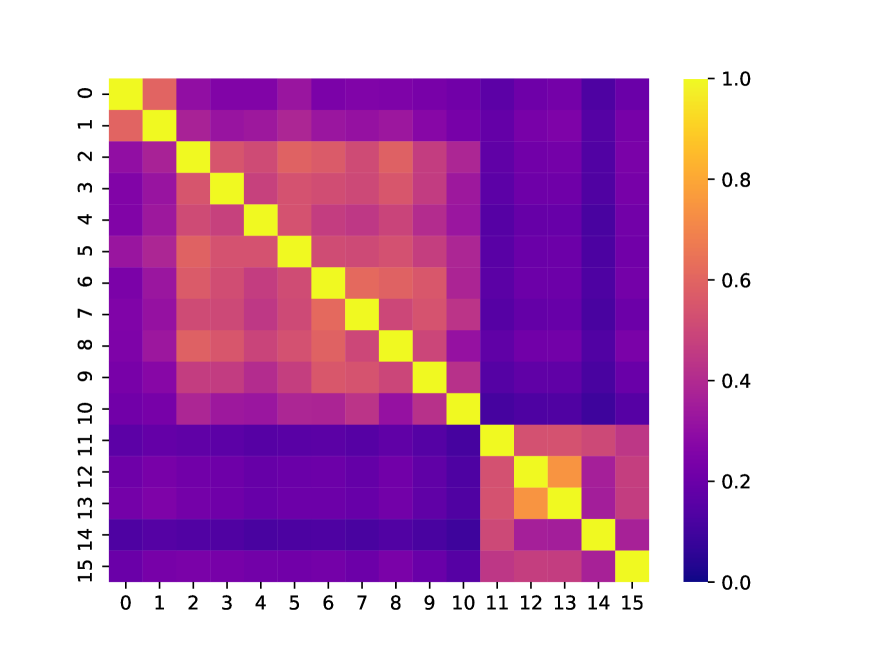
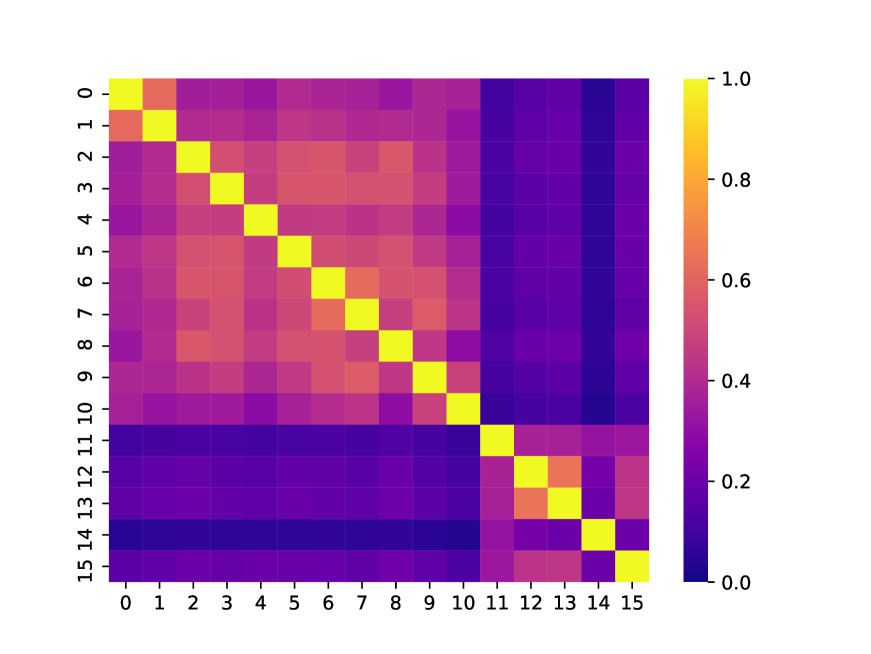
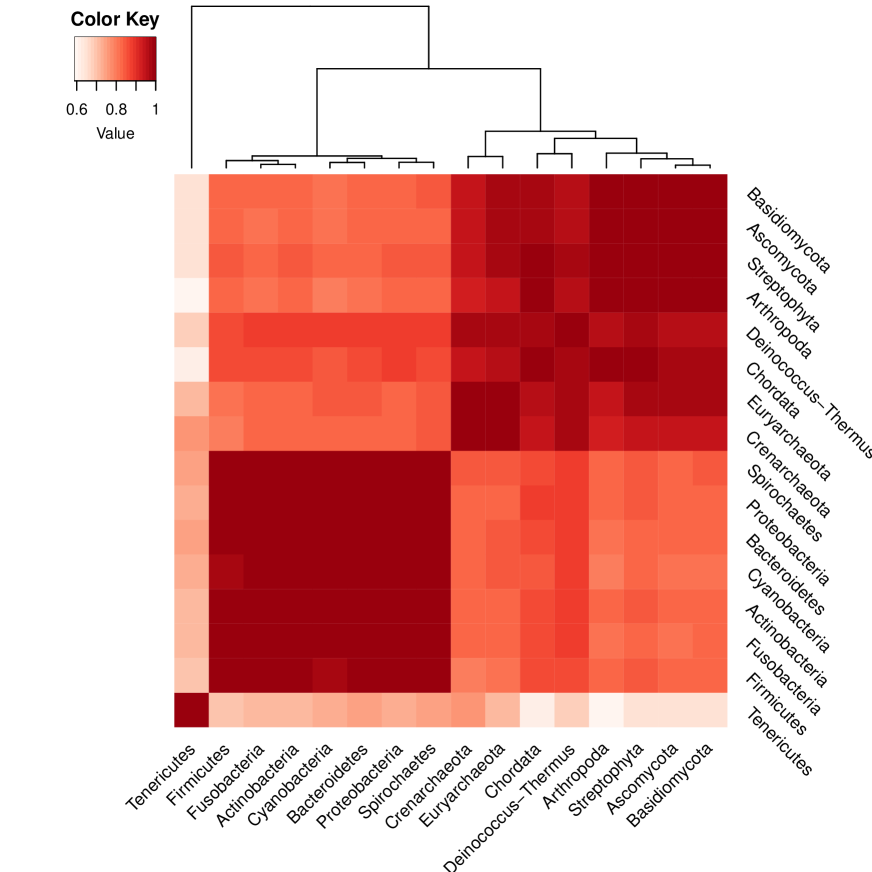
To quantify the similarity between orbit protein vectors using annotation data we leveraged Jaccard coefficient (JC) and constructed a pairwise similarity matrix among all the Phyla. Each element of this similarity matrix is an average JC value obtained from JC values between the two Phyla. These average JC matrices were computed for four functional annotations namely, GO, protein domains, pathways and protein family annotations. The average JC matrix computed from protein family annotations, covering of orbit proteins, revealed a high average JC value ) between the two Archaeal phyla Crenarchaeota and Euryarchaeota (intra-phyla) (Fig 2(a)). While JC values between Crenarchaeota and other Bacterial and Eukaryotic phyla (inter-phyla) are comparatively very low and , respectively, JC values among Bacterial phyla, e.g. Actinobacteria and other bacterial phyla, are quite high () compared to Actinobacteria and other Archaeal (), Eukaryotic () phyla. Similarily, JC values among Eukaryotic phyla, e.g. Spirochaetes and other Eukaryotic phyla, are high () compared to Spirochaetes and other Archaeal (), Bacterial () phyla. Similarly, high JC values for intra-phyla networks and low JC values for inter-phyla networks are observed for protein domain annotations (Fig 2(b)). Although this distinction fades away as the scope of annotation is broadened. JC values computed using GO annotations are higher ( and ) among intra-phyla networks (Archaea, Bacteria and Eukaryota), respectively, along with a comparatively higher JC values among Bacterial phyla and other Archaeal phyla e.g. JC values among Actinobacteria and other Archaeall phyla are comparatively higher () than other Eukaryotic () phyla (Fig 2(c)). This hike in JC values among inter-phyla networks is further increased for pathway annotations as most of the orbit proteins are functioning in fundamental pathways (essential) responsible cellular growth and development and are thus conserved across the three domains of life (Fig 2(d)). These results suggest that although, at higher level (pathway) there are similarities among networks within a phyla, however, at molecular level (protein domain and family) there are subtle but significant enough variations in the wiring patterns that endow OUPs their predictive power.
OUP based phylogenetic reconstruction
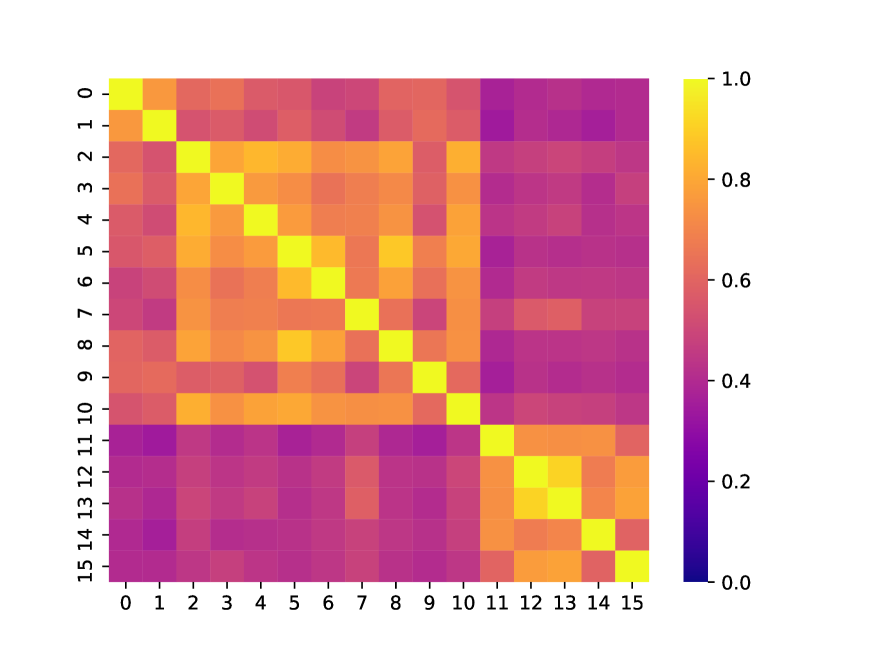
After removing non-informative orbit counts, we obtained mean OUP, by averaging all the OUPs of that phylum, for every phylum. Then we clustered the average orbit counts of all the phyla by computing pairwise distance correlation between them and then applying hirearchical clustering on the similarity matrix. We obtain three main clusters containing and , networks respectively (Fig 3(a)). The OUP of Bacterial phylum Tenericutes is found to be the most distinct from all the others and have very low correlation with other phyla hence placed into its individual cluster. In the second cluster, all but one phyla (Deinococcus-Thermus) of Bacterial domain are correctly grouped together in two sub clusters with Fusobacteria, Firmicutes and Actinobacteria being present in one sub-cluster while Cyanobacteria, Bacteriodates, Proteobacteria and Sprichaetes in the other subcluster. In the third cluster, eight phyla are grouped together in two main subclusters. In one subcluster both the Archaeal phyla, Crenarchaeota and Euryarchaeota are grouped together, while in the other sub-cluster Deinococcus-Thermus along with five Eukaryotic phyla are grouped together. Our method has correctly reconstructed the overall topology of the three of life (ToL) where the simplest Bacteria diverged earlier than the Archaeal and Eukryotic domains of life. However, a close observation reveals that within the domain, some phyla like Tenericutes, Actinobacteria, Deinococcus-Thermus are not at their correct positions, although some, like, Streptophyta, Ascomycota, Basidiomycota (all fungi) and Fusobacteria, Firmicutes, Cyanobacteria are correctly placed (?).
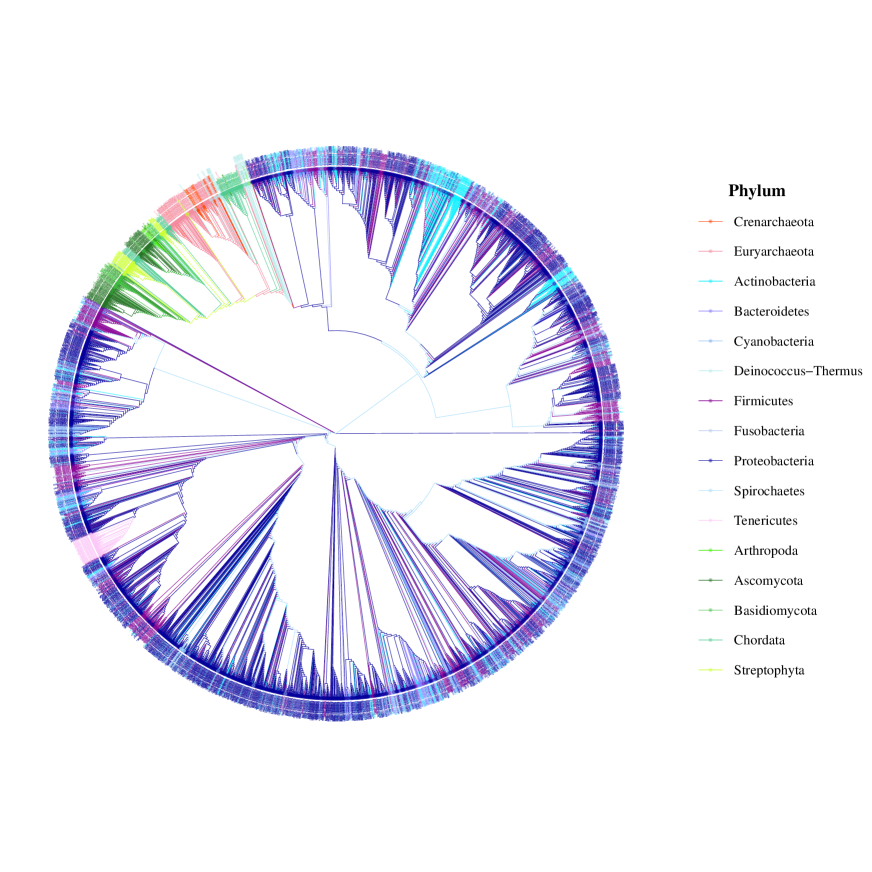
To know the topology of the complete tree, Bray-Curtis method of dissimilarity was used to compute distance matrix and the tree was constructed by neighbor-joining method (?). Again, similar results were obtained, the Archaeal phyla (band of red shades) are clustered separately and are close to Eukaryotic phyla (bands of green shades) which are also clustered separately (Fig 3(b)). However, the networks of bacterial phyla are scattered among themselves and does not form continuous blocks as for Archaea and Eukaryota. Both these clustering results indicate that there exists distinctive topological patterns conceled within OUPs and have the potential to reconstruct phylogenies (?). However, because the patterns are subtle they require highly sensitive methods to compute the distance. Also it should be noted that factors, like, noise, incompleteness of PINs etc. may hamper the quality of clustering (?).
OUP classification
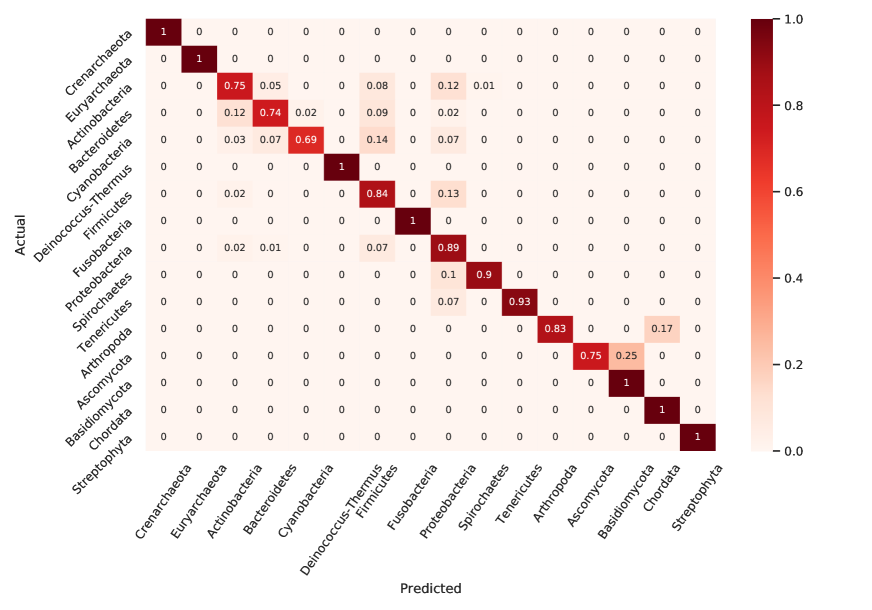
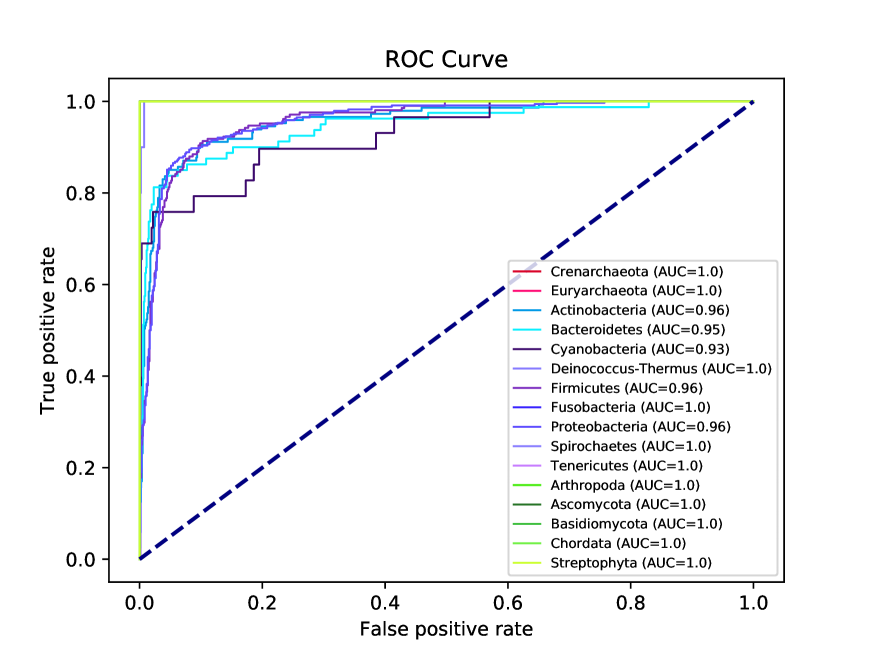
For each phylum, we learned a binary classifier using a deep neural network (DeepAutoPIN), where the phylum of interest represents the positive class while all the other phyla correspond to the negative class, to predict the phylum of a PIN with an unknown phylum label. To evaluate the performance of the deep neural network, for each binary classification we computed Area Under the ROC Curve (AUC) for every classifier and also developed a confusion matrix. Classification results are presented as confusion matrix (Fig 4(a)), that revealed the presence of distinct graphlet wiring patterns specific to phyla as well as the three domains of life. Our classifier successfully differentiated among networks belonging Archaeal, Bacterial and Eukaryotic domains without any misclassification. Our model successfully classified all the instances of Archaeal networks, both Crenarchaeota and Euryarchaeota, into their respective phyla with an AUC value of , indicating that they possess signatures which are distinct from the networks belonging to Bacterial and Eukaryotic phyla as well as from each other. This is consistent with results obtained from distance correlation where we found that OUPs of both the Archaeal phyla are highly correlated with each other. Similarly, our model successfully classified all the networks of Basidiomycota, Chordata and Streptophyta into their respective phyla. Although on networks belonging to Arthropoda and Ascomycota, our model achieved and accuracy respectively. In case of Ascomycota of networks are mislabeled as Basidiomycota (both of these are fungi), while of Arthropoda networks are mislabeled as Chordata (both of the phyla belong to animal kingdom). For all the five Eukaryotic domains the AUC score was observed to be . Similar to both Archaeal and Eukaryotic networks, OUPs of Bacterial networks possess signatures distinct enough to classify them as being Bacterial. Our model correctly predicts all the networks of Deinococcus-Thermus and Fusobacteria, however, it achieved classification accuracy on OUPs obtained from Actinobacteria, Bacteriodates and Cyanobacteria respectively. While OUPs of Firmicutes, Proteobacteria, Spirochaetess and Tenericutes were classified with corresponding prediction proabilities , respectively. Phylum Actinobacteria, Bacteriodates and Cyanobacteria are among the top three bacterial phyla for which mislabelling rate is highest followed by Firmicutes and Proteobacteria, however, most of the mislabeled networks are classified into Firmicutes or Proteobacteria. This highlights that these two bacterial phyla have most general topological features which are shared between most of the Bacterial phyla considered in this study. AUC score for all of the classes are very high (closer to 1) indicating a high predictive performance of our model (Fig 4(b)). Our model obtained an overall prediction accuracy of on class test set.
Summary and Conclusions
We propose an approach to compare PINs belonging to different phyla by summarizing the subtle wiring patterns called orbit usage profiles (OUPs). Diffferentially expressed orbits profiles characterized by evolutionarily informative orbits were obtained and found that there exists phyla specific topological features conserved across the three domains of life. These profiles are similar for within phyla PINs (intra-phyla) and are distinct from the PINs belonging to other phyla (inter-phyla). Our method is able to capture conserved biological processes underlying PINs, using data of five functional annotations a relationship between the topological features of orbit proteins and biological functions is establish and found that the topological features represent functions vital for sustenance of life that are shaped by evolutionary forces acting on them. Furthermore, we have shown that our approach is able to group networks into their respective phyla. Notably a deep neural network (DeepAutoPIN) trained on OUPs achieved an overall accuracy of to predict the label of a PIN that has not been assigned to any phylum. Most of the phyla contain distinct topological features from other phyla, however, there exists some indistinguishable features among Eukaryotic phyla as well as Prokaryotic phyla. To the best of our knowledge most of the studies on PINs have been limited to organisms with high PPI coverage, this is the first study that systematically investigate PINs and highlights evolutionarily conserved topological features that shaped their overall architecture across the tree of life. Since the available interactomes are sparse and contain a substantial number of false negative and positive interactions, a considerable limitation, despite consistent results our findings may become more generalized with increasing interactomic data.
Acknowledgements
thanks Council of Scientific and Industrial Research (CSIR), India for providing Senior Research Fellowship (SRF). Funding: Authors received no specific funding for this research work. Authors Contributions: conceptualized and designed the research framework. performed the computational experiments. and analyzed the data and interpreted results. and wrote and finalized the manuscript. Competing Interests: The authors declare that they have no conflict of interests. Data and materials availability: Supplementary data is available at https://drive.google.com/file/d/1TkiW0bKe0sSEiFm3bREEWP_M0R2iitmS/view?usp=sharing while the code for DDSF is available at https://github.com/vikramsinghlab/DDSF, and for DeepAutoPin is available at https://github.com/vikramsinghlab/DeepAutoPIN. Ethics approval: Not applicable. Concent to participate: Not applicable. Concent to publish: Not applicable.
References
- 1. Cindy J Castelle and Jillian F Banfield. Major new microbial groups expand diversity and alter our understanding of the tree of life. Cell, 172(6):1181–1197, 2018.
- 2. Brigitte Boeckmann, Marie-Claude Blatter, Livia Famiglietti, Ursula Hinz, Lydie Lane, Bernd Roechert, and Amos Bairoch. Protein variety and functional diversity: Swiss-prot annotation in its biological context. Comptes rendus biologies, 328(10-11):882–899, 2005.
- 3. Trevor R Sorrells, Lauren N Booth, Brian B Tuch, and Alexander D Johnson. Intersecting transcription networks constrain gene regulatory evolution. Nature, 523(7560):361–365, 2015.
- 4. Mark EJ Newman. The structure and function of complex networks. SIAM Review, 45(2):167–256, 2003.
- 5. Jamie Snider, Max Kotlyar, Punit Saraon, Zhong Yao, Igor Jurisica, and Igor Stagljar. Fundamentals of protein interaction network mapping. Molecular Systems Biology, 11(12):848, 2015.
- 6. Da Zhang and Mansur Kabuka. Multimodal deep representation learning for protein interaction identification and protein family classification. BMC Bioinformatics, 20(16):1–14, 2019.
- 7. Ron Milo, Shalev Itzkovitz, Nadav Kashtan, Reuven Levitt, Shai Shen-Orr, Inbal Ayzenshtat, Michal Sheffer, and Uri Alon. Superfamilies of evolved and designed networks. Science, 303(5663):1538–1542, 2004.
- 8. Khalique Newaz, Mahboobeh Ghalehnovi, Arash Rahnama, Panos J Antsaklis, and Tijana Milenković. Network-based protein structural classification. Royal Society Open Science, 7(6):191461, 2020.
- 9. Kansuke Ikehara and Aaron Clauset. Characterizing the structural diversity of complex networks across domains. arXiv preprint arXiv:1710.11304, 2017.
- 10. Réka Albert and Albert-László Barabási. Statistical mechanics of complex networks. Reviews of Modern Physics, 74(1):47, 2002.
- 11. Ryan A Rossi and Nesreen K Ahmed. Complex networks are structurally distinguishable by domain. Social Network Analysis and Mining, 9(1):1–13, 2019.
- 12. Ron Milo, Shai Shen-Orr, Shalev Itzkovitz, Nadav Kashtan, Dmitri Chklovskii, and Uri Alon. Network motifs: simple building blocks of complex networks. Science, 298(5594):824–827, 2002.
- 13. Uri Alon. Network motifs: theory and experimental approaches. Nature Reviews Genetics, 8(6):450–461, 2007.
- 14. Nataša Pržulj. Biological network comparison using graphlet degree distribution. Bioinformatics, 23(2):e177–e183, 2007.
- 15. Natasa Pržulj, Derek G Corneil, and Igor Jurisica. Modeling interactome: scale-free or geometric? Bioinformatics, 20(18):3508–3515, 2004.
- 16. Austin R Benson, David F Gleich, and Jure Leskovec. Higher-order organization of complex networks. Science, 353(6295):163–166, 2016.
- 17. Oleksii Kuchaiev, Tijana Milenković, Vesna Memišević, Wayne Hayes, and Nataša Pržulj. Topological network alignment uncovers biological function and phylogeny. Journal of the Royal Society Interface, 7(50):1341–1354, 2010.
- 18. Noël Malod-Dognin, Kristina Ban, and Nataša Pržulj. Unified alignment of protein-protein interaction networks. Scientific reports, 7(1):1–11, 2017.
- 19. Chung-Shou Liao, Kanghao Lu, Michael Baym, Rohit Singh, and Bonnie Berger. Isorankn: spectral methods for global alignment of multiple protein networks. Bioinformatics, 25(12):i253–i258, 2009.
- 20. Jukka-Pekka Onnela, Daniel J Fenn, Stephen Reid, Mason A Porter, Peter J Mucha, Mark D Fricker, and Nick S Jones. Taxonomies of networks from community structure. Physical Review E, 86(3):036104, 2012.
- 21. Damian Szklarczyk, John H Morris, Helen Cook, Michael Kuhn, Stefan Wyder, Milan Simonovic, Alberto Santos, Nadezhda T Doncheva, Alexander Roth, Peer Bork, et al. The string database in 2017: quality-controlled protein–protein association networks, made broadly accessible. Nucleic Acids Research, 45:D362–D368.
- 22. Conrad L Schoch, Stacy Ciufo, Mikhail Domrachev, Carol L Hotton, Sivakumar Kannan, Rogneda Khovanskaya, Detlef Leipe, Richard Mcveigh, Kathleen O’Neill, Barbara Robbertse, et al. Ncbi taxonomy: a comprehensive update on curation, resources and tools. Database, pages 1–21.
- 23. P. Erdös and A. Rényi. On random graphs i. Publicationes Mathematicae Debrecen, 6:290–297, 1959.
- 24. Albert-László Barabási and Réka Albert. Emergence of scaling in random networks. Science, 286(5439):509–512, 1999.
- 25. Tomaž Hočevar and Janez Demšar. A combinatorial approach to graphlet counting. Bioinformatics, 30(4):559–565, 2014.
- 26. Tijana Milenković and Nataša Pržulj. Uncovering biological network function via graphlet degree signatures. Cancer Informatics, 6:CIN–S680, 2008.
- 27. Gábor J Székely, Maria L Rizzo, and Nail K Bakirov. Measuring and testing dependence by correlation of distances. The Annals of Statistics, 35(6):2769–2794, 2007.
- 28. Rolf Apweiler, Amos Bairoch, Cathy H Wu, Winona C Barker, Brigitte Boeckmann, Serenella Ferro, Elisabeth Gasteiger, Hongzhan Huang, Rodrigo Lopez, Michele Magrane, et al. Uniprot: the universal protein knowledgebase. Nucleic Acids Research, 32(suppl_1):D115–D119, 2004.
- 29. Rosa L Figueroa, Qing Zeng-Treitler, Sasikiran Kandula, and Long H Ngo. Predicting sample size required for classification performance. BMC Medical Informatics and Decision Making, 12(1):1–10, 2012.
- 30. Darren Davis, Ömer Nebil Yaveroğlu, Noël Malod-Dognin, Aleksandar Stojmirovic, and Nataša Pržulj. Topology-function conservation in protein–protein interaction networks. Bioinformatics, 31(10):1632–1639, 2015.
- 31. Manoj Pratim Samanta and Shoudan Liang. Predicting protein functions from redundancies in large-scale protein interaction networks. Proceedings of the National Academy of Sciences, 100(22):12579–12583, 2003.
- 32. Connor Clark and Jugal Kalita. A comparison of algorithms for the pairwise alignment of biological networks. Bioinformatics, 30(16):2351–2359, 2014.
- 33. Ömer Nebil Yaveroğlu, Noël Malod-Dognin, Darren Davis, Zoran Levnajic, Vuk Janjic, Rasa Karapandza, Aleksandar Stojmirovic, and Nataša Pržulj. Revealing the hidden language of complex networks. Scientific Reports, 4(1):1–9, 2014.
- 34. Roded Sharan, Silpa Suthram, Ryan M Kelley, Tanja Kuhn, Scott McCuine, Peter Uetz, Taylor Sittler, Richard M Karp, and Trey Ideker. Conserved patterns of protein interaction in multiple species. Proceedings of the National Academy of Sciences, 102(6):1974–1979, 2005.
- 35. Maria A Nohales and Steve A Kay. Molecular mechanisms at the core of the plant circadian oscillator. Nature Structural & Molecular Biology, 23(12):1061–1069, 2016.
- 36. Struhl Kevin. Fundamentally different logic of gene regulation in eukaryotes and prokaryotes. Cell, 98(1):1–4, 1999.
- 37. José M Peregrín-Alvarez, Chris Sanford, and John Parkinson. The conservation and evolutionary modularity of metabolism. Genome Biology, 10(6):1–17, 2009.
- 38. José Manuel Peregrin-Alvarez, Sophia Tsoka, and Christos A Ouzounis. The phylogenetic extent of metabolic enzymes and pathways. Genome research, 13(3):422–427, 2003.
- 39. Christopher Bräsen, Dominik Esser, Bernadette Rauch, and Bettina Siebers. Carbohydrate metabolism in archaea: current insights into unusual enzymes and pathways and their regulation. Microbiology and Molecular Biology Reviews, 78(1):89–175, 2014.
- 40. Frederik Schulz, Emiley A Eloe-Fadrosh, Robert M Bowers, Jessica Jarett, Torben Nielsen, Natalia N Ivanova, Nikos C Kyrpides, and Tanja Woyke. Towards a balanced view of the bacterial tree of life. Microbiome, 5(1):1–6, 2017.
- 41. Naruya Saitou and Masatoshi Nei. The neighbor-joining method: a new method for reconstructing phylogenetic trees. Molecular Biology and Evolution, 4(4):406–425, 1987.
- 42. Waqar Ali, Tiago Rito, Gesine Reinert, Fengzhu Sun, and Charlotte M Deane. Alignment-free protein interaction network comparison. Bioinformatics, 30(17):i430–i437, 2014.
- 43. Ömer Nebil Yaveroğlu, Tijana Milenković, and Nataša Pržulj. Proper evaluation of alignment-free network comparison methods. Bioinformatics, 31(16):2697–2704, 2015.
\li\CommentGenerates a density dependent scale free random graph with \li\Commentn nodes and m edges having average degree \li \li \li \li\CommentSeed generation \li\While \li\Do\For \li\Do \li \End\li \End
Extending the seed \li\While \li\Do \li \li\If \li\Then \li\Else\li \li\If \li\Then \li\Else\li \End\End\li \End