11email: rhc@astro-udec.cl 22institutetext: Max-Planck-Institut für extraterrestische Physik (MPE), Giessenbachstr., D-85748 Garching, Germany 33institutetext: Cavendish Laboratory, University of Cambridge, 19 J.J. Thomson Avenue, Cambridge CB3 0HE, UK 44institutetext: Kavli Institute for Cosmology, University of Cambridge, Madingley Road, Cambridge CB3 0HA, UK 55institutetext: Department of Astronomy, University of Maryland, College Park, MD 20742, USA 66institutetext: Centre for Astrophysics and Supercomputing, Swinburne Univ. of Technology, P.O. Box 218, Hawthorn, VIC 3122, Australia 77institutetext: ARC Centre of Excellence for All Sky Astrophysics in 3 Dimensions (ASTRO 3D), Australia 88institutetext: Max-Planck Institute for Astrophysics, Karl Schwarzschildstrasse 1, D-85748 Garching, Germany 99institutetext: School of Physics and Astronomy, Tel Aviv University, Ramat Aviv 69978, Israel 1010institutetext: Center for Computational Astrophysics, 162 5th Ave., New York, NY, 10010 1111institutetext: National Astronomical Observatory of Japan, 2-21-1 Osawa, Mitaka, Tokyo 181-8588, Japan
Kiloparsec view of a typical star-forming galaxy when the Universe was Gyr old
We present a kinematic analysis of the main-sequence galaxy HZ4 at . Our study is based on deep, spatially resolved observations of the [C ii] 158 m transition obtained with the Atacama Large Millimeter/Submillimeter Array (ALMA). From the combined analysis of the disk morphology, the two-dimensional velocity structure, and forward-modeling of the one-dimensional velocity and velocity dispersion profiles, we conclude that HZ4 has a regular rotating disk in place. The intrinsic velocity dispersion in HZ4 is high ( km s-1), and the ratio between the rotational velocity and the intrinsic velocity dispersion is . These values are consistent with the expectations from the trends of increasing and decreasing as a function of redshift observed in main-sequence galaxies up to . Galaxy evolution models suggest that the high level of turbulence observed in HZ4 can only be achieved if, in addition to stellar feedback, there is radial transport of gas within the disk. Finally, we find that HZ4 is baryon dominated on galactic scales (), with a dark matter fraction at one effective radius of . This value is comparable to the dark matter fractions found in lower redshift galaxies that could be the descendants of HZ4: massive (), star-forming galaxies at , and passive, early type galaxies at .
Key Words.:
Galaxies: high-redshift – ISM – kinematics and dynamics – structure – ISM1 Introduction
The study of galaxy kinematics can provide answers to some of the most fundamental questions about galaxy formation and evolution: How and when do galaxies form their disks? What is the distribution of baryons and dark matter within galaxies? What is the dynamical state of galaxy disks? From early kinematic analyses of nearby galaxies (e.g., Rubin & Ford, 1970; Sofue & Rubin, 2001), to more recent studies of high redshift systems thanks to powerful interferometers and integral-field units (IFU) systems, especially with adaptive optics (e.g., Glazebrook, 2013; Förster Schreiber & Wuyts, 2020), we can now start connecting the kinematic properties of the very early galaxies with their likely descendants.
Based on deep, spatially resolved observations of the H and CO transitions in star-forming galaxies between , we have learned that: (1) the amount of turbulence in the interstellar medium (ISM) —measured by the gas intrinsic velocity dispersion— increases as a function of redshift (e.g., Genzel et al., 2006; Förster Schreiber et al., 2006; Cresci et al., 2009; Kassin et al., 2012; Stott et al., 2016; Johnson et al., 2018; Übler et al., 2019), (2) galaxy disks are more dynamically turbulent (or dynamically hot) at higher redshift, quantified by the ratio between the rotational velocity and the intrinsic velocity dispersion (e.g., Law et al., 2009; Förster Schreiber et al., 2009; Simons et al., 2017; Wisnioski et al., 2015, 2019), and (3) more than half of the massive, star-forming galaxies at are baryon dominated on galactic scales (e.g., Wuyts et al., 2016; Lang et al., 2017; Übler et al., 2018; Genzel et al., 2017, 2020; Price et al., 2021). These observational results point to the importance of stellar feedback, clump formation, and gas transport in the evolution of galaxies (e.g., Dekel et al., 2009; Dekel & Burkert, 2014; Ostriker & Shetty, 2011; Bournaud et al., 2014; Krumholz et al., 2018).
The kinematic properties of star-forming galaxies at remain relatively unexplored. This situation, however, is rapidly changing, thanks to observations of the [C ii] 158 m fine-structure line. The [C ii] transition originates from the collisional excitation of C+ ions by electrons, H2 molecules, and —to the advantage of kinematic studies— H atoms. For now, observations of the H i 21 cm line in high redshift galaxies are out of reach. This makes the [C ii] transition an excellent alternative to trace the outer disk of distant galaxies (e.g., Madden et al., 1993; de Blok et al., 2016; Fujimoto et al., 2019, 2020; Herrera-Camus et al., 2021).
Between , a morpho-kinematic analysis of 29 star-forming galaxies based on [C ii] line observations with modest angular resolution ( or kpc at ), indicates a diversity of kinematic types, including rotators, dispersion dominated systems, and mergers (Jones et al., 2021). This result is confirmed by the handful of spatially-resolved [C ii] observations available of typical star-forming galaxies probing the main-sequence population in the plane at . Evidence for rotating disks has been found in two Lyman break galaxies at (Smit et al., 2018), one absorption-selected galaxy at (Neeleman et al., 2020), and a handful of dusty, star-forming galaxies at (Rizzo et al., 2020, 2021). There are also examples of complex kinematics including a potential interaction between three systems (LBG-1; Riechers et al., 2013), and two massive, star-forming galaxies in the process of merging (Ginolfi et al., 2020). In the near future, ALMA, NOEMA and the James Webb Space Telescope (JWST) will continue contributing to the rapid increase of kinematic studies of high-redshift, star-forming galaxies.
In this letter, we present one of the most complete kinematic analyses to date of a main-sequence, star-forming galaxy at . For this, we use deep, spatially-resolved [C ii] line observations of the star-forming galaxy HZ4 at (, ; Faisst et al., 2020). The observations and the analysis of the morphology, ISM, extended emission (or “halo”), and outflow properties of HZ4 are presented in Herrera-Camus et al. (2021) (hereafter Paper I).
2 Observations and data reduction
For a detailed description of the observations and data reduction we refer to Paper I. HZ4 was observed with ALMA for a total of 8.4 hr (4.7 hr on source) as part of project 2018.1.01605.S (PI Herrera-Camus). The observations were carried out in the C34-4 configuration in Band 7. The data were processed using the Common Astronomy Software Applications package (CASA; McMullin et al., 2007) version 5.6.2. Using the CASA task tclean, Briggs weighting (robust=+0.5), and the Multi-Scale Clean algorithm (Cornwell, 2008), we generated a [C ii] cube with a synthesized beam size of at a position angle of . The velocity resolution of the [C ii] cube is 16 km s-1. This is at least a factor higher than the best spectral resolution that can be achieved in near-infrared observations, so the line spread effect is negligible. The rms noise for the [C ii] cube was 0.15 mJy beam-1 in 16 km s-1 channels.
3 Results and analysis
3.1 Basic kinematic properties
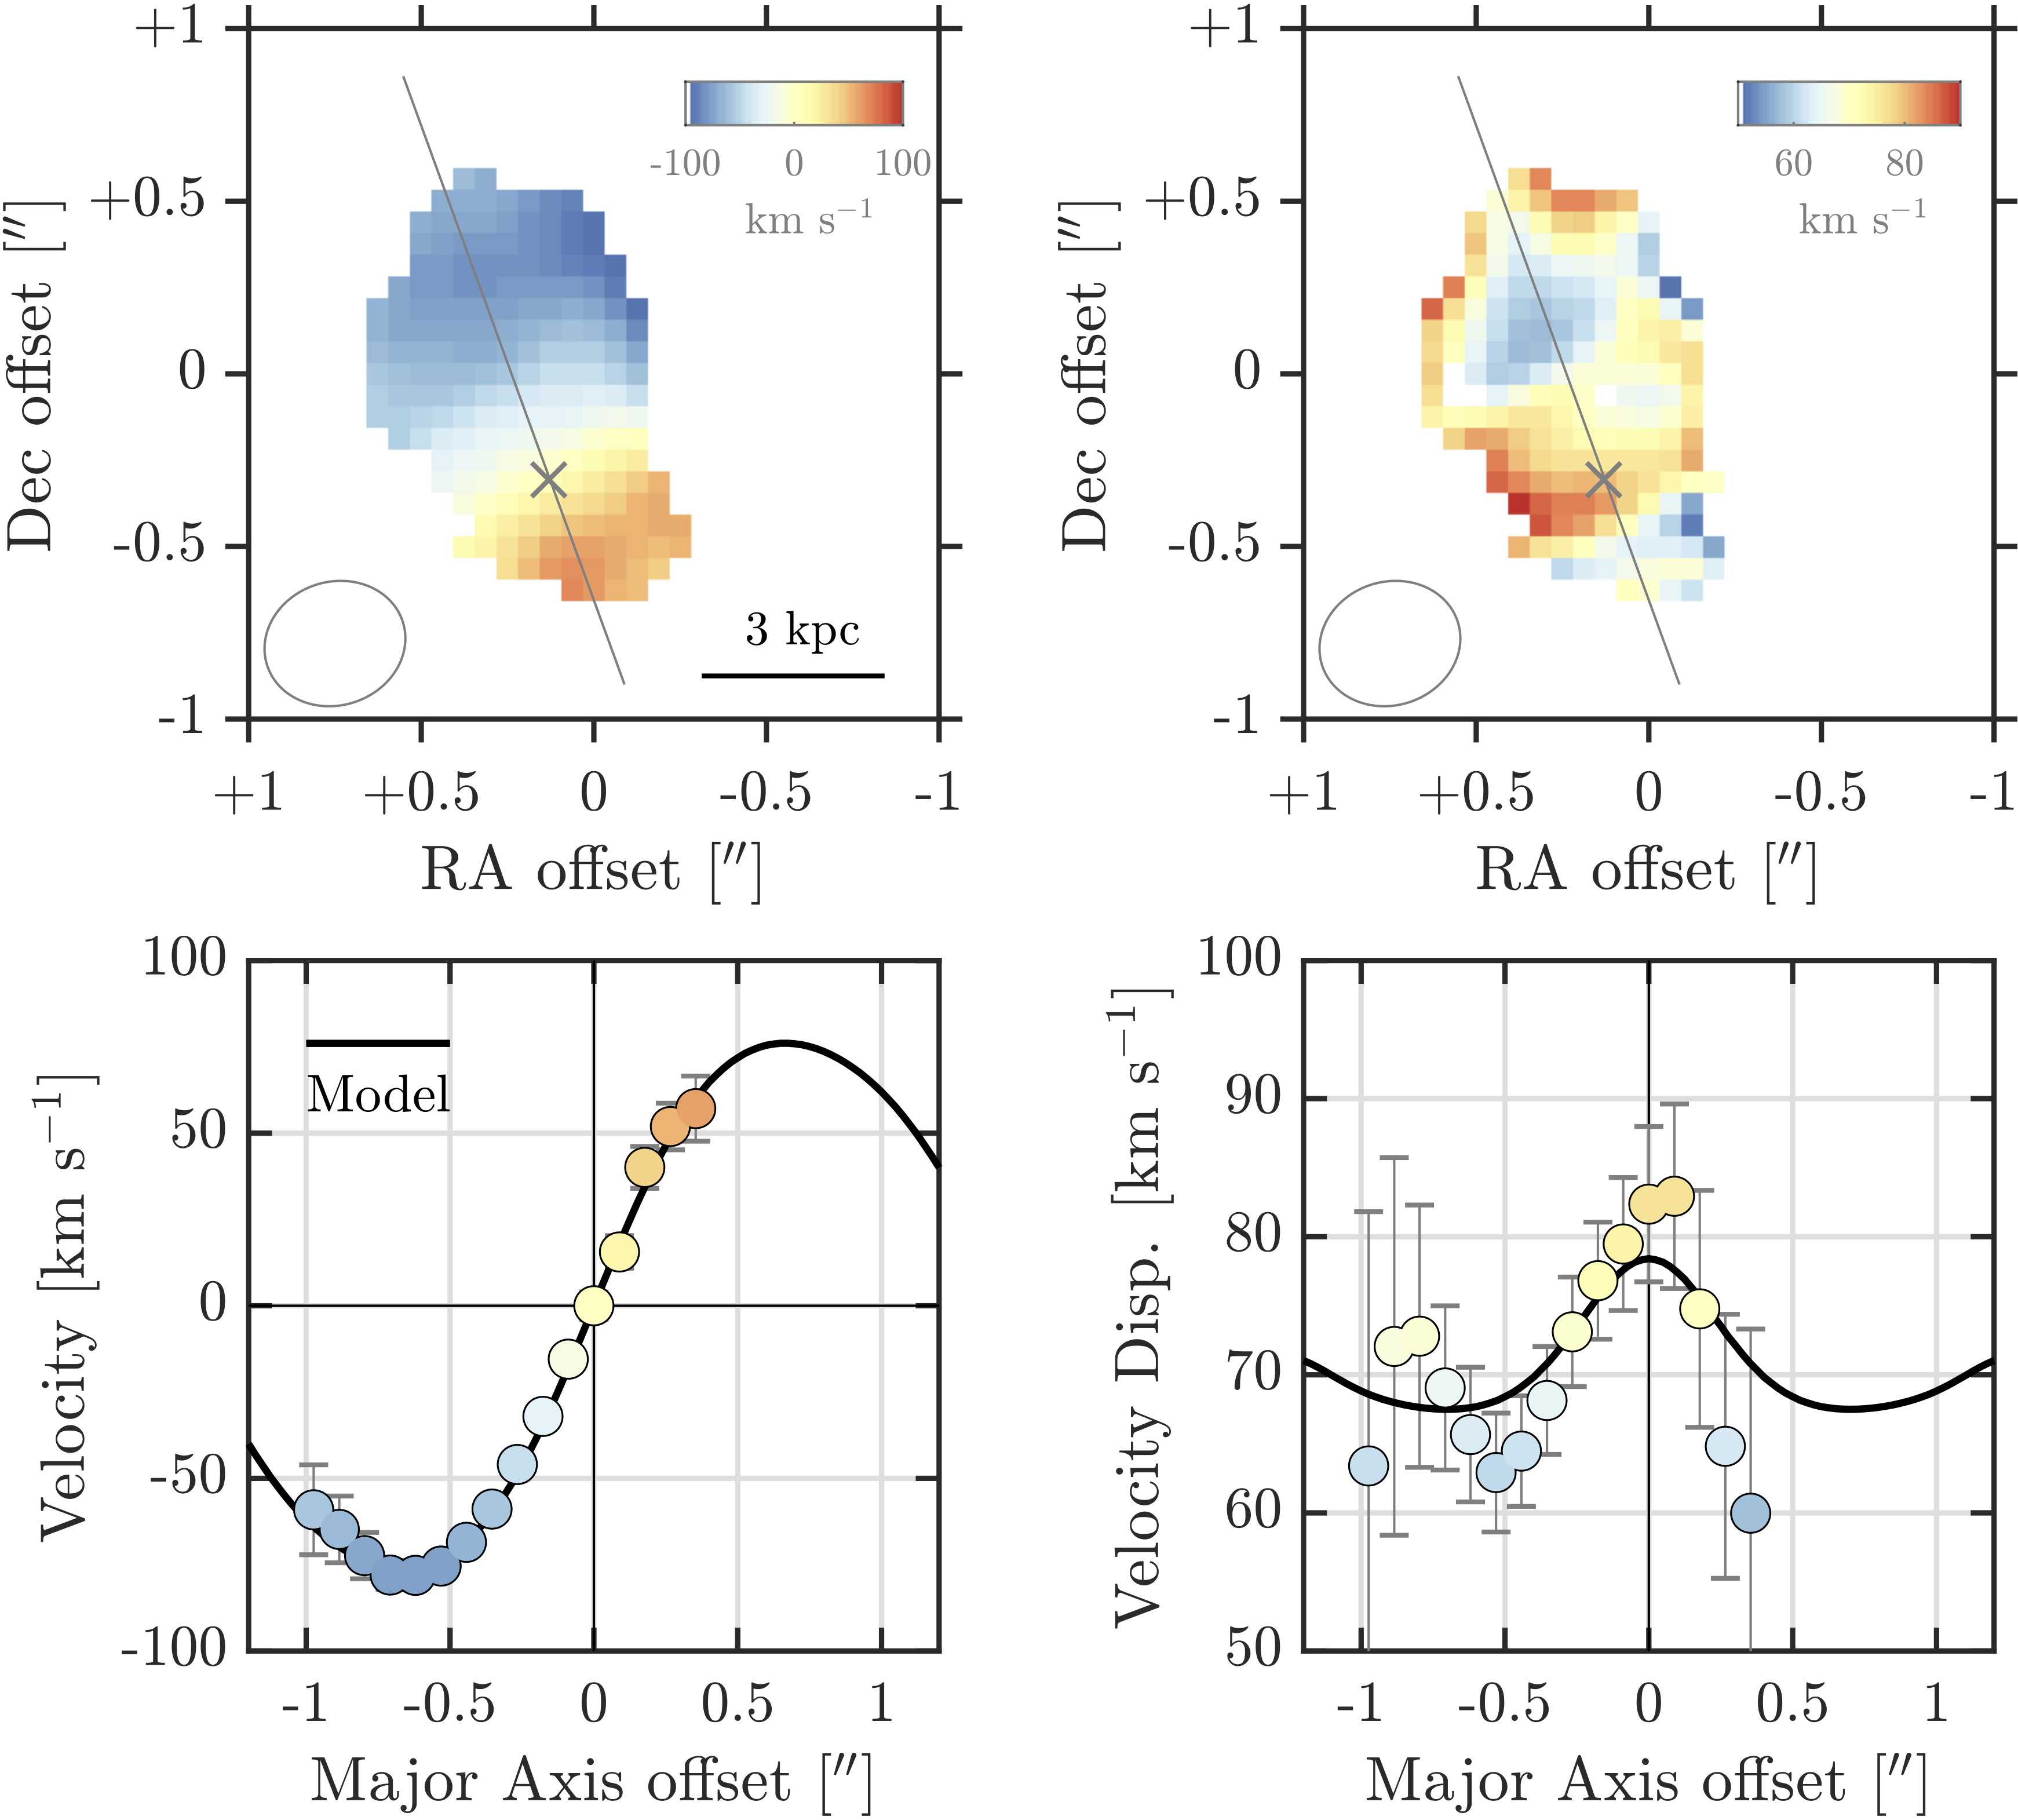
We created 2D kinematic maps of HZ4 by fitting a Gaussian profile to the [C ii] line emission in each pixel and accounting for the systemic velocity. Fig. 1 shows the resulting velocity field (first moment; top-left) and velocity dispersion map (second moment; top right). The kinematic center is defined from the combination of the centrally peaked velocity dispersion and the location of steepest gradient in the velocity field, resulting in the position R.A. +09:58:28.5 and Dec. +02:03:06.3 (shown with a gray cross in Fig. 1). The major kinematic axis is determined from the 2D velocity field as the angle at which the radial velocity profile centered in the kinematic center includes the largest observed velocity difference. This results in a position angle (PA) of measured anti-clockwise from north to the receding side of the galaxy (or measured east of north; shown with a gray line in Fig. 1).
Based on a an initial kinematic analysis, we find that HZ4 fulfills at minimum four main characteristics of a rotating disk as described in Förster Schreiber & Wuyts (2020). First, there is a smooth velocity gradient observed across the galaxy. Second, the kinematic major axis is aligned with the [C ii] morphological major axis (which has a measured east from north, Paper I). Third, HZ4 has a centrally peaked velocity dispersion distribution. Fourth, the kinematic center and the morphological center (see Paper I) are spatially coincident, separated by a projected distance of only ( kpc), which is smaller than the beam size. These basic kinematic properties suggest that HZ4 has a smooth, rotating disk in place at . The modeling and discussion of the kinematics properties of HZ4 are presented in Section 4.
3.2 Rotation curve and velocity dispersion profile
We constructed the rotation curve and velocity dispersion profile from the [C ii] cube by placing 0.4″ diameter apertures (beam size) along the kinematic major axis, separated every 0.1″. We emphasize that for the purpose of our analysis, the major-axis information provides the strongest constraints on the disk models we use (see Section 3.3). The resulting velocity and dispersion profiles are shown in the bottom panels of Fig. 1.
The rotation curve of HZ4 is more extended in the north-east (approaching) side, and reaches out to . This corresponds to a projected physical distance of 6 kpc, or the effective radius (as measured from fitting an exponential disk profile to the integrated [C ii] emission, Paper I). The rotation curve peaks at an observed projected velocity of 80 km s-1 at a distance of from the center, and then drops down to 60 km s-1 at . Dropping rotation curves are also observed in massive, star-forming galaxies at (Genzel et al., 2017; Lang et al., 2017; Genzel et al., 2020). As we discuss in more detail in Section 4, these can be interpreted as the combination of low central dark matter fractions and/or the effect of asymmetric drift due to high intrinsic velocity dispersions (e.g., Burkert et al., 2010).
3.3 Kinematic modeling
We simultaneously model the velocity and velocity dispersion profiles extracted along the major kinematic axis using an updated version of the fully 3D parametric code DYSMAL (Cresci et al., 2009; Davies et al., 2011; Wuyts et al., 2016; Übler et al., 2018; Price et al., 2021). DYSMAL uses a forward modeling approach and accounts for all important observational effects, including spatial beam smearing. The code creates a 3D mass model, forward model to produce a 3D spectroscopy cube, from which we extract the 1D profiles in the same fashion as the observations. These are then compared to the data using an MCMC sampling procedure (EMCEE, Foreman-Mackey et al., 2013). For a detailed and updated description of the DYSMAL code, we refer to Price et al. (2021).
We model HZ4 as a thick, turbulent disk embedded in a dark matter halo that follows a NFW profile (Navarro et al., 1996) and has a halo mass and a concentration parameter . For the galaxy, we assume an exponential disk with effective radius . These are reasonable assumptions based on the analysis of the integrated [C ii] line emission in Paper I. DYSMAL calculations are based on the assumed shape of the baryon distribution. Then the code differentiate between the circular velocity from the baryon distribution and the NFW profile. We also assume an intrinsic velocity dispersion () that is constant and isotropic throughout the disk. The model includes an asymmetric drift correction to the model circular velocity due to pressure support following Burkert et al. (2010).
Free parameters in our modeling are the total baryonic mass (), the effective radius , the intrinsic velocity dispersion , and the enclosed dark matter fraction within one effective radius (). The latter is measured as the squared ratio between the dark matter () and total () intrinsic circular velocities measured at , i.e., . For the total baryonic mass, we choose a Gaussian prior bounded in the range dex with a standard deviation of 0.2 dex, and centered at the expected baryonic mass derived from the sum of the stellar (; Faisst et al., 2020) and gas mass assuming a gas fraction of (e.g., Dessauges-Zavadsky et al., 2020). For the effective radius we also assume a Gaussian prior bounded in the range kpc and centered at a value of kpc following the results from Paper I. For the intrinsic velocity dispersion and the dark matter fraction, we adopt flat bounded priors of km s-1 and , respectively.
Given the difficulty to simultaneously fit for more parameters due to the resolution and S/N of the data, we fix: (1) the kinematic center and position angle, as described in Section 3.1; (2) the inclination to , based on the morphology of the ALMA [C ii] line data (Paper I) and assuming a ratio of scale height to scale length of thickness ; and (3) the halo concentration parameter, , typical for the redshift and halo mass of HZ4 according to Dutton & Macciò (2014).
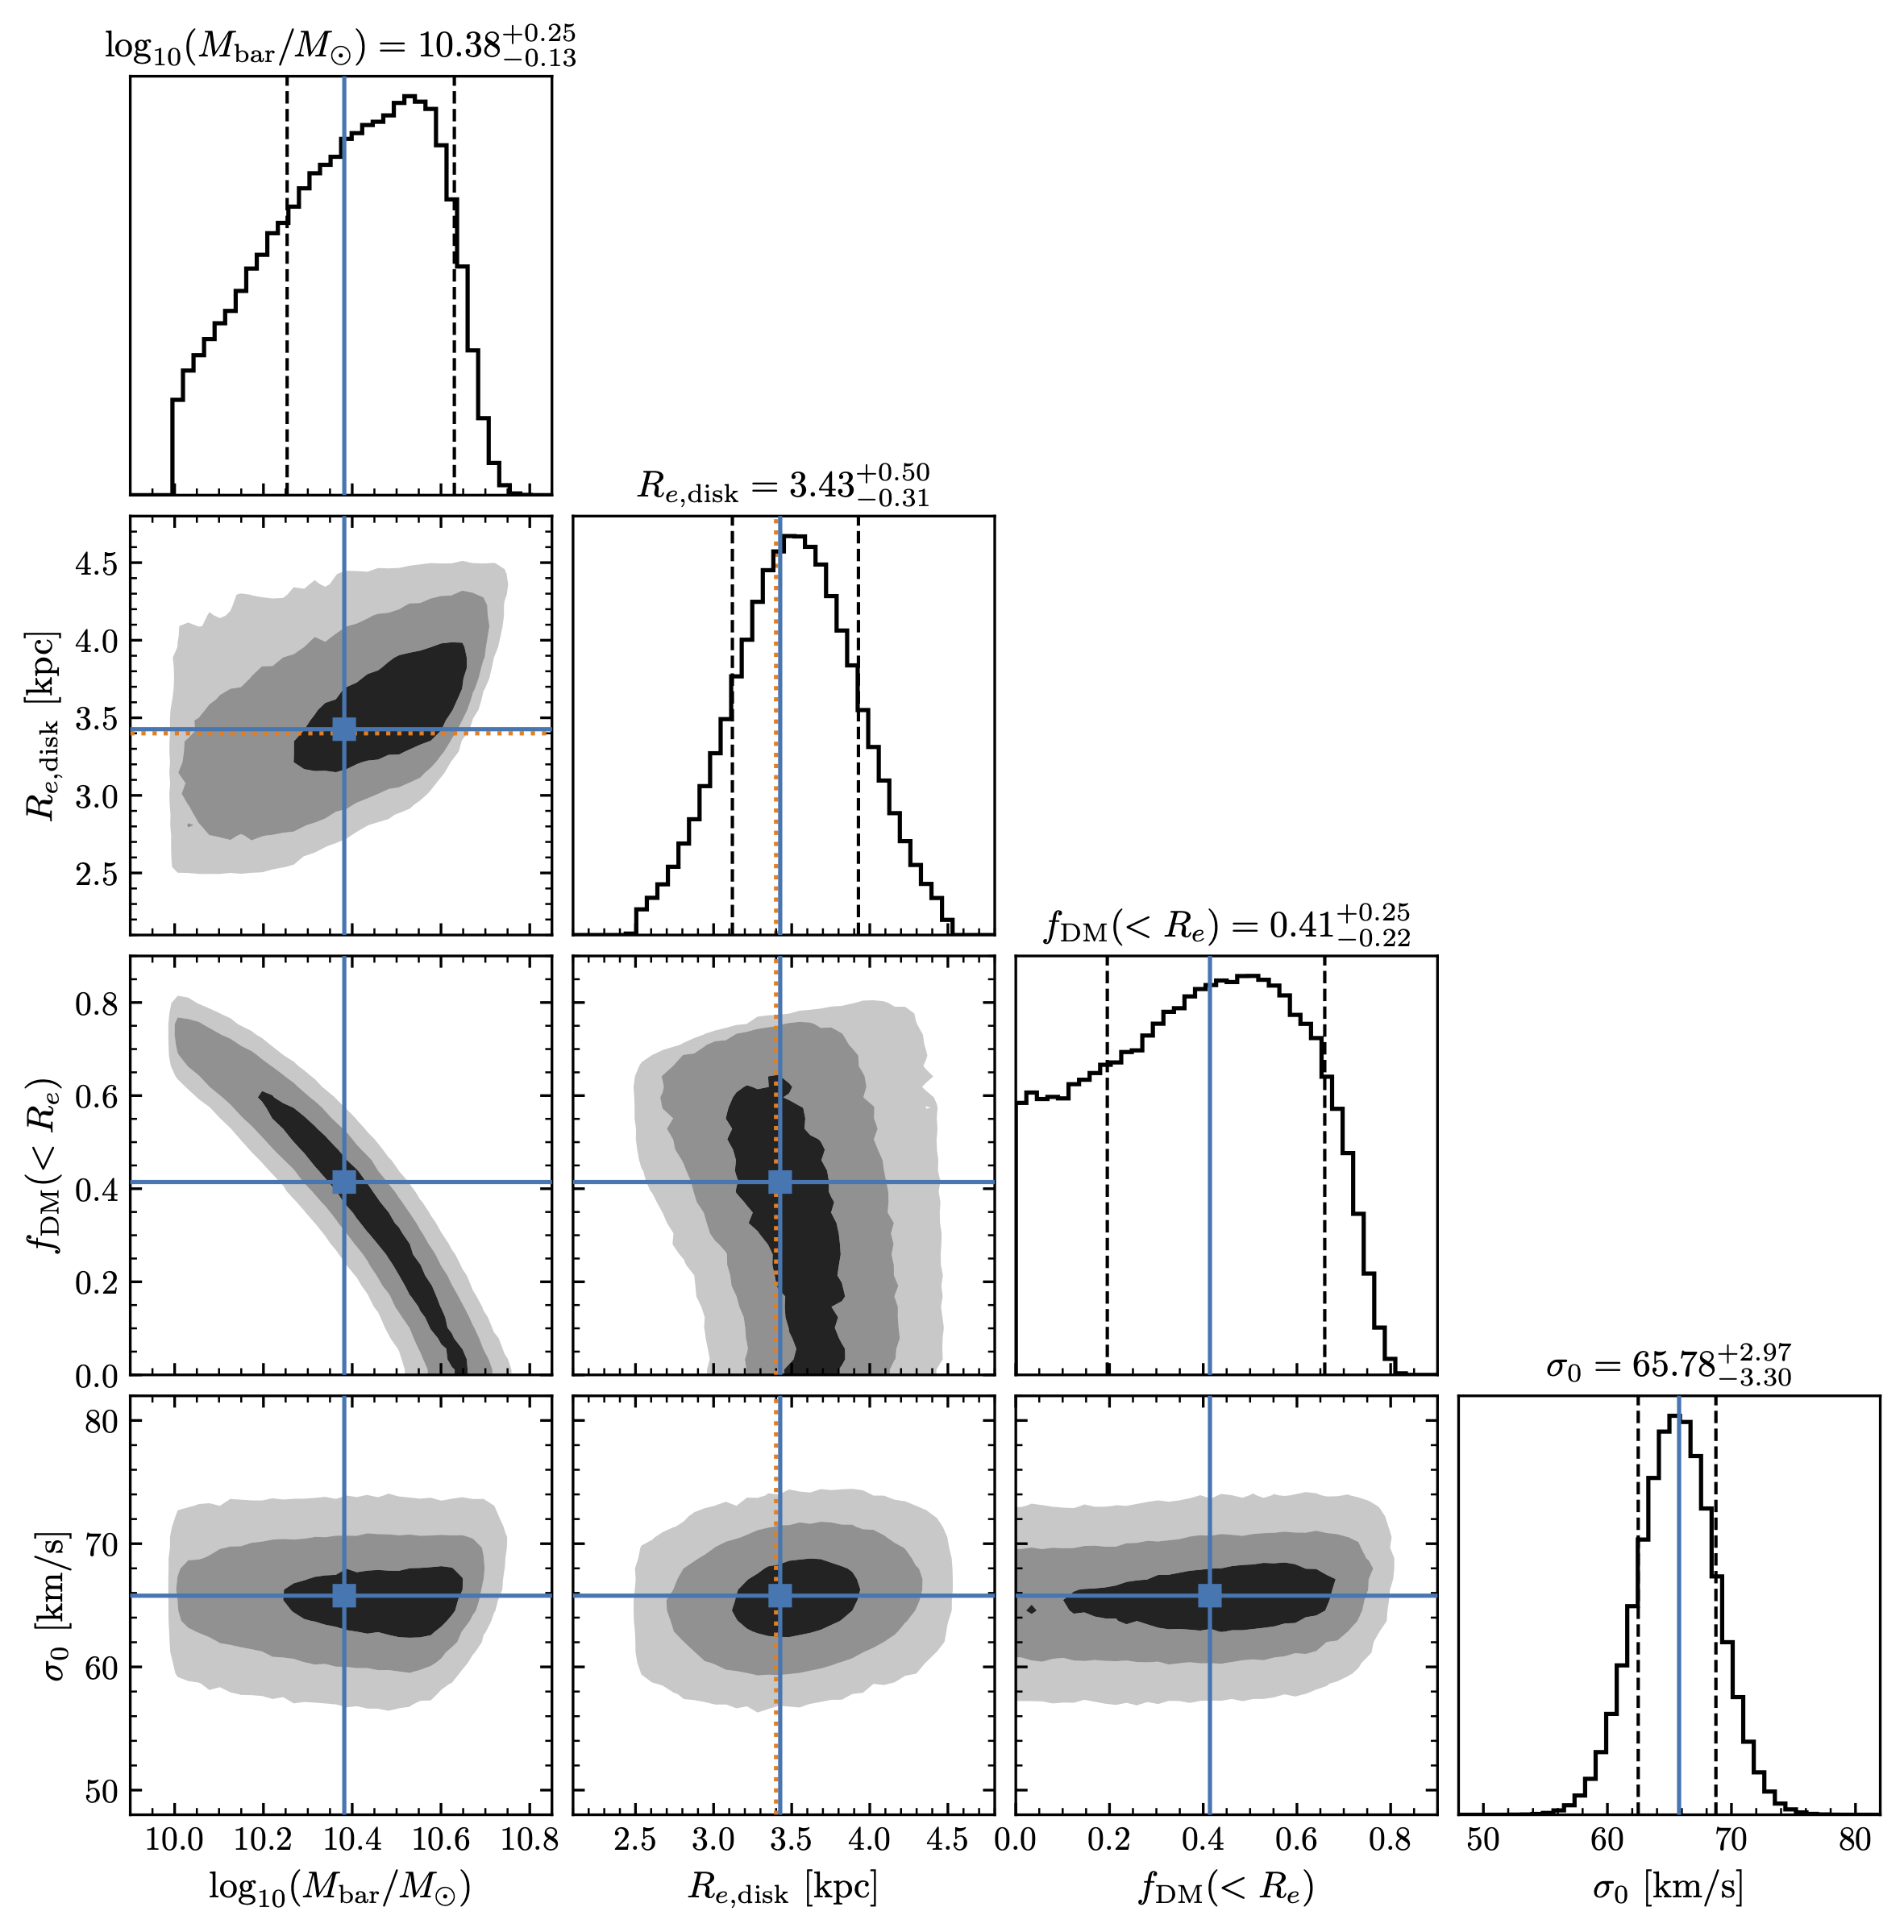
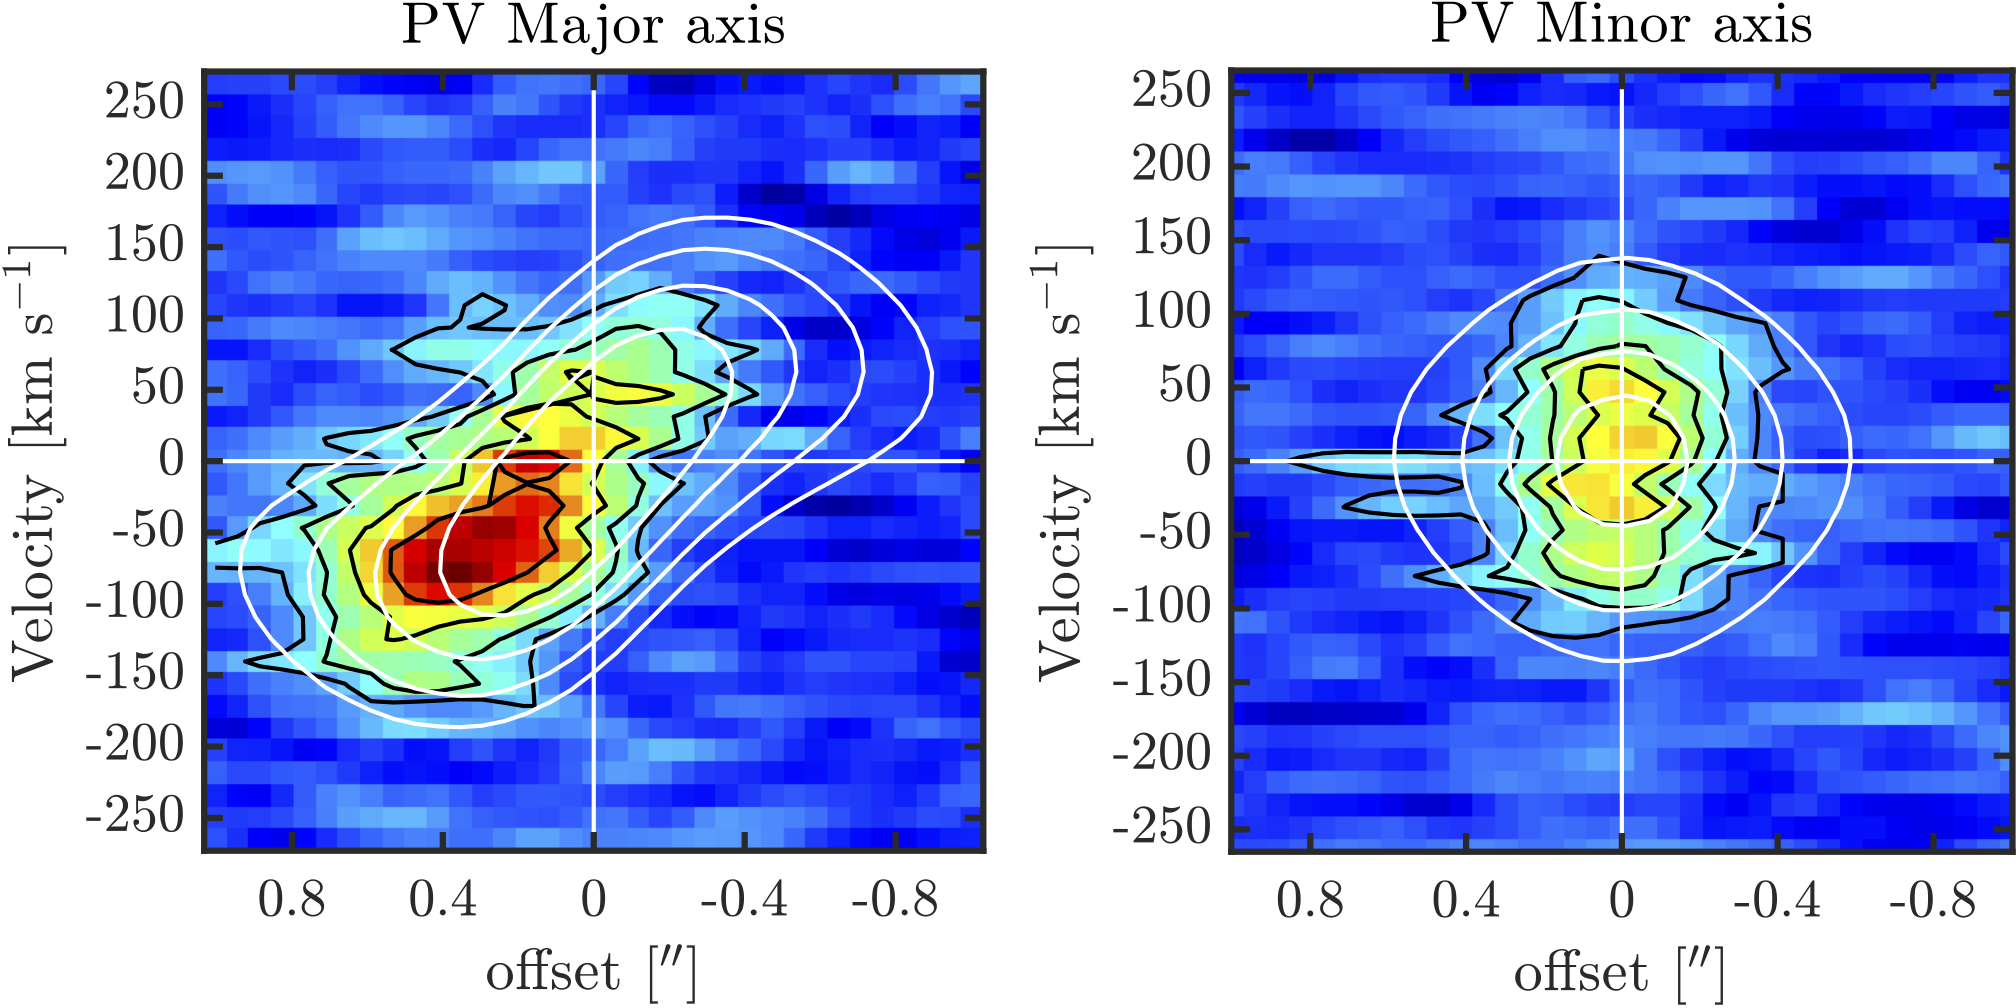
The MCMC code is run using 800 walkers, a burn-in phase of 800 steps, and a running phase of 5000 steps. Fig. 5 in Appendix A shows the MCMC sampling of the joint posterior probability distribution (or “corner plot”). The maximum a posteriori values of the free parameters (found by jointly analyzing the posteriors of all free parameters) are: , kpc, , and km s-1. We consider these parameters as the model that best describe our data. The corresponding model velocity and velocity dispersion profiles in the observed space are shown as black solid lines in Fig. 1. In addition, Fig. 6 in Appendix B shows the position-velocity diagram of HZ4 and the best-fit DYSMAL model cube extracted along the major and minor kinematic axes.
The model-derived effective radius is comparable to that measured from the exponential profile fit to the integrated [C ii] emission (Paper I), and the resulting baryonic mass translates into a high model-based gas fraction of , comparable to the mean [C ii]-based gas mass fraction measured in main-sequence, star-forming galaxies between (Dessauges-Zavadsky et al., 2020).
If we vary the assumption of the inclination by , we observe a similar variation in the derived baryonic mass and the dark-matter fraction. Also, if we fix kpc (Paper I), and let the inclination free with a Gaussian prior centered at and bounded in the range , then the model-derived inclination results deg, an the dark-matter fraction is , consistent with the results from the fixed-inclination model.
4 Discussion
4.1 Velocity dispersion and disk stability over cosmic time
The intrinsic gas velocity dispersion of main-sequence star-forming galaxies has been observed to increase as a function of redshift at least up to (e.g, Förster Schreiber et al., 2006; Kassin et al., 2007; Genzel et al., 2011; Wisnioski et al., 2015; Turner et al., 2017; Simons et al., 2017; Johnson et al., 2018; Übler et al., 2019; Livermore et al., 2015). This evolution is consistent with the observed increase in the molecular gas fractions with redshift (e.g., Tacconi et al., 2020): if galaxy disks grow in a marginally stable equilibrium state with Toomre parameter , then it is expected that (e.g., Genzel et al., 2011; Glazebrook, 2013; Wisnioski et al., 2015).
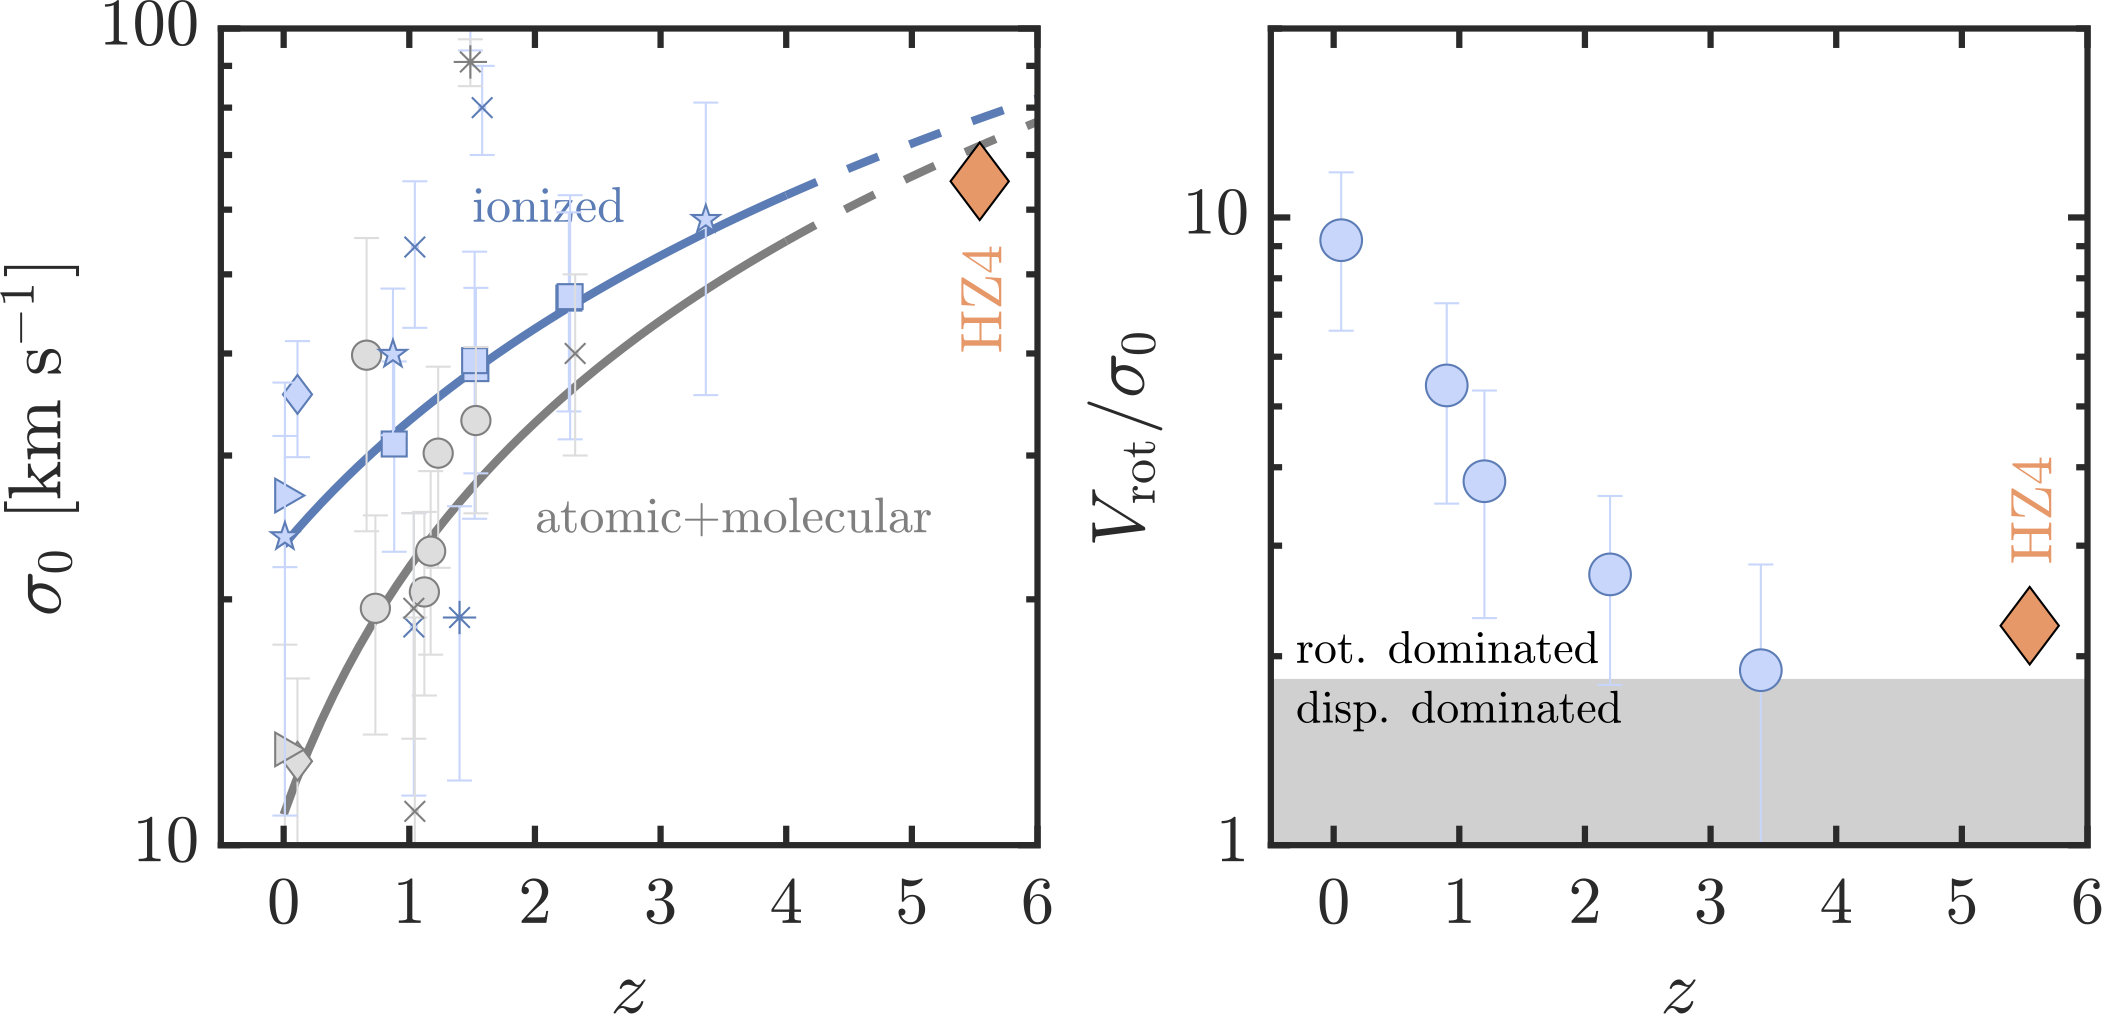
Fig. 2 shows the evolution of observed in main-sequence galaxies as a function of redshift. The points correspond to the averages of several galaxy surveys and individual measurements in the ionized and atomic and/or molecular gas, measured and/or compiled by Übler et al. (2019). The high intrinsic velocity dispersion inferred from the kinematic modeling of HZ4 ( km s-1) is consistent with the extrapolation up to redshift of the scaling relations derived for main-sequence galaxies. This is in line with the expectations from the observed increase of the cold gas fraction with redshift (Tacconi et al., 2018, 2020), of which HZ4 is no exception with a cold gas mass fraction of at .
is a measure of the dynamical support contributed by rotation versus random motions. We infer from the kinematic modeling a value of . As the right panel of Fig. 2 shows, this value is consistent with the evolution observed in main-sequence galaxies (Wisnioski et al., 2015, 2019, and references therein), and is above the threshold assumed for equal contribution to the dynamical support of disks from rotation and random motions (; e.g., Förster Schreiber & Wuyts, 2020). The value measured in HZ4, combined with the basic kinematic properties discussed in Section 3.1, provide one of the most compelling pieces of evidence to date of the existence of regular rotating disks when the Universe was only Gyr old.
To date, there are a handful of studies that find evidence for rotating disks in the early universe (e.g., Smit et al., 2018; Neeleman et al., 2020; Lelli et al., 2021; Rizzo et al., 2020, 2021). Interestingly, studies from Lelli et al. (2021), Rizzo et al. (2021) and Fraternali et al. (2021) conclude that the dusty starbursts in their samples are dynamically cold, with values in the range. As opposed to the case of HZ4, these values are significantly above the expectations from the observed evolution of for main-sequence galaxies in the range (see Fig. 2). These differences could indeed reflect in part the different nature of the sources, with most of the Rizzo et al. (2021), Lelli et al. (2021) and Fraternali et al. (2021) targets (6 of 8) lying at least an order of magnitude above the main-sequence and being typically very compact compared to HZ4 and other galaxies close to the main-sequence. We caution however that direct comparisons are also complicated by the different modeling approaches between the studies, and notably in the parameterization (radially constant in this work, exponentially decreasing in the Rizzo et al. (2020, 2021) work).
4.2 Dark matter fraction on galactic scales
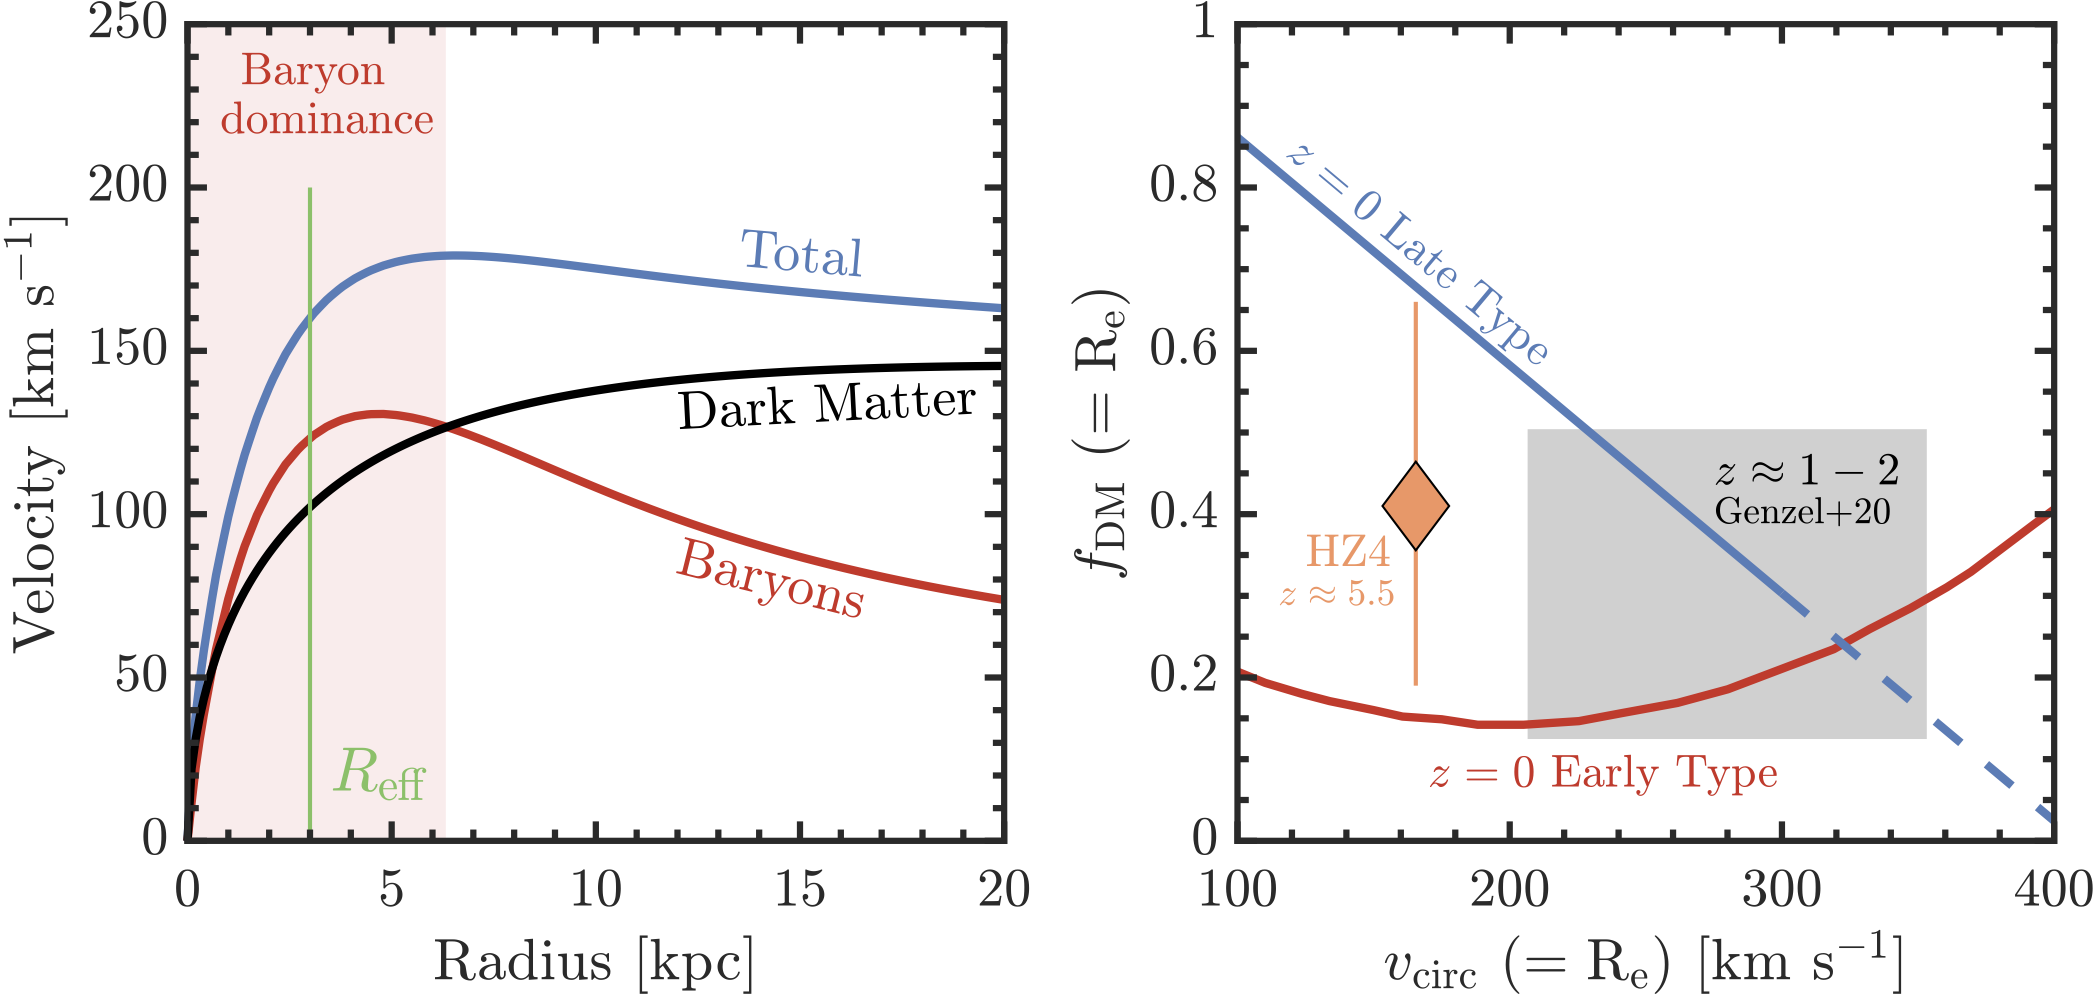
Recent observational evidence shows that a large fraction of massive, star-forming galaxies at are strongly baryon-dominated on galactic scales (e.g., Wuyts et al., 2016; Übler et al., 2018; Genzel et al., 2017, 2020; Price et al., 2021). Measuring dark matter fractions requires well-sampled rotation curves that extend beyond the effective and turnover radius. Up to , these outer rotation curves have been obtained mainly by observations of the H and CO transitions. In the case of HZ4, our deep [C ii] line observations allow us to trace the rotation curve beyond the turnover point (), and as far as . This enables a robust decomposition of the baryonic and dark-matter components of the rotation curve based on our DYSMAL analysis.
Fig. 3 (left) shows the intrinsic (inclination corrected) baryonic, dark matter, and total circular velocity profile of HZ4. The effective radius is shown with a green vertical line. We find that HZ4 is baryon-dominated within , and the baryon dominance prevails out to . The right panel of Fig. 3 shows the ) of HZ4 in context with other galaxy populations. The blue line shows the best fit to the late type galaxies111The fit to late-type galaxies from Genzel et al. (2020) (and references therein) corresponds to: .. While low-mass galaxies tend to be dark-matter dominated, more massive disks have lower dark matter fractions. The red line shows the best fit to passive, early type galaxies at , which are strongly baryon dominated within one (Cappellari, 2016). The gray box shows the mean ( the standard deviation around the mean) of the dark matter fraction measured in 41 massive (), main-sequence galaxies at (Genzel et al., 2020).
At the same , and noting the time difference in evolution of Gyr, HZ4 has a dark matter fraction in between the values from late-type (dark matter dominated) and early-type (baryon dominated) galaxies at , and comparable to the mean value found in more massive (), star-forming galaxies at . This is interesting because, from an abundance-matching perspective (e.g., Hill et al., 2017), the progenitors of the baryon-dominated, massive galaxies at are galaxies at , the stellar mass of HZ4. Could it be then that the baryon dominance observed in massive, star-forming galaxies at cosmic noon is already in place at ? This is a possibility, as the central dark-matter fraction of massive star-forming galaxies at , and their likely early-type descendants at , is comparable (e.g., Übler et al., 2018; Genzel et al., 2017, 2020). This result is also supported by the Illustris-TNG simulations, that find only a mild evolution with redshift of the dark-mater fraction on galactic scales for a fixed stellar mass (Lovell et al., 2018). In fact, TNG-galaxies at with a similar stellar mass than HZ4 have a mean dark-matter fraction within one stellar half mass radius of , and this value only increases by as galaxies grow to a stellar mass of at .
4.3 Comparison to galaxy evolution models including feedback and gravity
The high intrinsic velocity dispersion in HZ4 is consistent with the observed trends of increasing velocity dispersion with redshift. The turbulence in these high- galactic disks is expected to be primarily driven by thermal and momentum feedback from massive stars and supernovae (e.g., Ostriker & Shetty, 2011; Shetty & Ostriker, 2012), clump formation, and radial gas transport (e.g., Dekel et al., 2009; Dekel & Burkert, 2014; Bournaud et al., 2014; Krumholz et al., 2018).
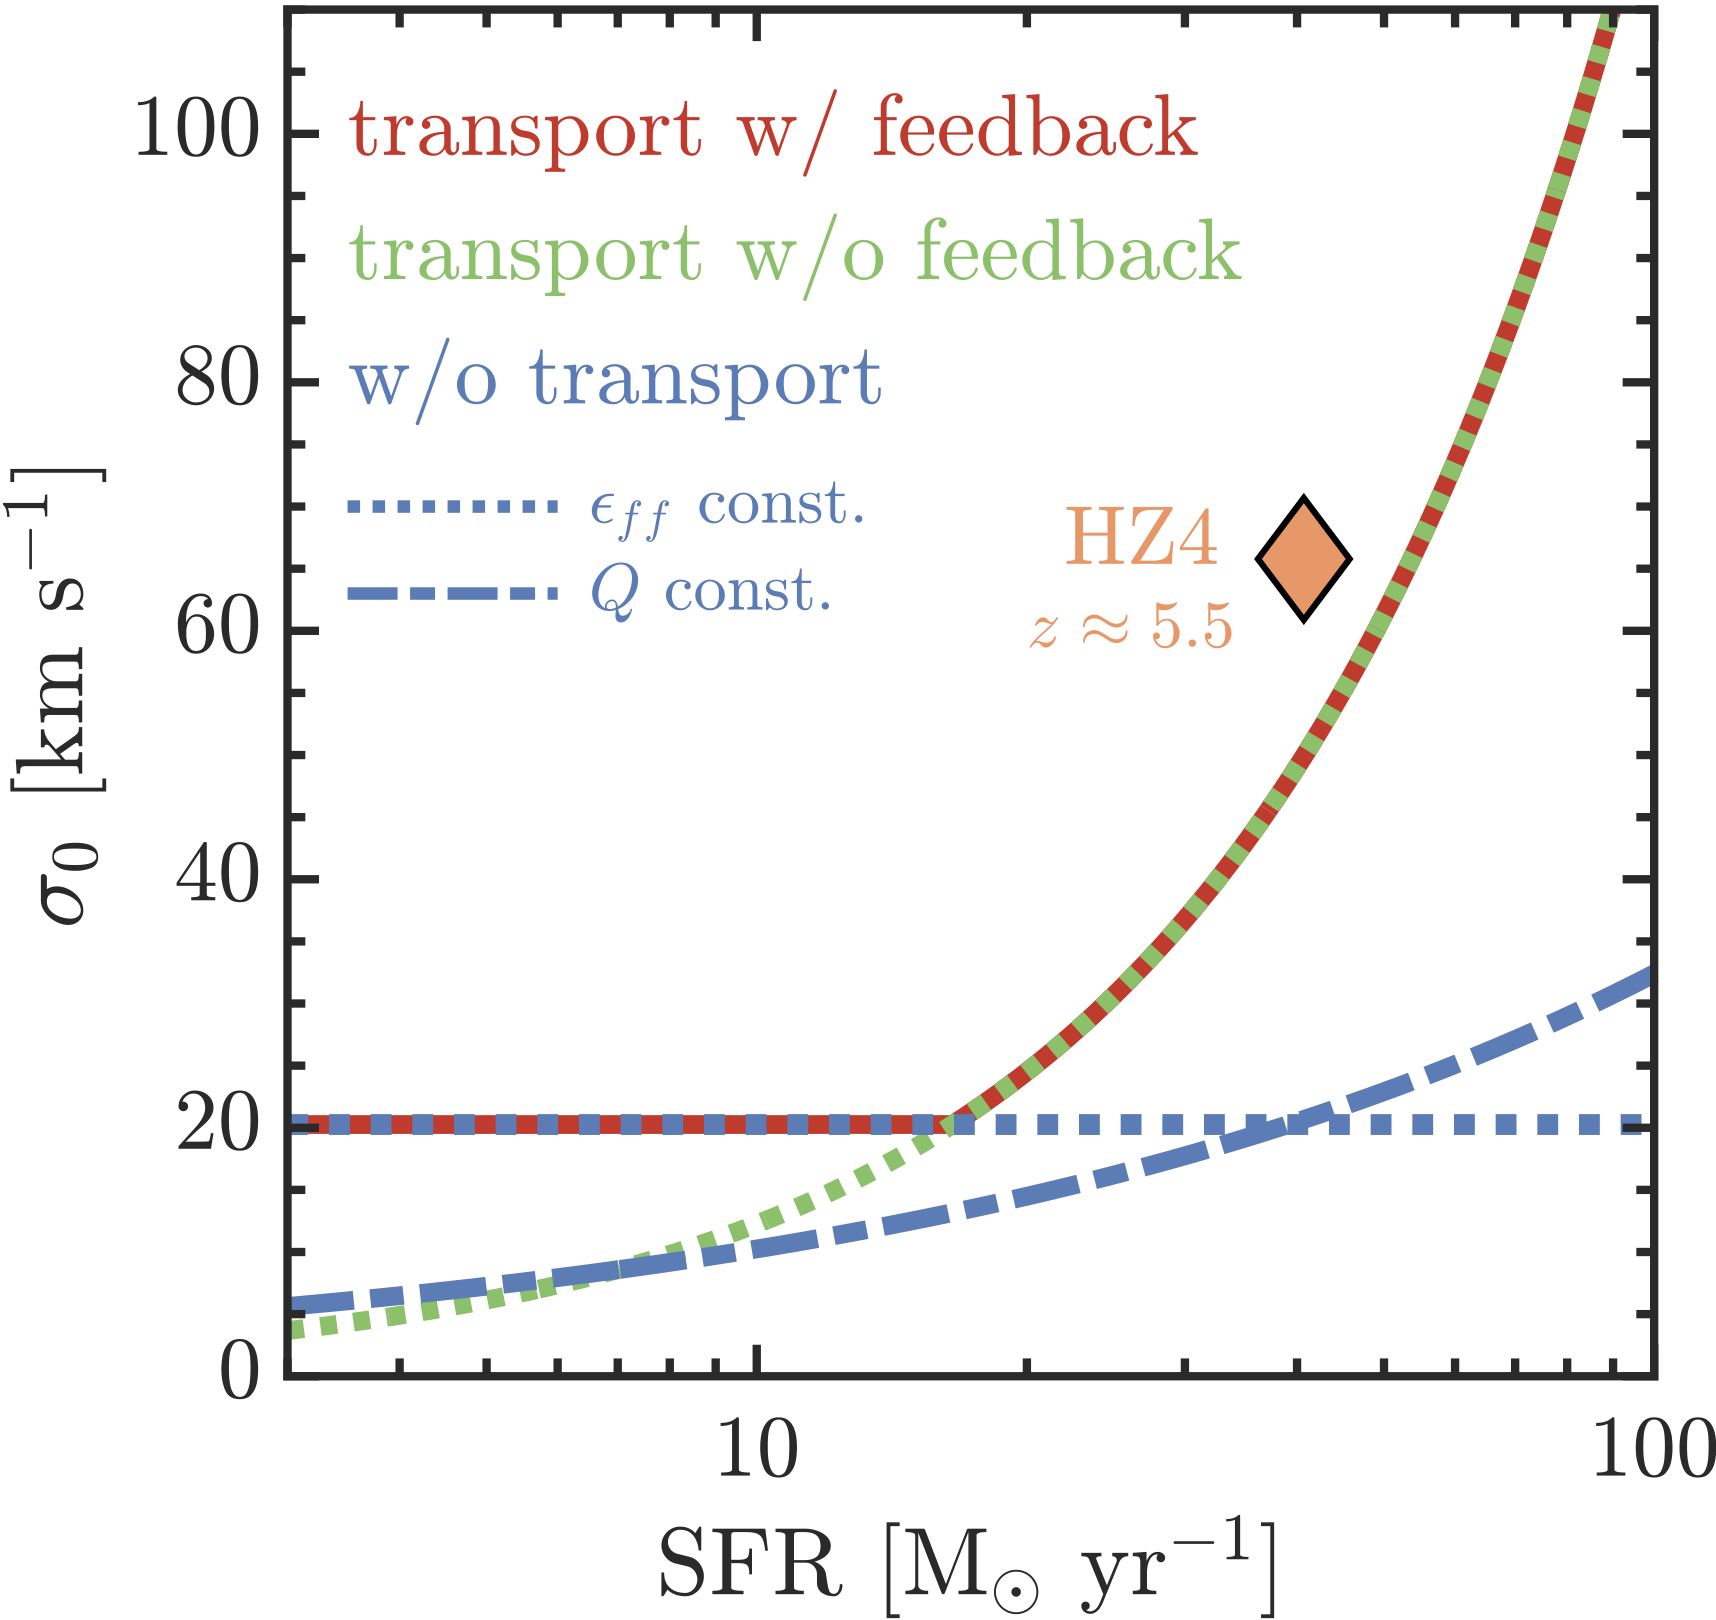
Here we investigate what processes are responsible for the high intrinsic velocity dispersion observed in HZ4 using the state-of-the-art analytical model of galaxy evolution by Krumholz et al. (2018). One of the advantages of the Krumholz et al. (2018) model is that it unifies the effect of star formation feedback and radial transport in driving the turbulence in galactic disks. We consider four model scenarios: (1) gas transport plus stellar feedback, (2) gas transport without stellar feedback, and two additional models of stellar feedback without gas transport, assuming (3) a fixed star formation efficiency per free-fall time (), and (4) a fixed Toomre parameter . 222As described in Krumholz et al. (2018), model (3) is similar to the model described by Ostriker & Shetty (2011), and model (4) is similar to the one proposed by Faucher-Giguère et al. (2013) Finally, for comparison with HZ4, we choose a set of parameters in the Krumholz et al. (2018) model that are representative of high- galaxies. These include a total circular velocity of 200 km s-1 measured at a distance of 5 kpc, and a molecular gas fraction of , in good agreement with HZ4.
Fig. 4 shows the comparison between the measured and SFR in HZ4, and the predictions from the four Krumholz et al. (2018) models. The blue lines correspond to the models that only consider stellar feedback. In the case is fixed (dotted line), the model predicts a constant of km s-1. If is fixed (dashed line), there is no floor, but only mildly increases with star formation activity. In both cases, stellar feedback alone is not capable of reproducing the high turbulence observed in HZ4. The situation is completely different with models that include radial transport of gas. The red and green lines show such models with and without including stellar feedback, respectively. For , the main difference between the two models is the floor of about km s-1 in the case where stellar feedback is included. For , both models are identical, and increases rapidly with SFR. At the SFR of HZ4, the radial transport models reproduce remarkably well the high measured in the system.
One of the consequences of gas richness and efficient radial transport of gas and clumps inward is the formation of massive bulges, and the increase in nuclear gas outflows powered by central starbursts and active galactic nuclei (e.g., Elmegreen et al., 2008; Dekel & Krumholz, 2013; Bournaud et al., 2014; Ceverino et al., 2015). In that sense, the presence of migrating gas in HZ4 suggested by the Krumholz et al. (2018) models is consistent with the low dark matter fraction measured in the inner disk, and with the evidence of a centrally driven outflow (Paper I).
5 Conclusions
We have obtained deep, kiloparsec-scale resolution ALMA observations in the [C ii] 158 m transition of HZ4, a main-sequence galaxy at . The results are presented in two papers. In the first one (Paper I; Herrera-Camus et al., 2021) we analyzed the interstellar medium, outflow, and halo properties of the system. Here, we focus on the kinematics. The main results can be summarized as follows:
-
•
Evidence for a regular rotating disk at : We analyze the disk kinematics of HZ4 based on the 2D kinematic structure and the 1D kinematic profile extracted along the major kinematic axis (Fig. 1). We simultaneously model the rotation curve and the velocity dispersion profile using the fully forward-modeling 3D kinematic code DYSMAL, which takes into account important observational effects such as beam smearing. We measure an intrinsic velocity dispersion of km s-1 and . The latter, combined with the smooth, monotonic velocity gradient observed across the galaxy, the alignment between the morphological and kinematic major axis, and a centrally peaked velocity dispersion profile, strongly suggests that HZ4 has a regular rotating disk already in place at , when the Universe was only Gyr old.
-
•
High intrinsic velocity dispersion and the importance of radial transport: The high intrinsic velocity dispersion () measured in HZ4 is in agreement with the trends of increasing with redshift observed in main-sequence galaxies up to (Fig. 2). It is also expected from the high (model-based) cold gas mass fraction measured in the system (). To identify the processes responsible for the high level of turbulence in the disk of HZ4, we use the analytic galaxy evolution models of Krumholz et al. (2018) that consider contribution to the disk turbulence by stellar feedback and radial transport. We find that only the models that include radial transport of gas are capable of reproducing the high intrinsic velocity dispersion observed in HZ4 (Fig. 4).
-
•
Low dark matter fraction on galactic scales: The [C ii] rotation curve in HZ4 extends out to 1″( kpc), which corresponds to (Fig. 1). The rotation curve peaks at and then drops. From the analysis of the contribution of baryons and dark-matter to the intrinsic rotation curve, we find that HZ4 is baryon-dominated on galactic scales, with a dark-matter fraction at the effective radius of (Fig. 3). This low dark-matter fraction is comparable to that found in systems that could be the descendants of HZ4: massive (), star forming galaxies at (e.g, Genzel et al., 2020), and passive, early-type galaxies at (e.g, Cappellari, 2016).
Future spatially-resolved kinematics surveys of the main-sequence galaxy population at are needed to draw statistically significant conclusions. This will be possible thanks to observations of the ionized gas with the James Webb Space Telescope, and upcoming surveys of the cold gas using the [C ii] transition such as the recently approved ALMA Cycle 8 Large Program CRISTAL.333https://www.alma-cristal.info
Acknowledgements.
We thank the referee for very useful comments and suggestions that improved the manuscript. R.H.-C. thanks the Max Planck Society for support under the Partner Group project ”The Baryon Cycle in Galaxies” between the Max Planck for Extraterrestrial Physics and the Universidad de Concepción. R.H-C also acknowledge financial support from Millenium Nucleus NCN19058 (TITANs) and support by the ANID BASAL projects ACE210002 and FB210003. HÜ gratefully acknowledges support by the Isaac Newton Trust and by the Kavli Foundation through a Newton-Kavli Junior Fellowship.Appendix A DYSMAL analysis – MCMC joint posterior distribution
As described in Section 3.3, we model the kinematics of HZ4 using the DYSMAL code (Cresci et al., 2009; Davies et al., 2011; Wuyts et al., 2016; Price et al., 2021). DYSMAL explores the parameter space based on a MCMC sampling using the EMCEE package (Foreman-Mackey et al., 2013). In our modeling the free parameters are: the total baryonic mass, the effective radius, the dark matter fraction, and the intrinsic velocity dispersion . Fig. 5 shows the resulting joint posterior probability distributions of the model parameters (or “corner plot”).
Appendix B Position-velocity diagram
As discussed in Section 3.3, we use the DYSMAL kinematic code to model the 1D kinematics of HZ4. Fig. 6 shows the position-velocity diagram of HZ4 and the resulting best-fit DYSMAL model cube extracted along the major () and minor kinematic axes.
References
- Bolatto et al. (2017a) Bolatto, A. D., Wong, T., Utomo, D., et al. 2017a, ApJ, 846, 159
- Bolatto et al. (2017b) Bolatto, A. D., Wong, T., Utomo, D., et al. 2017b, ApJ, 846, 159
- Bournaud et al. (2014) Bournaud, F., Perret, V., Renaud, F., et al. 2014, ApJ, 780, 57
- Burkert et al. (2010) Burkert, A., Genzel, R., Bouché, N., et al. 2010, ApJ, 725, 2324
- Cappellari (2016) Cappellari, M. 2016, ARA&A, 54, 597
- Ceverino et al. (2015) Ceverino, D., Dekel, A., Tweed, D., & Primack, J. 2015, MNRAS, 447, 3291
- Cornwell (2008) Cornwell, T. J. 2008, IEEE Journal of Selected Topics in Signal Processing, 2, 793
- Cresci et al. (2009) Cresci, G., Hicks, E. K. S., Genzel, R., et al. 2009, ApJ, 697, 115
- Davies et al. (2011) Davies, R., Förster Schreiber, N. M., Cresci, G., et al. 2011, ApJ, 741, 69
- de Blok et al. (2016) de Blok, W. J. G., Walter, F., Smith, J. D. T., et al. 2016, AJ, 152, 51
- Dekel & Burkert (2014) Dekel, A. & Burkert, A. 2014, MNRAS, 438, 1870
- Dekel & Krumholz (2013) Dekel, A. & Krumholz, M. R. 2013, MNRAS, 432, 455
- Dekel et al. (2009) Dekel, A., Sari, R., & Ceverino, D. 2009, ApJ, 703, 785
- Dessauges-Zavadsky et al. (2020) Dessauges-Zavadsky, M., Ginolfi, M., Pozzi, F., et al. 2020, arXiv e-prints, arXiv:2004.10771
- Dutton & Macciò (2014) Dutton, A. A. & Macciò, A. V. 2014, MNRAS, 441, 3359
- Elmegreen et al. (2008) Elmegreen, B. G., Bournaud, F., & Elmegreen, D. M. 2008, ApJ, 688, 67
- Epinat et al. (2010) Epinat, B., Amram, P., Balkowski, C., & Marcelin, M. 2010, MNRAS, 401, 2113
- Faisst et al. (2020) Faisst, A. L., Schaerer, D., Lemaux, B. C., et al. 2020, ApJS, 247, 61
- Faucher-Giguère et al. (2013) Faucher-Giguère, C.-A., Quataert, E., & Hopkins, P. F. 2013, MNRAS, 433, 1970
- Fisher et al. (2019) Fisher, D. B., Bolatto, A. D., White, H., et al. 2019, ApJ, 870, 46
- Foreman-Mackey et al. (2013) Foreman-Mackey, D., Hogg, D. W., Lang, D., & Goodman, J. 2013, Publications of the Astronomical Society of the Pacific, 125, 306
- Förster Schreiber et al. (2009) Förster Schreiber, N. M., Genzel, R., Bouché, N., et al. 2009, ApJ, 706, 1364
- Förster Schreiber et al. (2006) Förster Schreiber, N. M., Genzel, R., Lehnert, M. D., et al. 2006, ApJ, 645, 1062
- Förster Schreiber & Wuyts (2020) Förster Schreiber, N. M. & Wuyts, S. 2020, ARA&A, 58, 661
- Fraternali et al. (2021) Fraternali, F., Karim, A., Magnelli, B., et al. 2021, A&A, 647, A194
- Freundlich et al. (2019) Freundlich, J., Combes, F., Tacconi, L. J., et al. 2019, A&A, 622, A105
- Fujimoto et al. (2019) Fujimoto, S., Ouchi, M., Ferrara, A., et al. 2019, ApJ, 887, 107
- Fujimoto et al. (2020) Fujimoto, S., Silverman, J. D., Bethermin, M., et al. 2020, ApJ, 900, 1
- Genzel et al. (2017) Genzel, R., Förster Schreiber, N. M., Übler, H., et al. 2017, Nature, 543, 397
- Genzel et al. (2011) Genzel, R., Newman, S., Jones, T., et al. 2011, ApJ, 733, 101
- Genzel et al. (2020) Genzel, R., Price, S. H., Übler, H., et al. 2020, ApJ, 902, 98
- Genzel et al. (2006) Genzel, R., Tacconi, L. J., Eisenhauer, F., et al. 2006, Nature, 442, 786
- Ginolfi et al. (2020) Ginolfi, M., Jones, G. C., Béthermin, M., et al. 2020, A&A, 643, A7
- Girard et al. (2019) Girard, M., Dessauges-Zavadsky, M., Combes, F., et al. 2019, A&A, 631, A91
- Girard et al. (2021) Girard, M., Fisher, D. B., Bolatto, A. D., et al. 2021, ApJ, 909, 12
- Glazebrook (2013) Glazebrook, K. 2013, PASA, 30, e056
- Herrera-Camus et al. (2021) Herrera-Camus, R., Förster Schreiber, N., Genzel, R., & Tacconi, L. 2021, A&A, 1, 1
- Hill et al. (2017) Hill, A. R., Muzzin, A., Franx, M., & Marchesini, D. 2017, ApJ, 849, L26
- Johnson et al. (2018) Johnson, H. L., Harrison, C. M., Swinbank, A. M., et al. 2018, MNRAS, 474, 5076
- Jones et al. (2021) Jones, G. C., Vergani, D., Romano, M., et al. 2021, MNRAS[arXiv:2104.03099]
- Kassin et al. (2012) Kassin, S. A., Weiner, B. J., Faber, S. M., et al. 2012, ApJ, 758, 106
- Kassin et al. (2007) Kassin, S. A., Weiner, B. J., Faber, S. M., et al. 2007, ApJ, 660, L35
- Krumholz et al. (2018) Krumholz, M. R., Burkhart, B., Forbes, J. C., & Crocker, R. M. 2018, MNRAS, 477, 2716
- Lang et al. (2017) Lang, P., Förster Schreiber, N. M., Genzel, R., et al. 2017, ApJ, 840, 92
- Law et al. (2009) Law, D. R., Steidel, C. C., Erb, D. K., et al. 2009, ApJ, 697, 2057
- Lelli et al. (2021) Lelli, F., Di Teodoro, E. M., Fraternali, F., et al. 2021, Science, 371, 713
- Leroy et al. (2009) Leroy, A. K., Walter, F., Bigiel, F., et al. 2009, AJ, 137, 4670
- Leroy et al. (2008) Leroy, A. K., Walter, F., Brinks, E., et al. 2008, AJ, 136, 2782
- Livermore et al. (2015) Livermore, R. C., Jones, T. A., Richard, J., et al. 2015, MNRAS, 450, 1812
- Lovell et al. (2018) Lovell, M. R., Pillepich, A., Genel, S., et al. 2018, MNRAS, 481, 1950
- Madden et al. (1993) Madden, S. C., Geis, N., Genzel, R., et al. 1993, ApJ, 407, 579
- McMullin et al. (2007) McMullin, J. P., Waters, B., Schiebel, D., Young, W., & Golap, K. 2007, in Astronomical Society of the Pacific Conference Series, Vol. 376, Astronomical Data Analysis Software and Systems XVI, ed. R. A. Shaw, F. Hill, & D. J. Bell, 127
- Mogotsi et al. (2016) Mogotsi, K. M., de Blok, W. J. G., Caldú-Primo, A., et al. 2016, AJ, 151, 15
- Molina et al. (2019) Molina, J., Ibar, E., Smail, I., et al. 2019, MNRAS, 487, 4856
- Navarro et al. (1996) Navarro, J. F., Frenk, C. S., & White, S. D. M. 1996, ApJ, 462, 563
- Neeleman et al. (2020) Neeleman, M., Prochaska, J. X., Kanekar, N., & Rafelski, M. 2020, Nature, 581, 269
- Ostriker & Shetty (2011) Ostriker, E. C. & Shetty, R. 2011, ApJ, 731, 41
- Price et al. (2021) Price, S. H., Shimizu, T. T., Genzel, R., et al. 2021, ApJ, 922, 143
- Riechers et al. (2013) Riechers, D. A., Bradford, C. M., Clements, D. L., et al. 2013, Nature, 496, 329
- Rizzo et al. (2021) Rizzo, F., Vegetti, S., Fraternali, F., Stacey, H., & Powell, D. 2021, arXiv e-prints, arXiv:2102.05671
- Rizzo et al. (2020) Rizzo, F., Vegetti, S., Powell, D., et al. 2020, Nature, 584, 201
- Rubin & Ford (1970) Rubin, V. C. & Ford, W. Kent, J. 1970, ApJ, 159, 379
- Shetty & Ostriker (2012) Shetty, R. & Ostriker, E. C. 2012, ApJ, 754, 2
- Simons et al. (2017) Simons, R. C., Kassin, S. A., Weiner, B. J., et al. 2017, ApJ, 843, 46
- Smit et al. (2018) Smit, R., Bouwens, R. J., Carniani, S., et al. 2018, Nature, 553, 178
- Sofue & Rubin (2001) Sofue, Y. & Rubin, V. 2001, ARA&A, 39, 137
- Stott et al. (2016) Stott, J. P., Swinbank, A. M., Johnson, H. L., et al. 2016, MNRAS, 457, 1888
- Swinbank et al. (2011) Swinbank, A. M., Papadopoulos, P. P., Cox, P., et al. 2011, ApJ, 742, 11
- Tacconi et al. (2018) Tacconi, L. J., Genzel, R., Saintonge, A., et al. 2018, ApJ, 853, 179
- Tacconi et al. (2020) Tacconi, L. J., Genzel, R., & Sternberg, A. 2020, ARA&A, 58, 157
- Tacconi et al. (2013) Tacconi, L. J., Neri, R., Genzel, R., et al. 2013, ApJ, 768, 74
- Turner et al. (2017) Turner, O. J., Cirasuolo, M., Harrison, C. M., et al. 2017, MNRAS, 471, 1280
- Übler et al. (2018) Übler, H., Genzel, R., Tacconi, L. J., et al. 2018, ApJ, 854, L24
- Übler et al. (2019) Übler, H., Genzel, R., Wisnioski, E., et al. 2019, ApJ, 880, 48
- Wisnioski et al. (2019) Wisnioski, E., Förster Schreiber, N. M., Fossati, M., et al. 2019, ApJ, 886, 124
- Wisnioski et al. (2015) Wisnioski, E., Förster Schreiber, N. M., Wuyts, S., et al. 2015, ApJ, 799, 209
- Wuyts et al. (2016) Wuyts, S., Förster Schreiber, N. M., Wisnioski, E., et al. 2016, ApJ, 831, 149