Observation of an ultra-low -value electron-capture channel decaying to 75As via high-precision mass measurement
Abstract
A precise determination of the atomic mass of 75As has been performed utilizing the double Penning trap mass spectrometer, JYFLTRAP. The mass excess is measured to be -73035.519(42) keV/c2, which is a factor of 21 more precise and 1.3(9) keV/c2 lower than the adopted value in the newest Atomic Mass Evaluation (AME2020). This value has been used to determine the ground-state-to-ground-state electron-capture decay value of 75Se and decay value of 75Ge, which are derived to be 866.041(81) keV and 1178.561(65) keV, respectively. Using the nuclear energy-level data of 860.00(40) keV, 865.40(50) keV (final states of electron capture) and 1172.00(60) keV (final state of decay) for the excited states of 75As∗, we have determined the ground-state-to-excited-state values for two transitions of 75Se 75As∗ and one transition of 75Ge 75As∗. The ground-state-to-excited-state values are determined to be 6.04(41) keV, 0.64(51) keV and 6.56(60) keV, respectively, thus confirming that the three low -value transitions are all energetically valid and one of them is a possible candidate channel for antineutrino mass determination. Furthermore, the ground-state-to-excited-state value of transition 75Se 75As∗ (865.40(50) keV) is revealed to be ultra-low (< 1 keV) and the first-ever confirmed EC transition possessing an ultra-low value from direct measurements.
I Introduction
The discovery of flavor oscillations of atmospheric, solar, and reactor neutrinos confirms that neutrinos have mass Fukuda et al. (1998); SNO Collaboration (2002); Gerbino and Lattanzi (2018). The standard model (SM) contradictorily predicts that the neutrino mass is zero. How neutrinos acquire their small masses is consequently a matter of great theoretical interest and may be an evidence of new physics beyond the SM. Oscillation data provide only the differences of the squared neutrino masses but not their absolute values. In order to solve the open problem of the absolute values of the neutrino masses, laboratory measurements are necessary. Among these experiments, the ones dedicated to measurements of the neutrinoless double beta decay aim to determine if neutrinos are of Dirac or Majorana nature and to measure the effective Majorana neutrino mass Suhonen and Civitarese (1998); Avignone et al. (2008); Ejiri et al. (2019); Blaum et al. (2020). Unfortunately, this method is model-dependent and highly relies on the calculated values of the involved transition matrix elements. A direct and model-independent method for determining (anti)neutrino mass is based on single beta decay or electron capture (EC) Gastaldo et al. (2017); Aker et al. (2021). From the decay of tritium, one can determine the electron-antineutrino mass by zooming in the slight distortion of the shape of the electron spectrum near the endpoint, determined by the decay value minus the antineutrino mass. In a similar vein, in the EC of 163Ho Gastaldo et al. (2017), one can determine the electron-neutrino mass from the endpoint of the measured de-excitation spectrum, which is shifted below by the non-zero neutrino mass. In both beta decay and EC, the sensitivity to (anti)neutrino mass is increased by a small value. Therefore, as small as possible value is desired in these (anti)neutrino-mass determination experiments. Due to this reason, tritium with low -decay value of 18.59201(7) keV Myers et al. (2015) in the KATRIN (KArlsruhe TRitium Neutrino) experiment Drexlin et al. (2013); Aker et al. (2019), and 163Ho with low EC value of 2.833(30)sta(15)sys keV Eliseev et al. (2015) in the ECHo (Electron Capture in 163Ho) Gastaldo et al. (2014, 2017) HOLMES Alpert et al. (2015); Faverzani et al. (2016) experiments are used. An upper limit of 0.8 eV/c2 (90% Confidence Level (C.L.)) for the electron-antineutrino mass is achieved in the tritium decay by KATRIN Aker et al. (2021), and for electron-neutrino mass an upper limit of 150 eV/c2 (95% C.L.) was obtained exploiting the EC of 163Ho in the ECHo experiment Velte et al. (2019).
Other isotopes with low -value decay transition, especially ultra-low (< 1 keV), are of significant interest for future neutrino-mass absolute-scale determination experiments Mustonen and Suhonen (2010, 2011); Suhonen (2014); De Roubin et al. (2020); Ge et al. (2021a, b). The values determined with indirect methods may include unknown systematic uncertainties. This can make these values deviate by more than 10 keV Ge et al. (2021a); Fink et al. (2012); Nesterenko et al. (2019) from those directly determined through high-precision Penning-trap mass spectrometry (PTMS). Direct measurements of the masses or values through PTMS, which is to date the only direct method to have achieved 100 eV precision or better, are indispensable in the searches for ultra-low -value transitions. The first ultra-low -value decay, 115In (9/2+, ground state) 115Sn (9/2+, excited state), was discovered by Cattadori et al. Cattadori et al. (2005) and the ultra-low value was confirmed by the JYFLTRAP Penning trap Wieslander et al. (2009) and the FSU Penning trap Mount et al. (2009). The second ultra-low -value case of 135Cs (7/2+, ground state) decaying to 135Ba (11/2-, second excited state) was discovered at JYFLTRAP De Roubin et al. (2020); Kankainen et al. (2020) recently. These are the only two cases that are confirmed to possess ultra-low values from direct measurements, and they both belong to the category of decay.
In this paper, we report on the high-precision mass determination of 75As from cyclotron frequency measurements with high-precision PTMS. The ground-state-to-ground-state (gs-to-gs) EC value of the transition 75Se As and -decay value of the transition 75Ge As are determined. The high-precision gs-to-gs values from this work, combined with the nuclear energy-level data for three excited states of 75As, are used to determine their ground-state-to-excited-state (gs-to-es) values. Three low -value transitions are confirmed to be energetically possible and the first to date ultra-low -value EC transition has been discovered in this experiment.
II Experimental method
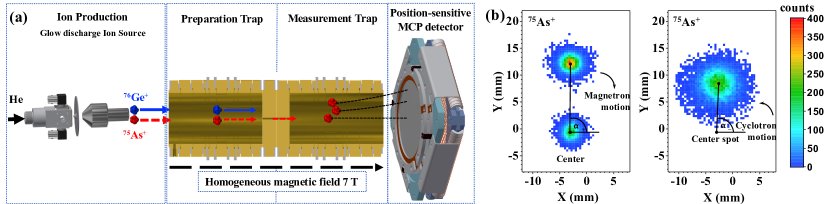
The atomic mass of 75As was measured with the JYFLTRAP double PTMS Eronen and Hardy (2012) at the Ion Guide Isotope Separator On-Line facility (IGISOL) Moore et al. (2013) of the University of Jyväskylä. The stable 75As+ ions were produced with an offline glow-discharge ion source. To measure the mass of 75As precisely, 76Ge+ ions with well-known mass value were used as reference ion, co-produced from the same ion source. As shown in Fig. 1 (a), the gas cell of the glow-discharge ion source contains two sharp electrodes, of which one is made of the mixture of natural abundance arsenic and germanium, allowing simultaneous production of ions of these elements. The produced ions were stopped in the gas cell and extracted out with gas flow and electric fields. They were subsequently accelerated with a voltage of 30 kV and transported further to a 90∘ electrostatic bender to the main horizontal beamline before the dipole magnet. With a mass resolving power of 500, the dipole magnet is used to selectively transport the 75As+ or 76Ge+ ions to a radiofrequency quadrupole cooler-buncher (RFQ) Nieminen et al. (2001). After cooling and bunching the ions with the RFQ, they were transported to the JYFLTRAP double PTMS as schematically shown in Fig. 1 (a).
After the dipole magnet, in principle pure ion beams of 75As+ and 76Ge+ with unambiguous identification from the offline ion source are separated and selected. To ensure that any possible isobaric or molecular contaminations are removed, the first (preparation) trap is used via the sideband buffer gas cooling technique Savard et al. (1991) with a typical resolving power of around . Finally, the purified sample of 75As+ or 76Ge+ ions are injected into the second (measurement) trap. The ion’s cyclotron frequency , where is the magnetic field strength, is the charge state and the mass of the ion, is determined in the second Penning trap.
The phase-imaging ion-cyclotron-resonance (PI-ICR) technique Nesterenko et al. (2018) at JYFLTRAP is used to measure the cyclotron frequency in this work. This technique depends on projecting the ion motion in the Penning trap onto a position-sensitive multichannel-plate ion detector (schematic shown in Fig. 1 (a)) and provides around 40 times better resolving power and is 25 times faster than the conventional TOF-ICR method Nesterenko et al. (2018); Eliseev et al. (2014, 2013). Measurement scheme 2 described in Eliseev et al. (2014) was applied to measure the cyclotron frequency of the corresponding nuclide.
The PI-ICR measurement is initiated by exciting a cooled ion bunch with a dipolar radio-frequency electric field at the trap-modified cyclotron frequency . This is a short excitation lasting approximately 1 ms. Afterwards, the trap-modified cyclotron motion is converted to magnetron motion using a quadrupole excitation with the cyclotron frequency and a duration of approximately 2 ms. Two different delays for the application of this excitation are alternatively used. In one, the conversion pulse is applied right after the dipolar excitation and in the other after a longer time. The time difference of the excitation pulses is called the phase accumulation time, denoted . During this time, in a cycle with a very short conversion pulse delay, the ions perform magnetron motion and in the one with a long delay modified cyclotron motion. After, the ions are extracted from the trap (the time difference between the initial dipolar excitation and the extraction is always constant irrespective of the quadrupole conversion delay) and their positions are recorded with a position-sensitive MCP detector PS- (2021). The spot obtained with the small conversion time delay is called the magnetron spot and the one with the long delay is the cyclotron spot. The center spot of the ions of interest is collected by extracting the ions directly to project them onto the MCP detector without applying any excitation. The angle between the spots of the cyclotron and magnetron phases with respect to the center spot is = -, where and are the polar angles of the magnetron motion phase and cyclotron motion phases, respectively. The cyclotron frequency is deduced from:
| (1) |
where are the number of complete revolutions of the measured ion during the phase accumulation time . The accumulation time for 75As+ and 76Ge+ was 400 ms, which ensures the spot of interest was resolved from any possible isobaric, and molecular contamination. The positions of the magnetron-motion and cyclotron-motion phase spots were chosen such that the angle did not exceed a few degrees. By this way, the shift in the frequency ratio measurements, due to the conversion of the cyclotron motion to magnetron motion and the possible distortion of the ion-motion projection, can be reduced to a level well below 10-10 Eliseev et al. (2014) . In addition, the start of the initial dipolar excitation with frequency was repeatedly scanned over one magnetron period (6 points) and the extraction was scanned over one cyclotron period (6 points) to average out any residual magnetron and cyclotron motion that could shift the different spots. One collected data of phase imaging of on the MCP detector on Fig. 1 (b).
The atomic mass of the ion of interest was derived from the measured cyclotron frequency ratio:
| (2) |
where and are the masses of the ion of interest (75As+) and reference (76Ge+) atoms, respectively. is their cyclotron frequency ratio for singly charged ions. is the mass of electron and is the speed of light in vacuum. and are the electron binding energy of 76Ge+ and 75As+, which are 7.899440(10) eV and 9.78855(25) eV from Kramida et al. (2020), respectively. The main contributions of the final mass uncertainty of 75As are from the statistical uncertainty of the measurements of and the reference mass uncertainty (0.018 keV from Wang et al. (2021)).
| IOI-Ref | ME (this work) ME (AME2020) | Diff. | |
| 75As-76Ge | 0.986 830 896 52(53) | -73035.521(42) -73034.20(90) | -1.32(90) |
| 77Se-76Se | 1.013 181 218 27(79) | -74599.443(58) -74599.490(60) | 0.047(84) |
| 94Mo-95Mo | 0.989 455 235 86(72) | -88414.101(136) -88414.06(14) | -0.041(195) |
| Initial state | Half-life | Final state | Decay type | (AME2020) | (This work) | (AME2020) | (This work) | |
| 75Se (5/2+) | 119.78(5) d | 75As ({3/2-, 5/2-}) | EC: 1st FNU | 864.72(90) | 866.041(81) | -0.7(10) | 0.64(51) | 865.40(50) |
| 75Se (5/2+) | 119.78(5) d | 75As (1/2+) | EC: 2nd FNU | 864.72(90) | 866.041(81) | 4.7(10) | 6.04(41) | 860.00(40) |
| 75Ge (1/2-) | 82.78(4) m | 75As ({1/2-:7/2-}) | : Allowed{?} | 1177.24(90) | 1178.561(65) | 5.2(11) | 6.56(60) | 1172.00(60) |
III Results and discussion
III.1 value determination
Five data sets for PI-ICR measurements were performed in different time slots. Every data set was accumulated by switching between the ion species 75As+ and 76Ge+ every four cycles. Each cycle took less than 2 minutes to complete a full scanning measurements of the magnetron phase, cyclotron phase and center spot in sequence. In the analysis, typically 8 to 16 cycles were summed before determining the position of each spot by fitting with the maximum likelihood method. The phase angles were calculated accordingly to deduce the cyclotron frequencies of each ion species. Closest measured cyclotron frequencies of the reference was linearly interpolated to the time for measurement of the ion of interest to deduce the cyclotron frequency ratio . Only events less than five ions/bunch were considered in the analysis in order to reduce the possible cyclotron frequency shifts due to ion-ion interaction Kellerbauer et al. (2003); Roux et al. (2013). A countrate-class analysis Roux et al. (2013) was performed and the count rate related frequency shifts were not observed in the analysis. A temporal fluctuation of the magnetic field /min Nesterenko et al. (2021), where is the time interval between two consecutive reference measurements, is considered in the analysis. Furthermore, a mass-dependent uncertainty of Nesterenko et al. (2021), was taken into account as there is one mass unit (1 ) difference of the two measured ion species. To check whether some other systematic error should be added due to this technique, a crosscheck Nesterenko et al. (2020) has been carried out using well-known mass pairs 77Se-76Se and 94Mo-95Mo Huang et al. (2021); Wang et al. (2021), which both have one mass unit difference. The measured results are shown in Table 1. The measured mass excesses of both cases are consistent with AME2020 values within 1 uncertainty. Therefore, in our final results, we did not include any further systematic error.
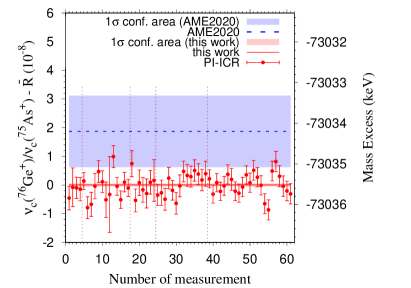
The weighted mean ratio of all single ratios was calculated along with the inner and outer errors to deduce the Birge rato Birge (1932). The maximum of the inner and outer errors was taken as the weight to calculate . Results of the analysis including all PI-ICR data sets in comparison to literature values are demonstrated in Fig. 2. The final frequency ratio as well as the derived mass-excess value are respectively 0.986 830 896 52(53) and -73035.521(42) keV/c2.
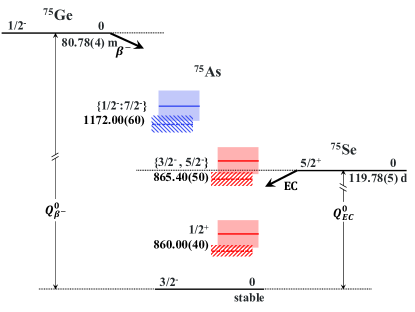
The mass-excess value of 75As in AME2020 is evaluated from two indirect reaction measurements, 75As(p,n)75Se and 78Se(p,a)75As, which have the influences of 85.3% and 14.7% on the primary nuclide, respectively. The refined mass-excess value of 75As from our direct measurements is 21 times more precise. The value is 1.32(90) keV/c2 lower than that adopted in AME2020 and indicates that 75As is more bound. The high-precision mass-excess value of 75As was used to deduce the gs-to-gs values ( deduced from the mass difference of the decay-parent and decay-daughter nuclei) of the 75Se 75As and 75Ge 75As transitions. Combined with the excitation energies from NND (2021) for the excited states of 75As, the gs-to-es values ( = - ) were calculated. The comparison of the values from this work to the corresponding values from literature is performed in Table. 2. The presently measured gs-to-es values of the transitions tabulated in Table 2 are determined with uncertainties less than 100 eV, while the uncertainties of the gs-to-es values are much larger than 100 eV, the main contributions coming from the large uncertainties of the excitation energies of the final states. Our results confirm that three low -value transitions from the ground-states of 75Se and 75Ge to the corresponding excited states of 75Se, as tabulated in Table. 2, are all energetically allowed. Furthermore, our measurements confirm that the value corresponding to the EC transition 75Se 75As* (865.40(50) keV) is ultra-low and positive at a level of 1.3. This transition and the transition to the state at 860.00(40) keV are non-unique EC transitions and thus their characteristics depend on nuclear-structure details through the nuclear matrix elements Ejiri et al. (2019); Behrens and Bühring (1982). This excludes their use as reliable sources of information about the electron-neutrino mass. On the other hand, the decay to the excited state at 1172.00(60) keV might be of interest for the electron-antineutrino mass measurements if the spin of the state is either or , corresponding to an allowed transition. Hence, accurate determination of the excitation energy and spin of the state is highly important and called for.
III.2 Beta-decay study via nuclear shell-model
The low- EC transitions of interest go to a state at 860.00(40) keV and a negative-parity state at 865.40(50) keV, experimentally either a or a state. The transition goes to a negative-parity state at 1172.00(60) keV, the experimental spin assignment being between a and a state. One may try to shed light on these spin-assignment ambiguities by performing nuclear shell-model (NSM) calculations. States of the isotope 75As were computed using the software NuShellX Brown and Rae (2014) in a single-particle model space consisting of the orbitals , , , and for both neutrons and protons. Effective single-particle energies have been fitted to be used within the region of interest = 63 - 96 in Honma et al. (2009). In the present study both jun45pn and jj44bpn interactions were applied. The interaction jun45pn was originally applied to a neighbouring isotope (76Ge) Mukhopadhyay et al. (2017) while the jj44bpn was fitted to work within the presently studied region Honma et al. (2009).
The sequence of the spin-parities of the levels in 75As are well reproduced by both interactions up to the experimental negative-parity state at 865.40(50) keV. The level energies predicted by the NSM agree with the experimental ones within a range of 50 to 200 keV. The two interactions suggest consistently the spin assignment for the experimental 865.40(50) keV state. The corresponding EC transition is thus predicted to be a first-forbidden non-unique transition and thus its properties depend sensitively on nuclear-structure details.
Concerning the experimental state at keV, jun45pn predicts a state at keV and a state at keV. This suggests that the most likely spin-assignments for the keV state are either or . The jj44bpn interaction predicts a state at keV and a state at keV. Considering the predictions of both interactions together leaves the as the most likely spin-parity for the keV state. This, in turn, makes the transition from the state of 75Ge to this state an allowed one, with an available of 6.56(60) keV. This would make the transition interesting from the point of view of electron-antineutrino mass measurements. Eventually, a re-measurement of the spin-parities of the states in question is called for.
IV Conclusion
The atomic mass of 75As is precisely measured directly with the PI-ICR technique at the JYFLTRAP double PTMS. The precision of the 75As mass has been improved by a factor of 21 and was found to be 1.32(90) keV/c2 more bound than the evaluated value in the AME2020 mass evaluation. This allows a high-precision determination of the gs-to-gs values of the decays of 75Ge and 75Se to 75As with an uncertainty of better than 100 eV. Exploiting the energy-level data of the excites states of 75As, the gs-to-es values of three low -value transitions have been determined to a sub-keV precision. The derived positive gs-to-es values have all been confirmed to be associated with energetically-allowed low -value EC and transitions. Among them, a first ultra-low (< 1 keV) -value EC transition has been found. One of the transitions, namely the low- transition, has the potential to be used in determination of the value of the electron-antineutrino mass. For this to be realized, a more precise determination of the excitation energy and spin of the corresponding final state is of paramount importance.
Acknowledgements.
We acknowledge the support by the Academy of Finland under the Finnish Centre of Excellence Programme 2012-2017 (Nuclear and Accelerator Based Physics Research at JYFL) and projects No. 306980, 312544, 275389, 284516, 295207, 314733, 318043, 327629 and 320062. The support by the EU Horizon 2020 research and innovation program under grant No. 771036 (ERC CoG MAIDEN) is acknowledged.References
- Fukuda et al. (1998) Y. Fukuda, T. Hayakawa, E. Ichihara, K. Inoue, K. Ishihara, H. Ishino, Y. Itow, T. Kajita, J. Kameda, S. Kasuga, et al., Physical Review Letters 81, 1562 (1998), ISSN 10797114, eprint 9807003, URL http://link.aps.org/doi/10.1103/PhysRevLett.81.1562.
- SNO Collaboration (2002) SNO Collaboration, Physical Review Letters 89, 1 (2002), ISSN 10797114, eprint 0204008, URL http://dx.doi.org/10.1103/PhysRevLett.89.011301.
- Gerbino and Lattanzi (2018) M. Gerbino and M. Lattanzi, Frontiers in Physics 5 (2018).
- Suhonen and Civitarese (1998) J. Suhonen and O. Civitarese, Physics Reports 300, 123 (1998), ISSN 03701573, URL http://dx.doi.org/10.1016/S0370-1573(97)00087-2.
- Avignone et al. (2008) F. T. Avignone, S. R. Elliott, and J. Engel, Reviews of Modern Physics 80, 481 (2008), ISSN 15390756, eprint 0708.1033, URL http://link.aps.org/doi/10.1103/RevModPhys.80.481.
- Ejiri et al. (2019) H. Ejiri, J. Suhonen, and K. Zuber, Physics Reports 797, 1 (2019), ISSN 03701573, URL https://doi.org/10.1016/j.physrep.2018.12.001https://dx.doi.org/10.1016/j.physrep.2018.12.001.
- Blaum et al. (2020) K. Blaum, S. Eliseev, F. A. Danevich, V. I. Tretyak, S. Kovalenko, M. I. Krivoruchenko, Y. N. Novikov, and J. Suhonen, Reviews of Modern Physics 92, 045007 (2020), URL https://link.aps.org/doi/10.1103/RevModPhys.92.045007.
- Gastaldo et al. (2017) L. Gastaldo, K. Blaum, K. Chrysalidis, T. Day Goodacre, A. Domula, M. Door, H. Dorrer, C. E. Düllmann, K. Eberhardt, S. Eliseev, et al., European Physical Journal: Special Topics 226, 1623 (2017), ISSN 19516401, URL http://link.springer.com/10.1140/epjst/e2017-70071-y.
- Aker et al. (2021) M. Aker, A. Beglarian, J. Behrens, A. Berlev, U. Besserer, B. Bieringer, F. Block, B. Bornschein, L. Bornschein, M. Böttcher, et al., First direct neutrino-mass measurement with sub-eV sensitivity (2021), eprint 2105.08533.
- Myers et al. (2015) E. G. Myers, A. Wagner, H. Kracke, and B. A. Wesson, Physical Review Letters 114 (2015), ISSN 10797114, URL http://dx.doi.org/10.1103/PhysRevLett.114.013003.
- Drexlin et al. (2013) G. Drexlin, V. Hannen, S. Mertens, and C. Weinheimer, Advances in High Energy Physics 2013, 1 (2013), ISSN 16877357, eprint 1307.0101, URL http://www.hindawi.com/journals/ahep/2013/293986/.
- Aker et al. (2019) M. Aker, K. Altenmüller, M. Arenz, M. Babutzka, J. Barrett, S. Bauer, M. Beck, A. Beglarian, J. Behrens, T. Bergmann, et al., Physical Review Letters 123, 1 (2019), ISSN 10797114, eprint 1909.06048, URL https://doi.org/10.1103/PhysRevLett.123.221802.
- Eliseev et al. (2015) S. Eliseev, K. Blaum, M. Block, S. Chenmarev, H. Dorrer, C. E. Düllmann, C. Enss, P. E. Filianin, L. Gastaldo, M. Goncharov, et al., Physical Review Letters 115, 62501 (2015), ISSN 10797114, eprint 1604.04210, URL http://link.aps.org/doi/10.1103/PhysRevLett.115.062501.
- Gastaldo et al. (2014) L. Gastaldo, K. Blaum, A. Doerr, C. E. Düllmann, K. Eberhardt, S. Eliseev, C. Enss, A. Faessler, A. Fleischmann, S. Kempf, et al., Journal of Low Temperature Physics 176, 876 (2014), ISSN 15737357, eprint 1306.2655, URL http://dx.doi.org/10.1007/s10909-014-1187-4.
- Alpert et al. (2015) B. Alpert, M. Balata, D. Bennett, M. Biasotti, C. Boragno, C. Brofferio, V. Ceriale, D. Corsini, P. K. Day, M. De Gerone, et al., European Physical Journal C 75, 1 (2015), ISSN 14346052, eprint 1412.5060, URL http://dx.doi.org/10.1140/epjc/s10052-015-3329-5https://www.ncbi.nlm.nih.gov/pubmed/25995704.
- Faverzani et al. (2016) M. Faverzani, B. Alpert, D. Backer, D. Bennet, M. Biasotti, C. Brofferio, V. Ceriale, G. Ceruti, D. Corsini, P. K. Day, et al., Journal of Low Temperature Physics 184, 922 (2016), ISSN 15737357, URL http://link.springer.com/10.1007/s10909-016-1540-x.
- Velte et al. (2019) C. Velte, F. Ahrens, A. Barth, K. Blaum, M. Braß, M. Door, H. Dorrer, C. E. Düllmann, S. Eliseev, C. Enss, et al., The European Physical Journal C 79 (2019), URL http://link.springer.com/10.1140/epjc/s10052-019-7513-x.
- Mustonen and Suhonen (2010) M. T. Mustonen and J. Suhonen, Journal of Physics G: Nuclear and Particle Physics 37, 64008 (2010), ISSN 09543899, URL https://iopscience.iop.org/article/10.1088/0954-3899/37/6/064008.
- Mustonen and Suhonen (2011) M. Mustonen and J. Suhonen, Physics Letters B 703, 370 (2011), ISSN 0370-2693, URL https://www.sciencedirect.com/science/article/pii/S0370269311009099.
- Suhonen (2014) J. Suhonen, Physica Scripta 89, 54032 (2014), ISSN 14024896, URL http://stacks.iop.org/1402-4896/89/i=5/a=054032.
- De Roubin et al. (2020) A. De Roubin, J. Kostensalo, T. Eronen, L. Canete, R. P. De Groote, A. Jokinen, A. Kankainen, D. A. Nesterenko, I. D. Moore, S. Rinta-Antila, et al., Physical Review Letters 124, 1 (2020), ISSN 10797114, eprint 2002.08282, URL https://doi.org/10.1103/PhysRevLett.124.222503.
- Ge et al. (2021a) Z. Ge, T. Eronen, A. de Roubin, D. A. Nesterenko, M. Hukkanen, O. Beliuskina, R. de Groote, S. Geldhof, W. Gins, A. Kankainen, et al., Physical Review C 103, 065502 (2021a), URL https://link.aps.org/doi/10.1103/PhysRevC.103.065502.
- Ge et al. (2021b) Z. Ge, T. Eronen, K. S. Tyrin, J. Kotila, J. Kostensalo, D. A. Nesterenko, O. Beliuskina, R. de Groote, A. de Roubin, S. Geldhof, et al., Phys. Rev. Lett. 127, 272301 (2021b), URL https://link.aps.org/doi/10.1103/PhysRevLett.127.272301.
- Fink et al. (2012) D. Fink, J. Barea, D. Beck, K. Blaum, C. Böhm, C. Borgmann, M. Breitenfeldt, F. Herfurth, A. Herlert, J. Kotila, et al., Physical Review Letters 108, 1 (2012), ISSN 00319007.
- Nesterenko et al. (2019) D. A. Nesterenko, L. Canete, T. Eronen, A. Jokinen, A. Kankainen, Y. N. Novikov, S. Rinta-Antila, A. de Roubin, and M. Vilen, International Journal of Mass Spectrometry 435, 204 (2019), ISSN 13873806, URL https://dx.doi.org/10.1016/j.ijms.2018.10.038https://doi.org/10.1016/j.ijms.2018.10.038.
- Cattadori et al. (2005) C. M. Cattadori, M. De Deo, M. Laubenstein, L. Pandola, and V. I. Tretyak, Nuclear Physics A 748, 333 (2005), ISSN 03759474, URL http://www.sciencedirect.com/science/article/pii/S0375947404011509.
- Wieslander et al. (2009) J. S. Wieslander, J. Suhonen, T. Eronen, M. Hult, V. V. Elomaa, A. Jokinen, G. Marissens, M. Misiaszek, M. T. Mustonen, S. Rahaman, et al., Physical Review Letters 103, 122501 (2009), ISSN 00319007, URL https://www.ncbi.nlm.nih.gov/pubmed/19792426http://dx.doi.org/10.1103/PhysRevLett.103.122501http://link.aps.org/doi/10.1103/PhysRevLett.103.122501.
- Mount et al. (2009) B. J. Mount, M. Redshaw, and E. G. Myers, Physical Review Letters 103, 122502 (2009), ISSN 00319007, URL http://dx.doi.org/10.1103/PhysRevLett.103.122502%****␣lowQ-75As-final.bbl␣Line␣400␣****http://link.aps.org/doi/10.1103/PhysRevLett.103.122502.
- Kankainen et al. (2020) A. Kankainen, T. Eronen, D. Nesterenko, A. de Roubin, and M. Vilén, Hyperfine Interactions 241, 43 (2020), ISSN 15729540, URL http://link.springer.com/10.1007/s10751-020-01711-5.
- Eronen and Hardy (2012) T. Eronen and J. C. Hardy, European Physical Journal A 48, 1 (2012), ISSN 1434601X, URL http://dx.doi.org/10.1140/epja/i2012-12048-y.
- Moore et al. (2013) I. D. Moore, T. Eronen, D. Gorelov, J. Hakala, A. Jokinen, A. Kankainen, V. S. Kolhinen, J. Koponen, H. Penttilä, I. Pohjalainen, et al., Nuclear Instruments and Methods in Physics Research, Section B: Beam Interactions with Materials and Atoms 317, 208 (2013), ISSN 0168583X, URL http://www.sciencedirect.com/science/article/pii/S0168583X13007143http://dx.doi.org/10.1016/j.nimb.2013.06.036.
- Nieminen et al. (2001) A. Nieminen, J. Huikari, A. Jokinen, J. Äystö, P. Campbell, and E. C. Cochrane, Nuclear Instruments and Methods in Physics Research, Section A: Accelerators, Spectrometers, Detectors and Associated Equipment 469, 244 (2001), ISSN 01689002, URL http://www.sciencedirect.com/science/article/B6TJM-43PGJKX-C/1/93d5587efba5cfe8571b63228952dab8.
- Savard et al. (1991) G. Savard, S. Becker, G. Bollen, H. J. Kluge, R. B. Moore, T. Otto, L. Schweikhard, H. Stolzenberg, and U. Wiess, Physics Letters A 158, 247 (1991), ISSN 03759601, URL https://doi.org/10.1016/0375-9601(91)91008-2.
- Nesterenko et al. (2018) D. A. Nesterenko, T. Eronen, A. Kankainen, L. Canete, A. Jokinen, I. D. Moore, H. Penttilä, S. Rinta-Antila, A. de Roubin, and M. Vilen, European Physical Journal A 54, 0 (2018), ISSN 1434601X, URL https://dx.doi.org/10.1140/epja/i2018-12589-y.
- Eliseev et al. (2014) S. Eliseev, K. Blaum, M. Block, A. Dörr, C. Droese, T. Eronen, M. Goncharov, M. Höcker, J. Ketter, E. M. Ramirez, et al., Applied Physics B: Lasers and Optics 114, 107 (2014), ISSN 09462171, URL http://dx.doi.org/10.1007/s00340-013-5621-0.
- Eliseev et al. (2013) S. Eliseev, K. Blaum, M. Block, C. Droese, M. Goncharov, E. Minaya Ramirez, D. A. Nesterenko, Y. N. Novikov, and L. Schweikhard, Physical Review Letters 110, 82501 (2013), ISSN 00319007, URL http://link.aps.org/doi/10.1103/PhysRevLett.110.082501.
- PS- (2021) Micro-channel plate detector with delay line anode, roentdek handels gmbh, Available at http://www.roentdek.de (2020/11/30) (2021), URL http://www.roentdek.de.
- Kramida et al. (2020) A. Kramida, Yu. Ralchenko, J. Reader, and and NIST ASD Team, NIST Atomic Spectra Database (ver. 5.8), [Online]. Available: https://physics.nist.gov/asd [2021, January 19]. National Institute of Standards and Technology, Gaithersburg, MD. (2020).
- Wang et al. (2021) M. Wang, W. Huang, F. Kondev, G. Audi, and S. Naimi, Chinese Physics C 45, 030003 (2021), URL https://doi.org/10.1088/1674-1137/abddaf.
- NND (2021) National nuclear data center, Available at https://www.nndc.bnl.gov/ (2020/4/7) (2021), URL https://www.nndc.bnl.gov/.
- Kellerbauer et al. (2003) A. Kellerbauer, K. Blaum, G. Bollen, F. Herfurth, H. J. Kluge, M. Kuckein, E. Sauvan, C. Scheidenberger, and L. Schweikhard, European Physical Journal D 22, 53 (2003), ISSN 14346060, URL http://dx.doi.org/10.1140/epjd/e2002-00222-0.
- Roux et al. (2013) C. Roux, K. Blaum, M. Block, C. Droese, S. Eliseev, M. Goncharov, F. Herfurth, E. M. Ramirez, D. A. Nesterenko, Y. N. Novikov, et al., The European Physical Journal D 67, 1 (2013), ISSN 1434-6060, URL http://dx.doi.org/10.1140/epjd/e2013-40110-x.
- Nesterenko et al. (2021) D. A. Nesterenko, T. Eronen, Z. Ge, A. Kankainen, and M. Vilen, Eur. Phys. J. A 57, 302 (2021), URL https://doi.org/10.1140/epja/s10050-021-00608-3.
- Nesterenko et al. (2020) D. A. Nesterenko, R. P. de Groote, T. Eronen, Z. Ge, M. Hukkanen, A. Jokinen, and A. Kankainen, International Journal of Mass Spectrometry 458, 1 (2020), ISSN 13873806, eprint 2007.13375.
- Huang et al. (2021) W. Huang, M. Wang, F. Kondev, G. Audi, and S. Naimi, Chinese Physics C 45, 030002 (2021), URL https://doi.org/10.1088/1674-1137/abddb0.
- Birge (1932) R. T. Birge, Physical Review 40, 207 (1932), ISSN 0031899X, URL http://link.aps.org/abstract/PR/v40/p207.
- Behrens and Bühring (1982) H. Behrens and W. Bühring, Electron Radial Wave Functions and Nuclear Beta-decay (International Series of Monographs on Physics) (Clarendon press, Oxford, 1982).
- Brown and Rae (2014) B. Brown and W. Rae, Nuclear Data Sheets 120, 115 (2014), URL https://doi.org/10.1016/j.nds.2014.07.022.
- Honma et al. (2009) M. Honma, T. Otsuka, T. Mizusaki, and M. Hjorth-Jensen, Physical Review C 80 (2009), URL https://doi.org/10.1103/physrevc.80.064323.
- Mukhopadhyay et al. (2017) S. Mukhopadhyay, B. P. Crider, B. A. Brown, S. F. Ashley, A. Chakraborty, A. Kumar, M. T. McEllistrem, E. E. Peters, F. M. Prados-Estévez, and S. W. Yates, Physical Review C 95 (2017), URL https://doi.org/10.1103/physrevc.95.014327.