Radio properties of the OH megamaser galaxy IIZw 096
Based on the two epochs European Very Long Baseline Interferometry (VLBI) Network (EVN) archive data from OH line observations of IIZw 096, we confirm that the high-resolution OH emission in this source mainly comes from two spots (OH1 and OH2) of comp D1 of this merging system. We found no significant variations in the OH 1667 MHz line emission, including flux densities and peak positions. The OH 1665 MHz line emission is detected at about 6 level in the OH1 region by combining two epoch EVN observations. By using archival data from the Very Long Baseline Array (VLBA), Very Large Array (VLA), and Atacama Large Millimeter Array (ALMA) observations, we investigated the properties of the environment of this component through H I, CO (3-2), and HCO+ (4-3) lines and the multi-band radio continuum emission. We found that the comp D1 shows the brightest CO, HCO+ line emission, as well as multi-band radio continuum emission. The environment around D1 shows no clear velocity structure associated with circular motions, making it different from most other OH megamasers (OHMs) in the literature, which might have been caused by an effect during the merger stage. Meanwhile, we found that the CO emission shows three velocity structures around D1, including the central broad FWHM region, the double peak region where the CO line profile shows two separated peaks, and the region of the high-velocity clouds where the CO line peaks at a high velocity ( 11000 km s-1). Similarly, H I observations in absorption also show high-velocity clouds around the D1 region, which might be due to inflows caused by the merging of two or more galaxy components. Based on the high-resolution K-band VLA and L-band VLBA observations of the radio continuum emission, we derived the brightness temperature in the range K to K, which is consistent with other starburst dominant OHM sources in the literature. The multi-band VLA observations show that the radio continuum emission of comp D might also have contributions from free-free emission, besides synchrotron emission. As a concenquence, these results support a starburst origin for the OHMs, without the presence of an AGN.
Key Words.:
OH megamaser galaxy: starburst: radio continuum: galaxy radio lines: general.1 Introduction
OH megamasers (OHMs) are luminous 18 cm masers found in (ultra-)luminous infrared galaxies ([U]LIRGs) produced predominantly by major galaxy mergers (Roberts et al. 2021). Generally, OH molecules are believed to be pumped by far-IR radiation (Lockett & Elitzur 2008; Huang et al. 2018) and triggered by dense molecular gas (Darling 2007). Both star formation and OHM activity are consequences of tidal density enhancements accompanying galaxy interactions (Darling 2007). Theoretical studies show that major galaxy mergers are the dominant processes leading to supermassive black hole (SMBH) growth at high masses (), which can destabilize large quantities of gas, driving massive inflows towards the nuclear region of galaxies and triggering bursts of star formation (Storchi-Bergmann & Schnorr-Müller 2019).
The dominant energy source in the central regions of OHM galaxies usually presents features of starburst and active galactic nucleus (AGN), and in turn the radio continuum emission is produced from these activities. Based on multi-band observations, Hekatelyne et al. (2020) present a hypothesis that OHM galaxies harbor a recently triggered AGN. High-resolution observations might be essential to determine whether OHM galaxies are hosting an AGN or compact starburst, and their connections with merging stages and other environmental parameters (see Peng et al. 2020, and references therein).
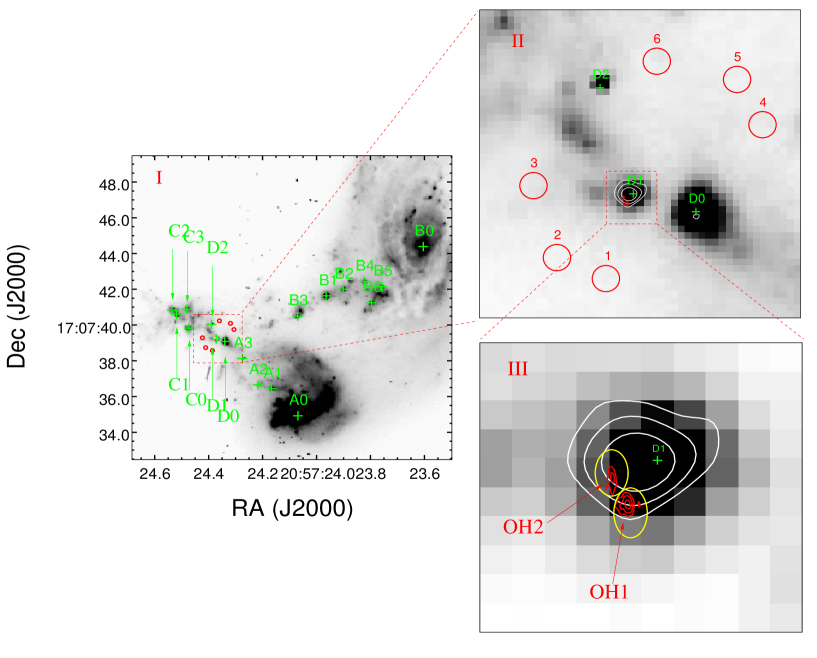
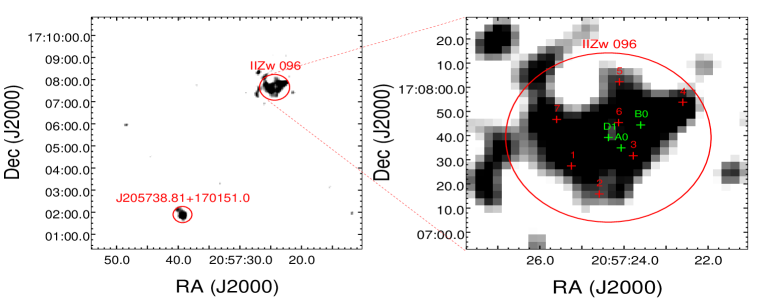
IIZw 096 is classified as an LIRG (Inami et al. 2010), and is one of the most luminous known OHM galaxies (Bottinelli et al. 1986). This particular source is the second system to host formal megamasers involving both OH and species (Wagner 2013; Wiggins et al. 2016). Optically, IIZw 096 shows complex morphology (Inami et al. 2010); it contains four main regions, denoted as A, B, C, D (see Fig. 1), where sources A and B are possibly two spiral galaxies. Near-IR imaging and spectroscopic observations show that the source D is a powerful starburst not associated with the primary nuclei (sources A and B), which could be a starburst in the disturbed disk of source A, or even the nucleus of a third galaxy (Goldader et al. 1997; Inami et al. 2010).
The results from MERLIN observations show that the OH megamaser emission originated from comp. D1 and it is distributed in the form of an elongated structure ( 300 pc) with a velocity range of 200 km s-1 (Migenes et al. 2011). The estimated lower limit for the enclosed mass is , which is consistent with a massive black hole, and an AGN could also be in this merging system (Migenes et al. 2011). High-resolution EVN observations (Cooprider 2010) found that the OH emission originated from two regions (OH1 and OH2 in Fig. 1) and indicated that a new epoch VLBI observations could confirm the assumed structure of the OHM emission and potentially determine the proper motions of the two components.
Generally, the OH megamasers are produced through significant galaxy merging; however, the environment that facilitates such a phenomenon is still not completely understood, primarily because OHM originating from a central AGN or represents a transition stage between a starburst and AGN (Hekatelyne et al. 2018). IIZw 096 is one of the few bright OHM galaxies in OH 1667 MHz line emission, potentially observable for a detailed study of compact megamasers with high-resolution spectral-line VLBI observations. This particular source also contains rich merging components from the infrared and optical observations as noted in the literature (e.g. Goldader et al. 1997; Inami et al. 2010; Migenes et al. 2011). It is likely to be a rare nearby example potentially for studying the environment around the OH megamaser emission regions. The main aims of this paper are to further study the properties of the high-resolution structure of the OHM emission (Cooprider 2010) and find its possible connections with the environmental conditions, including the existence of dense gas, compact radio continuum emission, and also the possible merging status of the pertinent galaxies. The details about radio data collection, reduction, and associated analyses are presented in Section 2. The results and discussion are presented in Sections 3 and 4, respectively. In Section 5, we provide a summary of the primary results and conclusions of this paper.
2 Data collection, reduction and analysis
2.1 The archival radio data
We have collected the archival radio data from EVN, VLBA, VLA, and ALMA. The detailed information about the spectral line projects and supporting multi-frequency continuum data are presented in Table 1 and Table 3, respectively.
| Observing Date | Frequencies | Line | Array | Phase | Program | Beam | P.A. | rms | |
|---|---|---|---|---|---|---|---|---|---|
| (GHz) | Calibrator | km s-1 | (”) (”) | () | (mJy/beam) | ||||
| 2005Jun08 | 1.6 | OH | J2052+1619pr | EK020 | 6.1 | 0.005 0.008 | -60 | 0.26 | |
| 2010Jun08 | 1.6 | OH | J2052+1619pr | ES064B | 3.1 | 0.0280.005 | 9 | 0.67 | |
| 2015Jul16 | 333.3 | CO (3-2) | ALMA | J2051+1743 | 2012.1.01022.S | 5.4 | 0.200.17 | -54 | 1.91 |
| 2015Jul16 | 343.9 | HCO+ (4-3) | ALMA | J2051+1743 | 2012.1.01022.S | 5.4 | 0.190.16 | -55 | 1.92 |
| 2001Jul22 | 1.4 | H I | VLA-C | 2035+189 | AG0613 | 22.2 | 19.717.9 | 72 | 0.33 |
Notes. Column (3): The atom or molecular lines. Column (4): The observational array. : Ef, Jb, CM, Nt, Tr, Wb, On, Mc, Ur, Hh, Ar. : Ef, Jb, On, Mc, Tr, Sh, Ur, Wb. Column(5): The phase-reference calibrator for EVN projects and phase calibrator for VLA and ALMA projects. The index ’pr’ means the project is in phase-reference mode. Column (6): The program name. Column (7): The spectral velocity resolution in km s-1. Column (8) and (9): The beam FWHM and position angle. Column (10): The 1 noise level for channel image.
| Line | components | RA(J2000) Dec(J2000) | Gauss amplitude | Gauss center | Gauss FWHM | Gaussian area |
| (hh mm ss,+dd mm ss) | mJy | km s-1 | km s-1 | mJy*km s-1 | ||
| OH1667 | 2005-OH1 | 205724.375+170739.144 | 21 3 | 10887 1 | 67 2 | 1429 220 |
| 2005-OH2 | 205724.377+170739.186 | 7.2 1.1 | 10805 2 | 82 3 | 588 94 | |
| 2010-OH1 | 205724.375+170739.145 | 25 4 | 10884 1 | 53 1 | 1359 198 | |
| 2010-OH2 | 205724.377+170739.187 | 5.5 0.8 | 10803 1 | 74 2 | 414 63 | |
| CO | D1: | 205724.372+170739.221 | 153 1b | 10888 1 | 179 1 | 29176 155b |
| A0: | 205724.069+170734.921 | 6.4 1.2b | 10768 3 | 34 7 | 232 46b | |
| B0: | 205723.604+170744.387 | 14 2b | 10880 8 | 124 19 | 1821 257b | |
| C0: | 205724.473+170739.826 | – | – | – | – | |
| DP1 | 10 2 | 10960 7 | 89 15 | 634 217 | ||
| 4.5 1.3 | 11065 14 | 63 27 | 303 146 | |||
| HCO+ | ALL | 205724.372+170739.221 | 43 1 | 10886 1 | 180 3 | 8283.5 151.9 |
| D1 | 205724.372+170739.221 | 27 1b | 10880 2 | 196 4 | 5509 102b | |
| H I | total | 205724.372+170739.221 | 12 1 | 10799 5 | 183 12 | 2391 143 |
| – | -2.9 0.4 | 11016 38 | 53 91 | - | ||
| D1 | – | 1.8 0.5b | 10780 17 | 135 35 | 247 90b | |
| – | 1.0 0.4b | 10863 19 | 49 38 | 54 44b | ||
| – | -1.6 0.6b | 10994 18 | 91 42 | - | ||
| J205738.81+170151.0 | 205739.307+170153.762 | 2.9 0.8 | 10689 18 | 108 35 | 341 136 | |
| – | 4.4 0.9 | 10820 12 | 118 25 | 549 155 |
Columns (1): The line type; (2): The emission components; (3): RA and Dec of the components or spots; Columns (4)-(7) The Gaussian fitted model parameters, where ’b’ stands for the units for those values that should be divided by beam.
2.2 Data reduction
The VLBI data (EVN and VLBA) were calibrated using the NRAO Astronomical Image Processing System (AIPS) package. The main procedures of the VLBI data reduction include ionospheric correction, amplitude calibration, editing, bandpass calibration, instrumental phase corrections, antenna-based fringe-fitting of the phase calibrator, and subsequently applying the solutions to the target source. The EVLA data were calibrated using the pipeline of the Common Astronomy Software Application package (CASA McMullin et al. 2007). The calibration of historical VLA data was done in AIPS following standard procedures. For determining accurately the velocities of the line emission, we have also corrected for the effects of the Earth’s rotation and its motion within the Solar System.
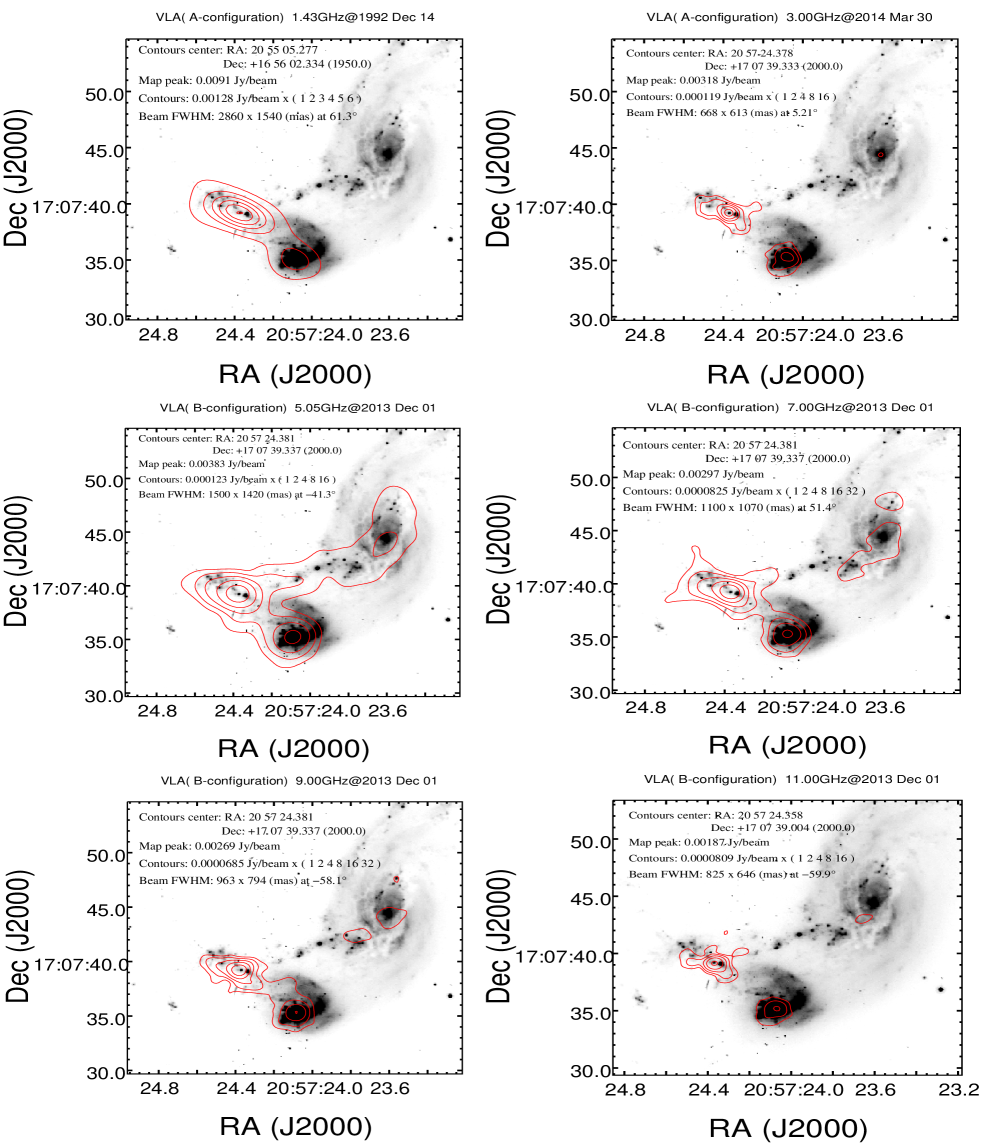
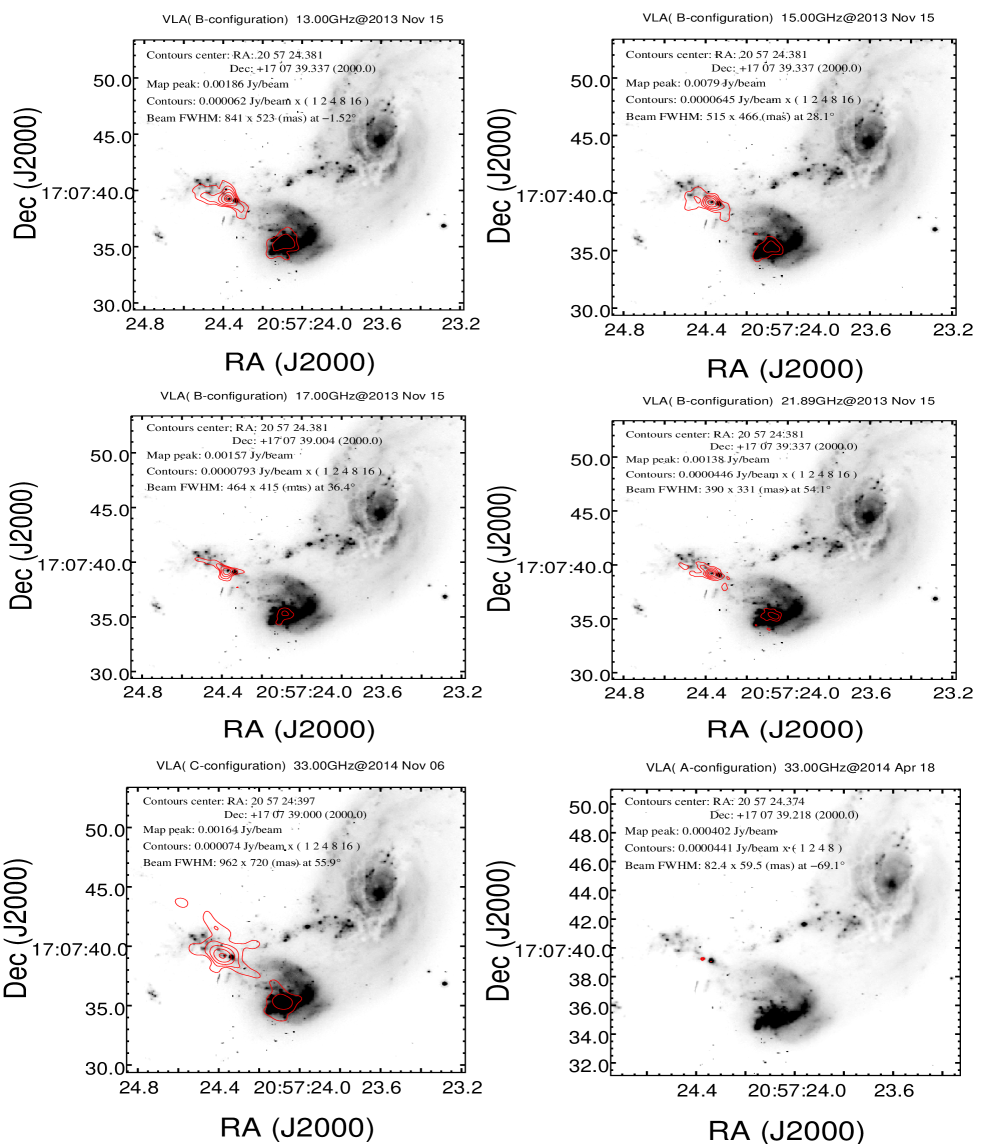
We imported all the calibrated data into the DIFMAP package (Shepherd 1997) to obtain the continuum and spectral line (OH and H I) channel images. The EVN data at epoch 2005Jun08 (see Table 1) show a high signal-to-noise ratio for the peak line channel image (S/N 60). We have cleaned the brightest region in this peak line channel image (V 10886 km s-1) and use these clean models to calibrate the data (phase-only self-calibration) prior to making all the channel images, which is similar to the self-calibration procedure performed by Cooprider (2010) for this project. We conduct no self-calibration for other continuum and line emission projects. The multi-band VLA observations have different resolutions and show extended structures (see Fig. A.11). We have remade these images with the same cell size and restored the beam to be 2” 2” (the beam size of the VLA-A L-band map, see Vardoulaki et al. 2015). Subsequently, we measured the total flux densities and uncertainties of comp D and A (see Table 3) by fitting with a single component using task ”imfit” in the CASA package.
3 Results
3.1 Two epoch EVN results of OH megamaser emission
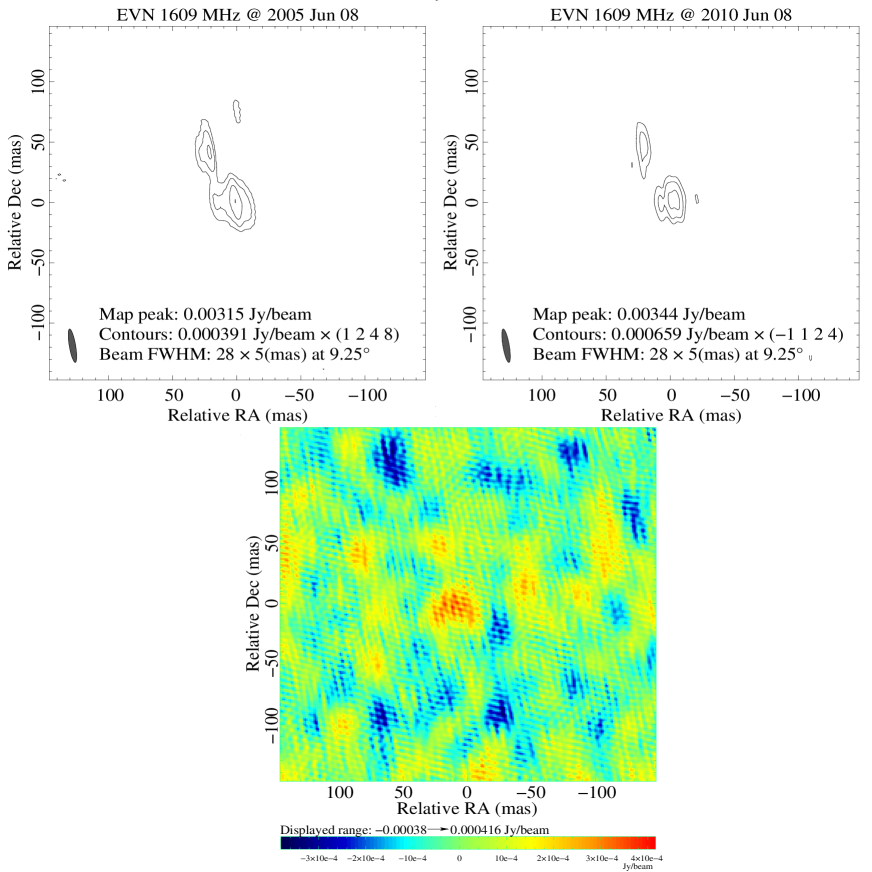
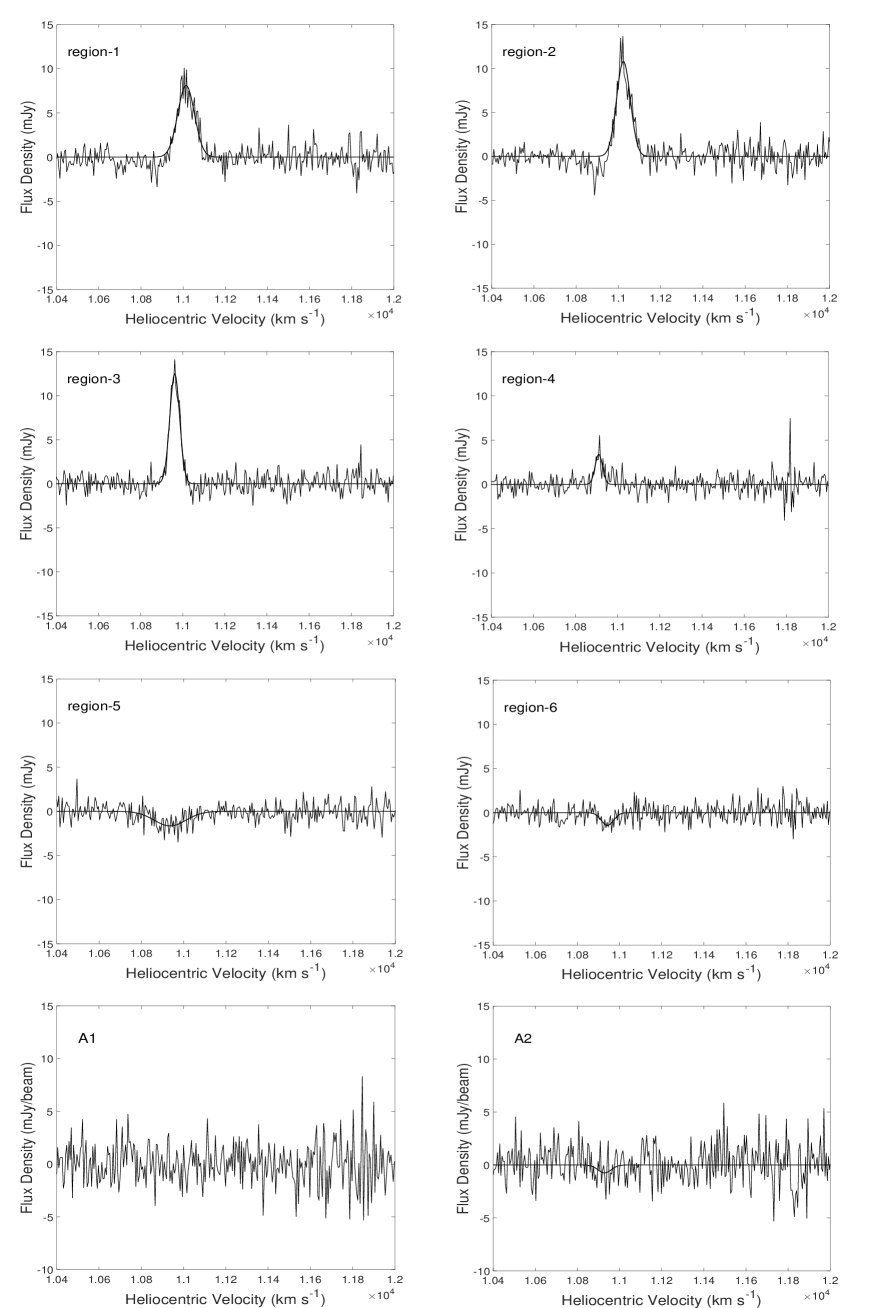
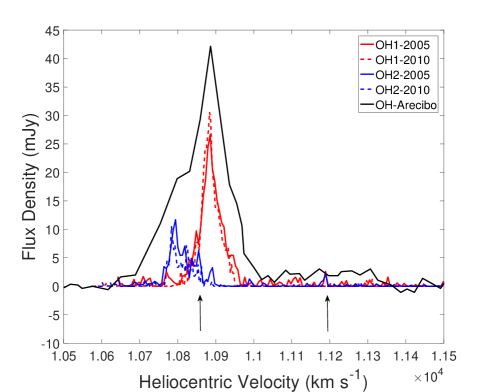
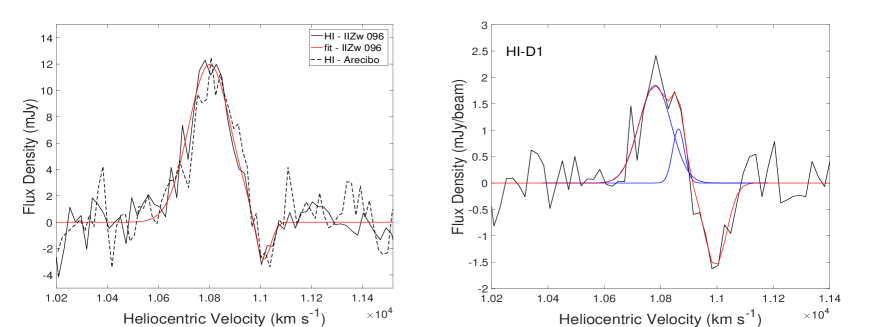
Cooprider (2010) has presented the results from one-epoch EVN observation (project EK020, see Table 1) and found that the high-resolution OH emission is distributed in two regions as OH1 and OH2 from the D1 component (see Fig. 1). Based on the two epoch spectral-line EVN observations (EK020 and ES064, see Table 1), we have investigated the integrated OH 1667 line spectrum by averaging the 3 signals from each channel image over two elliptical regions for OH1 and OH2 (see Fig. 2). We can see that the detected OH line profiles are partly resolved and consistent with the Arecibo observations.
The uncertainties of integrated 3 flux density from each channel image is related to the area of the 3 pixels and the VLBI calibration error (10% of the measured flux): , where N represents the number of beams for the region of the 3 pixels and is the peak flux density. The estimated uncertainties of the 3 profiles of OH1 and OH2 regions are about 4-5 mJy for the brightest channels and less than 1 mJy for the weak channels. Based on these uncertainties, the OH profiles from the two epochs are consistent with each other and show no evident variabilities.
We have also averaged the channels of OH 1667 MHz line emission from 10750 to 10950 km s-1 (see Fig. 2) and imaged the OH1 and OH2 regions (see Fig. A.12). We found that the peak positions of OH1 and OH2 show no evident changes between the two-epoch EVN line observations (see Table 2). Because the OH 1665 MHz line emission is resolved with high-resolution observations, we have averaged the channels for this line emission (V 11080-11320 km s-1, see Fig. 2) and combined the calibrated data from the two EVN projects (using task ”DBCON” in AIPS). As a result, the OH 1665 MHz line emission is detected at 6 level with a peak of about 0.42 mJy/beam distributed at the OH1 region (see Fig. A.12).
3.2 The high-resolution CO (3-2) and HCO+ (4-3) line emission of this galaxy
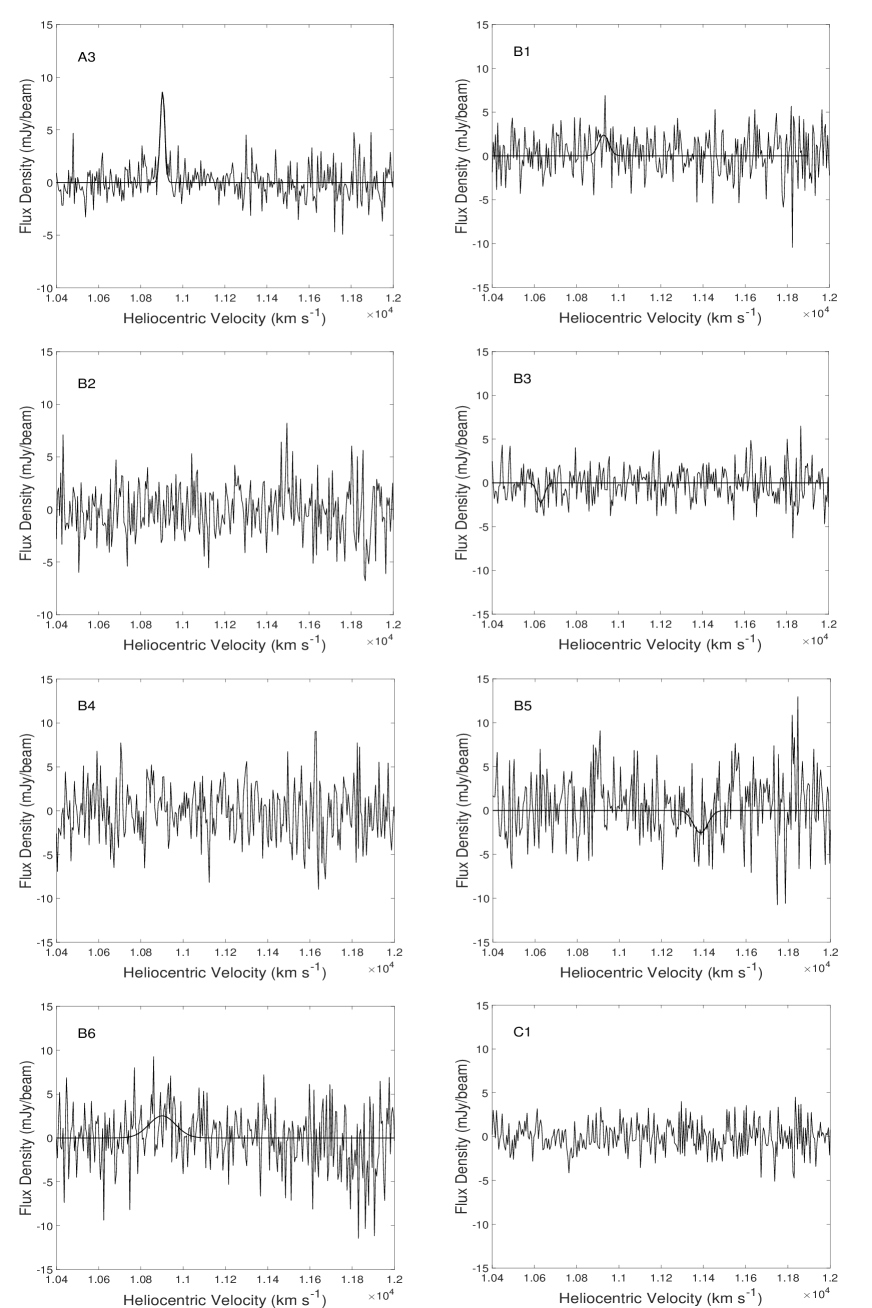
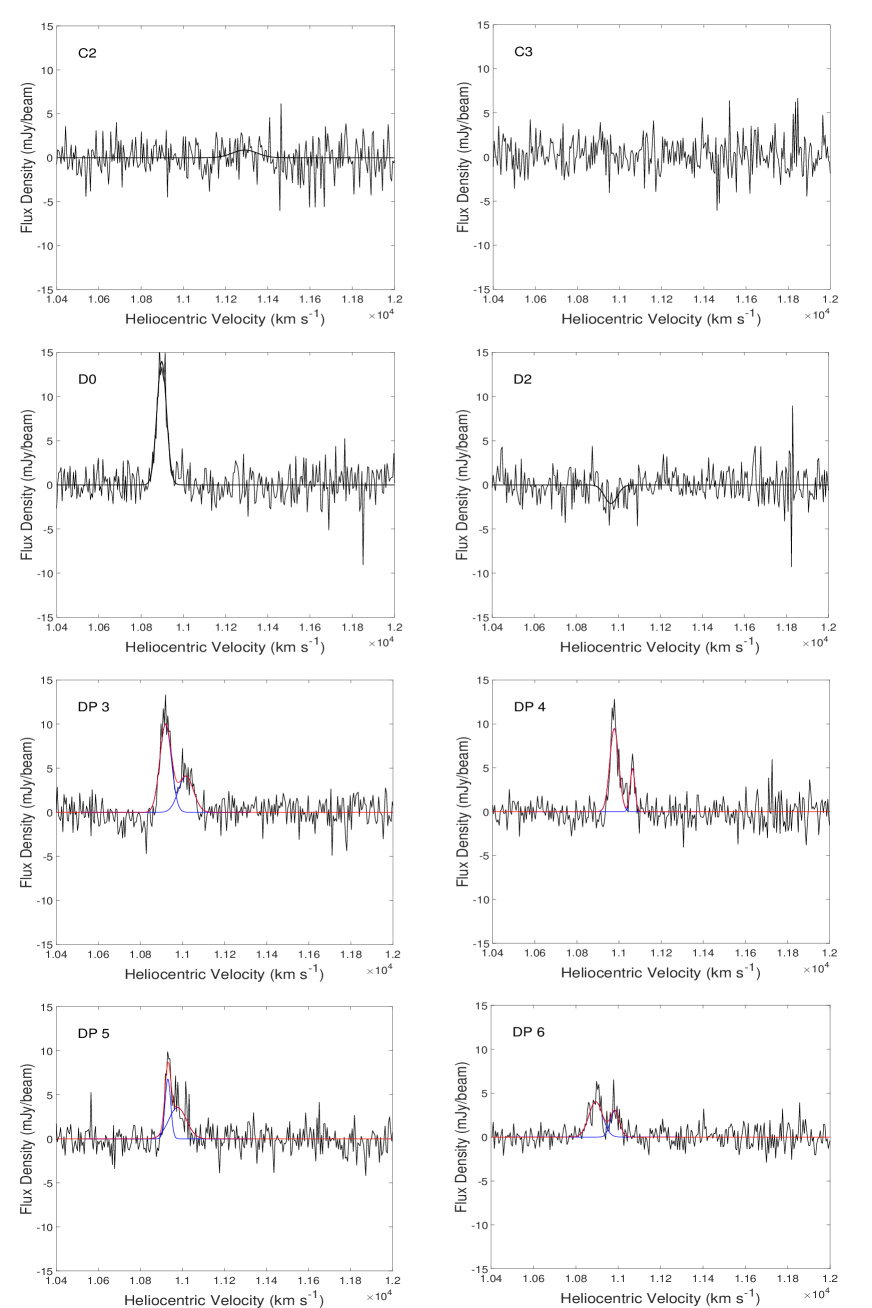
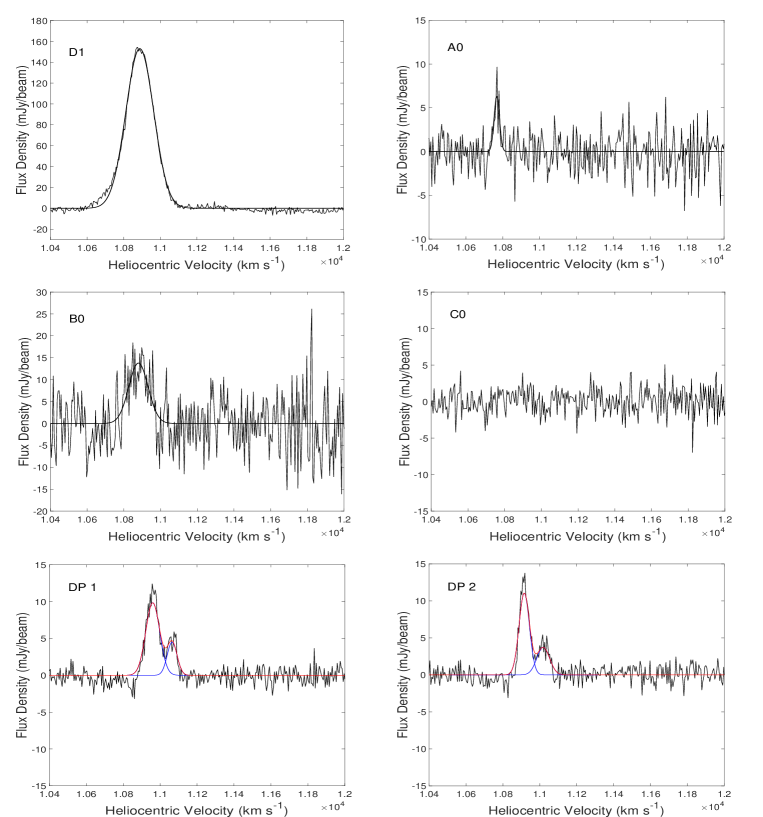
The HST I-band image (see Fig. 1) has shown that the OH emission region coincides with D1, surrounded by nuclei A, B, together with some other bright regions. We have selected 12 bright spots from the I-band image, named A1-A3, B1-B3, D1-D3, C1-C3, and we then extracted the CO (3-2) and HCO+ (4-3) spectra at these spots from the primary beam (PB) corrected image files available online for the ALMA project 2012.1.01022.S (see Table 1).
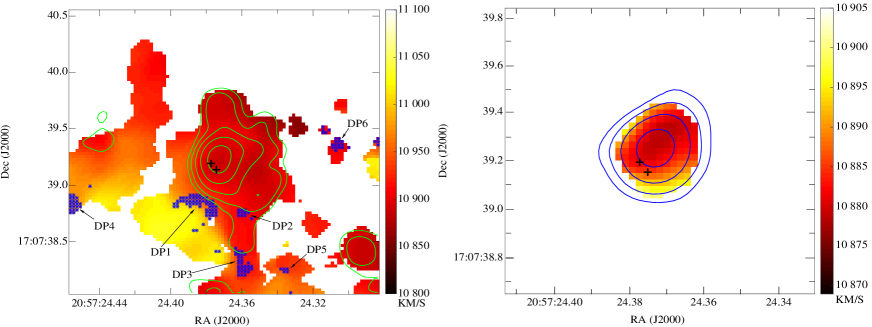
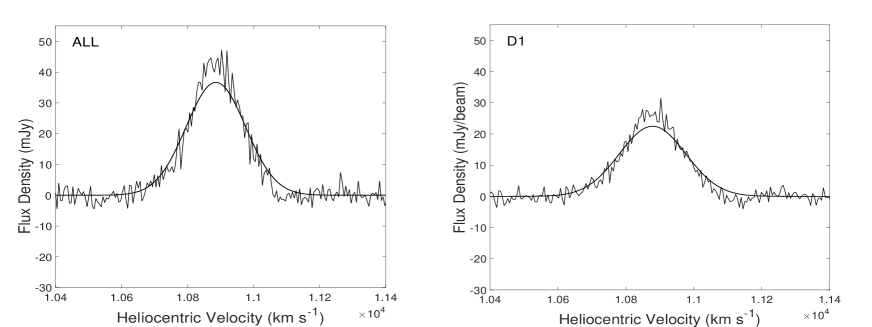
We found that D1 is associated with the brightest CO (3-2) line emission ( 153 mJy/beam) among all selected regions (see Fig. 3 and A.13), and at least ten times brighter than other spots in the peak CO(3-2) emission (e.g. A0 6.35 mJy/beam, B0 13.80 mJy/beam, see Table 2 and 4). We further extracted the CO spectra from six regions around D1 (see Table 4 and Fig. A.13), and noted that all the selected areas showed CO spectra with peak velocities higher than the D1 component. The CO (3-2) emission in regions 1, 2 and 3 is much brighter than regions 4-6, which means that the southeast region might have higher CO densities at high velocities ( from 10935.5 km s-1 to 11023.9 km s-1) as compared to the north-west region. We further present the velocity structure of the CO emission around the D1 component (see Fig. 4); and confirmed that some regions show high-velocity clouds, while other areas show clear double peak emission lines (DP regions, DP1-DP6). The CO spectra in these regions are presented in Fig. A.13.
We find that the HCO+ line can only be detected in the D1 region (see Fig. 5), and the velocity map shows that some pixels at the edge exhibit slightly higher peak velocities (see Table 2 and Fig. 4). We have found that the CO and HCO+ line profiles extracted at the central region around D1 (with a size of 400 mas) all show broad FWHM (¿ 100 km s-1) features, which are much wider than in other regions around this merging system.
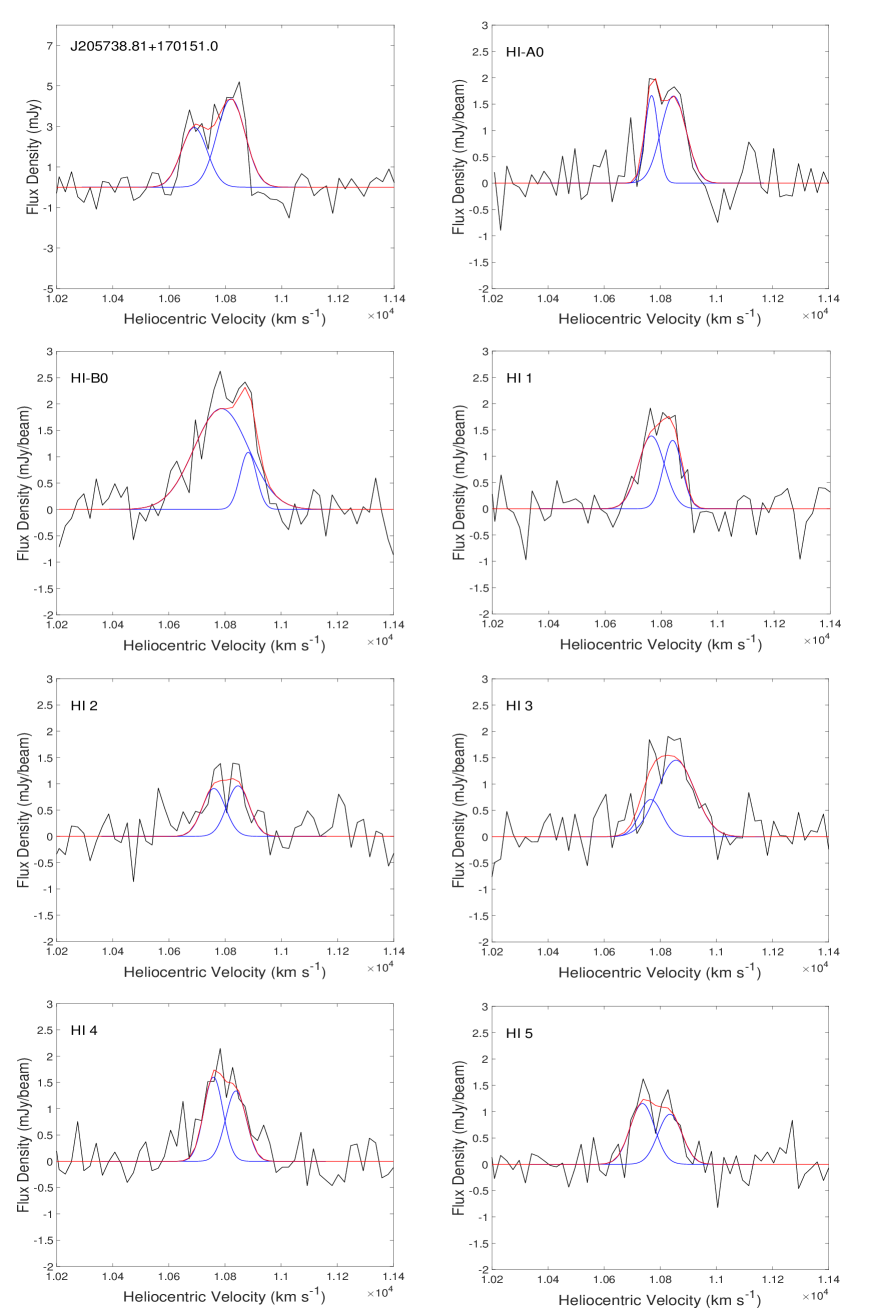
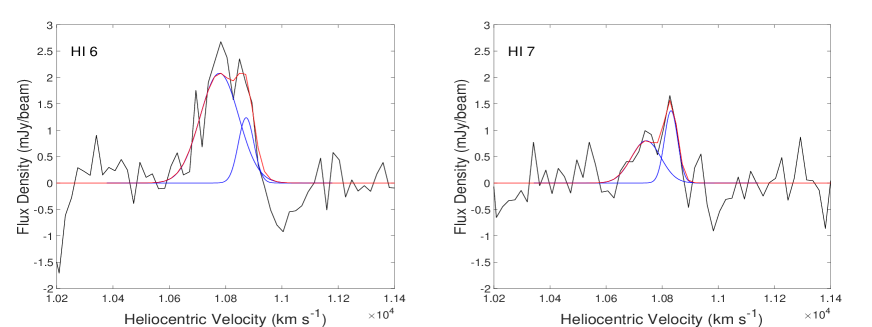
3.3 The H I emission from VLA project AG0613 (see Table 1)
The H I channel image of IIZw 096 (at velocity about 10849.3 km s-1) is presented in Fig. 6. We see that there are two bright H I emission regions: one is IIZw 096, the other is a new galaxy centered at RA: 20 57 39.307 and Dec: +17 01 53.762. The optical counterpart is likely to be SDSS J205738.81+170151.0, based on their celestial coordinates, as there is no optical redshift of this galaxy. The H I profiles of the two galaxies and spots in IIZw 096 are presented in Fig. 7 and A.14. The majority of the H I emission (3 ) for IIZw 096 is distributed in a region with a size of about 70”70” (see Fig. 6) and the integrated H I spectrum in this region (see Fig. 7) agrees well with the H I spectrum from Arecibo observations by Courtois & Tully (2015). The H I spectra from VLA and Arecibo observations show that the galaxy contains both H I emission and absorption. The H I gas in absorption is detected only corresponding to the D1 component (see Fig. 7), and this result is consistent with the GMRT observations made by Dutta et al. (2019). The H I absorption feature is at the highest end of the H I spectrum velocity ranges. We have found that the H I spectra from spots around IIZw 096 shows similar characteristics (see Table 5 and Fig. A.14) and exhibit no evident orbiting velocity structures caused by the circular motions of the gas.
3.4 The high-resolution radio continuum emission
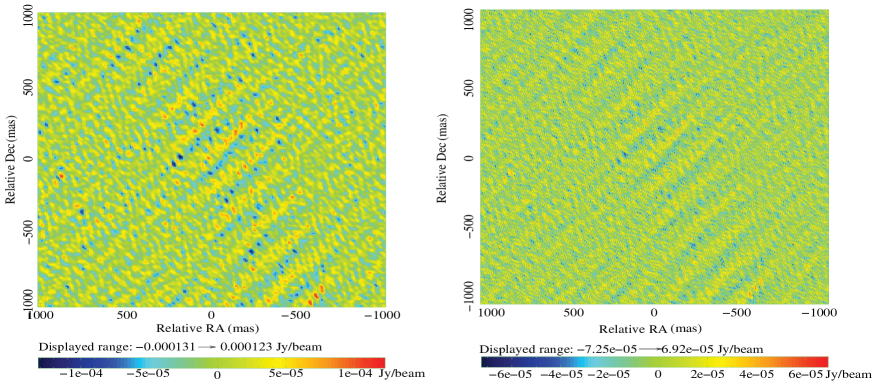
We have collected one epoch of VLBA data (see Table 3) for obtaining the high-resolution images of the continuum emission. The results show that no significant continuum emission detection occurs at a noise level of about 14.8 to 23.2 Jy/beam (see Fig A.16).
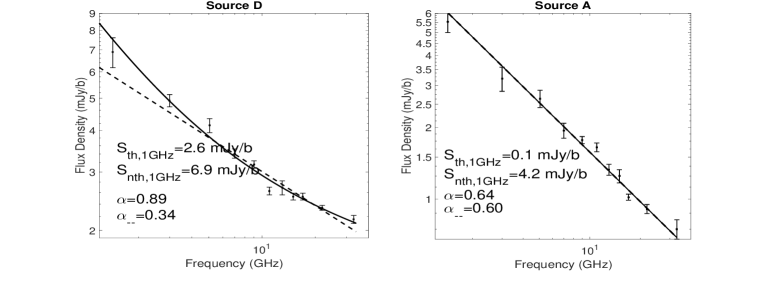
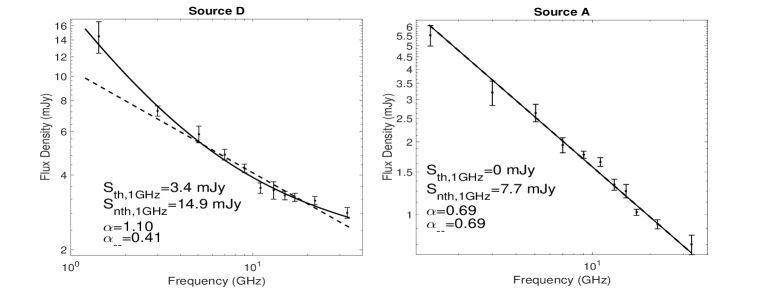
The VLA projects of this source and the measured radio flux densities of D and A are listed in Table 3, with the radio maps overlaid on the HST image of this source presented in Fig A.11. The data reduction and flux densities measurement methods are presented in Section 2.2. Figs. 8 and A.15 show the multi-band radio spectra of D and A from the total and peak flux densities (see Table 3). We have used two models, one employs a single power-law and the other uses a mixed equation of single power-law and free-free emission ( -0.1+ -α), to fit the radio spectra. We see that the radio spectra of D cannot be well-fitted with a single power-law model; it is fitted with the mixed equation, which indicates that the source D might contain free-free emission and steep synchrotron emission.
4 Discussion
As the detected OH line emission mainly originated from the D1 component of this merging system, we further investigated the high-resolution CO, HCO+ and H I line emission and radio continuum emission of D1 and some other regions of this source (see Section 3). A combination of these properties might be helpful in analyzing the possible scheme associated with the OH emission in this source.
4.1 The total mass of D1 estimated from CO and HI observations
The mass contained in a region can be an indicator of whether an AGN might be present. The D1 region has been investigated in detail and we list here both our mass estimates of D1 and those published in the literature.
1. Based on H-band optical image and solar metallicity, Inami et al. (2010) estimated that the mass of D1 is approximately 1–4 .
2. Based on the OH line velocities and emission region from MERLIN observations, Migenes et al. (2011) obtained a lower limit for the enclosed mass of about 3 .
3. The masses can be derived from CO (1-0) fluxes detected by the interferometer with the following equation (Russell et al. 2017; Planesas et al. 1991):
| (1) |
where is the CO-to- conversion factor in units of , z is the redshift, is the CO(1-0) flux in Jy, is the luminosity distance of this object in Mpc. The CO(3–2)/CO(1–0) line ratio is about 0.51 for this galaxy (Leech et al. 2010), and likely, the LIRGs, Nearby Star-forming Galaxies, and Active Galactic Nuclei, all show similar line ratios (see Leech et al. 2010; Lamperti et al. 2020). We adopted the = 0.4 for starburst galaxies and ULIRGs used in Russell et al. (2017); Downes & Solomon (1998), which is about five times lower than the Galactic value.
The is about 148 Mpc for this source, the d is about 29175.5 mJy km s-1/beam (see Table 2), and the derived is about 2.5 in one beam with size of 0.2” 0.16” ( 134 pc 107 pc). Since the CO line emission of source D1 is much brighter than B0 and A0 (see Table 2), the central mass in one beam for B0 and A0 are about 1.6 and 2.0 , respectively, which means that D1 possibly contains a much more massive central mass than the other two apparent nuclei.
4. In the optically thin case, the H I mass () can be derived from the integrated line flux with the equation: , where is the line profile in Jy, integrated over the Doppler velocity V in km s-1. The d for the H I spectrum of D1 is about 300.58 mJy km s-1/beam (see Table 2), whereby the H I mass are about 1.6 in one beam with a size of 19.7” 17.9” ( 13.2 kpc 12.0 kpc). Similarly, the estimated H I mas from the total H I spectrum (see Table 2) is about 1.2 for the total H I mass in IIZw 096.
All the above four estimated masses through different methods indicate that there is a massive mass of about concentrated in the central region of D1. The direct proof of the existence of a super-massive black-hole requires very high angular resolution to probe close to the Schwarzschild radius, which has been difficult to establish (see Lo 2005). Alternatively, the large concentrations of molecular gas might result in high gas surface densities, which may signify that a luminosity source other than star formation, e.g., an AGN (Bryant & Scoville 1999).
Based on the derived and the physical size of one beam from CO (3-2) line observation (see the third estimation), the surface density is estimated to be about 2 , which is consistent with the value of Arp 220 as determined by Barcos-Muñoz et al. (2015). The high gas surface density value resembles the maximum stellar surface density of (Hopkins et al. 2010). It is believed that the most massive nuclear star clusters can reach mass surface densities of or more (see Neumayer et al. 2020). It is to be noted that the high surface gas density found in this source appears still below the highest mass surface densities in nuclear star clusters. Meanwhile, the excessive-high gas surface density is also consistent with the view that there is a possibility it also hosts an obscured AGN, which might be responsible for the formation of an megamaser in this galaxy (see Wiggins et al. 2016; Migenes et al. 2011).
4.2 Comparison of OH and other line emissions
4.2.1 The merging and inflow of gas to the central region
The merging or interaction between two or more galaxies can reduce the angular momentum of the circumnuclear material and enhance the inflow of material from galactic scales into the close environments of AGN (Ricci et al. 2021; Di Matteo et al. 2005). We found that the H I profiles extracted from locations away from the center of this merging system (regions 1,2,4,5,7, and A0, see Fig. A.14 and Table 5) show similar H I profiles. They may contain two components, with central velocities about 10760 km s-1 and 10840 km s-1, respectively. The optical redshift of this source shows a system velocity of about 10770 km s-1 (e.g. Dutta et al. 2019; Kim et al. 1995), which is consistent with the low-velocity H I component. The similar components for H I emission profiles on a large scale at various regions indicate that this galaxy is in a stage of ongoing merging. It suggests that the H I gas clouds in this system might be distributed in a common face-on envelope and that the orbiting velocity cannot be measured through this observation, which is also observational evidence for intermediate merger (e.g. Ricci et al. 2021; Haan et al. 2011). The high-velocity line component might also be related to the gas clouds moving towards the center caused by the merging process.
The regions HI6, D1, and B0 show two-components with slightly higher velocities (about 10780 km s-1 and 10880 km s-1) than other regions (see Fig. 7 and A.14, and Table 5). Since these regions are close to the central region of this merging system, which contains massive nuclei (B0) and a possible supermassive region (D1) (see section 4.1), the velocity offset with other regions might be caused by the velocities directed toward the center of mass. The H I emission is completely resolved with GMRT observations with a resolution of about 2” (Dutta et al. 2019). The H I absorption profile shows higher velocities than the H I emission lines (see Fig. 7). The detected H I gas clouds in absorption were detected towards D1, which indicates that they may be closer to the central D1 than the large scale H I gas in emission. The velocity of the H I absorption profiles is consistent with the high-velocity clouds seen from the velocity structure of CO emission (see Section 3.2). The high-velocity H I and CO clouds around D1 might be related to the inflows towards the central region of this source.
4.2.2 The formation of OH line emission
Two epoch EVN observations of the OH 1667 MHz line have confirmed the results from Cooprider (2010) that the high-resolution OH megamaser emission is detected from two regions (OH1 and OH2 as shown in Fig. 1). The OH1 emission is about two times brighter than OH2 (see Table 2). We further found no evident variation of the OH properties from the two epoch observations (see section 3.1). Baan et al. (2008) show that the high-density tracers represent the molecular medium in the regions where star formation is taking place, which indicates a strong relationship to the far-infrared luminosity. In particular, the CO(3–2) transition is commonly used to trace the warmer, denser components of the ISM associated with star formation (Leech et al. 2010). The HCO+ is also believed to be a good ’dense gas’ tracer (Farhan et al. 2020).
We have presented the results from the high-resolution observational data of OH 1667 MHz, CO(3-2), HCO+, and HI emission. We have found that the two OH emission regions (OH1 and OH2) reside in a dense gas environment (see Fig. 4). The central velocity of OH2 ( 10804 km s-1) is consistent with the peak velocity of the total H I emission spectra (see Table 2 and Fig. 7). The central velocity of OH1 ( 10886 km s-1) is consistent with the dense gas tracer CO (3-2) and HCO+ of the D1 component. The OHM emerges when mergers experience a tidally driven density enhancement (Darling 2007). Since the environment from CO (3-2) emission around D1 shows three regions with different velocity structures (see section 3.2), one possible scheme is that this region is in a merging stage. The OH1 and OH2 also emerge from the merging process and possibly originate from two or more systems. Our results show that the OH indeed is associated with the densest molecular gas regions found in the IIZw 096 system, agreeing with a scenario where star-formation is crucial for the formation of OHMs (Lo 2005).
4.2.3 Comparison with a general picture of OH megamaser emission
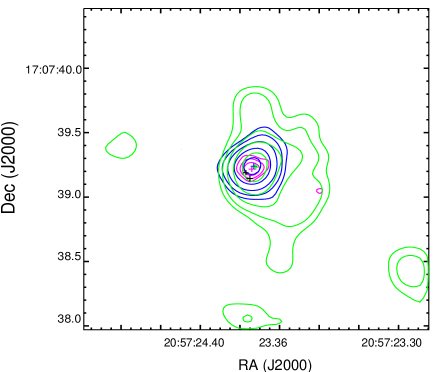
The Ka-band VLA-A observations of this source (see Fig. 1) present the highest resolution radio continuum emission. We note that the CO(3-2), HCO+, and Ka-band VLA-A radio continuum emission are roughly coincident with each other, while the two OH emission regions (OH1 and OH2) arise from a location about 50-76 mas to the center of the 33 GHz emission (see Fig. 9).
Baan (2009) showed that an FIR radiation field from the dust could pump the OH molecules in an environment with n() in the range to 2 . The maximum density of an OH maser emitting gas is of the order n()= , while higher densities will thermalize the energy levels and quench the maser emission (Parra et al. 2005). We have calculated the n() using the following assumptions, n() = is about 4 , where is about 2.5 and V is the volume of the central region in one beam with size of about 130 pc in diameter (see Section 4.1). Since the accuracies of these contour maps are all less than 3.3 mas (estimated from , where beam stands for the beam FWHM, S/N stands for the signal/noise ratio), the offset might be related with the high n() in the central region.
Generally, high-resolution observations of the OH megamaser emission will find a velocity gradient across the region with two or more OH emission components, e.g., Arp 220 (Ulvestad 2009), III Zw 35 (Trotter et al. 1997), IRAS 17208-0014 (Momjian et al. 2006), and IRAS 12032+1707 (Pihlström et al. 2005), which is a sign of circular rotating disc or torus. Based on these high-resolution imaging of the 1667 MHz emission, Pihlström (2007) presented a general picture where most of the maser emission arises in thick circumnuclear structures. Parra et al. (2005) and Lockett & Elitzur (2008) showed that a clumpy maser model could provide a phenomenological explanation for both compact and diffuse OH emissions. Each maser cloud produces a low-gain, unsaturated emission; while compact emission would be observed when the line of sight intersects many maser clouds. This particular model has explained several OHM sources, e.g., III Zw 35, IRAS 17208-0014, Mrk 231, NGC 6240 (Lockett & Elitzur 2008).
MERLIN observations of IIZw 096 found weak evidence for a velocity gradient along the right ascension direction (Migenes et al. 2011). However, the EVN observations showed that such a velocity gradient was a sign of double structure, and in this case no velocity gradient could be detected (see Cooprider 2010). We also found that IIZw 096 also showed no clear presence of a velocity gradient from CO and HCO+ velocity distributions around D1 (see Fig. 4). Since the velocity fields of OHMs might only become ordered during the final stage of merging (Peng et al. 2020), this specific source might still be dominated by a phase of intense merging, as seen from the optical images, rather than an ordered circumnuclear disk or torus. Such a scheme agrees very well with the view provided by Goldader et al. (1997) that this source contains very young starbursts seen prior to the final major-merger stage.
Generally, the merger classification scheme is based on the morphology obtained from the high-resolution optical or infrared images. IIZw 096 was classified to be at the intermediate stage of the merging process based on the reported morphological characteristics (e.g., Goldader et al. 1997; Haan et al. 2011; Ricci et al. 2021). Wiggins et al. (2016) have shown that galaxies with coexisting OH and water megamasers might be a distinct population at a brief phase along the merger sequence due to the independent natures of the two types of maser emission. Although extensive effort has been made to detect OH+water megamasers, IIZw 096 and Arp 299 are the only two galaxies that are confirmed with such a dual-megamaser (see Wiggins et al. 2016, and references therein). The similarities between IIZw 096 and Arp 299 have shown that they are both luminous intermediate stage starburst (see Goldader et al. 1997; Inami et al. 2010; Wiggins et al. 2016). The evidence of inflow found in the two galaxies (see Falstad et al. 2017, and Section 4.2.1) might also be a similarity related to their analogous merging stage. Since strong HCN and OH emissions are both detected in the source IC 694 of Arp 299 (Casoli et al. 1999; Klöckner & Baan 2002), it further confirms that the OH megamaser emission is associated with the dense gas environment in the two galaxies. One significant difference between the two galaxies is in their velocity structure: a regular velocity gradient is seen around IC 694 from H I, CO, and OH line emission (Polatidis & Aalto 2000, 2001; Casoli et al. 1999), while we found no velocity gradient in IIZw 096. An explanation given by Sargent & Scoville (1991) is that Arp 299 is at a more advanced state of merging, and IC 694 is well on its way to becoming the ultimate core of the merger. Although the two galaxies might be both at the intermediate stage of merging, the absence of a velocity gradient means that IIZw 096 might be experiencing a slightly earlier stage of merger as compared to Arp 299.
4.3 The radio continuum
The OHM galaxies could either represent a transition stage between a starburst and the emergence of an AGN through the merging process (Peng et al. 2020) or harbor a recently triggered AGN (Hekatelyne et al. 2020). IIZw 096 is the second object to co-host both water and OH megamasers, and these dual-megamasers might be only emerging during a brief phase of the galaxy evolution (e.g., from starburst nucleus to an AGN, see Wiggins et al. 2016). Migenes et al. (2011) first proposed a possibility that IIZw 096 might host an obscured AGN. However, multi-band observations reported in the literature show no clear evidence for an obscured AGN: the X-ray spectrum can be well-fit using the star-formation mode (Ricci et al. 2021; Iwasawa et al. 2011); and the Spitzer mid-infrared spectra indicate no high-ionization lines from a buried AGN (Inami et al. 2010).
Baan & Klöckner (2006) have classified this source as a starburst galaxy, based on the radio brightness temperature () from VLA observations, the radio spectral index, and the ratio of FIR and radio flux. Since the high-resolution radio structure and are extremely significant ways to distinguish AGN from SB galaxies (Condon et al. 1991), we have investigated the 33 GHz (Ka-band) VLA-A observation of this source (project 14A-471, see Table 1) and model-fitted the visibility data. Assuming the flux density of the fitted component can also be obtained at 1.4 GHz with the same component size, the estimated temperature of the radio continuum emission is 1.21 K. The estimated upper limit from the peak flux densities of VLBA images (as shown in Fig. A.16) is about K. Thereby, the detected radio continuum emission from comp D of IIZw 096 shows to be within the range - K, which is also consistent with the starburst origin radio emission of other OHM galaxies reported in the literature (e.g., IRAS 12032+1707, IRAS 02524+2046 in Parra et al. 2005; Peng et al. 2020).
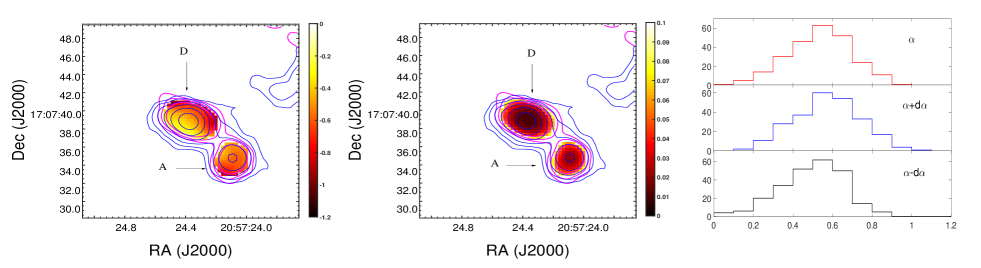
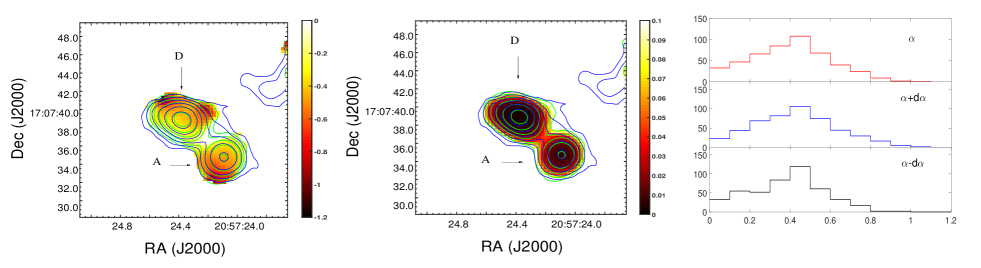
Clemens et al. (2008) have shown that very few LIRGs/ULIRGs have a straight power-law slope, where the overall radio SED begins to flatten at higher frequencies as the contribution of thermal emission increases. We have fitted the multi-band radio continuum of the comp D and A as presented in Section 3.4. The radio SED of A can be well-fitted with the power-law equation, while comp D might contain contributions from the free-free emission, which might indicate the existence of H II regions related to the massive stars (Linden et al. 2019). Vardoulaki et al. (2015) have shown that if the starburst is situated in an HII region, the value of is hardly steeper than 1.1 from the -map when adopting a 2 uncertainty, which is an effective way to classify the LIRGs as radio-AGN, radio-SB, and AGN/SB (a mixture).
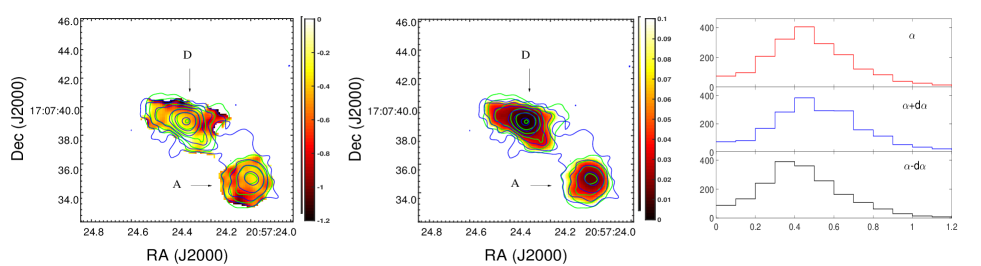
Following the methods as descripted in Vardoulaki et al. (2015), we have constructed the -maps (see Fig. 10). First, we restored the images (at 1.4 GHz, 3 GHz, and 9 GHz) to a beam size of 2” (comparable to the default beam of VLA-A observations at the L band) and constructed the -maps. We found no regions with a steep spectral index higher than 1.1. Second, we restored the images at 3 and 9 GHz to a beam size of 1” (comparable to the default beam of VLA-B observations at 9 GHz, see Fig. 3) and re-constructed the -maps, whereby we found that there are some pixels with steeper than 1.1. Although this might be a sign of the possible existence of radio AGN in the central region, the number of pixels with ¿1.1 is scarce based on the histograms as shown in Fig. 3. By combining properties of the radio continuum emission from brightness temperature and multi-band fitting, along with the properties of X-ray and infrared emission (Ricci et al. 2021; Iwasawa et al. 2011; Inami et al. 2010), we conclude that the dominated radio continuum emission from D1 might be of starburst origin, contributing to both synchrotron and free-free emission.
5 Summary
IIZw 096 is likely to be a rare nearby example, potentially for the study of merging environments and OH megamaser emissions. We have analyzed two-epoch EVN archival data of the OH 1667 MHz line emission of IIZw 096 and confirmed that this source’s OH 1667 MHz line emission is mainly from two regions. We found no significant variations of the OH 1667 MHz line emission from the two areas, including the integrated flux densities and peak positions. The OH 1665 MHz line emission is detected at the 6 level, with a peak of about 0.42 mJy/beam from the OH1 region. The OH emission regions reside in comp D1, which shows the brightest CO and HCO+ emission. The molecular mass in the central part ( 130 pc) is about 2.5 , which is consistent with the view that there is a high mass concentrated in the central region (Migenes et al. 2011; Inami et al. 2010).
The H I emission from the VLA data shows that the H I gas at large scales may be distributed in a common face-on envelope, which is consistent with a stage of intermediate merger. The CO velocity structures show three-velocity structures around D1: 1) a broad line profile region , which is the central region around D1 where CO emission shows broad line profiles; 2) a double peak region, which has several small areas surrounding the central region where the CO line profile showed double peaks; 3) a high-velocity clouds region, further out of the double-peak regions, where the CO spectrum reveals high velocities around 11000 km s-1. One possible explanation is that this source is in a stage of ongoing merging of two or more systems. The velocity structure around D1 shows no evidence of circular motions, making it different from most other OHMs reported in the literature, which might be caused by an effect resulting from the merger stage. The CO, HCO+ line emission, and the K-band VLA-A continuum emission are roughly aligned with the brightest center; while the two OH emission regions show an offset of about 50-75 mas to the central region and tend to the direction of double peak region. Thereby, the two OH emission regions might also be related to the merging process and may originate from more than one system.
We found that there is no significant continuum emission from the VLBA archival data. The multi-band radio continuum emission shows that the radio SED of comp A can be well-fitted with the power-law equation, while comp D might contain contributions from the free-free emission. The -map shows regions steeper than 1.1, which might be a sign of the possible existence of radio AGN in the central part as reported by Vardoulaki et al. (2015). However, the pixels steeper than 1.1 are very rare; and it is likely that the dominated radio continuum emission has a starburst origin mixed with synchrotron and free-free emission.
Acknowledgements.
We thank the referee for the constructive comments and suggestions, which helped improve this paper. The study was funded by RFBR and NSFC, project number 21-52-53035 “The Radio Properties and Structure of OH Megamaser Galaxies”. This work is supported by the grants of NSFC (Grant No. 11763002, U1931203). The European VLBI Network is a joint facility of European, Chinese, and other radio astronomy institutes funded by their national research councils. The National Radio Astronomy Observatory is operated by Associated Universities, Inc., under cooperative agreement with the National Science Foundation. This paper makes use of the following ALMA data: ADS/JAO.ALMA#2012.1.01022.S. ALMA is a partnership of ESO (representing its member states), NSF (USA) and NINS (Japan), together with NRC (Canada), MOST and ASIAA (Taiwan), and KASI (Republic of Korea), in cooperation with the Republic of Chile. The Joint ALMA Observatory is operated by ESO, AUI/NRAO and NAOJ.References
- Baan (2009) Baan, W. A. 2009, in Astronomical Society of the Pacific Conference Series, Vol. 407, The Low-Frequency Radio Universe, ed. D. J. Saikia, D. A. Green, Y. Gupta, & T. Venturi, 73
- Baan et al. (1989) Baan, W. A., Haschick, A. D., & Henkel, C. 1989, ApJ, 346, 680
- Baan et al. (2008) Baan, W. A., Henkel, C., Loenen, A. F., Baudry, A., & Wiklind, T. 2008, A&A, 477, 747
- Baan & Klöckner (2006) Baan, W. A. & Klöckner, H. R. 2006, A&A, 449, 559
- Barcos-Muñoz et al. (2015) Barcos-Muñoz, L., Leroy, A. K., Evans, A. S., et al. 2015, ApJ, 799, 10
- Bottinelli et al. (1986) Bottinelli, L., Gouguenheim, L., Le Squeren, A. M., et al. 1986, IAU Circ., 4231, 2
- Bryant & Scoville (1999) Bryant, P. M. & Scoville, N. Z. 1999, AJ, 117, 2632
- Casoli et al. (1999) Casoli, F., Willaime, M. C., Viallefond, F., & Gerin, M. 1999, A&A, 346, 663
- Clemens et al. (2008) Clemens, M. S., Vega, O., Bressan, A., et al. 2008, A&A, 477, 95
- Condon et al. (1991) Condon, J. J., Huang, Z. P., Yin, Q. F., & Thuan, T. X. 1991, ApJ, 378, 65
- Cooprider (2010) Cooprider, K. M. 2010, PhD thesis, Brigham Young University
- Courtois & Tully (2015) Courtois, H. M. & Tully, R. B. 2015, MNRAS, 447, 1531
- Darling (2007) Darling, J. 2007, ApJ, 669, L9
- Di Matteo et al. (2005) Di Matteo, T., Springel, V., & Hernquist, L. 2005, Nature, 433, 604
- Downes & Solomon (1998) Downes, D. & Solomon, P. M. 1998, ApJ, 507, 615
- Dutta et al. (2019) Dutta, R., Srianand, R., & Gupta, N. 2019, MNRAS, 489, 1099
- Falstad et al. (2017) Falstad, N., González-Alfonso, E., Aalto, S., & Fischer, J. 2017, A&A, 597, A105
- Farhan et al. (2020) Farhan, A., Ercan, E. N., & Tombesi, F. 2020, MNRAS, 499, 1
- Goldader et al. (1997) Goldader, J. D., Goldader, D. L., Joseph, R. D., Doyon, R., & Sanders, D. B. 1997, AJ, 113, 1569
- Haan et al. (2011) Haan, S., Surace, J. A., Armus, L., et al. 2011, AJ, 141, 100
- Hekatelyne et al. (2018) Hekatelyne, C., Riffel, R. A., Sales, D., et al. 2018, MNRAS, 474, 5319
- Hekatelyne et al. (2020) Hekatelyne, C., Riffel, R. A., Storchi-Bergmann, T., et al. 2020, MNRAS, 498, 2632
- Hopkins et al. (2010) Hopkins, P. F., Murray, N., Quataert, E., & Thompson, T. A. 2010, MNRAS, 401, L19
- Huang et al. (2018) Huang, Y., Zhang, J., Liu, W., & Xu, J. 2018, Journal of Astrophysics and Astronomy, 39, 34
- Inami et al. (2010) Inami, H., Armus, L., Surace, J. A., et al. 2010, AJ, 140, 63
- Iwasawa et al. (2011) Iwasawa, K., Sanders, D. B., Teng, S. H., et al. 2011, A&A, 529, A106
- Kim et al. (1995) Kim, D. C., Sanders, D. B., Veilleux, S., Mazzarella, J. M., & Soifer, B. T. 1995, ApJS, 98, 129
- Klöckner & Baan (2002) Klöckner, H. R. & Baan, W. A. 2002, in Cosmic Masers: From Proto-Stars to Black Holes, ed. V. Migenes & M. J. Reid, Vol. 206, 430
- Lamperti et al. (2020) Lamperti, I., Saintonge, A., Koss, M., et al. 2020, ApJ, 889, 103
- Leech et al. (2010) Leech, J., Isaak, K. G., Papadopoulos, P. P., Gao, Y., & Davis, G. R. 2010, MNRAS, 406, 1364
- Linden et al. (2019) Linden, S. T., Song, Y., Evans, A. S., et al. 2019, ApJ, 881, 70
- Lo (2005) Lo, K. Y. 2005, ARA&A, 43, 625
- Lockett & Elitzur (2008) Lockett, P. & Elitzur, M. 2008, ApJ, 677, 985
- McMullin et al. (2007) McMullin, J. P., Waters, B., Schiebel, D., Young, W., & Golap, K. 2007, in Astronomical Society of the Pacific Conference Series, Vol. 376, Astronomical Data Analysis Software and Systems XVI, ed. R. A. Shaw, F. Hill, & D. J. Bell, 127
- Migenes et al. (2011) Migenes, V., Coziol, R., Cooprider, K., et al. 2011, MNRAS, 416, 1267
- Momjian et al. (2006) Momjian, E., Romney, J. D., Carilli, C. L., & Troland , T. H. 2006, ApJ, 653, 1172
- Neumayer et al. (2020) Neumayer, N., Seth, A., & Böker, T. 2020, A&A Rev., 28, 4
- Parra et al. (2005) Parra, R., Conway, J. E., Elitzur, M., & Pihlström, Y. M. 2005, A&A, 443, 383
- Peng et al. (2020) Peng, H., Wu, Z., Zhang, B., et al. 2020, A&A, 638, A78
- Pihlström (2007) Pihlström, Y. M. 2007, in Astrophysical Masers and their Environments, ed. J. M. Chapman & W. A. Baan, Vol. 242, 446–451
- Pihlström et al. (2005) Pihlström, Y. M., Baan, W. A., Darling, J., & Klöckner, H. R. 2005, ApJ, 618, 705
- Planesas et al. (1991) Planesas, P., Mirabel, I. F., & Sanders, D. B. 1991, ApJ, 370, 172
- Polatidis & Aalto (2000) Polatidis, A. G. & Aalto, S. 2000, in EVN Symposium 2000, Proceedings of the 5th european VLBI Network Symposium, ed. J. E. Conway, A. G. Polatidis, R. S. Booth, & Y. M. Pihlström, 127
- Polatidis & Aalto (2001) Polatidis, A. G. & Aalto, S. 2001, in Galaxies and their Constituents at the Highest Angular Resolutions, ed. R. T. Schilizzi, Vol. 205, 198
- Ricci et al. (2021) Ricci, C., Privon, G. C., Pfeifle, R. W., et al. 2021, MNRAS, 506, 5935
- Roberts et al. (2021) Roberts, H., Darling, J., & Baker, A. J. 2021, ApJ, 911, 38
- Russell et al. (2017) Russell, H. R., McDonald, M., McNamara, B. R., et al. 2017, ApJ, 836, 130
- Sargent & Scoville (1991) Sargent, A. & Scoville, N. 1991, ApJ, 366, L1
- Shepherd (1997) Shepherd, M. C. 1997, in Astronomical Society of the Pacific Conference Series, Vol. 125, Astronomical Data Analysis Software and Systems VI, ed. G. Hunt & H. Payne, 77
- Storchi-Bergmann & Schnorr-Müller (2019) Storchi-Bergmann, T. & Schnorr-Müller, A. 2019, Nature Astronomy, 3, 48
- Trotter et al. (1997) Trotter, A. S., Moran, J. M., Greenhill, L. J., Zheng, X.-W., & Gwinn, C. R. 1997, ApJ, 485, L79
- Ulvestad (2009) Ulvestad, J. S. 2009, AJ, 138, 1529
- Vardoulaki et al. (2015) Vardoulaki, E., Charmandaris, V., Murphy, E. J., et al. 2015, A&A, 574, A4
- Wagner (2013) Wagner, J. 2013, A&A, 560, A12
- Wiggins et al. (2016) Wiggins, B. K., Migenes, V., & Smidt, J. M. 2016, ApJ, 816, 55
Appendix A Online materials
| Observing Date | Frequencies | Array | Phase | Program | beam | PA | rms | Component | Integrated Flux | Map peak |
|---|---|---|---|---|---|---|---|---|---|---|
| (GHz) | Configuration | Calibrator | (”) (”) | () | (mJy/beam) | (mJy) | (mJy/beam) | |||
| 1992Dec14 | 1.4 | VLA-A | 2029+121 | AB0660 | 2.86 1.54 | 61 | 0.43 | D | 15 2 | 6.9 0.7 |
| A | 5.4 0.5 | 3.6 0.2 | ||||||||
| 2014Mar30 | 3.0 | EVLA-A | J2139+1423 | 14A-471 | 0.67 0.61 | 5 | 0.040 | D | 7.0 0.5 | 4.9 0.2 |
| A | 3.2 0.4 | 2.0 0.2 | ||||||||
| 2013Dec01 | 5.1 | EVLA-B | … | 13B-356 | 1.50 1.42 | -41 | 0.041 | D | 5.9 0.5 | 4.1 0.2 |
| A | 2.6 0.2 | 1.60 0.09 | ||||||||
| 2013Dec01 | 7.0 | EVLA-B | … | 13B-356 | 1.10 1.07 | 51 | 0.028 | D | 4.8 0.2 | 3.4 0.1 |
| A | 1.9 0.1 | 1.20 0.06 | ||||||||
| 2013Dec01 | 9.0 | EVLA-B | … | 13B-356 | 0.96 0.79 | -58 | 0.023 | D | 4.3 0.2 | 3.16 0.08 |
| A | 1.77 0.06 | 1.16 0.03 | ||||||||
| 2013Dec01 | 11.0 | EVLA-B | … | 13B-356 | 0.83 0.65 | -60 | 0.027 | D | 3.6 0.2 | 2.63 0.07 |
| A | 1.65 0.07 | 1.03 0.03 | ||||||||
| 2013Nov15 | 13.0 | EVLA-B | … | 13B-356 | 0.84 0.52 | -2 | 0.021 | D | 3.5 0.3 | 2.7 0.1 |
| A | 1.33 0.06 | 0.87 0.03 | ||||||||
| 2013Nov15 | 15.0 | EVLA-B | … | 13B-356 | 0.52 0.47 | 28 | 0.022 | D | 3.3 0.1 | 2.53 0.06 |
| A | 1.25 0.08 | 0.84 0.03 | ||||||||
| 2013Nov15 | 17.0 | EVLA-B | … | 13B-356 | 0.46 0.42 | 36 | 0.026 | D | 3.3 0.1 | 2.53 0.06 |
| A | 1.02 0.03 | 0.72 0.02 | ||||||||
| 2013Nov15 | 21.9 | EVLA-B | … | 13B-356 | 0.39 0.33 | 54 | 0.015 | D | 2.94 0.08 | 2.34 0.04 |
| A | 0.91 0.04 | 0.66 0.02 | ||||||||
| 2014Nov06 | 33.0 | EVLA-C | … | 14A-471 | 0.96 0.72 | 56 | 0.025 | D | 2.9 0.1 | 2.16 0.06 |
| A | 0.80 0.11 | 0.63 0.06 | ||||||||
| 2014Apr18 | 33.0 | EVLA-A | … | 14A-741 | 0.082 0.060 | 69 | 0.015 | - | - | - |
| 2014May18/19 | 1.5 | VLBA | J2052+1619pr | BS0233 | 0.005 0.011 | 2 | 0.015 | - | - | - |
Column (4): The phase-reference calibrator for VLBA project and phase calibrator for VLA projects. The index ’pr’ means the project is in phase-reference mode. Column (5): The program name. Column (6) and (7): The beam FWHM and position angle. Column (8): The 1 noise level for the radio continuum image as present in Fig. A.11. Column (9): The component name. Column (10)-(11): The integrated and peak flux densities measured from restored images with a beam size of 2” 2”, respectively.
| Components(CO) | Opt. Coords (J2000) | Gauss amplitude | Gauss center | Gauss FWHM | Gaussian area |
| (hh mm ss,+dd mm ss) | mJy/beam | km s-1 | km s-1 | mJy/beam*km s-1 | |
| D0: | 20 57 24.340, 17 07 39.084 | 14 1 | 10898 1 | 53 3 | 795 46 |
| D1: | 20 57 24.372, 17 07 39.221 | 153 1 | 10888 1 | 179 1 | 29176 155 |
| D2: | 20 57 24.389, 17 07 40.030 | -2.1 0.6 | 10965 10 | 72 22 | -162 47 |
| C0: | 20 57 24.473, 17 07 39.826 | – | – | – | – |
| C1: | 20 57 24.519, 17 07 40.595 | – | – | – | – |
| C2: | 20 57 24.536, 17 07 40.840 | 0.9 0.5 | 11291 38 | 138 90 | 129 79 |
| C3: | 20 57 24.481, 17 07 40.881 | – | – | – | – |
| B0: | 20 57 23.604, 17 07 44.387 | 14 2 | 10880 8 | 124 19 | 1821 257 |
| B1: | 20 57 23.964, 17 07 41.631 | 2.4 1.0 | 10929 12 | 59 28 | 147 67 |
| B2: | 20 57 23.901, 17 07 42.001 | – | – | – | |
| B3: | 20 57 24.070, 17 07 40.494 | -2.3 0.9 | 10631 8 | 41 20 | -99 44 |
| B4: | 20 57 23.824, 17 07 42.411 | – | – | – | – |
| B5: | 20 57 23.757, 17 07 42.141 | -2.6 1.3 | 11385 20 | 80 47 | -218 119 |
| B6: | 20 57 23.796, 17 07 41.250 | 2.5 0.9 | 10901 25 | 149 60 | 399 105 |
| A0: | 20 57 24.069, 17 07 34.921 | 6.4 1.2 | 10768 3 | 34 7 | 232 46 |
| A1: | 20 57 24.167, 17 07 36.440 | – | – | – | – |
| A2: | 20 57 24.217, 17 07 36.654 | -0.8 0.7 | 10929 33 | 74 76 | -60 57 |
| A3: | 20 57 24.274, 17 07 38.119 | 8.6 1.0 | 10904 1 | 26 3 | 236 28 |
| DP 2 | 11 2 | 10916 5 | 66 11 | 779 175 | |
| 3.7 1.1 | 11018 18 | 82 35 | 342 161 | ||
| DP 3 | 10 2 | 10920 8 | 665 16 | 687 202 | |
| 4.1 1.5 | 11016 21 | 81 43 | 369 215 | ||
| DP 4 | 9.5 2.0 | 10978 7 | 50 15 | 509 173 | |
| 4.9 1.6 | 11064 11 | 2721 | 142 112 | ||
| DP 5 | 6.8 1.7 | 10931 8 | 32 17 | 231 126 | |
| 3.6 1.5 | 10977 28 | 99 56 | 376 275 | ||
| DP 6 | 4.0 1.2 | 10894 17 | 77 33 | 329 164 | |
| 3.0 1.2 | 10984 18 | 50 36 | 161 124 | ||
| (hh mm ss,+dd mm ss) | mJy | km s-1 | km s-1 | mJy*km s-1 | |
| Reg. 1 | 20 57 24.386, 17 07 38.574 | 8.1 0.4 | 11014 2 | 93 5 | 807 42 |
| Reg. 2 | 20 57 24.411, 17 07 38.734 | 10.8 0.4 | 11024 2 | 77 4 | 881 38 |
| Reg. 3 | 20 57 24.423, 17 07 39.283 | 12.5 0.4 | 10962 1 | 55 2 | 734 28 |
| Reg. 4 | 20 57 24.306, 17 07 39.747 | 3.4 0.5 | 10910 3 | 41 7 | 150 24 |
| Reg. 5 | 20 57 24.319, 17 07 40.093 | -1.7 0.2 | 10936 13 | 178 30 | -312 50 |
| Reg.6 | 20 57 24.360, 17 07 39.232 | -1.5 0.4 | 10942 9 | 69 22 | -106 31 |
Columns (1): the emission components; (2): RA and Dec of the components or spots; Columns (3)-(6) The Gaussian-fitted model parameters.
| Regions(HI) | RA(J2000) Dec(J2000) | Gauss amplitude | Gauss center | Gauss FWHM | Gaussian area |
|---|---|---|---|---|---|
| mJy/beam | km s-1 | km s-1 | mJy/beam*km s-1 | ||
| HI1 | 20 57 25.251, 17 07 27.405 | 1.4 0.5 | 10765 26 | 109 52 | 160 91 |
| – | 1.3 0.5 | 10840 23 | 79 47 | 109 73 | |
| HI2 | 20 57 24.589, 17 07 15.846 | 0.9 0.4 | 10760 27 | 96 54 | 93 61 |
| – | 1.0 0.4 | 10846 25 | 95 51 | 97 60 | |
| HI3 | 20 57 23.779, 17 07 31.670 | 0.7 0.4 | 10769 40 | 95 79 | 7168 |
| – | 1.5 0.5 | 10856 25 | 157 50 | 243 101 | |
| HI4 | 20 57 22.602, 17 07 53.824 | 1.6 0.4 | 10759 14 | 80 27 | 137 54 |
| – | 1.3 0.5 | 10839 17 | 87 34 | 123 56 | |
| HI5 | 20 57 24.110, 17 08 02.264 | 1.2 0.4 | 10736 22 | 103 45 | 126 65 |
| – | 1.0 0.4 | 10834 27 | 101 54 | 103 64 | |
| HI6 | 20 57 24.129, 17 07 45.385 | 2.1 0.9 | 10778 38 | 161 76 | 357 217 |
| – | 1.2 0.9 | 10873 41 | 66 82 | 87 117 | |
| HI7 | 20 57 25.601, 17 07 46.703 | 0.8 0.4 | 10743 41 | 124 83 | 105 85 |
| – | 1.4 0.5 | 10831 16 | 55 32 | 81 51 | |
| +B0 | 20 57 23.604, 17 07 44.387 | 1.9 0.3 | 10787 8 | 229 17 | 466 80 |
| – | 1.1 0.2 | 10883 8 | 69 16 | 80 23 | |
| +A0 | 20 57 24.069, 17 07 34.921 | 1.7 0.5 | 10769 13 | 54 25 | 96 49 |
| – | 1.7 0.5 | 10847 18 | 106 35 | 187 76 |
Columns (1): the emission components; (2): RA and Dec of the components or spots; Columns (3)-(6) The Gaussian-fitted model parameters.