Magnetic Interactions of the Centrosymmetric Skyrmion Material Gd2PdSi3
Abstract
The experimental realization of magnetic skyrmions in centrosymmetric materials has been driven by theoretical understanding of how a delicate balance of anisotropy and frustration can stabilize topological spin structures in applied magnetic fields. Recently, the centrosymmetric material Gd2PdSi3 was shown to host a field-induced skyrmion phase, but the skyrmion stabilization mechanism remains unclear. Here, we employ neutron-scattering measurements on an isotopically-enriched polycrystalline Gd2PdSi3 sample to quantify the interactions that drive skyrmion formation. Our analysis reveals spatially-extended interactions in triangular planes that are consistent with an RKKY mechanism, and large ferromagnetic inter-planar magnetic interactions that are modulated by the Pd/Si superstructure. The skyrmion phase emerges from a zero-field helical magnetic order with magnetic moments perpendicular to the magnetic propagation vector, indicating that the magnetic dipolar interaction plays a significant role. Our experimental results establish an interaction space that can promote skyrmion formation, facilitating identification and design of centrosymmetric skyrmion materials.
Magnetic skyrmions are topologically-nontrivial spin textures with potentially transformative applications in quantum computing and information storage (Tokura_2021, ; Fert_2017, ; Bogdanov_2020, ). Skyrmions usually occur in noncentrosymmetric magnets, in which they can be stabilized by antisymmetric exchange interactions (Muhlbauer_2009, ; Yu_2010, ). However, it was recently shown that skyrmions can be stabilized in centrosymmetric systems by frustrated (competing) interactions (Okubo_2012, ; Leonov_2015, ), presenting the exciting prospects of higher skyrmion densities and manipulation of chiral degrees of freedom by external fields (Yu_2012, ; Yao_2020, ). While a small number of candidate centrosymmetric skyrmion materials have been identified (Kurumaji_2019, ; Hirschberger_2019, ; Gao_2020, ; Khanh_2020, ), experimentally determining the magnetic interactions in such materials remains a key challenge. Addressing this challenge is a prerequisite for designing and manipulating skyrmion-based devices.
The hexagonal material Gd2PdSi3 provides a rare example of a skyrmion phase in a centrosymmetric system (Kurumaji_2019, ). In Gd2PdSi3, triangular layers of magnetic Gd3+ ions are separated by honeycomb PdSi3 layers [Fig. 1(a)] (Tang_2011, ). A transition from the paramagnetic state occurs at K to an incommensurate magnetic order with propagation vector with (Kurumaji_2019, ). The observed may be stabilized by competition between ferromagnetic nearest-neighbor interactions and antiferromagnetic further-neighbor interactions [Fig. 1(a,b)] (Okubo_2012, ; Leonov_2015, ). Application of a magnetic field below yields a giant topological Hall effect, signifying a transition to a topologically-nontrivial skyrmion phase, which is a triple- structure formed by superposing magnetic helices with , , and (Kurumaji_2019, ). The bulk magnetic susceptibility follows a Curie-Weiss law with spin , , and a ferromagnetic Weiss temperature K, indicating that Gd3+ ions possess spin-only local moments (Kotsanidis_1990, ; Saha_1999, ; Zhang_2020, ). However, coupled electronic and spin correlations develop well above , as indicated by a minimum in the resistivity at and a large negative magnetoresistance that persists up to (Mallik_1998, ; Saha_1999, ; Zhang_2020, ).
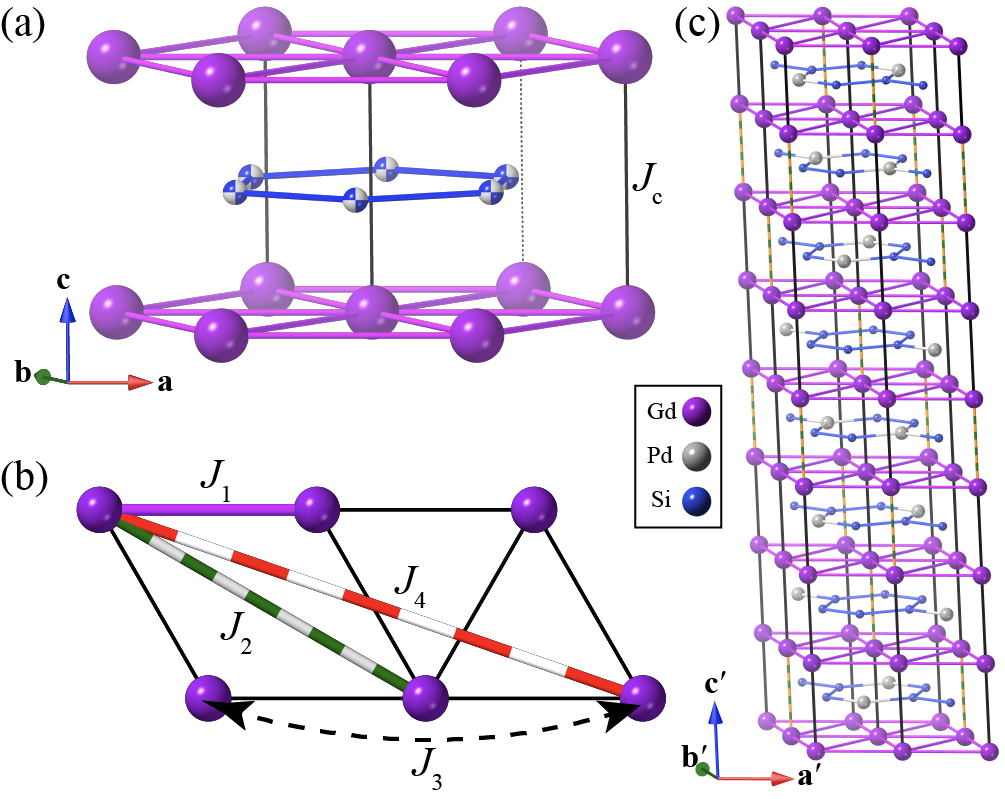
To explain spin textures in centrosymmetric systems such as Gd2PdSi3, it is crucial to understand the system’s underlying magnetic interactions. The experimental observation of Fermi surface nesting with a wavevector similar to suggests the relevance of long-ranged RKKY interactions (Inosov_2009, ), while a theoretical study indicates that local exchange processes are also important (Nomoto_2020, ). However, quantifying the interactions experimentally is a complex problem, for three main reasons. First, the ordered magnetic structure in zero applied field is not conclusively solved (Kurumaji_2019, ; Zhang_2020, ; Moody_2021, ). Second, although the crystal structure may be approximately described with a statistical distribution of Pd and Si, these atoms actually form a superlattice that may affect exchange processes [Fig. 1(c)] (Tang_2011, ). Third, the large neutron absorption cross-section of isotopically-natural Gd makes neutron-scattering experiments on large single crystals challenging. So far, this has prevented the use of single-crystal neutron-scattering experiments to understand the magnetic interactions of Gd2PdSi3.
Here, we employ comprehensive neutron-scattering experiments on 160Gd2PdSi3 to obtain a model of its zero-field magnetic structure and interactions that explains multiple experimental observations. We obtain the following key results. First, magnetic interactions within triangular layers are spatially extended and of competing sign, consistent with an RKKY mechanism (Wang_2020, ; Wang_2021, ) that is supported by a comparison of our neutron-scattering results with published resistivity data (Saha_1999, ). Second, ferromagnetic interactions between layers are dominant, and strongly modulated by the Pd/Si superlattice. Third, below , a helix with the spin plane perpendicular to is the only structure consistent with our neutron data and physical constraints, suggesting the magnetic dipolar interaction plays a significant role below (Utesov_2021, ). Finally, we confirm that our interaction model explains the skyrmion phase at small applied magnetic fields below (Kurumaji_2019, ; Hirschberger_2020a, ). Our results provide a foundation for theoretical modeling and experimental manipulation of spin textures in Gd2PdSi3.
We prepared a polycrystalline sample of 160Gd2PdSi3 suitable for neutron measurements (mass g) by arc melting. Arc-melted samples were wrapped in Ta foil, sealed in a quartz tube under a vacuum, and annealed at C for one week. The sample quality was confirmed by bulk magnetometry, which agrees with published results, and by powder X-ray diffraction, which reveals broad superlattice peaks consistent with Å domains of the superstructure shown in Fig. 1(c) (see SI). To minimize neutron absorption, the sample was 98.1% enriched with 160Gd, and an annular sample geometry was used for neutron diffraction and spectroscopy experiments, which were performed using the HB-2A and SEQUOIA instruments at ORNL, respectively.
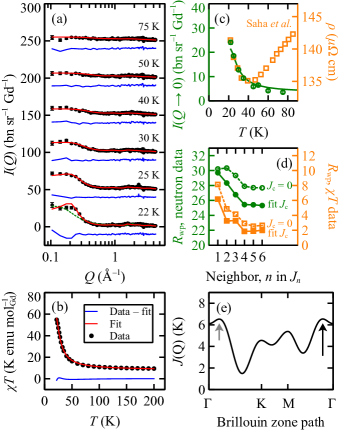
Figure 2(a) shows magnetic diffuse-scattering data collected above using HB-2A ( Å). The data are background-subtracted and placed in absolute intensity units by normalization to the nuclear Bragg scattering. As the sample is cooled below 40 K, increases at small wavevectors, Å-1, indicating the development of predominantly ferromagnetic short-range correlations. Figure 2(b) shows that the bulk magnetic susceptibility exhibits a large upturn over the same temperature range, as expected because at high temperature (Lovesey_1987, ). For RKKY interactions with Fermi wave-vector , theory predicts an increase in as is approached from above, while a simultaneous enhancement of electron scattering generates an upturn in the resistivity (Wang_2016, ). To test this prediction, Fig. 2(c) compares the value of —obtained from and by averaging over Å-1—with published resistivity measurements (Saha_1999, ). Both and the resistivity shown an upturn at the same temperature ( K), in qualitative agreement with the RKKY prediction (Wang_2016, ). This result suggests that RKKY interactions likely play a significant role in Gd2PdSi3.
We quantify the magnetic interactions by analyzing and data measured at within a Heisenberg model,
where denotes a classical spin vector with position and length , and the interaction parameters are shown in Fig. 1(a,b). We make two simplifying assumptions in this high-temperature analysis. First, we neglect non-Heisenberg terms such as the magnetic dipolar interaction and single-ion anisotropy, which have negligible effect above because of their small energy scales (see SI). Second, we assume the high-symmetry hexagonal structure, neglecting a possible variation in due to the Pd/Si superstructure. Within reaction-field theory, the wavevector-dependent susceptibility is then given by (Logan_1995, )
where , , is obtained self-consistently by enforcing that (Logan_1995, ), and is calculated by spherically averaging , where bn (Lovesey_1987, ) and is the Gd3+ magnetic form factor (Brown_2004, ).
| (K) | (K) | (K) | (K) | (K) |
|---|---|---|---|---|
To identify the effective dimensionality of the interactions, we first tested a two-dimensional model by setting and refining the intra-layer couplings to our and data shown in Fig. 2(a) and (b). This model does not represent the data well, even when up to are included [green line in Fig. 2(a) for K]. By contrast, also refining the inter-layer coupling substantially improves the refinement quality metric [Fig. 2(d)], demonstrating that the interactions are three-dimensional. To estimate the spatial extent of the interactions, Fig. 2(d) shows the dependence of on the number of fitted in addition to . No significant improvement is obtained for ; hence, our minimal model contains . The optimal parameter values from a global fit to and data are given in Table 1. Ferromagnetic is dominant, while intra-layer interactions compete between antiferromagnetic and shorter-range ferromagnetic couplings, reminiscent of the RKKY interaction. Figure 2(e) shows the corresponding , which is maximal at the propagation vector of the model, . While is smaller than the measured low-temperature , the difference is plausible because decreases with increasing temperature below (Kurumaji_2019, ). Interestingly, a local maximum occurs along the direction with % energy difference from . Fermi-surface measurements of Gd2PdSi3 show a nesting wavevector (Inosov_2009, ), while Tb2PdSi3 exhibits short-range magnetic ordering with this periodicity (Frontzek_2007, ), suggesting the quasi-degeneracy of our model may be a generic feature of these materials. Finally, we considered an alternative five-parameter model containing two inter-layer and three intra-layer couplings. While this model yields a comparable refinement of and measurements, it does not agree well with inelastic neutron-scattering data (see SI).

We now investigate the zero-field magnetic structure for . Taking the hexagonal structure as the parent phase, there are three magnetic irreducible representations (irreps) that correspond, respectively, to sinusoidal modulations of the ordered magnetic moment along the orthogonal directions , , and [Fig. 3(a)] (Wills_2001, ). Alternatively, combining pairs of irreps yields helices with in the , , or plane, as illustrated in Fig. 3(b). Both helical and sinusoidal models have been proposed for the zero-field structure of Gd2PdSi3 (Moody_2021, ; Nomoto_2020, ). In addition, a triple- meron-antimeron structure was proposed in Ref. Kurumaji_2019, . In Fig. 3(c), we compare the Rietveld refinement for each model with the measured magnetic diffraction pattern, obtained as the difference between the 1.5 K and 25 K data. For each model, Fig. 3(e) shows , and Fig. 3(f) shows the refined maximum value of . The -sine model (i), with spins , would give zero intensity for the strong magnetic peak, and so is immediately ruled out. Of the remaining models, -sine (ii), -helix (vi), and -ellipse (vii) structures yield similarly high-quality refinements. The meron-antimeron structure has an identical diffraction pattern to its single- analog, the -helix, and is not shown separately. The refined value of is a key discriminating factor, as any physical model must satisfy the constraint that ( for Gd3+). This constraint rules out the -sine model [Fig. 3(f)]. It also disfavors the meron-antimeron structure, for which , where is the refined ordered moment of the -helix. Thus, the key result of our Rietveld analysis is that the only models yielding good fits and reasonable values are “proper screw” helices with , models (vi) and (vii). The best refinement is for an elliptical helix with , and fixed to its maximum value of . Notably, the ordered moment is not fully polarized as at K. Magnetic peaks are also selectively broadened compared to nuclear peaks [Fig. 3(d)]. Refinement of a quadratic-in- size-broadening term yields magnetic domain dimensions of Å in the -plane vs. Å along , which may be a consequence of disordered stacking of PdSi3 layers.
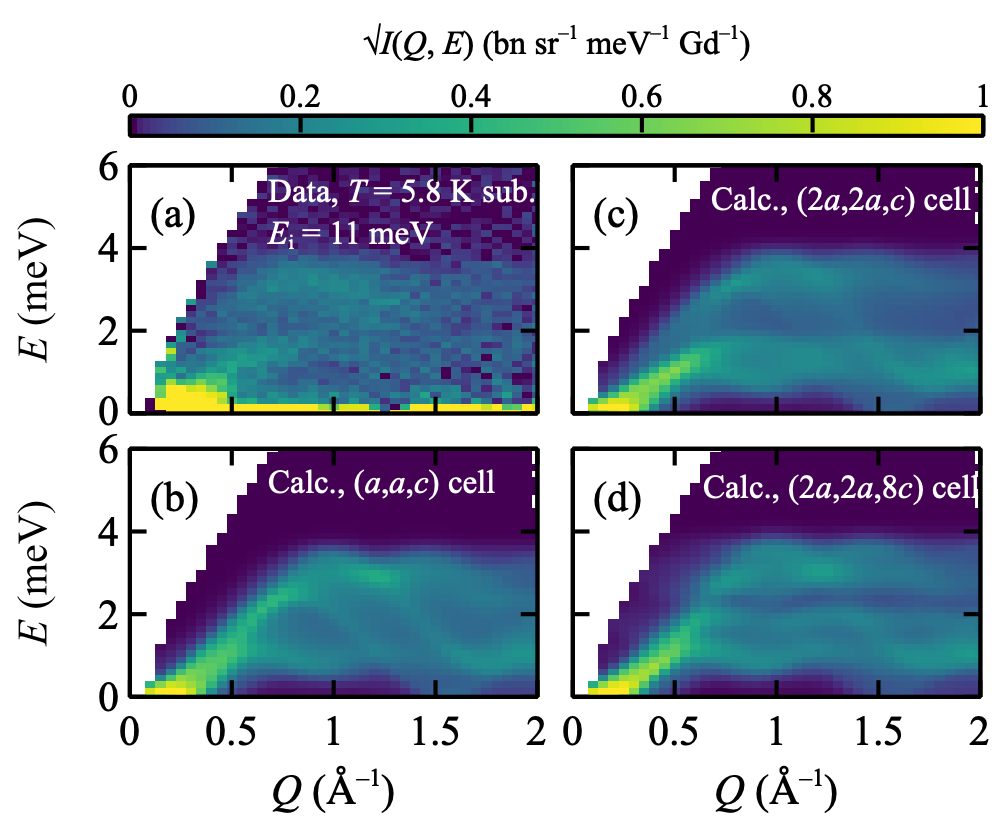
The magnetic excitation spectrum at provides an exquisitely sensitive test of our model. Our inelastic neutron-scattering data ( meV) show spin-wave excitations at K, superimposed on a diffuse magnetic background that likely occurs because . In Fig. 4(a), we show , which isolates the spin-wave contribution. Our data show an overall bandwidth of approximately meV. For meV, the spectrum has a broad energy dependence with intensity minima for meV and meV. Figure 4(b) shows the calculated spectrum for the interaction parameters given in Table 1 and a single- helical ground state, calculated within linear spin-wave theory using the SpinW program (Toth_2015, ). This model reproduces the overall bandwidth, but fails to explain the intensity minimum for meV. Attempts to refine to the inelastic data also failed to reproduce this feature. To explain our data, it was necessary to consider the effect of the Pd/Si superstructure on . All proposed models of the Pd/Si superstructure involve doubling the unit cell along and , such that 75% of bonds (notated ) have four Si and two Pd neighbors, while the remaining bonds (notated ) have six Si neighbors [Fig. 1(c)]. We assume the superstructure splits by an amount , such that and , and neglect any splitting of the weaker interactions. For the superstructure shown in Fig. 1(c), the stacking of bonds is …ABCDBADC… (Tang_2011, ), whereas the superstructure considered in Ref. Nomoto_2020, has …AAA… stacking. Taking with the superstructure reproduces the intensity minimum for meV and yields good overall agreement with our inelastic neutron-scattering data [Fig. 4(c)], without degrading the agreement with data above (see SI). Taking with the superstructure also generates intensity minima, but yields worse agreement with our data [Fig. 4(d)]. Our results show that the Pd/Si superstructure strongly enhances for bonds with Pd neighbors.
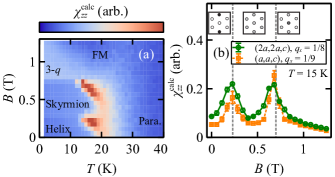
We use extensive Monte Carlo simulations to calculate the phase diagram of our model as a function of temperature and applied magnetic field . The spin Hamiltonian is given by
where, to stabilize helical ordering with , we include the magnetic dipolar interaction that has magnitude K at the nearest-neighbor distance (Utesov_2021, ; Utesov_2021a, ). To minimize finite-size effects, we constrain the interactions to stabilize , with commensurate or . The calculated magnetic susceptibility is shown in Fig. 5(a), and reveals both similarities and differences with experiment (Spachmann_2021, ; Hirschberger_2020a, ). In agreement with experiment, we find K, and below , a transition from a helical to a skyrmion phase at T. At larger , a further transition occurs to a topologically-trivial triple-q phase previously identified using mean-field theory (Utesov_2021, ). The single- vs. triple- nature of each phase is revealed by its calculated magnetic diffraction pattern [insets in Fig. 5(b)]. The behavior is not qualitatively affected by the splitting of , or by the precise value of [Fig. 5(b)]. While our model shows good agreement with experiment at small applied fields, it does not explain the large increase in saturation field on cooling the sample ( T at K (Hirschberger_2020a, )) or the presence of magnetic transitions for T (Spachmann_2021, ). These differences motivate further theoretical work to understand the role of non-Heisenberg interactions.
Our neutron-scattering results provide an experimental understanding of the magnetic interactions in Gd2PdSi3 and clarify its zero-field magnetic structure. Our identification of the hierarchy of energy scales will facilitate the development of experiments to manipulate spin textures in Gd2PdSi3. Notably, our interaction model explains key aspects of the experimental behavior without invoking biquadratic or multi-spin interactions (Hayami_2021b, ). However, the spin dynamics can only be understood by accounting for the Pd/Si superstructure, suggesting it is important to include this in models. We anticipate that this model of the skyrmion stabilization mechanism in Gd2PdSi3 will facilitate design and identification of new centrosymmetric skyrmion hosts, including in materials where large single-crystal samples are unavailable or unsuitable for neutron-scattering measurements.
Acknowledgements.
We are grateful to Cristian Batista, Matthew Cliffe, Randy Fishman, Shang Gao, and Stephen Nagler for valuable discussions. This work was supported by the U.S. Department of Energy, Office of Science, Basic Energy Sciences, Materials Sciences and Engineering Division. This research used resources at the High Flux Isotope Reactor and Spallation Neutron Source, DOE Office of Science User Facilities operated by the Oak Ridge National Laboratory.References
- (1) Y. Tokura, N. Kanazawa, Chem. Rev. 121, 2857 (2021).
- (2) A. Fert, N. Reyren, V. Cros, Nat. Rev. Mater. 2, 17031 (2017).
- (3) A. N. Bogdanov, C. Panagopoulos, Nat. Rev. Phys. 2, 492 (2020).
- (4) S. Mühlbauer, et al., Science 323, 915 (2009).
- (5) X. Z. Yu, et al., Nature 465, 901 (2010).
- (6) T. Okubo, S. Chung, H. Kawamura, Phys. Rev. Lett. 108, 017206 (2012).
- (7) A. O. Leonov, M. Mostovoy, Nat. Commun. 6, 8275 (2015).
- (8) X. Yu, et al., Proc. Nat. Acad. Sci. 109, 8856 (2012).
- (9) X. Yao, J. Chen, S. Dong, New J. Phys. 22, 083032 (2020).
- (10) T. Kurumaji, et al., Science 365, 914 (2019).
- (11) M. Hirschberger, et al., Nat. Commun. 10, 5831 (2019).
- (12) S. Gao, et al., Nature 586, 37 (2020).
- (13) N. D. Khanh, et al., Nat. Nanotechnol. 15, 444 (2020).
- (14) F. Tang, et al., Phys. Rev. B 84, 104105 (2011).
- (15) P. Kotsanidis, J. Yakinthos, E. Gamari-Seale, J. Magn. Magn. Mater. 87, 199 (1990).
- (16) S. R. Saha, et al., Phys. Rev. B 60, 12162 (1999).
- (17) H. Zhang, et al., New J. Phys. 22, 083056 (2020).
- (18) R. Mallik, E. V. Sampathkumaran, M. Strecker, G. Wortmann, Europhys. Lett. (EPL) 41, 315 (1998).
- (19) D. S. Inosov, et al., Phys. Rev. Lett. 102, 046401 (2009).
- (20) T. Nomoto, T. Koretsune, R. Arita, Phys. Rev. Lett. 125, 117204 (2020).
- (21) S. H. Moody, et al., arXiv p. 2010.14326 (2021).
- (22) Z. Wang, Y. Su, S.-Z. Lin, C. D. Batista, Phys. Rev. Lett. 124, 207201 (2020).
- (23) Z. Wang, C. D. Batista, arXiv p. 2111.13976 (2021).
- (24) O. I. Utesov, arXiv p. 2109.13682 (2021).
- (25) M. Hirschberger, et al., Phys. Rev. B 101, 220401 (2020).
- (26) S. W. Lovesey, Theory of Neutron Scattering from Condensed Matter: Polarization Effects and Magnetic Scattering, vol. 2 (Oxford University Press, Oxford, 1987).
- (27) Z. Wang, K. Barros, G.-W. Chern, D. L. Maslov, C. D. Batista, Phys. Rev. Lett. 117, 206601 (2016).
- (28) D. E. Logan, Y. H. Szczech, M. A. Tusch, Europhys. Lett. (EPL) 30, 307 (1995).
- (29) P. J. Brown, International Tables for Crystallography (Kluwer Academic Publishers, Dordrecht, 2004), vol. C, chap. Magnetic Form Factors, pp. 454–460.
- (30) M. Frontzek, et al., J. Phys.: Condens. Matter 19, 145276 (2007).
- (31) A. Wills, J. Phys. IV France 11, 133 (2001).
- (32) S. Toth, B. Lake, J. Phys.: Condens. Matter 27, 166002 (2015).
- (33) O. I. Utesov, Phys. Rev. B 103, 064414 (2021).
- (34) S. Spachmann, A. Elghandour, M. Frontzek, W. Löser, R. Klingeler, Phys. Rev. B 103, 184424 (2021).
- (35) S. Hayami, Y. Motome, Phys. Rev. B 103, 024439 (2021).