Distances of Galactic Radio Pulsars; First Quadrant: -2 90 and -2 2
Abstract
Distance versus dispersion measure relations are constructed for Galactic radio pulsars in small solid angle intervals. The calculations are based on some basic criteria as well as using the independent distance measurements of well examined pulsars for the first Galactic quadrant including Galactic central directions. Values of average free electron density for these regions are derived from the fits to distance versus dispersion measure relations and checked for consistency and smoothness. The effects of plasma in the Galactic arms and within the central parts of the Galactic bulge region are also compared and discussed. Our adopted distances for the radio pulsars are compared with the ones given in some other models. Some basic results on distributions of the radio pulsars and the plasma are presented.
keywords:
stars: neutron – ISM: structure – Galaxy: structure– stars: distances –HII regions– methods: statistical1 Introduction
Since the first observation of a pulsar (PSR) in 1967, more than 2800 pulsars were observed up to date according to the ATNFPC (Australia Telescope National Facility Pulsar Catalog) (Manchester et al., 2005). Most of these pulsars are observable at radio frequencies due to their synchrotron emission. It is essential to know the distances of pulsars from the Sun mainly in order to calculate their radiative power and to determine their positions and distributions in the Galaxy.
Most of the known pulsars are isolated objects and none of the directly observable intrinsic properties of pulsars allows for a distance determination of a pulsar unlike some other sources, e.g. cepheids. For a few of the pulsars that are close enough, the parallax method could be utilized. Because of the high speeds of neutron stars gained during asymmetric core-collapse supernova explosions and the short observable lifetimes (104-105 yr) of supernova remnants (SNRs) (Guseinov et al., 2007), only young neutron stars can reliably be associated to SNRs. As the number of Galactic SNRs including neutron stars, pulsar wind nebulae and/or bow shock structures is not more than half of the known SNRs (Green, 2019) and the fact that SNR distances are not small in most of the cases (Guseinov et al. 2007, and references therein, Ranasinghe & Leahy, 2018, Green 2019, and references therein, Lee et al. 2019), there are only a few neutron star – SNR pairs with reliable distances. The distances of pulsars located in globular clusters can be determined with a better precision, however the observed number of such pulsars is small.
In this work, we present an improved version of a basic and reliable method to determine distances of all radio pulsars with known dispersion measure (DM) values based on constructing distance – DM relations (Yazgan et al., 2007; Ankay et al., 2016). It is possible to derive average free electron densities in the line of sight (LOS) of the radio pulsars from these relations to constrain the distributions of the plasma as well as the radio pulsars in the Galaxy. Figures and tables for distance-DM relations in the solid angle interval 2 90; -2 2 are given in Appendix A.
Most of the pulsars listed in the ATNFPC have precise timing observations that allow distance determinations based on the 3D free electron distributions. Passing through the interstellar plasma, radio waves from pulsars get dispersed depending on the electron density along the line of sight and the frequency of the radio pulse (). Thanks to the pulsed emission, the difference in the arrival times between two frequencies, both much greater than the plasma frequency, is measurable. This delay can be written as (Lipunov, 1992)
| (1) |
The last term in equation (1) is defined as DM in pc/cm3:
| (2) |
Here is the speed of light in vacuum, is the mass of electron, is the electron charge, is the free electron density in the LOS in cm-3, and D is the distance of the radio pulsar from the Sun. Distance of the source can be found using this equation if the electron density in the LOS is known.
This method is practically applicable only in the case of pulsed low frequency emission making it the standard method applicable to all radio pulsars as a rule. The DM measurements have in general small inaccuracies and the variations in the DM values due to displacements of filaments in SNRs are rare and mostly insignificant (Petroff et al., 2013). The main and effectively the only difficulty in using this method is related to the mostly unknown distributions of the plasma regions (mainly SNRs and HII-regions) throughout the Galaxy and their densities. The first mathematical model on DM-based distance determination (Taylor & Cordes, 1993) used in ATNFPC led to overestimated and underestimated distance values especially in the Galactic center directions. An improved version of such a model was introduced by Cordes & Lazio (2002), yet this model also gives overestimated/underestimated pulsar distances. The plasma distribution in our galaxy, though it is relatively more uniform compared to the distributions of molecular clouds and HI clouds, can not be adequately described by simple mathematical models using general assumptions. However, the models are being improved, e.g. as introduced in Yao et al. (2017) (YMW17 model) which is the latest model used in ATNFPC as the default model. This model also includes systematic biases which are discussed below.
Alternatively, distance – DM relations can be constructed for small solid angles choosing narrow longitude and latitude intervals including pulsars with measured DM to fit and using the independently measured distance values of calibrator pulsars (e.g. Yazgan et al., 2007; Guseinov et al., 2002; Ankay et al., 2016). The average free electron number density values can be determined from these relations for a large number of solid angle intervals covering the whole galaxy. The criteria mainly introduced by Guseinov et al. (2002) and Yazgan et al. (2007) in adopting distances for some radio pulsars with measured DM values with some improvements will be presented below.
The rotation measure (RM) based on the Faraday rotation is also a precisely measured quantity similar to DM but for a smaller number of pulsars. RM depends on the average magnetic field of the interstellar medium in the LOS as well as the average free electron density. So the ratio RM/DM gives information on the average magnetic field of the interstellar medium which can in principle be used to check and compare the distance values of pulsars located in the same region (Manchester and Taylor (1977)). RM is defined through the following equations:
| (3) |
| (4) |
Here B is the magnetic field strength and is the angle between the line of sight and the magnetic field. The unit of B is G and the unit of RM is rad/m2.
Having a precise knowledge of the locations and the sizes of the Galactic arms is essential to determine both the Galactic plasma (in particular the free electron density) distribution and the locations of Galactic young pulsars. Giant molecular clouds, HII regions and masers are used as the basic sources and tracers in most of the Galactic arms structure models (e.g. Georgelin & Georgelin, 1976; Reardon et al., 2016a; Hou et al., 2009; Xu et al., 2013; Zhang et al., 2013; Choi et al., 2014; García et al., 2014; Hou & Han, 2014; Reid et al., 2014; Sato et al., 2014; Vallée, 2014a, b; Wu et al., 2014; Hachisuka et al., 2015; Vallée, 2015, and references therein).
Recent observations (Ponti et al., 2015; Schnitzeler et al., 2016), found that the plasma at the core of the Galactic bulge is very dense, probably denser than the plasma in the most dense parts of the Galactic arms, including some "holes" with low density. This is discussed below based on the observations of radio pulsars close to or in the direction of the Galactic center especially a magnetar which is probably connected to the dense plasma region Sgr A located at the center.
2 Basic Criteria in Adopting Distances of Radio Pulsars and Its Relation to the Galactic Plasma Distribution
We have constructed distance – DM relations for radio pulsars in the first quadrant of the Galaxy for b = 02 degrees including also the Galactic central directions in the intervals = b = 02 degrees. We have divided the pulsars into 20 groups, each group having 4 degrees by 4 degrees solid angle, up to = 78 degrees. The average free electron density for each group has been calculated and compared with each other for adjacent groups to check the smoothness and continuity of the plasma distribution. The number of radio pulsars in the longitude interval = 78-90 degrees with b = 02 degrees is only three, therefore, we have only checked the possible distances of these pulsars without making a fit.
Some basic criteria based on observational results are listed below to construct distance versus DM relations (Ankay et al., 2016). We assume that the main contribution to the measured DM values is mainly due to the plasma in the HII regions, SNRs and probably the Galactic central region. A low density plasma distribution between the Galactic arms and at high latitudes are also taken into consideration.
The first and the fourth quadrants of the Galaxy must include most of the radio pulsars, and in general most of the Galactic sources, as the volume of this region is significantly larger than the anti-center region. This is also the case for young pulsars as they are supposed to be located within or close to the star formation regions (SFRs) that form the Galactic arms. On the other hand, as the Galactic arm structure beyond the Galactic center is not well known in the first and the fourth quadrants, it is much more difficult to determine the locations of distant pulsars. Yet, some of the most luminous radio pulsars are definitely located in the interval -40<l<40. Based on the available observational data (ATNFPC), the number of such luminous pulsars in this interval is not as large as expected suggesting that a larger portion of the Galactic arms are outside of this longitude interval. The distribution of the space velocities of pulsars and the activity of the star formation regions producing core-collapse supernovae are considered to get a conclusive result.
In order to have an estimate on the radio pulsar luminosity, we take Crab pulsar as a reference to put an upper limit for each radio pulsar distance using the measured fluxes at 1400 MHz and 400 MHz. Crab pulsar is taken as a reference to put an upper limit because it is close by and young. Its well-known luminosity helps prevent large overestimation in adopting pulsar distances. About 96 of radio pulsars are less luminous than the Crab pulsar at 400 MHz and about 87 radio pulsars are less luminous than Crab pulsar at 1400 MHz (ATNFPC). For almost all of the radio pulsars, the 1400 MHz distance limit is much smaller than the one at 400 MHz. Therefore, the luminosity of the Crab pulsar can be used as a lower limit to prevent large over-estimations in adopting pulsar distances. Guseinov et al. (2003a) constructed luminosity functions for young radio pulsars (<107yr) at 400 MHz and 1400 MHz and showed that most of the PSRs have low luminosity values. For a detailed review on pulsar luminosities see Bagchi (2013).
In some Galactic longitude intervals, some parts of the arms are offset with respect to the Galactic plane. Some of these deviations are well known by observation, especially at smaller distances from the Sun, and are considered both for the free electron distribution in the Galaxy and when adopting radio pulsar distances.
The distances of pulsars from the Galactic plane are related to their ages. The spin-down age of a pulsar is given by
| (5) |
where n is the braking index, P is the period, P0 is the birth period and is the time derivative of the period of the pulsar. Assuming P0 P and n 1
| (6) |
The characteristic age is defined for n=3 (for magnetic dipole braking) as (Manchester & Taylor, 1977; Lyne & Graham-Smith, 2012)
| (7) |
Note that the characteristic age is not a measure of the true age (Jiang et al., 2013). For example, for the Crab pulsar =1256.8yr (ATNFPC) and the real age is equal to the age of SN 1054 which is 970 yr. Espinoza et al. (2011) give a list of young galactic pulsars with reliable measured braking indices in the range 2.14-2.91. So, the real age can be greater than up to a factor of 2 based on these measured values of breaking index. Such small differences in age values do not affect our analysis or change our results in this work. For the pulsar J1734-3333 Espinoza et al. (2011) measure a braking index value 0.9, mentioning a recent glitch would most likely disrupt the value. Lyne et al. (1996) give a braking index value 1.4 for the Vela pulsar (J0835-4510), where they mention a large uncertainty in the measurement caused by glitch together with the timing noise. For J1640-4631 (=3.35 yr (ATNFPC)), Archibald et al. (2016) measure a braking index value 3.15 and argue the reason of a high braking index value may occur because of an unseen glitch when the timing noise is ignored. This braking index value for J1640-4631 must be in accordance with energy loss due to pure magnetic dipole radiation within uncertainties. For a similar example for characteristic age and real age values (J1801-2451), see section 3.2. According to Guseinov et al. (2004) magnetic fields of pulsars decay exponentially and the characteristic time scale for this process is about 3 yr. As shown by Guseinov et al. (2004), the correlation between and the kinematic age (depending on the pulsar distance from the plane) no longer exists for > years. This is also considered in adopting distances of older pulsars, in particular for the ones in the regions of the Galactic arms that are deviated from the Galactic plane.
According to Faucher-Giguère & Kaspi (2006) average space velocity of pulsars is km/s. Verbunt et al. (2017) suggest that the average space velocity of 42 of pulsars is 120 km/s and 58 of pulsars is 580 km/s. There are 422 PSRs whose transverse speed (Vtrans) is given according to the adopted distances by the ATNFPC and the average value of the transverse speeds of these pulsars is 265.7 km/s. There are some very large Vtrans values given in ATNFPC (e.g. PSR J1327-0755 Vtrans=11705 km/s, b=53.848, d25 kpc; PSR J0134-2937 Vtrans=2279.86 km/s, b=-80.250, d25 kpc; PSR J0151-06354 Vtrans=1419.49 km/s, b=-65.004, d25 kpc; PSR J2116+1414 Vtrans=1612.10 km/s, b=-23.409, d25 kpc). This is mainly because of some of the PSRs with b>1 having overestimated distances as adopted in ATNFPC. About 75 of 422 PSRs in ATNFPC have Vtrans values below the average 265.7 km/s value. Although the number of PSRs with overestimated distances is relatively small, they still cause the average speed value to be overestimated. Average space velocity of PSRs depends on the kick (asymmetry of the explosion), regardless of where the PSR was born (Yazgan et al., 2007; Katsuda et al., 2018). According to Allakhverdiev et al. (1997) and Hansen & Phinney (1997) the average space velocity of pulsars is 250-300 km/s. Considering that young pulsars ( 8 yr) must be located in or close to the star formation regions (molecular clouds, HI clouds, giant HII regions, SNRs, OB associations and open clusters) within the Galactic arms and the references given above, the average space velocity of pulsars must be about 300-350 km/s.
While constructing distance-DM relations, both characteristic age and average space velocity of pulsars (300-350 km/s) are taken into account as discussed in previous two paragraphs. Young pulsars whose 8 yr are considered to be inside (or close to) the star formation regions (Galactic arms). The distance and the thickness of the Galactic arms are taken into account as criteria while determining distance-DM relations. Older pulsars (107 years) can be located within Galactic arms, in between them or far away from them unless their space velocity is too small, so that the characteristic age is not a valid criterion for such pulsars in general.
There must be a correlation between the distribution of the HII regions, SNRs, OB associations and the Galactic distribution of free electrons in the vicinity of the Galactic plane. Their densities must also be correlated which is harder to show due to the lack of necessary observational data. Such correlations must be stronger at smaller distances and when considering only the Galactic arm regions. At large distances, the correlations must become weaker because of the presence of low density plasma between the arms. At larger distances from the Galactic plane, the free electron distribution must become more uniform with a decrease in its average value. Because of this fact, pulsars at larger Galactic latitudes must be located at relatively larger distances as compared to the pulsars at smaller latitudes with similar DM values at the same longitudes. The pulsars with large and/or the ones in the longitude intervals of the deviated arm regions must be considered separately.
The plasma regions in the Galactic bulge is not well known as compared to the plasma in arms nearer to the Sun, but their contribution to the values of DM can be more important than the plasma in the arms as seen in the case of the largest DM pulsar (SGR J1745-29).
The location, thickness and scale height of each Galactic arm are taken into account in adopting distances for the pulsars located at or close to the Galactic plane. For this, we assumed that the average value of the free electron number density increases as the line of sight passes through each arm as a function of distance for the pulsars in the same longitude and latitude intervals.
When adopting distances for pulsars in each solid angle interval (these groups of pulsars are given in the next section) independent distance measurements for them (like trigonometric parallax and associations with SNRs or stellar clusters) are also taken into consideration. Using the results of such measurements and making comparisons between pulsars in each group data lead to improved values of both distance and uncertainty in distance. The data used are mainly , b, DM, and also some of the other data displayed in the text of the next section and in Tables 1–22). In these tables, data from ATNFPC and the ones adopted and calculated in this study are shown in separate columns.
3 Radio Pulsar Groups in Different Solid Angle Intervals in the First Quadrant
Below, some basic information and observational results for groups of Galactic radio pulsars in different solid angle intervals, covering the first quadrant of the Galaxy, are presented. Luminosity comparisons between radio pulsars and the Crab pulsar which is taken as a reference, are done using the measured flux at 1400 MHz to put a limit on the distance unless otherwise is stated. The measured transverse speeds (Vtrans) of pulsars displayed in the ATNFPC are also presented.
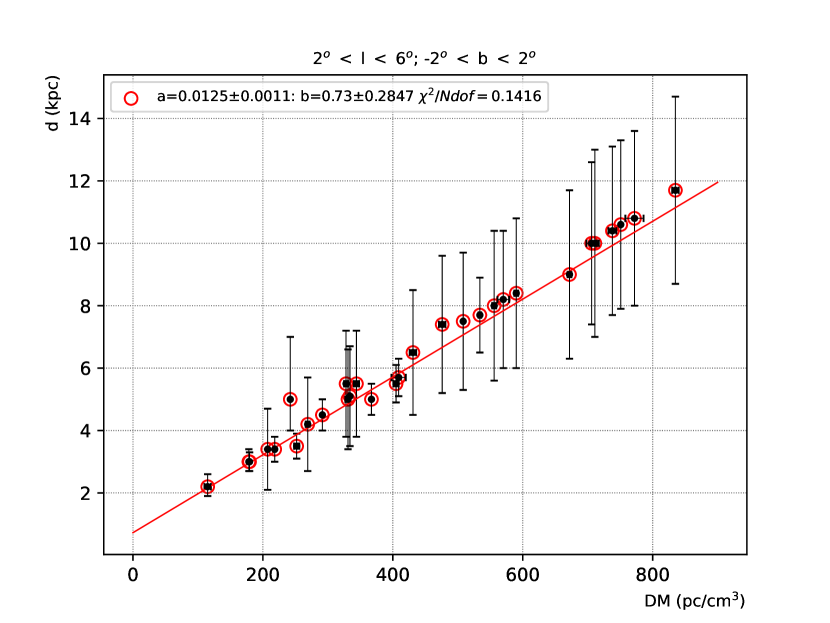
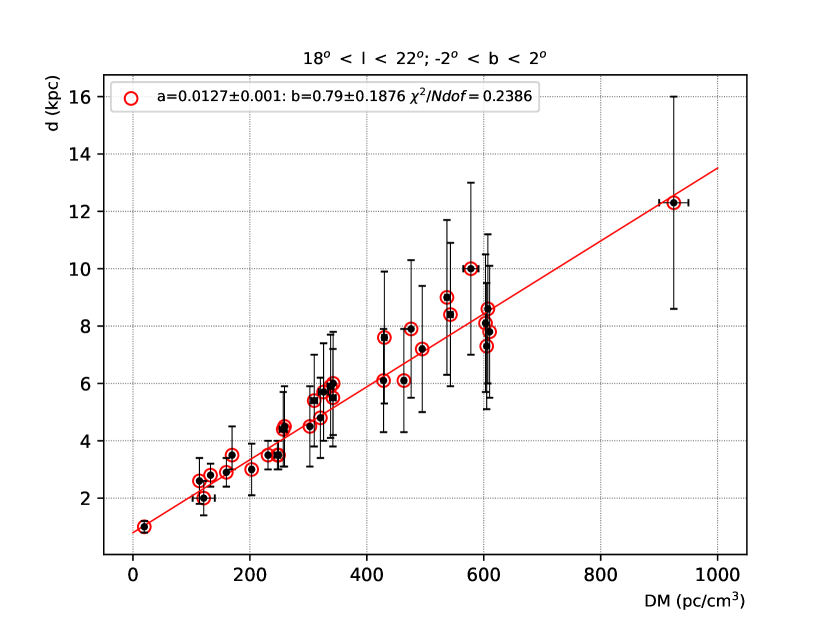
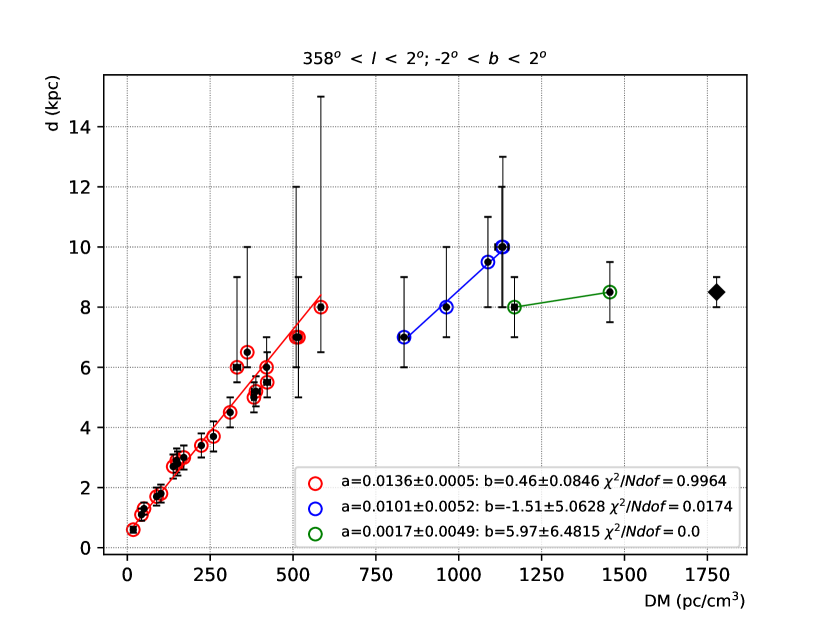
3.1 358 2; -2 2
There are 29 radio pulsars in these Galactic central directions including some of the largest DM pulsars. Nine of the pulsars are young ( 8 yr) (see Table 1) that each of them must be located at or close to one of the Galactic arms or at the Galactic bulge.
One of the young pulsars in this group is the magnetar SGR J1745-29 with the largest DM (1778 pc/cm3) among all the observed pulsars up to date. The magnetar’s LOS passes through the HII region G359.964-00.101 with unknown distance (Anderson et al., 2014) and possibly through low-density parts (i.e. unobserved) of several other HII regions. SGR J1745-29 is probably located close to the Galactic center with its direction passing through Sgr A. It has also the largest RM measured up to date suggesting a location close to the Galactic center. Since SGR J1745-29 is only 3400 years old, it is also possible that this pulsar is located at a Galactic arm beyond the center considering its extremely large DM and the small number of RM measurements for pulsars to make conclusive comparisons. The magnetar has Vtrans=251.023 km/s at d=8.3 kpc (ATNFPC), therefore if it is located at a distant arm beyond the center, its speed can be about about 2 times larger than the average speed of pulsars.
Eight of the 29 pulsars in this group have DM 800 pc/cm3 (see Table 1) strongly suggesting the presence of dense plasma at the Galactic central regions. There is no observed pulsar with DM in the range 600 pc/cm3 DM 800 pc/cm3 possibly corresponding to the interval between the Norma arm and the Galactic central region.
Young pulsar J1745-3040 (=358.553, b= -0.963, DM=88.373 pc/cm3, d=2.343 kpc (YMW17), = 5.46105 yr) is located at Sagittarius arm. It has Vtrans=46.78 km/s at d=0.2 kpc (0-1.3 kpc, kinematic) according to ATNFPC. The speed of this pulsar is comparable to the average value at our adopted distance. Very young pulsar 1740-3015 (=358.294, b= 0.238, DM=151.96 pc/cm3, d=2.944 kpc (YMW17), = 2.06104 yr) is located at Scutum arm. For this pulsar, 0.4 kpc (0.1-2.1 kpc, kinematic) is adopted in ATNFPC. J1752-2806 (=1.54, b= -0.961, DM=50.372 pc/cm3, d=1.335 kpc (YMW17), = 1.1106 yr) is probably at or close to Sagittarius arm, which has the adopted distance of 0.2 kpc (0.1-1.3 kpc, kinematic) in ATNFPC. There is no Local arm source in or close to the directions of these pulsars. If such very small distances (0.2-0.4 kpc) were correct, the average free electron density in the nearby region of the Sun would have been very large. herefore, the distances adopted in ATNFPC for these three pulsars based on the kinematic measurements listed in YMW17 model, must have an order of magnitude underestimated values.
RM values of J1752-2806 and J1745-3040 are both positive and similar in magnitude (see Table 1). Considering also their DM values, these two pulsars must be located in or close to the Sagittarius arm.
Pulsar J1752-2806 (d=1.1-1.5 kpc) has a larger upper limit on the distance (taking the Crab pulsar as a reference) at 1400 MHz as compared to 400 MHz which is an exceptional case. This pulsar may have a luminosity similar to that of Crab.
Young pulsar J1747-2958 ( = 359.305, b = -0.841, DM = 101.5 pc/cm3, d = 2.5 (ATNFPC) kpc, = 2.55104 yr) is possibly associated with PWN G359.23-0.82 (d3 kpc, Uchida et al., 1992); (d = 2 kpc Camilo et al., 2002); (d5.5 kpc (HI) Camilo et al., 2002); (d = 4.80.8 kpc (X-ray) Abdo et al., 2013) and located in the direction of the HII region G359.50-0.60 (d = 1.50.2 kpc, Hou et al. (2009) with a lateral separation of only 8 pc.
Pulsars J1739-2903, J1740-3015, J1739-3023 and J1738-2955 have negative RM values ranging from -7418 to -23618 (see Table 1). Together with their DM values and considering the fact that all of them are young, they must be located within the Scutum arm. Pulsar J1741-2945 has a direction close to the directions of J1738-2955, J1739-3023 and J1740-3015 with a significantly larger DM. Therefore, the line of sight of this pulsar must pass through at least some part of the Norma arm as well and it may even be located within this arm.
Pulsars J1736-2843 and J1741-2719 have the largest latitudes in this group (see Table 1). Based on their DM values, the lines of sight of these pulsars are possibly not passing through the Scutum and the Norma arms. Their values are not small either, making the uncertainties in their distances larger.
Pulsars J1749-3002 (b = -1.244) and J1752-2821 (b = -0.976) have DM values comparable to each other (see Table 1). Model dependent and adopted distances (which are the same for each of them) for these two pulsars given in ATNFPC are 12.7 kpc and 5.4 kpc, respectively, with a distance ratio of about 2.4. If the latitude of J1752-2821 were even slightly smaller making its b -1, the distance of this pulsar would be at least twice the value given in ATNFPC according to YMW17 model. These two pulsars must probably be located at similar distances.
There is the giant molecular cloud Sagittarius (Sgr) B2 (= 0.67, b = -0.03, d = 7-8.6 kpc Reid et al., 2009; Reid et al., 2014) possibly located close to the Galactic center. There are 451 HII regions in = b = 02 intervals around the Galactic center direction (Anderson et al., 2014). Distance measurements are avaliable only for 17 of the HII regions locating all of them at 8 kpc in the intervals = 358.53 – 358.95 and b = -0.116 – 0.085. None of the pulsars in this group has a LOS passing through any one of these HII regions.
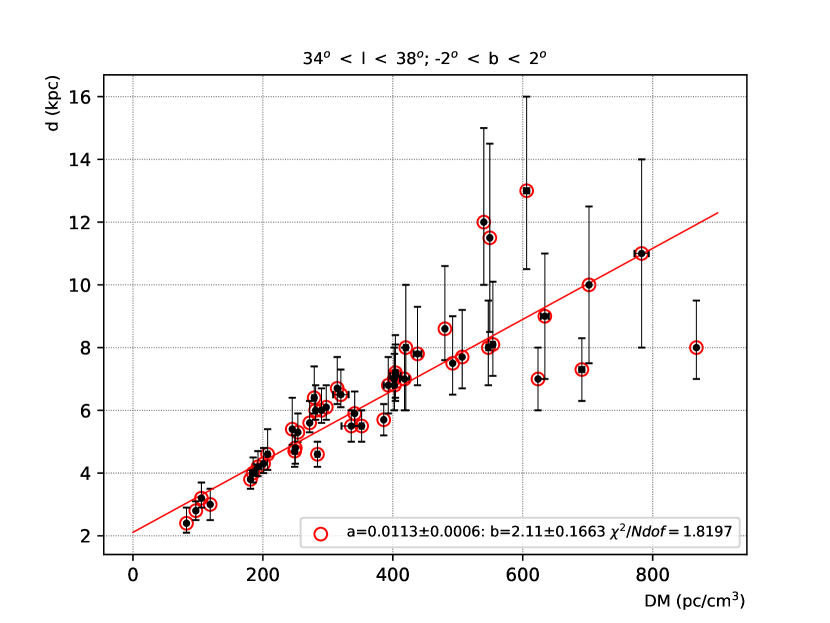
Based on our adopted distances, J1749-3002 must be more luminous than the Crab pulsar by a factor of 2.8-4.8, while J1741-3016 and J1746-2850 must be more luminous or comparable to the Crab. J1747-2802, J1740-3015 and J1748-3009 may be comparable to and J1745-3040 must be comparable to or less luminous than the Crab pulsar (see Table 1 and Figure 1).
Data from ATNFPC Adopted and Calculated Data in this Study PSR b DM err RM err RM/DM d err dCrab z degree degree pc/cm3 pc/cm3 rad/m2 rad/m2 Myr kpc kpc kpc pc J1753-28 0.887 -1.377 18 0.9 - - - - 0.6 0.1 - -14 J1751-2857 0.646 -1.124 42.84 0.03 - - 5530 - 1.1 0.2 31 -22 J1752-2806 1.54 -0.961 50.372 0.008 96 0.2 1.1 1.9 1.3 0.2 1.4†, 1.08 -22 J1745-3040 358.553 -0.963 88.373 0.004 101 7.0 0.546 1.1 1.7 0.3 5.8†, 1.6 -29 J1747-2958 359.305 -0.841 101.5 1.6 - - 0.0255 - 1.8 0.3 15 -26 J1739-2903 359.206 1.064 138.55 0.02 -236 18 0.65 -1.7 2.7 0.4 4 50 J1741-2733 0.636 1.582 149.2 1.7 -89.6 5.1 95.9 -0.6 2.9 0.4 6 80 J1740-3015 358.294 0.238 151.96 0.01 -168 0.7 0.0206 -1.1 2.8 0.4 9.5†, 2.5 12 J1739-3023 358.085 0.336 170.5 0.1 -74 18 0.159 -0.4 3 0.4 7 18 J1738-2955 358.378 0.724 223.4 0.6 -200 20 0.0857 -0.9 3.4 0.4 15 43 J1751-2737 1.761 -0.376 260 0.1 - - - - 3.7 0.5 - -24 J1741-2945 358.798 0.38 310.3 1.2 -531.1 9.1 5.58 -1.7 4.5 0.5 10 30 J1736-2843 359.142 1.764 331 10 -491.3 7.6 3.4 -1.5 6 +3.0, -0.5 11 246 J1741-2719 0.907 1.604 361.9 0.4 - - 68.2 - 6.5 +3.5, -0.5 17 252 J1741-3016 358.346 0.13 382 6 -449.9 3.4 3.34 -1.2 5 0.5 5 11 J1750-28 0.663 -0.737 388 12 - - 3.56 - 5.2 0.5 25 -67 J1748-3009 359.272 -1.147 420.2 0.01 - - - - 6 +1.0, -0.5 6 -120 J1746-27 0.971 0.494 422 9 - - - - 5.5 +1.0, -0.5 15 47 J1749-3002 359.459 -1.244 509.4 0.3 -290 3.0 1.23 -0.6 7 +5.0, -1.0 13.2†, 3.7 -217 J1752-2821 1.267 -0.976 516.3 1.3 - - 2.93 - 7 +5.0, -1.0 13 -170 J1748-30 359.117 -1.141 584 5 - - - - 8 +7.0, -1.5 19 -239 J1747-2802 0.971 0.121 835 14 421 26 18.6 0.5 7 +2.0, -1.0 11 15 J1746-2850 0.134 -0.044 962.7 0.7 - - 0.0127 - 8 +2.0, -1.0 8 -6 J1745-2910 359.763 -0.054 1088 0.1 - - - - 9.5 1.5 - -9 J1745-2912 359.788 -0.175 1130 20 -535 110 - -0.5 10 2.0 - -31 J1747-2809 0.869 0.076 1133 3 - - 0.00531 - 10 +3.0, -2.0 - 13 J1746-2856 0.126 -0.233 1168 7 13253 53 1.2 11.3 8 1.0 - -33 J1746-2849 0.134 -0.03 1456 3 10104 100 1.84 6.9 8.5 1.0 12 -4 J1745-2900 359.944 -0.047 1778 3 -66080 24 0.0034 -37.2 8.5 0.5 - -7
3.2 2 6; -2 2
Out of the 30 pulsars in this group, 9 are young ( 8 yr), though it must be noted that 4 of the pulsars have unknown (see Table 3). The solid angle intersects the Sagittarius, Scutum and Norma arms as well as the Galactic bulge and unknown possible arms beyond the bulge.
There is a Scutum arm source (G5.88-0.39) located at d = 2.82 – 3.18 kpc from parallax measurements (Sato et al., 2014; Reid et al., 2014, 2019).
The young pulsar J1801-2451 (=5.254, b= -0.882, DM=291.55 pc/cm3, d=4.5 kpc, = 1.55104 yr, see Table 3) has Vtrans=199.15 km/s at d=3.803 kpc (ATNFPC) and z=-69 pc at d=4.5 kpc. There may be a deviation of the SFR from the Galactic plane in the direction of this pulsar at about d=4-5 kpc as J1801-2451 is possibly connected to SNR G5.27-0.9 (d=5 kpc (proper motion) Thorsett et al. 2002; Guseinov et al. 2003b). PSR – SNR G5.4-1.2 connection is established in Frail & Kulkarni (1991) (d4.3 kpc Frail et al. 1994, d 5 kpc Caswell et al. 1987, d=4.5 kpc Guseinov et al. 2003b, d>4.3 kpc (HI absorption suggests) Green 2019; Thorsett et al. 2002).
Pulsar J1748-2446A (=3.836, b= 1.696, DM=242.15 pc/cm3, d=5 kpc, is unknown, (see Table 3)) is a member of the globular cluster Ter 5 including 42 pulsars none of which has a measured and this globular cluster has a large uncertainty in its distance measurement (d=4.6–10.3 kpc Harris, 1996; Cohn et al., 2002; Ortolani et al., 1996; Ortolani et al., 2001, 2007; Ferraro et al., 2009; Kong et al., 2010; Baumgardt et al., 2019; Valenti et al., 2007).
Five of the pulsars in this group may be more luminous than the Crab pulsar. See Figure 2 for distance-DM relation for this solid angle interval.
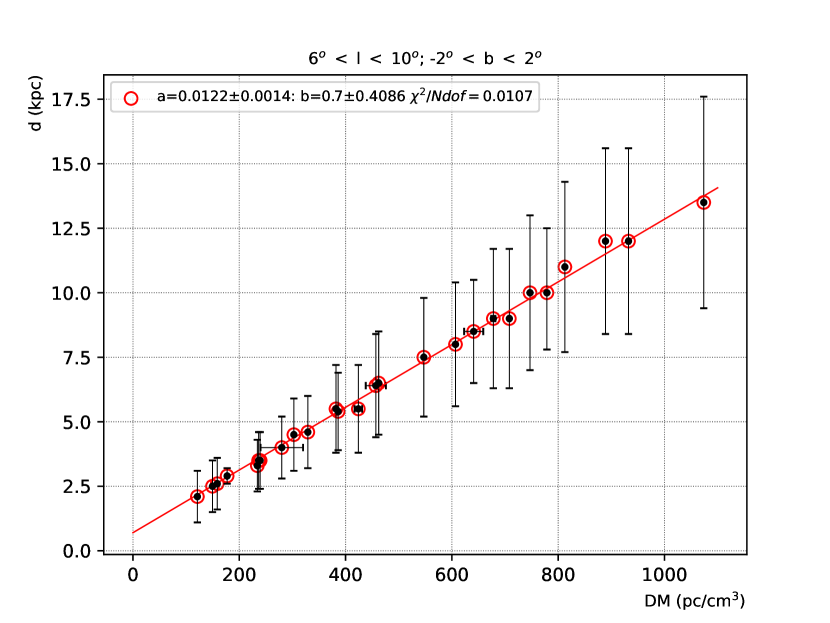
3.3 6 10; -2 2
There are 26 pulsars, 7 of which are young ( 8105 yr, see Table 4). The solid angle intersects the Sagittarius, Scutum and Norma arms, possibly also intersecting the Perseus arm and the distant parts of the Sagittarius and Scutum arms beyond the Galactic central region.
There is a Norma arm source (Reid et al., 2014, 2019) in this interval: G9.62+0.19 (d = 4.6 – 5.8 kpc Sanna et al. 2009).
PSR J1756-2251 (d=2.1 kpc) has Vtrans=8.38 km/s at d=0.73 kpc (ATNFPC) (0.49-1.33 kpc, parallax (Yao et al., 2017)) and PSR J1802-2124 (d=2.5 kpc) has Vtrans=17.564 km/s at d=0.76 kpc (ATNFPC). For pulsars J1753-2240 (d=2.6 kpc) and J1759-2205 (d=2.9 kpc), the ATNFPC adopted distances are 3.23 and 3.26 kpc, respectively. Therefore, the adopted distances in ATNFPC for pulsars J1756-2251 and J1802-2124 are probably underestimated values. The actual speeds of these pulsars must then be not so small.
Pulsar J1803-2137 has Vtrans=392.261 km/s at d=4.4 kpc (ATNFPC). The actual distance of this pulsar may be 1-2 kpc smaller than the value adopted in ATNFPC, making its speed more comparable to the average pulsar speed.
One of the young pulsars is J1801-2304 (=6.837, b= -0.066, DM=1073.9 pc/cm3, d=13.5 kpc, = 5.83104 yr, see Table 4) in the direction of the SNR W28 (G6.4-0.1) (d=2.5 kpc (Guseinov et al., 2003b), d = 1.9 kpc (HI absorption) (Green, 2019; Velázquez et al., 2002) and G7.0-0.1 (d=9.5 kpc (Guseinov et al., 2003b)). As the DM value of the pulsar is too large, a physical connection to SNR W28 is unlikely, so it may simply be a chance projection. A physical connection to SNR G7.0-0.1 considering the uncertainties in the distances is not ruled out but it is not very probable. Considering its position and the large DM, this young pulsar is probably related to a distant unobserved SNR beyond the Galactic central region.
Six of the pulsars in this group may be more luminous than the Crab pulsar at 1400 MHz (J1803-2137, J1812-2102, J1808-2057, J1759-2302, J1805-2032, J1801-2304) None of them are more luminous than the Crab pulsar at 400 MHz according to our adopted distances.
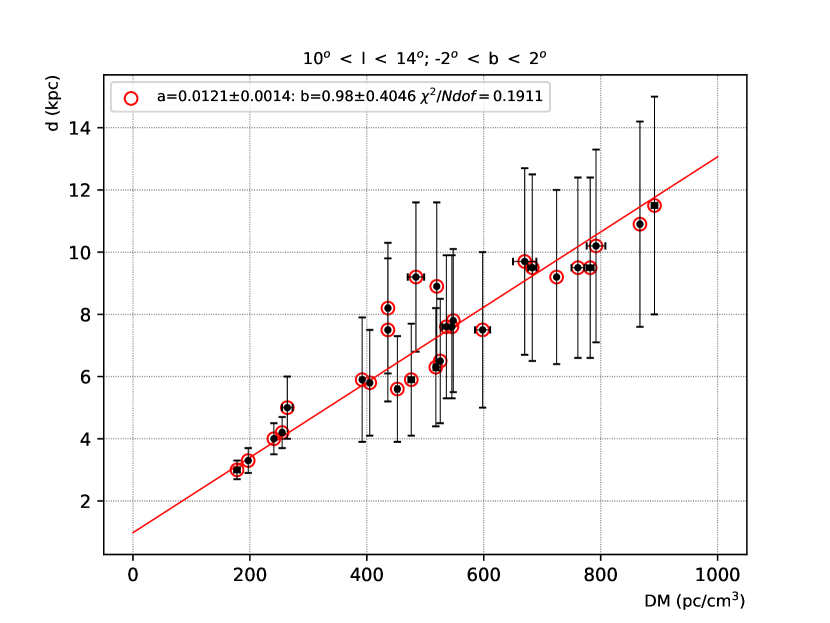
3.4 10 14; -2 2
There are 27 pulsars in this group, from which 6 are young ( 8105 yr) (see Table 5). The solid angle intersects the Sagittarius, Scutum, Norma, Perseus and Cygnus arms as well as the outer parts of the Galactic bulge region. Two of the young pulsars, J1809-1943 (=10.727, b=-0.158, DM=178 pc/cm3, d=3 kpc, = 3.1104 yr) and J1809-1917 (=11.094, b= 0.08, DM=197.1 pc/cm3, d=3.3 kpc, = 5.13104 yr), are located at the Scutum arm (see Table 5). The other young pulsars are probably located beyond the Norma arm.
There is a Sagittarius arm source (Reid et al., 2014, 2019; Wu et al., 2014) in this interval: G11.49-1.48 (d = 1.2 – 1.3 kpc, arm offset = 120 – 220 pc). There are also several Scutum arm sources (Reid et al., 2014, 2019): G11.91-0.61 (d = 3.05 – 3.76 kpc (Sato et al., 2014)); G12.68-0.18 (d = 2.25 – 2.57 kpc (Immer et al., 2013)); G12.8-0.2 (d = 2.64 – 3.27 kpc (Immer et al., 2013)); G12.88+0.48 (IRAS 18089-1732) (d = 2.27 – 2.78 kpc (Immer et al., 2013)); G12.9-0.24 (d = 2.31 – 2.61 kpc (Immer et al., 2013)); G12.9-0.26 (d = 2.34 – 2.75 kpc (Immer et al., 2013)); G13.87+0.28 (d = 3.6 – 4.35 kpc (Sato et al., 2014)). Two sources located at the possible 3-kpc arm and a source at a ’connecting arm’ are (Reid et al., 2014, 2019; Sanna et al., 2014): G10.62-0.38 (W31) (d = 4.52 – 5.46 kpc); G12.02-0.03 (d = 8.77 – 10.2 kpc) and G10.47+0.02 (d = 8 – 9.2 kpc).
J1806-1920 is more luminous than the Crab pulsar by a factor of 1.4-5.2 times and J1809- is at least as luminous as Crab. J1811-1736 and J1814-1744 has a luminosity comparable to that of Crab, whereas J1801-1855 and J1811-1835 may be at most as luminous as the Crab pulsar.
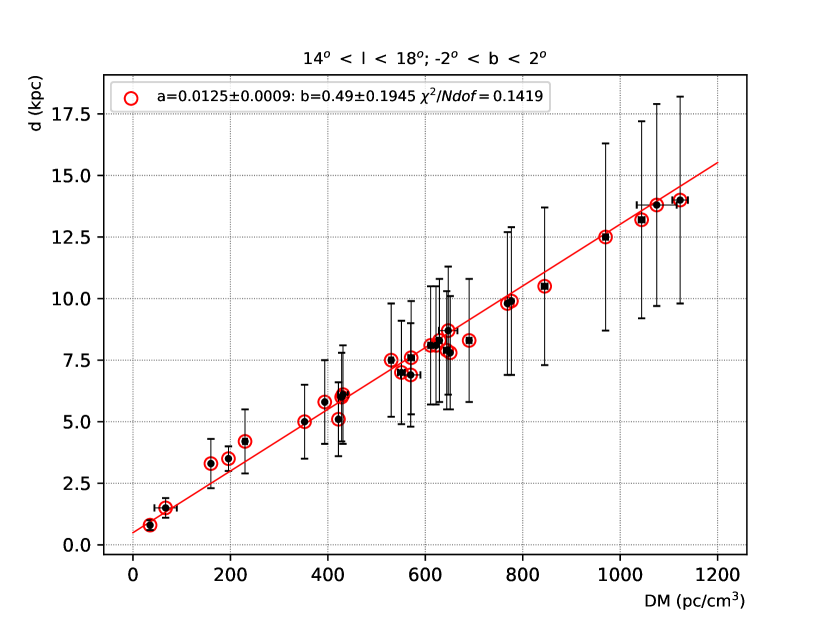
3.5 14 18; -2 2
Only five of the 28 pulsars in this group are young ( 105 yr) (see Table 6). This interval intersects the Sagittarius (twice), Scutum (twice) and Norma arms as well as the Galactic bulge region. The young pulsars are located at or close to these arms and the Galactic bulge. It is possible that J1821-1419 may be located at a distant arm (Perseus?) beyond far-Sagittarus.
The Sagittarius arm sources (Reid et al., 2014, 2019; Wu et al., 2014) in this interval are: G14.33-0.64 (d = 1.01 – 1.26 kpc, arm offset = 200 – 440 pc Sato et al. 2010); G14.63-0.57 (d = 1.77 – 1.9 kpc, arm offset = -400 – -260 pc); G15.03-0.67 (M 17) (d = 1.86 – 2.11 kpc, arm offset = -570 – -330 pc Xu et al. 2011). There is only one Scutum arm source Reid et al. (2014, 2019); Sato et al. (2014): G16.58-0.05 (d = 3.31 – 3.9 kpc).
Although, the solid angle cuts through different parts of several arms, the number of young pulsars is relatively low, possibly due to the fact that the intersection depths through the arms are small.
Pulsars J1818-1422, J1818-1519 and J1820-1346 are more luminous than the Crab pulsar by a factor of 3.9-13.1, 2-7 and 1.7-5.9 times, respectively. J1819-1408 is probably at least as luminous as the Crab pulsar. Pulsars J1818-1541, J1817-1511, J1820-1529, J1825-1446, J1821-1419, J1822-1400, J1823-1347 may have luminosity comparable to the Crab pulsar’s based on their adopted distances.
Pulsars J1818-1519 (=15.55, b= 0.192, DM=845 pc/cm3, d=10.5 kpc, = 3.63106 yr) and J1818-1422 (=16.405, b= 0.61, DM=622 pc/cm3, d=8.1 kpc, = 2.27106 yr) (see Table 6) are most probably more luminous than the Crab pulsar based on our adopted distances.
3.6 18 22; -2 2
In this group, 32 pulsars are included 9 of which are young ( 105 yr) (see Table 7). The youngest one, J1833-1034 (=21.501, b= -0.885, DM=169.5 pc/cm3, d=3.5 kpc, = 4.85103 yr) (see Table 7)), is probably physically connected to the C-type SNR G21.5-0.9 (d(kinematic)4.8 kpc Tian & Leahy 2008, d = 4.3 kpc, Lee et al. 2019 and references therein, d = 4.4 (HI absorption) Ranasinghe & Leahy 2018, d>2.9 kpc (optical) Shan et al. 2018). This pulsar is probably located at a slightly deviated part (z=-54 pc at 3.5 kpc (see Table 7)) of the Scutum arm in a dense star formation region in between and possibly connected to the Sagittarius and the Norma arms. The other young pulsars of the group are located at or close to these three arms (J1822-1252 may be at Perseus or far-Sagittarius).
J1828-1101 is more luminous than the Crab pulsar up to a factor of 4.7. J1823-1115, J1824-1118, J1827-0958 and J1832-1021 are probably more luminous but may be comparable in the limit, whereas J1822-1252, J1823-1126, J1831-1223 and J1833-1055 are at most as luminous as the Crab pulsar.
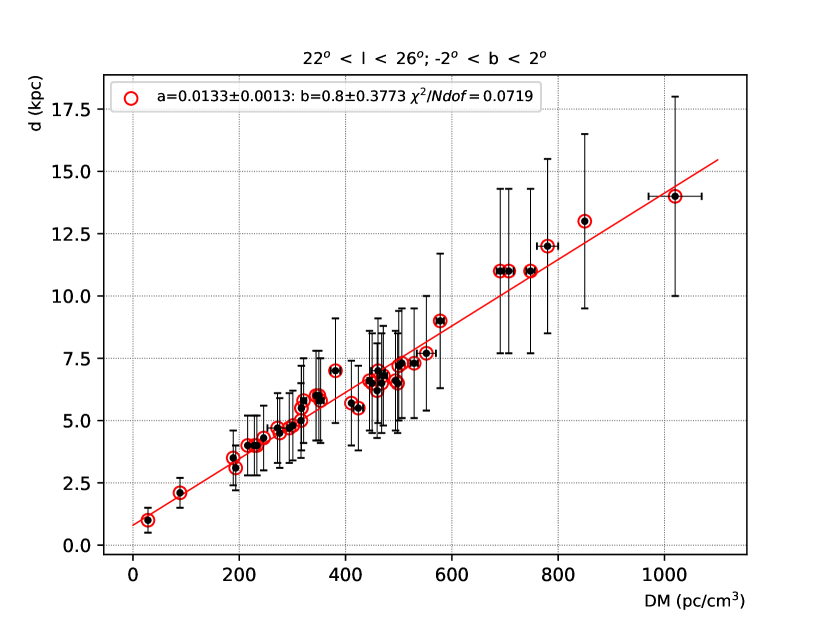
3.7 22 26; -2 2
This solid angle intersects the Sagittarius and Scutum arms twice, possibly also intersecting the edge of the Norma arm at about =22 which is possibly separated from the Scutum at most by 1 kpc. As large parts of star formation regions are included within this interval, 16 young pulsars are present in the group out of a total of 41 pulsars (see Table 8). The young pulsars ( 8105 yr) are located mostly at or close to the Scutum arm, while several of them are probably related to the Norma or the Sagittarius arms.
There is one Scutum arm source and three Norma arm sources (Sato et al., 2014; Reid et al., 2014, 2019; Brunthaler et al., 2009): G25.7+0.04 (d = 7.87 – 14.49 kpc) and G23.0-0.41 (d = 4.26 – 4.98 kpc); G23.44-0.18 (d = 4.95 – 7.25 kpc); G23.7-0.19 (d = 5.4 – 7.3 kpc). High-mass Star Forming Region (HMSFR) source G23.65-0.12 (d = 2.84 – 3.65 kpc Reid et al. 2014, 2019; Bartkiewicz et al. 2008) may be a Scutum arm source or in between the Scutum and the Sagittarius.
J1833-0827, a young radio pulsar ( = 1.47105 yr), is probably more luminous than the Crab pulsar up to a factor of 3.5 based on our adopted distance. J1836-1008 ( = 7.56105 yr), J1827-0750 ( = 2.77106 yr) and J1840-0809 ( = 6.44106 yr) (see Table 8) are possibly more luminous than the Crab pulsar. J1832-0827, J1840-0753, J1832-0644, J1835-0643, J1837-0653, J1839-0643 and J1840-0643 have luminosity possibly comparable to o that of Crab. J1834-0633 and J1834-0602 are probably less luminous than the Crab pulsar but may possibly be comparable in the limit.
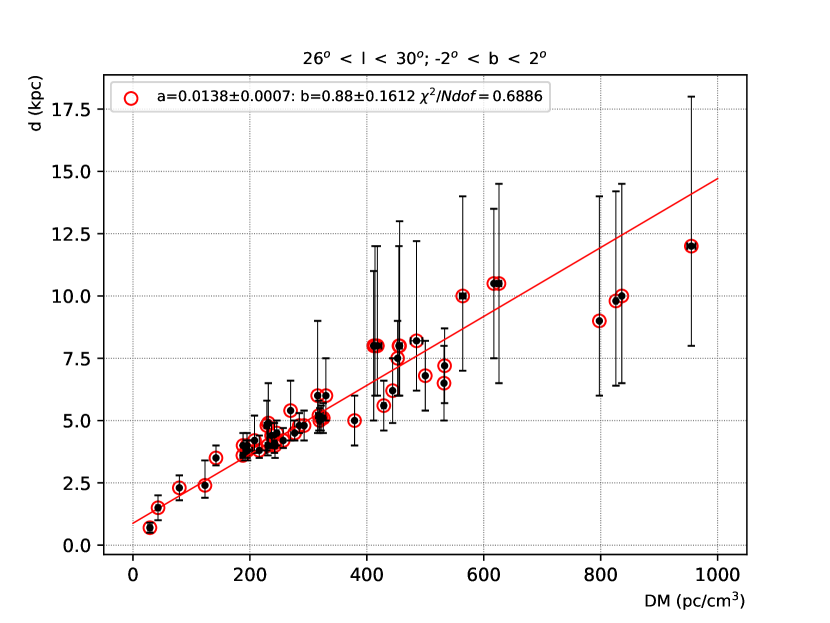
3.8 26 30; -2 2
There are 50 pulsars in this interval. About 1/3 of these pulsars are young ( 8105 yr) (see Table 9) as this interval intersects the Scutum longitudinally including a large number of HII regions as well as molecular clouds. All but three of the young pulsars are at or close to the Scutum arm; J1849-0317 is definitely at the Sagittarius arm, J1844-0538 is at either Scutum or a distant part of Sagittarius, and J1838-0453 is either at Scutum, far-Sagittarius or even far-Perseus.
In this interval, the Scutum arm sources are (Reid et al., 2014, 2019): G27.36-0.16 (d = 5.99 – 12.05 kpc Sato et al. 2014); G28.86+0.06 (d = 6.54 – 8.55 kpc); G29.86-0.04 (d = 5.52 – 7.09 kpc Sato et al. 2014); G29.95-0.01 (W 43S) (d = 4.78 – 5.84 kpc Sato et al. 2014).
Young and distant pulsar J1838-0453 (=27.07, b= 0.708, DM=617.2 pc/cm3, d=10.5 kpc, = 5.19104 yr) has z=130 pc (see Table 9), probably located at a deviated part of an SFR.
This group includes several possibly luminous pulsars as compared to the Crab pulsar: J1844-0538 may be up to about 5 times as luminous as the Crab pulsar. J1842-0612, J1838-0453 and J1848-0511 are probably less luminous than Crab pulsar but may be comparable in the limit. J1843-0355 can be as luminous, less luminous or up to 3 times more luminous than the Crab pulsar within distance uncertainties.
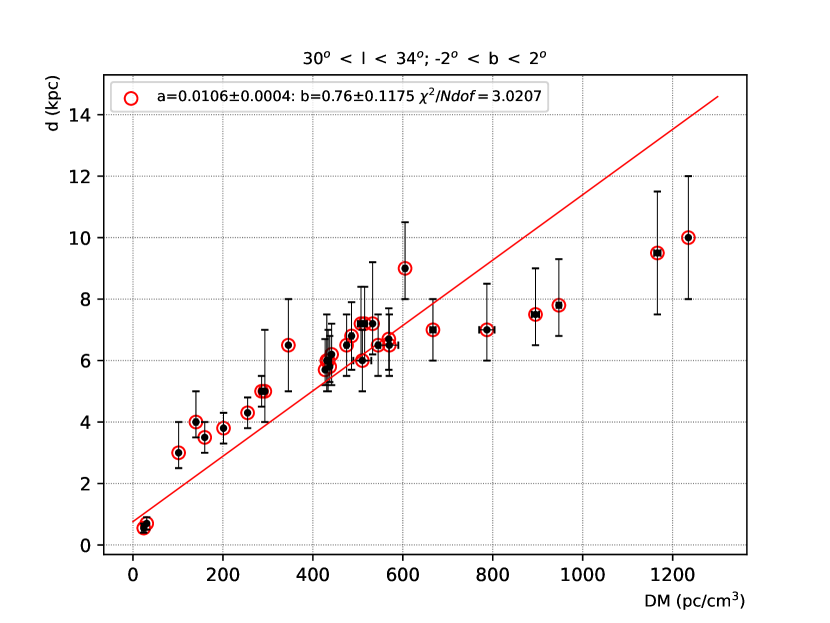
3.9 30 34; -2 2
Seven out of 31 pulsars in this group are young ( 8105 yr) (see Table 10) and probably located at or close to the Scutum arm.
The Scutum arm sources are (Reid et al., 2014, 2019; Sato et al., 2014; Zhang et al., 2014): G31.28+0.06 (d = 3.66 – 5.12 kpc); G31.58+0.07 (W 43Main) (d = 4.27 – 5.75 kpc); G32.04+0.05 (d = 4.97 – 5.4 kpc). HMSFR source G33.64-0.22 (d = 5.88 – 7.35 kpc Reid et al. 2014, 2019) is probably a Scutum arm source (there is longitudinal intersection of the LOS through a large portion of the Scutum arm).
PSR J1844+00 is up to an order of magnitude more luminous than the Crab pulsar. Pulsars J1852+0031, J1850-0026 and J1848-0123 are possibly 1.4-2.8, 1.4-2.7 and 1.3-2.4 times as luminous as the Crab pulsar, respectively.
3.10 34 38; -2 2
Thirteen of the 47 pulsars in this group are young ( 8105 yr) (see Table 11). Young pulsar J1856+0113 (=34.56, b= -0.497, DM=96.74 pc/cm3, d=2.8 kpc, = 2.03104 yr) is physically connected to the C-type SNR W44 (G34.7-0.4, HI measurements indicates a distance of about 3 kpc (Radhakrishnan et al., 1972; Green, 2019), (d = 2.8 kpc Guseinov et al. 2003b; Lee et al. 2019 and references therein, d = 3 kpc (HI absorption) Ranasinghe & Leahy 2018, d=2.10.2 kpc (optical) Shan et al. 2018). This pulsar-SNR pair is located at the Sagittarius arm which includes sources at similar distances. The other young pulsars of the group are probably located at or close to either the Sagittarius or the Scutum arms. Young and distant pulsar J1857+0210 (=35.586, b= -0.393, DM=783 pc/cm3, d=11 kpc, = 7.12 105 yr, see Table 11) may possibly be located close to the Perseus arm instead of the Sagittarius arm.
The Sagittarius arm sources are (Reid et al., 2014; Wu et al., 2014): G34.39+0.22 (d = 1.45 – 1.69 kpc, arm offset = 160 – 320 pc Kurayama et al. 2011); G35.02+0.34 (d = 2.12 – 2.56 kpc, arm offset = -90 – -350 pc Reid et al. 2009); G35.19-0.74 (d = 1.99 – 2.43 kpc, arm offset = -20 – -260 pc Zhang et al. 2009); G35.2-1.73 (d = 2.85 – 3.83 kpc, arm offset = -490 – -930 pc Zhang et al. 2009); G37.43+1.51 (d = 1.8 – 1.96 kpc, arm offset = 70 – 150 pc Reid et al. 2009).
The Scutum and the Sagittarius arms are closer to each other in the approximate distance interval 4-8 kpc in these directions increasing the uncertainty of the young pulsar locations (Hou et al., 2009; Hou & Han, 2014).
Young pulsar J1857+0210 should have a luminosity comparable to that of the Crab pulsar if it is located beyond but close to the Perseus arm, while the younger pulsar J1857+0212 in this direction, probably located at the Sagittarius arm, has 1.2-2.4 times the Crab pulsar’s luminosity. Pulsars J1859+00 and J1903+0135 must be 2.9-8.2 and 2.3-4 times more luminous than the Crab pulsar, respectively. Pulsars J1859+00 and J1903+0135 must be 2.9-8.2 and 2.3-4 times more luminous than the Crab pulsar, respectively. J1901+0331 has luminosity 2.6-4.7 times the Crab pulsar’s luminosity both at 400 MHz and 1400 MHz. J1855+0307, J1903+0327 and J1853+0505 may have luminosity comparable to or slightly less than that of the Crab pulsar. Luminous pulsar J1901+0331 has Vtrans=1511.36 km/s at d=7 kpc (ATNFPC).
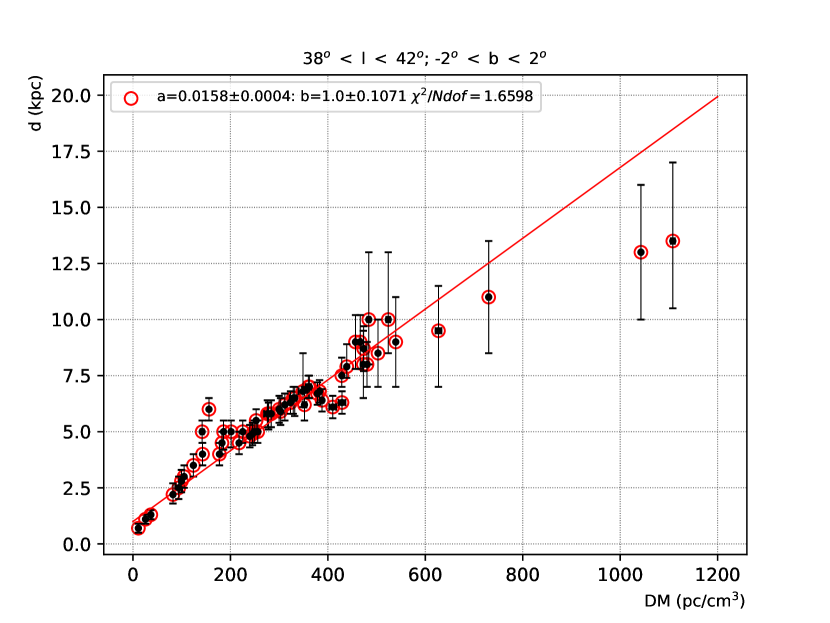
3.11 38 42; -2 b 2
This crowded group has 55 members including some of the pulsars with the smallest and the largest values. Fourteen of these pulsars are young ( 8105 yr) which are probably located at or close to the Sagittarius arm. Pulsar J1901+0459 (=38.49, b=0.087, DM=1108 pc/cm3, d=13.5 kpc, = 8.86105 yr, see Table 12) may be located at or close to the Perseus arm or the Cygnus arm.
Young pulsar J1855+0527 (=38.227, b= 1.642, DM=362 pc/cm3, d=7 kpc, = 8.26104 yr, see Table 12) is probably located at a deviated part of an SFR as its distance from the Galactic plane is 201 pc.
For recycled millisecond (ms) pulsars J1905+0400 (P=3.8 ms, =1.221010 yr), J1904+0412 (P=71 ms, =1.021010 yr), J1904+0451 (P=6 ms, =1.691010 yr) and J1914+0659 (P=18.5 ms, =9.46109 yr) (ATNFPC), the real ages are not related to their characteristic ages as such radio pulsars are formed after the X-ray binary phase in close binary systems (Bisnovatyi-Kogan & Komberg, 1976, 1974).
Although the number of pulsars is relatively large in this group, there is no known arm source in this interval.
J1901+0435 must be one order of magnitude more luminous than the Crab pulsar and J1906+0641 has luminosity 1.3-2.7 times larger than the Crab’s. J1857+0526, J1907+0534, J1905+0600 and J1910+0534 may be as luminous as the Crab pulsar.
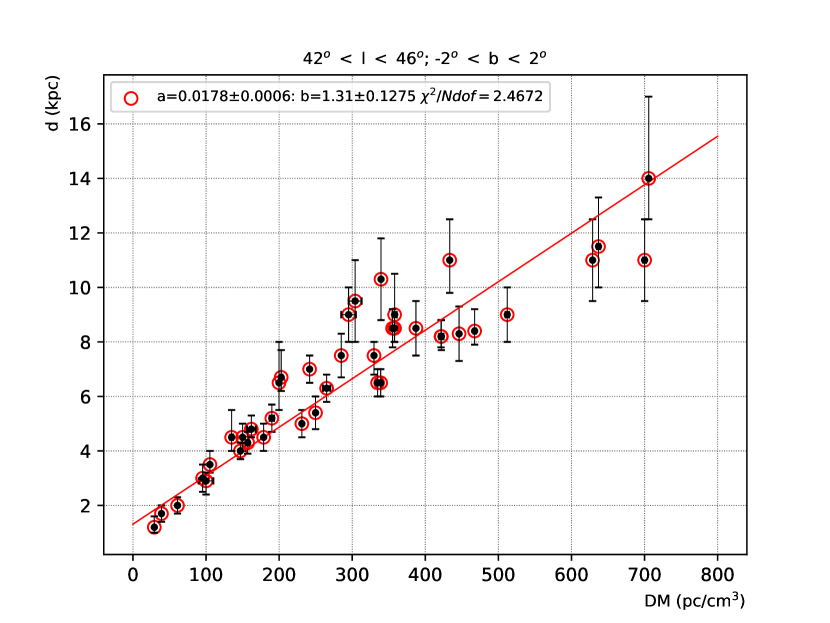
3.12 42 46; -2 2
The solid angle of this group cuts through the Sagittarius arm including a large number of HII regions and molecular clouds, also intersecting a small part of the Perseus arm and possibly the Cygnus arm. There are 11 young ( 8105 yr) pulsars (see Table 13) all of which are most probably located at or close to the Sagittarius arm in large distance intervals. Two of the 40 pulsars in this group are probably located close to the Perseus arm: J1905+0902 (=42.555, b=1.056, DM=433.4 pc/cm3, d=11 kpc, = 9.88105 yr) and J1913+1145 (=45.92, b=0.476, DM=637 pc/cm3, d=11.5 kpc, = 9.67105 yr, see Table 13).
There are Sagittarius arm sources in this interval (Reid et al., 2014, 2019; Wu et al., 2014): G43.79-0.12 (OH 43.8-0.1) (d = 5.84 – 6.21 kpc, arm offset = -470 – -530 pc); G43.89-0.78 (d = 7.09 – 9.9 kpc, arm offset = -770 – 1210 pc); G45.07+0.13 (d = 7.35 – 8.19 kpc, arm offset = -10 – 290 pc); G45.45+0.05 (d = 7.35 – 9.8 kpc, arm offset = -380 – 1360 pc). There is only one Perseus arm source: G43.16+0.01 (W 49N) (Reid et al., 2014, 2019) (d(parallax) = 10.42 – 11.9 kpc (Zhang et al., 2013), d(kinematic) = 10.43 – 11.28 kpc (Choi et al., 2014)).
Dense plasma regions of the Sagittarius arm in this longitude interval are possibly located at: =42, d=1.7-5.4 kpc, d=8-8.9 kpc; =43, d=1.7-3.6 kpc, 4.8-5.4 kpc, d=8-8.9 kpc; =44, d=1.7-2.7 kpc, 8-8.5 kpc; =45, d=1.7-2.2 kpc, d=4.8-4.9 kpc, d=6.6-8.5 kpc; =46, 1.7-2.2 kpc, 6-7.6 kpc (Anderson et al., 2014; Hou & Han, 2014).
Young pulsar J1907+0918 (=43.024, b=0.73, DM=357.9 pc/cm3, d=8.5 kpc, = 3.8104 yr) with z=108 pc (see Table 13) is located at a deviated part of an SFR.
Pulsars J1916+0844, J1915+1009, J1920+1040 and J1913+1145 may have luminosity comparable to the Crab pulsar, while most of the others are definitely much less luminous than the Crab.
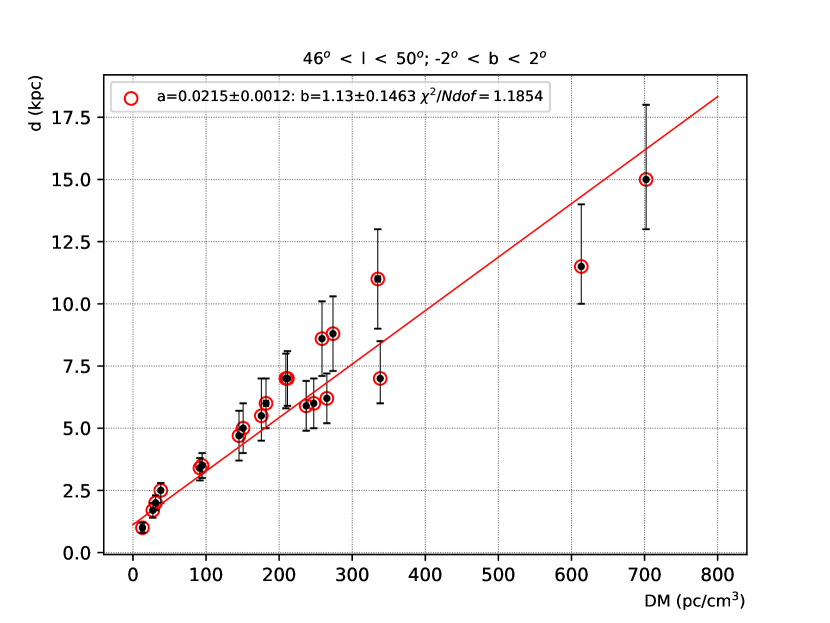
3.13 46 50; -2 2
This group includes 21 pulsars, three of which are young ( 8105 yr) and four of which with unknown (see Table 14). The solid angle intersects Sagittarius (longitudinal) and Perseus arms. There is no known HMSFR up to about 5 kpc in these directions.
There are 41 HII regions with measured distance within this solid angle (Anderson et al., 2014): G046.495-00.241 and G049.589-00370 at about 3.8 kpc; 23 HII regions at about 5.3-5.8 kpc; G048.547-00.005 at about 9 kpc; 7 HII regions at about 10 kpc; G046.173+00.533 and G046.213+00.547 at about 11 kpc; G048.719+01.147, G049.408+00.332 and G049.420+00.320 at about 13 kpc; G046.948+00.371 at about 15 kpc; G047.094+00.492 and G047.100+00.479 at about 16 kpc. Only one of these HII regions coincides with the direction of a member of this group: HII region G046.792+00.284 in the LOS of young pulsar J1916+1225.
The Sagittarius arm sources in the interval are (Reid et al., 2014, 2019; Wu et al., 2014): G49.19-0.34 (d = 4.98 – 5.47 kpc, arm offset = -50 – -90 pc); G49.48-0.36 (W 51 IRS2) (d = 3.75 – 8.06 kpc, arm offset = -860 – 740 pc); G49.48-0.38 (W 51M) (d = 5.12 – 5.71 kpc, arm offset = -60 – 0 pc). There is one Perseus arm source (Reid et al., 2014, 2019): G48.6+0.02 (d(parallax) = 10.2 – 11.36 kpc Zhang et al. 2013, d(kinematic) = 8.7 – 9.63 kpc Choi et al. 2014).
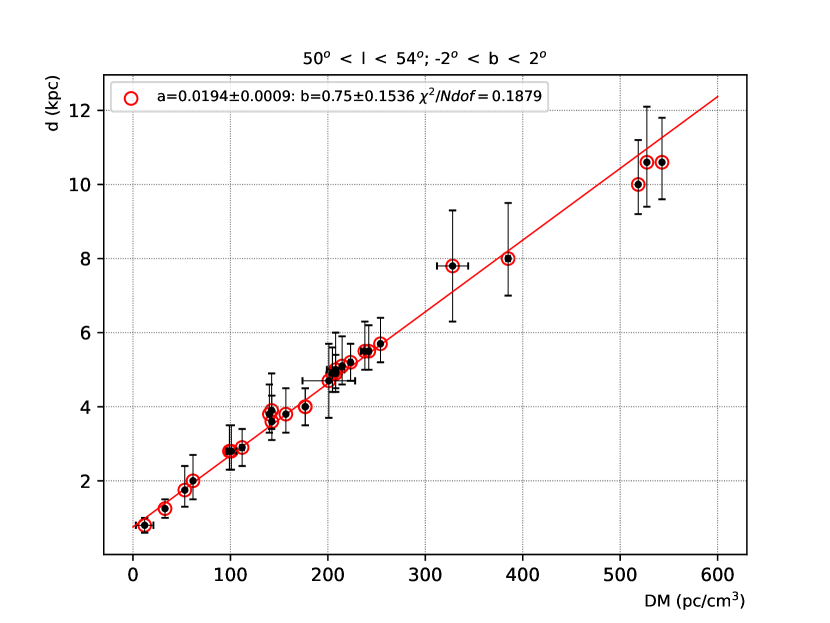
3.14 50 54; -2 2
In this group, 9 of the 27 pulsars, 5 of which are young, have unknown (see Table 15). Relatively large number of pulsars with unmeasured (unknown ) makes it more difficult to determine the locations and to make comparisons of their luminosity for the pulsars in this group.
Four of the 5 young ( 8105 yr) pulsars belong to the Sagittarius arm: J1926+1648 (=51.859, b=0.063, DM=176.885 pc/cm3, d=4 kpc, = 5.11 105 yr), J1928+1746 (=52.931, b=0.114, DM=176.68 pc/cm3, d=4 kpc, = 8.26104 yr), J1925+1720 (=52.179, b=0.59, DM=223.3 pc/cm3, d=5.3 kpc, = 1.15 105 yr), J1922+1733 (=52.08, b=1.23, DM=238 pc/cm3, d=5.4 kpc, = 2.8105 yr). Pulsar J1924+1631 (=51.405, b=0.318, DM=518.5 pc/cm3, d=10 kpc, = 1.28105 yr), which has the largest DM among the young pulsars of this group, most probably belongs to the Perseus arm (see Table 15).
J1926+1648 has Vtrans = 463.064 km/s at d=6 kpc (d(kinematic) = 4-9 kpc, (Yao et al., 2017)) as displayed in ATNFPC. The transverse speed is more comparable to the average space velocity of pulsars (about 300 km/s) at our adopted distance of 4 kpc (see Table 15 and Figure 14).
There is only one Sagittarius arm source (Reid et al., 2014, 2019): G52.1+1.04 (IRAS 19213+1723) (d = 3.48 – 4.65 kpc, arm offset = 50 – 210 pc Wu et al. 2014,d = 5.62–6.58 kpc Wu et al. 2019).
All the pulsars with measured flux in this group are less luminous than the Crab pulsar.
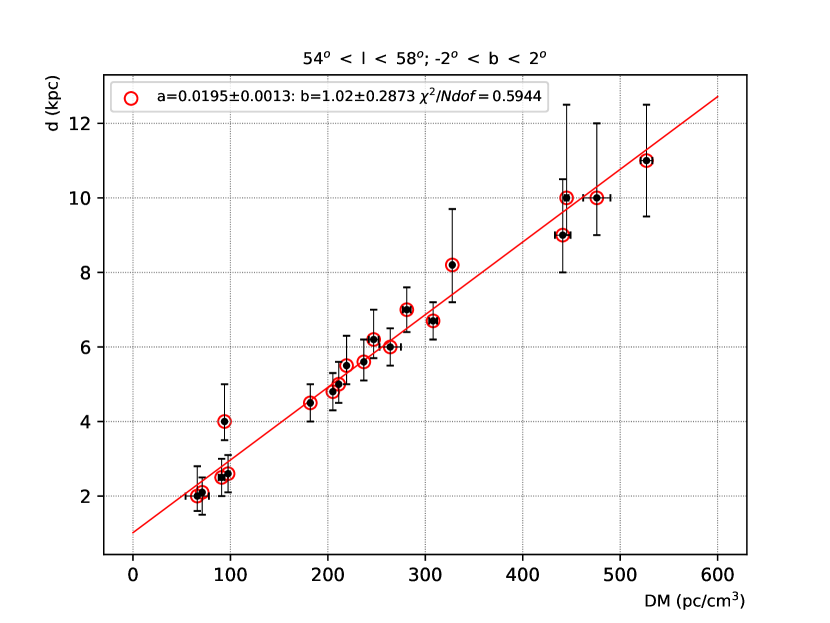
3.15 54 58; -2 2
There are 19 pulsars in this group, four of which are young and four of them have unknown (see Table 16). Very young (=2890 yr) pulsar J1930+1852 (DM=308 pc/cm3) connected to SNR G54.1+0.3 (d=6 kpc (Guseinov et al., 2003b), d(optical)=6.3 kpc Shan et al. 2018; Green 2019, d = 4.9 (HI abosorption) (Ranasinghe & Leahy, 2018; Green, 2019), d=8.2 kpc (association with CO) Lee et al. 2012; Green 2019), type is C? (i.e. possibly composite type SNR) in Green’s catalogue (Green, 2019)) is probably located at Sagittarius arm at 6.70.5 kpc. The other three young pulsars (all with 6.3104 yr) must also belong to the Sagittarius. The four young pulsars have significantly different adopted distances (about 2.5, 4.5, 5.5 and 6.7 kpc) due to the fact that their LOSs intersect the Sagittarius arm longitudinally (see Table 16).
PSR J1939+2134 (d(parallax) = 1.5 (Reardon et al., 2016b), d(parallax) 3.23, (Matthews et al., 2016)), Vtrans=6.755 km/s (d=3.5 kpc (ATNFPC)) has the Crab limits d3.1 kpc (S400), dCrab2.1 kpc (S1400). PSR J1939+2134 was the first ms pulsar observed (Backer et al., 1982), and it is currently the second fastest spinning pulsar known (Reardon et al., 2016b) with Vradial=89.16 km/s (Matthews et al., 2016) which is isolated due to the disruption during the core-collapse SN).
For the ms recycled pulsar J1939+2134, we adopted d=1.5-2.5 kpc (see Figure 15 and Table 16) making it slightly less luminous than the Crab pulsar at 400 MHz and comparable to the Crab at 1400 MHz. In ATNFPC, d=3.5 kpc is given as the adopted distance in which case this old (recycled) ms pulsar must be more luminous than the Crab at both 400 MHz and 1400 MHz. As the luminosity of old ms pulsars are mostly much less than the Crab pulsar, d=3.5 kpc is probably an overestimated value.
Young pulsar J1932+2220 (=57.356, b= 1.554, DM=219.2 pc/cm3, d=5.5 kpc, = 3.98104 yr (ATNFPC)) has z=149 pc, is probably located at a deviated part of a SF from the Galactic plane (see Table 16).
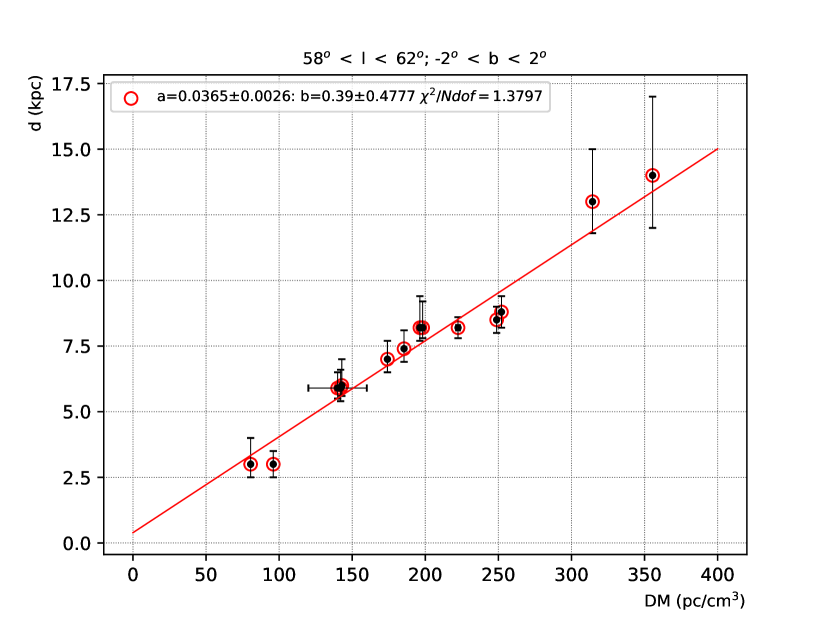
3.16 58 62; -2 2
Six of the 14 pulsars are young in this group with one unknown (see Table 17).
Young pulsar J1939+2449 (=60.174, b= 1.361, DM=142.88 pc/cm3, d=6 kpc, = 5.6105 yr) is probably located close to the far end of the Sagittarius arm in this direction. J1940+2245 (=58.629, b= 0.127, DM=222.4 pc/cm3, d=8.2 kpc, = 3.23105 yr), J1940+2337 (=59.397, b= 0.529, DM=252.1 pc/cm3, d=8.8 kpc, = 1.13105 yr) and J1948+2333 (=60.214, b= -1.045, DM=198.2 pc/cm3, d=8.2 kpc, = 6.17105 yr) are at or close to the Perseus arm. Distant young pulsars J1934+2352 (=58.966, b= 1.814, DM=355.5 pc/cm3, d=14 kpc, = 2.16104 yr) and J1941+2525 (=61.037, b= 1.263, DM=314.4 pc/cm3, d=13 kpc, = 2.27105 yr) (see Table 16) may belong to the Outer or Outer+1 arm despite their large distances from the Galactic plane (about 440 pc and 290 pc, respectively) as the HMSFRs close to these directions have large positive offsets from the Galactic plane (Hou & Han, 2014).
Although, the pulsars in this solid angle interval have large distances with respect to their DM values as compared to the previous groups, all of them are probably less luminous than the Crab pulsar.
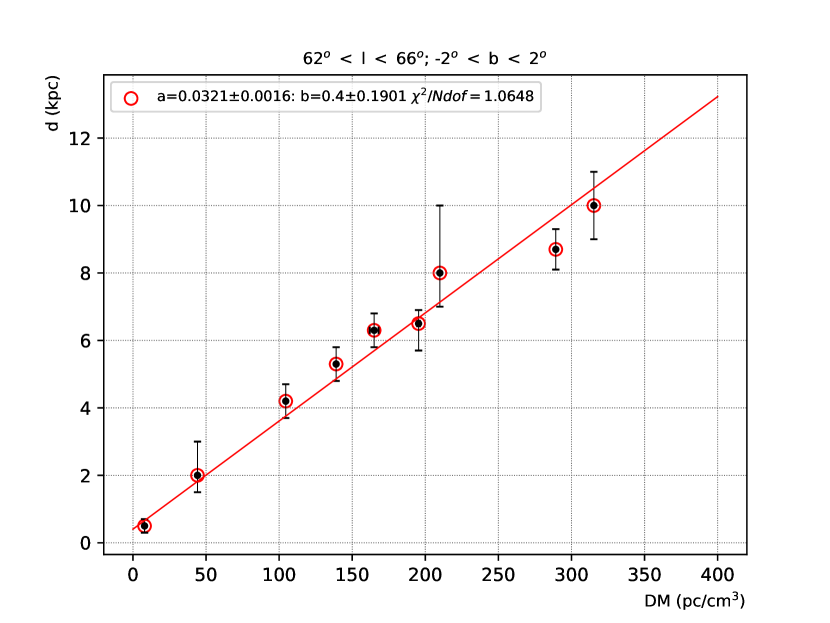
3.17 62 66; -2 2
There are 9 pulsars in this group two of which are young (see Table 18). The two young pulsars of this group, J1948+2551 (=62.207, b= 0.131, DM=289.27 pc/cm3, d=8.7 kpc, = 3.45105 yr) and J1946+2611 (=62.321, b= 0.595, DM=165 pc/cm3, d=6.3 kpc, = 3.14105 yr), are probably located at the Perseus arm and close to the Sagittarius arm, respectively, though J1946+2611 may be close to the Perseus arm.
Proper motions of four of the pulsars in this solid angle interval were measured. For three of these pulsars, the distances we have adopted are in agreement with the adopted distances displayed in ATNFPC. J1955+2908 is an old ms pulsar (P=6.133 ms, Ṗ=2.9710-20, = 3.27109 yr) which is most probably located at a smaller distance than the one adopted in ATNFPC (d=6.3 kpc) considering its DM as compared to the other members of this group and the Crab limit on its distance (d7.2 kpc) together with its large value. The transverse speeds at our adopted distances are reasonable (100-300 km/s).
All the pulsars in this group are probably less luminous than the Crab pulsar. Pulsar J1948+2551’s luminosity may be close to the Crab’s, considering the uncertainty in its luminosity.
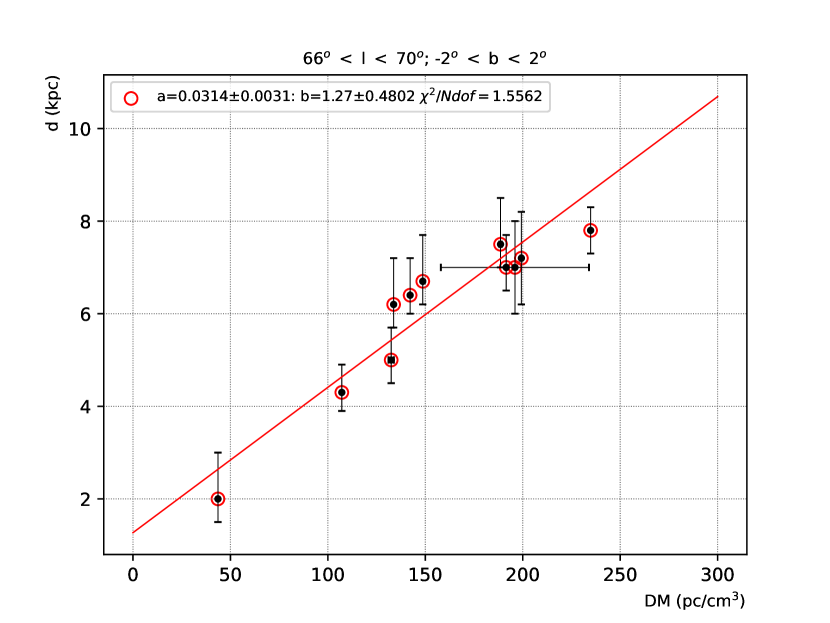
3.18 66 70; -2 2
At least four of the 11 pulsars in this interval are young ( is unknown for 5 pulsars (see Table 19)) that they must be located at or close to the Perseus and the Sagittarius arms based on their DM values. Pulsar J2002+30 of unknown may also be young considering its small latitude (b= -0.187) and the possible distance interval (6-8 kpc) making it a member of the Perseus arm.
There is a Local arm source (Reid et al., 2014, 2019): G69.54-0.97 (ON 1) (d = 2.39 – 2.54 kpc) which is not related to the pulsars in this group.
Pulsar J2004+3137, which has the largest DM in this group, is more luminous than the Crab pulsar up to a factor of about 2.2. This pulsar has a high transverse speed (about 400 km/s at d=7.8 kpc) as compared to the average space velocity of pulsars. Pulsar J2002+3217 is possibly as luminous as the Crab within the distance uncertainties.
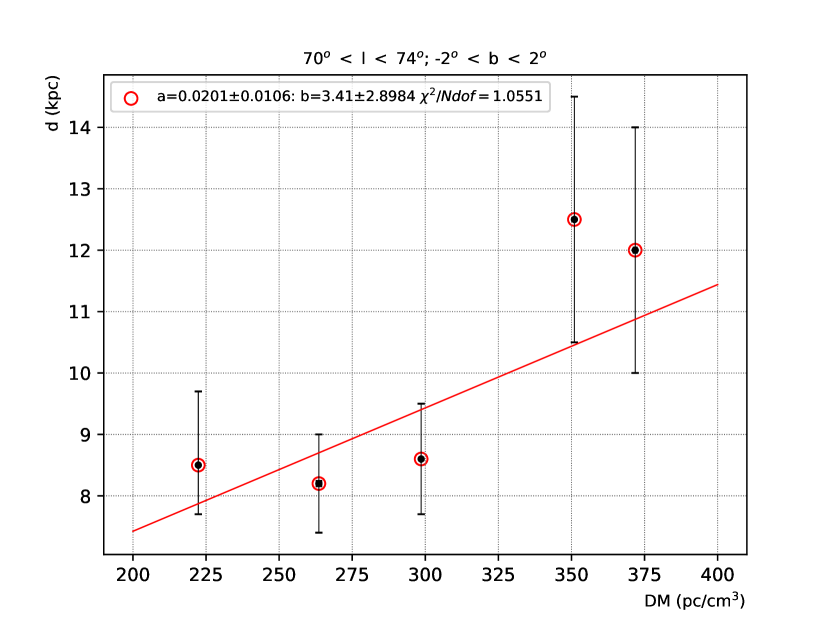
3.19 70 74; -2 2
There are 5 pulsars in this interval. The only young pulsar of this group, J2004+3429 (=71.425, b= 1.571, DM=351 pc/cm3, d=12.5 kpc, = 1.85104 yr) (see Table 20), must be located in a HMSFR, probably within the Outer arm or the possible Outer+1 arm (see e.g. Hou & Han 2014 for the possible structures of distant arms in these directions). The distance of this very young pulsar from the Galactic plane is 288 pc < z < 398 pc, based on the large latitude of this pulsar together with its large distance. This does not prevent this pulsar to locate in a HMSFR within a Galactic arm as there are several giant molecular clouds (GMCs) at about 11.5-13.5 kpc with large positive offsets from the Galactic plane (Hou & Han, 2014).
All the members of this group are less luminous than Crab pulsar, despite the fact that their adopted distances are large.
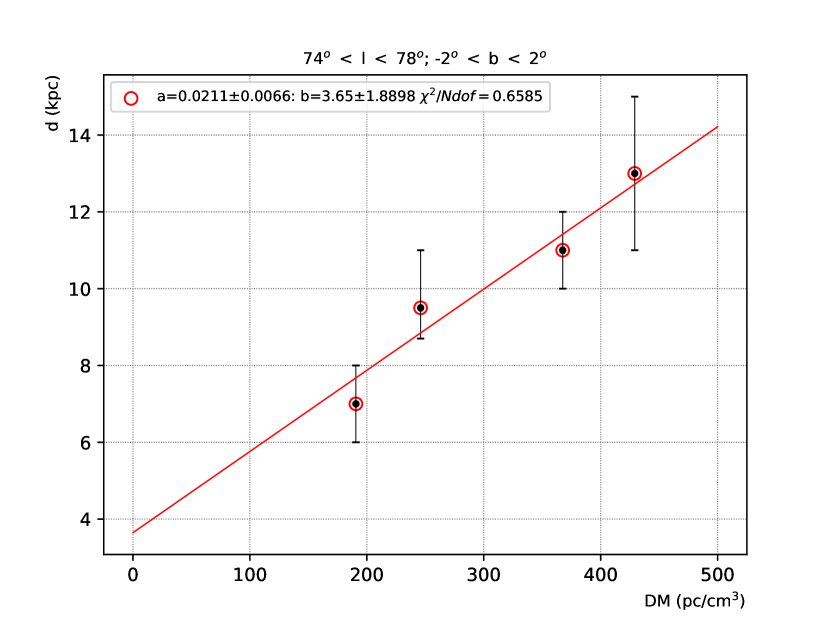
3.20 74 78; -2 2
There are four pulsars in the group, two of them are very young and one of them is young (see Table 21).
The Local arm sources are (Reid et al., 2014, 2019): G74.03-1.71 (d = 1.55 – 1.63 kpc Xu et al. (2013)); G75.76+0.33 (d = 3.26 – 3.8 kpc Xu et al. (2013)); G75.78+0.34 (ON 2N) (d = 3.41 – 4.02 kpc); G76.38-0.61 (d = 1.22 – 1.39 kpc Xu et al. (2013)). All these sources are foreground objects with respect to the pulsars in this interval. There is one Outer arm source: G75.29+1.32 (d = 8.8 – 9.7 kpc Sanna et al. 2012).
In the ATNFPC, d(kinematic, HI measurements)=1.8 kpc is given as the adopted distance for the very young pulsar J2021+3651 (=75.222, b= 0.111, DM=367.5 pc/cm3, d=11 kpc, = 1.72104 yr), which is a significantly underestimated value considering the large DM of this pulsar in this direction. PWN G75.2+0.1 is powered by J2021+3651 (Hessels et al., 2004). Abdo et al. (2013) give d=6-12 kpc for this pulsar. Kirichenko et al. (2015) give a distance of 1.8 kpc for J2021+3651 from X-ray and extinction-distance relation. Comparing the DM of this pulsar with the others in this interval and the neighbouring ones, also considering the possible location and structure of the Outer arm in this direction, we have adopted d=10-12 kpc for J2021+3651 (see Figure 20 and Table 21).
PSR J2022+3842 (=76.888, b= 0.96, DM=429.1 pc/cm3, d=13 kpc, = 8.94103 yr, z=218 pc) is another very young pulsar in this interval which has the largest DM among the four pulsars. This pulsar is probably connected to the C-type SNR G76.9+1.0 (d=103 Arumugasamy et al. 2014; Arzoumanian et al. 2011, d=12.6 kpc Guseinov et al. 2003b). We have adopted d=11-15 kpc (see Figure 20 and Table 21) taking into account the large latitude and the large DM of the pulsar together with the large positive offsets of the GMCs from the Galactic plane close to this direction at large distances (Hou & Han, 2014).
For the young pulsar J2030+3641 (=76.123, b= -1.438, DM=246 pc/cm3, d=9.5 kpc, = 4.88105 yr, z=-238 pc), Abdo et al. (2013) give d=31 kpc. As the latitude of this pulsar is relatively large and its DM is not so small to locate it at 3 kpc, we have adopted d=8.7-11 kpc (see Figure 20 and Table 21). Since this pulsar is below the Galactic plane, its transverse speed must be high at such large distances. Note that the adopted distance of J2030+3641 is 7 kpc in ATNFPC which leads to a similar conclusion.
All the three young pulsars of the group are possibly located at the Outer arm, though it may also be possible that J2030+3641 is closer to the Perseus arm and J2022+3842 is a member of the possible Outer+1 arm instead of the Outer arm.
Based on the Crab limit on their distances, three of the four pulsars should be less luminous than the Crab pulsar despite their large distances.
3.21 78 90; -2 2
78 82; -2 2
There is only one pulsar in this interval, namely J2032+4127 (=80.224, b= 1.028, DM=114.67 pc/cm3, d=1.4-1.7 kpc, = 2.01105 yr) (see Table 22). This young pulsar is a member of the OB-association Cygnus OB2 at d=1.4-1.7 kpc (Lyne et al., 2015).
There are several Local arm sources in this interval (Reid et al., 2014, 2019): G78.88+0.7 (AFGL 2591) (d = 3.23 – 3.45 kpc Rygl et al. 2012) ; G79.73+0.99 (IRAS 20290+4052) (d = 1.25 – 1.48 kpc Rygl et al. 2012); G79.87+1.17 (d = 1.55 – 1.69 kpc Xu et al. (2013)); G80.79-1.92 (NML Cyg) (d = 1.5 – 1.75 kpc Zhang et al. 2012); G80.86+0.38 (DR 20) (d = 1.38 – 1.55 kpc Rygl et al. 2012); G81.75+0.59 (DR 21) (d = 1.43 – 1.58 kpc Rygl et al. 2012); G81.87+0.78 (W 75N) (d = 1.23 – 1.37 kpc Rygl et al. 2012). Therefore, young pulsar J2032+4127 must be a member of the Local arm. Note that the DM-based distance in YMW17 model is 4.62 kpc, though a distance of 1.33 kpc is adopted for this pulsar in ATNFPC.
82 86; -2 2
There is no radio pulsar observed in this solid angle interval which is a surprising fact since the LOSs pass through both the Local arm, the Perseus arm and the Outer arm including several SFRs. The reason may partly be the large positive offsets of the HMSFRs from the Galactic plane and also the lack of pulsar surveys for these directions.
86 90; -2 2
There are two pulsars observed in this interval; J2113+4644 (=89.003, b= -1.266, DM=141.26 pc/cm3, d=1.9-2.6 kpc, = 2.25107 yr) which has the Crab limits on its distance d3.1 kpc (S400) and d1.7 kpc (S1400) and J2053+4650 (=86.861, b= 1.302, DM=98.0828 pc/cm3, = 1.16109 yr) (see Table 22). Since J2113+4644 is possibly a middle aged pulsar (106 yr < < 107 yr) with a negative latitude in this direction, its distance may be larger with respect to its DM. The kinematic distance from HI absorption measurements is d=41 kpc which is in accordance with the YMW17 model but the parallax measurement (Deller et al., 2019) was used for the adopted distance (d=2.2 kpc) in ATNFPC. This pulsar is probably located at 2.5-3 kpc with the luminosity on the same order of magnitude as Crab’s at both S400 and S1400.
4 Conclusions
Constructing distance vs DM relations is essential to determine the 3D distributions of both radio pulsars and the plasma in the Galaxy. In order to make such relations as reliable as possible, we have considered some basic criteria as presented above. Galactic distributions of the clouds and the plasma are still not well known as seen in the models on the Galactic structure. These models include significant differences with respect to each other in the locations, depths and widths of the arms even though the amount of observational data has greatly increased in recent years. This is the main factor for large uncertainties in the distances of many pulsars, especially the distant ones. Using the fact that young pulsars are located in or close to star formation regions helps to decrease these uncertainties by making comparisons. Consequently, these young pulsars are used as calibrators to improve the distance values of older ones in the same solid angle intervals.
The very large values of DM for some of the pulsars (in particular the magnetar J1745-2900) and smaller but still large DM for some other pulsars in the Galactic central directions suggest the existence of very high density plasma with possible ‘gaps‘ for the region around the Galactic center. There is no pulsar with measured DM in the interval 600-800 pc/cm3 in the central directions. The number of radio pulsars detected in these directions being surprisingly small strengthens the probability of the presence of large density plasma in the central region.
In Taylor-Cordes (Taylor & Cordes, 1993) (553 pulsars) and Cordes-Lazio (Cordes & Lazio, 2002, 2003) (1143 pulsars) models, there are biases leading to underestimation of the distances for some nearby pulsars and overestimation of the distances for some distant ones. This is true especially in the Taylor-Cordes model which is based on the arm structure introduced in Georgelin and Georgelin (1976). A significant fraction (134 out of 553) of the pulsars seem to be located outside the Galaxy (d30 kpc) according to the Taylor-Cordes model. Pulsars discussed in section 3.1 J1745-3040, J1740-3015 and J1752-2806 have underestimated distance values in ATNFPC (see Table 1). These distance values lead to an overestimation of the average free electron density for the region up to 0.4 kpc from the Sun in the central directions. The characteristic ages of these three pulsars are 5.46 yr, 2.06 yr, and 1.1 yr, respectively. Although they are young pulsars, with the ATNFPC adopted distances, these pulsars do not seem to be part of any Galactic arm, while with our adopted distances, J1740-3015 (d=2.8 kpc) is most probably located within the Scutum arm and the other two, J1752-2806 (d=1.3 kpc) and J1745-3040 (d=1.7 kpc) which have also similar RM values, are in or close to the Sagittarius arm. Our estimations on the distances of these pulsars based on comparisons with the other nearby and/or young pulsars in this group should give a more reliable average free electron density for the central directions up to about 3 kpc as well as better luminosity and space velocity values for these pulsars.
YMW17 electron distribution model (which is currently used as the default distance – DM model in ATNFPC) includes a large number of calibrator pulsars based on measurements of parallax, kinematic measurements, connections of pulsars to other sources and clusters. ATNFPC adopted distances are significantly different for some pulsars as compared to YMW17, especially the ones based on kinematic measurements. As the minimum and maximum limits on pulsar distances from kinematic measurements differ significantly in many cases, we do not use kinematic distances for the calibration of distance – DM relations in our model.
| Solid Angle Interval | n | err |
| 105/cm3 | 105/cm3 | |
| 358 2; -2 2(1) | 7.35 | 0.27 |
| 358 2; -2 2(2) | 9.90 | 4.80 |
| 358 2; -2 2(3) | 5.88 | 16.90 |
| 2 6; -2 2 | 8.00 | 0.70 |
| 6 10; -2 2 | 8.20 | 0.94 |
| 10 14; -2 2 | 8.26 | 0.96 |
| 14 18; -2 2 | 8.00 | 0.58 |
| 18 22; -2 2 | 7.87 | 0.62 |
| 22 26; -2 2 | 7.52 | 0.73 |
| 26 30; -2 2 | 7.25 | 0.37 |
| 30 34; -2 2 | 9.43 | 0.36 |
| 34 38; -2 2 | 8.85 | 0.47 |
| 38 42; -2 2 | 6.33 | 0.16 |
| 42 46; -2 2 | 5.62 | 0.19 |
| 46 50; -2 2 | 4.65 | 0.26 |
| 50 54; -2 2 | 5.15 | 0.24 |
| 54 58; -2 2 | 5.13 | 0.34 |
| 58 62; -2 2 | 2.74 | 0.19 |
| 62 66; -2 2 | 3.12 | 0.16 |
| 66 70; -2 2 | 3.18 | 0.31 |
| 70 74; -2 2 | 4.98 | 2.62 |
| 74 78; -2 2 | 4.74 | 1.48 |
Although, there are more than 8000 plasma regions observed up to date (see e.g. WISE catalogue 2021 Anderson et al. 2014), distribution of the HII regions in the Galaxy is highly uncertain and the density distributions within HII regions are unknown. Because of the lack of information on the contribution of each HII to DM and the large uncertainty in their distances, it is possible only to determine the average free electron density in different directions (see Table 2). In order to get the average densities of plasma, all the available data directly or indirectly related to the locations of radio pulsars, HII regions, SNRs and molecular clouds are taken into consideration in this work. Distance – DM relations for pulsars in solid angle intervals relate the distribution of pulsars to the distribution of plasma in each interval. Making comparisons between pulsars in each solid angle interval improves such relations. As the number of known radio pulsars and their observational data increased significantly in the last decade, it is now possible to get more reliable distance – DM relations in small solid angle intervals following the works by Guseinov et al. (2002, 2007).
Acknowledgements
This work was supported by TUBITAK through project no: 115F028.
Data Availability
The data underlying this article are available in the article.
References
- Abdo et al. (2013) Abdo A. A., et al., 2013, ApJS, 208, 17
- Allakhverdiev et al. (1997) Allakhverdiev A. O., Guseinov O. H., Tagieva S. O., Yusifov I. M., 1997, Astronomy Reports, 41, 257
- Anderson et al. (2014) Anderson L. D., Bania T. M., Balser D. S., Cunningham V., Wenger T. V., Johnstone B. M., Armentrout W. P., 2014, ApJS, 212, 1
- Ankay et al. (2016) Ankay A., Yazgan E., Kutukcu P., 2016, SerAJ, 193, 1
- Archibald et al. (2016) Archibald R. F., et al., 2016, ApJ, 819, L16
- Arumugasamy et al. (2014) Arumugasamy P., Pavlov G. G., Kargaltsev O., 2014, ApJ, 790, 103
- Arzoumanian et al. (2011) Arzoumanian Z., Gotthelf E. V., Ransom S. M., Safi-Harb S., Kothes R., Landecker T. L., 2011, ApJ, 739, 39
- Backer et al. (1982) Backer D. C., Kulkarni S. R., Heiles C., Davis M. M., Goss W. M., 1982, Nature, 300, 615
- Bagchi (2013) Bagchi M., 2013, IJMPD, 22, 1330021
- Bartkiewicz et al. (2008) Bartkiewicz A., Brunthaler A., Szymczak M., van Langevelde H. J., Reid M. J., 2008, ApJ, 490, 787
- Baumgardt et al. (2019) Baumgardt H., Hilker M., Sollima A., Bellini A., 2019, MNRAS, 482, 5138
- Bisnovatyi-Kogan & Komberg (1974) Bisnovatyi-Kogan G. S., Komberg B. V., 1974, SvA, 18, 217
- Bisnovatyi-Kogan & Komberg (1976) Bisnovatyi-Kogan G. S., Komberg B. V., 1976, PAZh, 2, 338
- Brunthaler et al. (2009) Brunthaler A., Reid M. J., Menten K. M., Zheng X. W., Moscadelli L., Xu Y., 2009, ApJ, 693, 424
- Camilo et al. (2002) Camilo F., Manchester R. N., Gaensler B. M., Lorimer D. R., 2002, ApJ, 579, L25
- Caswell et al. (1987) Caswell J. L., Kesteven M. J., Komesaroff M. M., Haynes R. F., Milne D. K., Stewart R. T., Wilson S. G., 1987, MNRAS, 225, 329
- Choi et al. (2014) Choi Y. K., Hachisuka K., Reid M. J., Xu Y., Brunthaler A., Menten K. M., Dame T. M., 2014, ApJ, 790, 99
- Cohn et al. (2002) Cohn H. N., Lugger P. M., Grindlay J. E., Edmonds P. D., 2002, ApJ, 571, 818
- Cordes & Lazio (2002) Cordes J. M., Lazio T. J. W., 2002, arXiv e-prints, pp astro–ph/0207156
- Cordes & Lazio (2003) Cordes J. M., Lazio T. J. W., 2003, arXiv e-prints, pp astro–ph/0301598
- Deller et al. (2019) Deller A. T., et al., 2019, ApJ, 875, 100
- Ding et al. (2020) Ding H., et al., 2020, MNRAS, 498, 3736
- Espinoza et al. (2011) Espinoza C. M., Lyne A. G., Kramer M., Manchester R. N., Kaspi V. M., 2011, ApJ, 741, L13
- Faucher-Giguère & Kaspi (2006) Faucher-Giguère C.-A., Kaspi V. M., 2006, ApJ, 643, 332
- Ferraro et al. (2009) Ferraro F. R., et al., 2009, Nature, 462, 1028
- Frail & Kulkarni (1991) Frail D., Kulkarni S., 1991, Nature, 352, 785
- Frail et al. (1994) Frail D. A., Kassim N. E., Weiler K. W., 1994, AJ, 107, 1120
- García et al. (2014) García P., Bronfman L., Nyman L.-Å., Dame T. M., Luna A., 2014, ApJS, 212, 2
- Georgelin & Georgelin (1976) Georgelin Y. M., Georgelin Y. P., 1976, A&A, 49, 57
- Green (2019) Green D. A., 2019, JApA, 40, 36
- Guseinov et al. (2002) Guseinov O. H., Yazgan E., Tagieva S., Yoldas A. K., 2002, arXiv preprint astro-ph/0207306
- Guseinov et al. (2003a) Guseinov O. H., Yazgan E., Tagieva S. O., Ozkan S., 2003a, Rev. Mex. Astron. Astrofis., 39, 267
- Guseinov et al. (2003b) Guseinov O. H., Ankay A., Tagieva S. O., 2003b, SerAJ, 167, 93
- Guseinov et al. (2004) Guseinov O. H., Ankay A., Tagieva S. O., 2004, IJMPD, 13, 1805
- Guseinov et al. (2007) Guseinov O. H., Yazgan E., Ankay A., 2007, Neutron Stars, Supernovae and Supernova Remnants. Nova Science Publishers, New York
- Hachisuka et al. (2015) Hachisuka K., Choi Y. K., Reid M. J., Brunthaler A., Menten K. M., Sanna A., Dame T. M., 2015, ApJ, 800, 2
- Hansen & Phinney (1997) Hansen B. M. S., Phinney E. S., 1997, MNRAS, 291, 569
- Harris (1996) Harris W. E., 1996, AJ, 112, 1487
- Hessels et al. (2004) Hessels J., Roberts M., Ransom S., Kaspi V., Romani R., Ng C.-Y., Freire P., Gaensler B., 2004, ApJ, 612, 389
- Hou & Han (2014) Hou L. G., Han J. L., 2014, A&A, 569, A125
- Hou et al. (2009) Hou L. G., Han J. L., Shi W. B., 2009, A&A, 499, 473
- Immer et al. (2013) Immer K., Reid M. J., Menten K. M., Brunthaler A., Dame T. M., 2013, A&A, 553, A117
- Jiang et al. (2013) Jiang L., Zhang C.-M., Tanni A., Zhao H.-H., 2013, IJMPS, 23, 95
- Katsuda et al. (2018) Katsuda S., et al., 2018, ApJ, 856, 18
- Kirichenko et al. (2015) Kirichenko A., et al., 2015, ApJ, 802, 17
- Kong et al. (2010) Kong A. K. H., Hui C. Y., Cheng K. S., 2010, ApJ, 712, L36
- Kurayama et al. (2011) Kurayama T., Nakagawa A., Sawada-Satoh S., Sato K., Honma M., Sunada K., Hirota T., Imai H., 2011, PASJ, 63, 513
- Lee et al. (2012) Lee J.-W., Koo B.-C., Lee J.-E., 2012, JKAS, 45, 117
- Lee et al. (2019) Lee Y.-H., Koo B.-C., Lee J.-J., Burton M. G., Ryder S., 2019, AJ, 157, 123
- Lipunov (1992) Lipunov V. M., 1992, Astrophysics of Neutron Stars. Springer-Verlag Berlin Heidelberg
- Lyne & Graham-Smith (2012) Lyne A., Graham-Smith F., 2012, Pulsar astronomy. No. 48, Cambridge University Press
- Lyne et al. (1996) Lyne A. G., Pritchard R. S., Graham-Smith F., Camilo F., 1996, Nature, 381, 497
- Lyne et al. (2015) Lyne A. G., Stappers B. W., Keith M. J., Ray P. S., Kerr M., Camilo F., Johnson T. J., 2015, MNRAS, 451, 581
- Manchester & Taylor (1977) Manchester R. N., Taylor J. H., 1977, Pulsars
- Manchester et al. (2005) Manchester R. N., Hobbs G. B., Teoh A., Hobbs M., 2005, AJ, 129, 1993
- Matthews et al. (2016) Matthews A. M., et al., 2016, ApJ, 818, 92
- Ortolani et al. (1996) Ortolani S., Barbuy B., Bica E., 1996, A&A, 308, 733
- Ortolani et al. (2001) Ortolani S., Barbuy B., Bica E., Renzini A., Zoccali M., Rich R. M., Cassisi S., 2001, A&A, 376, 878
- Ortolani et al. (2007) Ortolani S., Barbuy B., Bica E., Zoccali M., Renzini A., 2007, A&A, 470, 1043
- Petroff et al. (2013) Petroff E., Keith M. J., Johnston S., van Straten W., Shannon R. M., 2013, MNRAS, 435, 1610
- Ponti et al. (2015) Ponti G., et al., 2015, MNRAS, 453, 172
- Radhakrishnan et al. (1972) Radhakrishnan V., Goss W. M., Murray J. D., Brooks J. W., 1972, ApJS, 24, 49
- Ranasinghe & Leahy (2018) Ranasinghe S., Leahy D. A., 2018, AJ, 155, 204
- Reardon et al. (2016a) Reardon D. J., et al., 2016a, MNRAS, 455, 1751
- Reardon et al. (2016b) Reardon D. J., et al., 2016b, MNRAS, 455, 1751
- Reid et al. (2009) Reid M. J., Menten K. M., Zheng X. W., Brunthaler A., Xu Y., 2009, ApJ, 705, 1548
- Reid et al. (2014) Reid M. J., et al., 2014, ApJ, 783, 130
- Reid et al. (2019) Reid M. J., et al., 2019, ApJ, 885, 131
- Rygl et al. (2012) Rygl K. L. J., et al., 2012, A&A, 539, A79
- Sanna et al. (2009) Sanna A., Reid M. J., L M., Dame T. M., Menten K. M., Brunthaler A., Zheng X. W., Xu Y., 2009, ApJ, 706, 464
- Sanna et al. (2012) Sanna A., Reid M. J., Dame T. M., Menten K. M., Brunthaler A., Moscadelli L., Zheng X. W., Xu Y., 2012, ApJ, 745, 82
- Sanna et al. (2014) Sanna A., et al., 2014, ApJ, 781, 108
- Sato et al. (2010) Sato M., Hirota T., Reid M. J., Honma M., Kobayashi H., Iwadate K., Miyaji T., Shibata K. M., 2010, PASJ, 62, 287
- Sato et al. (2014) Sato M., et al., 2014, ApJ, 793, 72
- Schnitzeler et al. (2016) Schnitzeler D. H. F. M., Eatough R. P., Ferrière K., Kramer M., Lee K. J., Noutsos A., Shannon R. M., 2016, MNRAS, 459, 3005
- Shan et al. (2018) Shan S. S., Zhu H., Tian W. W., Zhang M. F., Zhang H. Y., Wu D., Yang A. Y., 2018, ApJS, 238, 35
- Taylor & Cordes (1993) Taylor J. H., Cordes J. M., 1993, ApJ, 411, 674
- Thorsett et al. (2002) Thorsett S. E., Brisken W. F., Goss W. M., 2002, ApJ, 573, L111
- Tian & Leahy (2008) Tian W. W., Leahy D. A., 2008, MNRAS, 391, L54
- Uchida et al. (1992) Uchida K., Morris M., Yusef-Zadeh F., 1992, AJ, 104, 1533
- Valenti et al. (2007) Valenti E., Ferraro F. R., Origlia L., 2007, AJ, 133, 1287
- Vallée (2014a) Vallée J. P., 2014a, AJ, 148, 5
- Vallée (2014b) Vallée J. P., 2014b, ApJS, 215, 1
- Vallée (2015) Vallée J. P., 2015, MNRAS, 450, 4277
- Velázquez et al. (2002) Velázquez P. F., Dubner G. M., Goss W. M., Green A. J., 2002, AJ, 124, 2145
- Verbunt et al. (2017) Verbunt F., Igoshev A., Cator E., 2017, A&A, 608, A57
- Wu et al. (2014) Wu Y. W., et al., 2014, A&A, 566, A17
- Wu et al. (2019) Wu Y. W., et al., 2019, ApJ, 874, 94
- Xu et al. (2009) Xu Y., Reid M. J., Menten K. M., Brunthaler A., Zheng X. W., Moscadelli L., 2009, ApJ, 693, 413
- Xu et al. (2011) Xu Y., Moscadelli L., Reid M. J., Menten K. M., Zhang B., Zheng X. W., Brunthaler A., 2011, ApJ, 733, 25
- Xu et al. (2013) Xu Y., et al., 2013, ApJ, 769, 15
- Yao et al. (2017) Yao J. M., Manchester R. N., Wang N., 2017, ApJ, 835, 29
- Yazgan et al. (2007) Yazgan E., Guseinov O. H., Tagieva S., 2007, in Lowry J., ed., , Trends in Pulsar Research. Nova Science Publishers, pp 1–24
- Zhang et al. (2009) Zhang B., Zheng X. W., Reid M. J., Menten K. M., Xu Y., Moscadelli L., Brunthaler A., 2009, ApJ, 693, 419
- Zhang et al. (2012) Zhang B., Reid M. J., Menten K. M., Zheng X. W., Brunthaler A., 2012, A&A, 544, A42
- Zhang et al. (2013) Zhang B., Reid M., Menten K., Zheng X., Brunthaler A., Dame T., Xu Y., 2013, ApJ, 775, 79
- Zhang et al. (2014) Zhang B., et al., 2014, ApJ, 781, 89
Appendix A Figures and Tables
Figures and tables for distance-DM relations in the solid angle interval 2 90; -2 2 are given in this section.
Data from ATNFPC Adopted and Calculated Data in this Study PSR b DM err RM err RM/DM d err dCrab z degree degree pc/cm3 pc/cm3 rad/m2 rad/m2 Myr kpc kpc kpc pc J1755-2725 2.432 -1.135 115 5 - - 302 - 2.2 +0.4, -0.3 11 -44 J1750-2536 3.413 0.778 178.4 0.01 - - - - 3 +0.4, -0.3 12 41 J1757-2421 5.281 0.054 179.454 0.011 16 5.0 0.285 0.09 3 0.3 10.5†, 2.8 3 J1748-2444 3.955 1.564 207.33 0.09 - - 63 - 3.4 1.3 13 93 J1758-2540 4.263 -0.807 218.2 1.3 -207 9.3 21.5 -0.95 3.4 0.4 9 -48 J1748-2446A 3.836 1.696 242.15 0.04 - - - - 5 +2.0, -1 10 148 J1755-2521 4.255 -0.15 252 4 34.6 6.8 0.207 0.14 3.5 0.4 9 -9 J1805-2447 5.807 -1.725 269 3 - - 1800 - 4.2 1.5 14 -126 J1801-2451 5.254 -0.882 291.55 0.05 605.7 0.5 0.0155 2.08 4.5 0.5 16.8†, 6.2 -69 J1758-2630 3.555 -1.225 328 3 - - 3.69 - 5.5 1.7 12 -118 J1750-2444 4.136 1.255 331 4 - - 54 - 5 1.6 14 110 J1757-27 2.4 -1.721 334 0.1 - - 1330 - 5.1 1.6 28 -153 J1749-2347 4.828 1.967 344 4 - - 5.72 - 5.5 1.7 21 189 J1756-2435 5.027 0.044 367.1 0.4 -130 7.0 37.3 -0.35 5 0.5 16.2†, 5.3 4 J1755-26 3.618 -0.333 405 4 - - 0.556 - 5.5 0.6 20 -32 J1749-2629 2.505 0.593 409 11 916 17.0 12.3 2.24 5.7 0.6 9 59 J1759-2549 4.261 -1.082 431 5 93 14 0.152 0.22 6.5 2.0 10 -123 J1750-2438 4.291 1.185 476 5 564 13.0 1.05 1.18 7.4 2.2 11 153 J1752-2410 4.93 1.039 508.3 0.9 -153 24.0 4.9 -0.3 7.5 2.2 11 136 J1756-2619 3.574 -0.891 534 2 - - 3.27 - 7.7 1.2 24 -120 J1751-2516 3.852 0.692 556 3 - - 2.37 - 8 2.4 16 97 J1747-2647 2.054 0.758 570 9 - - 0.599 - 8.2 2.2 6 108 J1755-2534 4.047 -0.229 590 3 - - 0.33 - 8.4 2.4 18 -34 J1753-2501 4.274 0.512 672 3 21 17 0.593 0.03 9 2.7 - 80 J1756-25 4.241 -0.342 706 8 - - - - 10 2.6 17 -60 J1802-2426 5.731 -0.886 711 6 74 13 1.05 0.1 10 3.0 10 -155 J1754-2422 4.947 0.618 738 6 - - 39.9 - 10.4 2.7 - 112 J1755-2550 3.799 -0.323 750.9 0.4 - - 2.05 - 10.6 2.7 17 -60 J1759-24 5.789 -0.156 772 14 - - - - 10.8 2.8 11 -29 J1755-25211 4.183 -0.016 835 5 - - 0.51 - 11.7 3.0 18 -3
Data from ATNFPC Adopted and Calculated Data in this Study PSR b DM err RM err RM/DM d err dCrab z degree degree pc/cm3 pc/cm3 rad/m2 rad/m2 Myr kpc kpc kpc pc J1756-2251 6.499 0.948 121.196 0.005 10 11.0 443 0.08 2.1 1.0 10 35 J1802-2124 8.382 0.611 149.6258 0.0006 286 14.0 2760 1.91 2.5 1.0 9 27 J1753-2240 6.299 1.663 158.6 0.4 - - 1550 - 2.6 1.0 19 75 J1759-2205 7.472 0.81 177.157 0.005 6 7.0 0.673 0.03 2.9 0.3 10.5†, 6.6 41 J1803-2137 8.395 0.146 233.99 0.05 -36.1 0.2 0.0158 -0.15 3.3 1.0 9.8†, 2.4 8 J1759-1956 9.366 1.845 236.4 1.9 - - 2.43 - 3.5 1.1 12 113 J1757-2223 7.029 0.97 239.3 0.4 -145.2 4.7 3.75 -0.61 3.5 1.1 8 59 J1800-2343 6.132 -0.118 280 40 - - - - 4 1.2 23† -8 J1759-1940 9.634 1.901 302.7 1 775 16.0 43.2 2.56 4.5 1.4 8 149 J1756-2225 6.835 1.237 329 1 - - 0.122 - 4.6 1.4 15 99 J1809-2109 9.415 -0.72 381.91 0.05 256 24.0 2.91 0.67 5.5 1.7 8 -69 J1801-2154 7.838 0.554 386 1 160 40.0 0.371 0.41 5.4 1.5 16 52 J1804-2228 7.722 -0.397 424 7 - - 63.1 - 5.5 1.7 17 -38 J1812-20 9.954 -1.321 457 19 - - 126 - 6.4 2.0 - -146 J1813-2113 9.853 -1.656 462.3 1.5 417.9 8.2 3.25 0.9 6.5 2.0 10 -188 J1812-2102 9.859 -1.303 547.2 1 322.6 4.2 0.811 0.59 7.5 2.3 6 -171 J1808-2057 9.446 -0.4 606.8 0.9 93 11.0 0.852 0.15 8 2.4 5 -56 J1800-2114 8.306 1.073 641 18 - - 51.8 - 8.5 2.0 14 159 J1758-2206 7.378 0.933 678 4 - - 7.13 - 9 2.7 12 147 J1805-2037 9.449 0.307 708.1 1.6 - - 3.23 - 9 2.7 13 48 J1806-2125 8.811 -0.28 747 1 796 15.0 0.0647 1.07 10 3.0 8 -49 J1801-2115 8.446 0.794 778.8 0.1 - - 446 - 10 +2.5, -2.2 17 139 J1759-2307 6.593 0.275 812.6 1.5 743 11.0 2.35 0.91 11 3.3 9 53 J1759-2302 6.702 0.257 889 1 1575 13.0 1.2 1.77 12 3.6 7 54 J1805-2032 9.53 0.313 932.3 2 - - 0.766 - 12 3.6 9 66 J1801-2304 6.837 -0.066 1073.9 0.6 -1156 0.0583 -1.08 13.5 4.1 3 -16
Data from ATNFPC Adopted and Calculated Data in this Study PSR b DM err RM err RM/DM d err dCrab z degree degree pc/cm3 pc/cm3 rad/m2 rad/m2 Myr kpc kpc kpc pc J1809-1943 10.727 -0.158 178 5 76 1.0 0.031 0.43 3 0.3 9 -8 J1809-1917 11.094 0.08 197.1 0.4 41 17.0 0.0514 0.21 3.3 0.4 4 5 J1810-2005 10.545 -0.563 241 0.3 -15 14.0 3530 -0.06 4 0.5 6 -39 J1812-1718 13.109 0.538 255.1 1.8 70.6 1 0.28 4.2 0.5 7 39 J1801-1909 10.295 1.781 264 9 - - 25 - 5 1.0 11 155 J1803-1857 10.73 1.428 392 1.1 788.6 9.2 2.99 2.01 5.9 2.0 12 147 J1819-1717 13.991 -1.048 405 2 - - 1.8 - 5.8 1.7 15 -106 J1820-1818 13.202 -1.72 436 1.2 -70 12.0 52.5 -0.16 7.5 2.3 6 -225 J1803-1920 10.334 1.338 436.1 1.7 - - 21.3 - 8.2 2.1 14 191 J1810-1820 12.064 0.289 452.2 2.5 110.3 46.6 0.24 5.6 1.7 9 28 J1811-1736 12.821 0.435 476 5 - - 1830 - 5.9 1.8 7 45 J1801-1855 10.447 1.978 484 14 424 15.0 222 0.88 9.2 2.4 11 318 J1812-1733 12.904 0.387 518 4 342.6 2.8 8.68 0.66 6.3 1.9 3 43 J1817-1938 11.623 -1.617 519.6 0.01 - - 90.1 - 8.9 2.7 24 -251 J1816-1729 13.433 -0.424 525.5 0.7 82.9 4.1 1.71 0.16 6.5 2.0 7 -48 J1808-1726 12.599 1.188 536 7 - - 329 - 7.6 2.3 12 158 J1811-1717 13.041 0.686 545.5 0.01 - - 51.7 - 7.6 2.3 17 91 J1815-1910 11.81 -0.963 547.8 0.4 - - 0.546 - 7.8 2.3 13 -131 J1809-1850 11.473 0.316 598 13 - - 1.68 - 7.5 2.5 17 41 J1810-1709 13.051 0.956 670 20 - - 55.2 - 9.7 3.0 11 162 J1806-1920 10.641 0.802 683 7 1069 14.0 819 1.57 9.5 3.0 6 133 J1815-1738 13.179 -0.272 724.6 0.2 175 20.0 0.0404 0.24 9.2 2.8 12 -44 J1811-1835 11.909 0.049 761 11 -345 18.0 1.4 -0.45 9.5 2.9 12 8 J1814-1649 13.82 0.245 782 6 -857 12.0 2.4 -1.1 9.5 2.9 7 41 J1814-1744 13.021 -0.215 792 16 - - 0.0846 - 10.2 3.1 9 -38 J1809-2004 10.363 -0.202 867.1 1.7 - - 0.946 - 10.9 3.3 8 -38 J1812-1910 11.522 -0.456 892 5 - - 0.181 - 11.5 3.5 14 -92
Data from ATNFPC Adopted and Calculated Data in this Study PSR b DM err RM err RM/DM d err dCrab z degree degree pc/cm3 pc/cm3 rad/m2 rad/m2 Myr kpc kpc kpc pc J1819-1318 17.497 0.829 35.1 1.5 - - 40.2 - 0.8 0.2 19 12 J1819-17 14.146 -0.904 67 23.0 - - - - 1.5 0.4 20 -24 J1826-1419 17.398 -1.142 160 1.0 - - 1.39 - 3.3 1 - -66 J1819-1458 16.02 0.081 196 0.4 - - 0.12 - 3.5 0.5 - 5 J1818-1556 15.087 -0.227 230 4.0 - - 21.4 - 4.2 1.3 11 -17 J1825-1446 16.805 -1.001 352.23 0.04 -899 10.0 0.195 -2.55 5 1.5 4 -87 J1830-1414 17.839 -1.813 393.6 1.4 - - 160 - 5.8 1.7 24 -183 J1819-1510 15.876 -0.086 421.7 1.1 205 11.0 457 0.49 5.1 1.5 10 -8 J1824-1423 17.146 -0.796 428.3 1.1 -305.5 4.3 14.5 -0.71 6 1.8 8 -83 J1812-15 14.736 1.298 431 10.0 - - - - 6.1 2.0 - 138 J1826-1526 16.358 -1.553 530 4.0 246 15.0 5.58 0.46 7.5 2.3 11 -203 J1824-1350 17.614 -0.515 551 7.0 - - 36.5 - 7 2.1 26 -63 J1821-1432 16.628 -0.168 570 20.0 - - 5.65 - 6.9 2.1 16 -20 J1824-1500 16.512 -0.934 571 6.0 - - 8.62 - 7.6 2.3 19 -124 J1823-1526 16.033 -0.948 611 5.0 242.2 7.4 5.7 0.4 8.1 2.4 11 -134 J1818-1422 16.405 0.61 622 0.4 1173.9 7.3 2.27 1.89 8.1 2.4 2 86 J1816-1446 15.836 0.828 629 4.0 - - 7.1 - 8.3 2.5 16 120 J1818-1448 16.031 0.39 644 6.0 - - 0.725 - 7.9 2.4 17 54 J1822-1617 15.194 -1.189 647 19.0 - - 6.99 - 8.7 2.6 17 -181 J1822-1400 17.252 -0.176 651.1 0.9 897 15.0 3.75 1.38 7.8 2.3 8 -24 J1818-1541 15.27 -0.063 690 5.0 1097 14.0 0.902 1.59 8.3 2.5 7 -9 J1820-1529 15.681 -0.406 768.5 0.6 849 15.0 0.139 1.1 9.8 2.9 8 -69 J1820-1346 17.161 0.483 776.7 1.7 893 12.0 3.25 1.15 9.9 3.0 5 83 J1818-1519 15.55 0.192 845 6.0 1157 23.0 3.63 1.37 10.5 3.2 5 35 J1817-1511 15.595 0.391 970 5.0 - - 2.49 - 12.5 3.8 11 85 J1823-1347 17.488 -0.189 1044 6.0 - - 1.02 - 13.2 4.0 12 -44 J1819-1408 16.797 0.394 1075 41.0 1969 24.0 10.9 1.83 13.8 4.1 11 95 J1821-1419 16.815 -0.043 1123 16.0 - - 0.0293 - 14 4.2 17 -11
Data from ATNFPC Adopted and Calculated Data in this Study PSR b DM err RM err RM/DM d err dCrab z degree degree pc/cm3 pc/cm3 rad/m2 rad/m2 Myr kpc kpc kpc pc J1825-0935 21.449 1.324 19.3833 0.0009 65.2 0.2 0.233 3.36 1 0.2 7.8†, 2.3 23 J1835-1020 21.98 -1.302 113.7 0.9 142.8 3.2 0.81 1.26 2.6 0.8 5 -59 J1825-1108 20.047 0.641 121 19 - - 16.1 - 2 0.6 21 22 J1835-1106 21.222 -1.513 132.679 0.003 42.9 2.1 0.128 0.32 2.8 0.4 8.6†, 4.7 -74 J1830-1059 20.812 -0.478 159.7 0.01 47 5.0 0.107 0.29 2.9 0.5 32.4†, 6.1 -24 J1833-1034 21.501 -0.885 169.5 0.1 - - 0.00485 - 3.5 +1.0, -0.5 28 -54 J1830-10 21.036 -0.169 203 2 - - - - 3 0.9 24 -9 J1826-1334 18.001 -0.691 231 1 10 5.0 0.0214 0.04 3.5 0.5 3 -42 J1831-0952 21.897 -0.128 247 5 0.2 8.0 0.128 0.001 3.5 0.5 13 -8 J1828-1057 20.587 0.024 249 2 - - 0.189 - 3.5 0.5 13 1 J1830-1135 20.193 -0.59 257 6 249.4 7.8 2.06 0.97 4.4 1.3 7 -45 J1827-0934 21.724 0.841 259.2 0.5 -386 24.0 1.12 -1.49 4.5 1.4 14 66 J1828-1007 21.324 0.424 302.6 1.2 - - 3.96 - 4.5 1.4 16 33 J1819-1114 19.291 1.857 310 5 - - 8.23 - 5.4 1.6 7 175 J1826-1131 19.8 0.293 320.58 0.06 229 23.0 6.75 0.71 4.8 1.4 21†, 8.9 25 J1836-11 21.153 -1.768 326 8 - - - - 5.7 1.7 22 -176 J1831-1329 18.716 -1.884 338 5 374 4.8 11.5 1.11 5.9 1.8 11 -194 J1831-1223 19.618 -1.217 342 5 -41.3 4.3 8.27 -0.12 5.5 1.7 7 -117 J1834-1202 20.287 -1.743 342.4 1.3 -253 7.7 1430 -0.74 6 1.8 9 -182 J1823-1115 19.767 0.946 428.59 0.09 -354 10.0 3.22 -0.83 6.1 1.8 14.1†, 4.2 101 J1827-0958 21.286 0.798 430 4 -42 19.0 3.88 -0.1 7.6 2.3 5 106 J1824-1159 19.253 0.324 463.4 2.4 407 15.0 1.07 0.88 6.1 1.8 9 34 J1832-1021 21.587 -0.597 475.7 0.3 103.8 5.6 1.25 0.22 7.9 2.4 25.4†, 5.4 -82 J1828-1336 18.254 -1.243 494.7 1.8 - - 13.7 - 7.2 2.2 15 -156 J1830-1313 18.824 -1.49 537 3 - - 6.91 - 9 2.7 15 -234 J1833-1055 21.231 -1.14 543 4 42 9.5 19.1 0.08 8.4 2.5 11 -167 J1819-1131 19.101 1.619 578 13 - - 28.9 - 10 3.0 19 283 J1824-1118 19.809 0.741 603 2 213 17.0 1.94 0.35 8.1 2.4 7 105 J1828-1101 20.495 0.043 605 0.1 59.4 2.5 0.0772 0.1 7.3 2.2 5 5 J1823-1126 19.568 0.935 607 3 - - 0.801 - 8.6 2.6 10 140 J1829-1011 21.329 0.262 610 0.1 - - - - 7.8 2.3 15 36 J1822-1252 18.218 0.394 925 25 - - 0.387 - 12.3 3.7 15 85
Data from ATNFPC Adopted and Calculated Data in this Study PSR b DM err RM err RM/DM d err dCrab z degree degree pc/cm3 pc/cm3 rad/m2 rad/m2 Myr kpc kpc kpc pc J1832-0836 23.109 0.257 28.19422 0.00009 25 17.0 5210 0.89 1 0.5 7 4 J1839-0627 25.807 -0.266 88.5 0.7 - - 58.3 - 2.1 0.6 14 -10 J1842-0800 24.829 -1.766 188.6 0.01 - - 103 - 3.5 1.1 24 -108 J1835-0946 22.451 -0.999 193.3 0.5 - - 139 - 3.1 0.9 18 -54 J1843-0806 24.806 -1.934 215.8 0.9 167 15.0 0.49 0.77 4 1.2 12 -135 J1843-0702 25.741 -1.426 228.4 0.2 - - 1.42 - 4 1.2 14 -100 J1840-0815 24.314 -1.283 233.2 1.2 178.7 7.7 7.16 0.77 4 1.2 5 -90 J1831-0823 23.211 0.548 245.9 1.7 54.3 4.7 31.4 0.22 4.3 1.3 7 41 J1840-0840 24.01 -1.616 272 19 564.5 5.1 3.55 2.08 4.7 1.4 6 -133 J1835-0944 22.487 -0.989 276.2 0.1 236.2 9.0 0.525 0.86 4.5 1.4 10 -78 J1834-0731 24.288 0.366 294 0.9 92.6 8.5 0.14 0.31 4.7 1.4 7 30 J1832-0827 23.272 0.298 300.869 0.01 39 7.0 0.161 0.13 4.8 1.4 15.3†, 3.7 25 J1837-0653 25.191 0.002 316.1 0.4 -268.4 4.1 39.1 -0.85 5 1.5 4 0 J1829-0734 23.647 1.478 316.8 1.8 263 17.0 1.05 0.83 5.5 1.7 11 142 J1836-1008 22.263 -1.415 316.98 0.03 826.6 4.5 0.756 2.61 5.5 1.7 6.4†, 3.4 -136 J1843-0744 25.092 -1.68 321 5 - - 0.566 - 5.8 1.7 18 -170 J1839-0905 23.533 -1.591 344.5 0.3 - - 0.255 - 6 1.8 16 -167 J1840-0809 24.441 -1.308 349.8 0.8 262.6 2.5 6.44 0.75 6 1.8 5 -137 J1833-0559 25.514 1.321 353 6 - - 0.62 - 5.8 1.7 10 134 J1827-0750 23.176 1.803 381 9 -401.9 2.7 2.77 -1.05 7 2.1 4 220 J1833-0827 23.386 0.063 410.95 0.1 -470 7.0 0.147 -1.14 5.7 1.7 3 6 J1838-0624 25.792 -0.14 424 9 - - 190 - 5.5 1.7 19 -13 J1834-0602 25.64 0.965 445 4 380 11.0 4.23 0.85 6.6 2.0 8 111 J1835-0928 22.684 -0.774 450 0.1 - - 10.2 - 6.5 2.0 - -88 J1837-0604 25.96 0.265 459.3 0.3 320.8 4.2 0.0338 0.7 6.2 1.9 9 29 J1833-0556 25.623 1.232 461 13 - - 18.8 - 7 2.1 17 151 J1835-0643 25.093 0.552 467.9 0.4 44 15.0 0.12 0.09 6.5 2.0 5 63 J1835-0924 22.767 -0.804 471 7 - - 0.636 - 6.8 2.0 10 -95 J1840-0643 25.662 -0.567 494 0.1 - - 5910 - 6.6 2.0 7 -65 J1839-0643 25.547 -0.35 497.9 1.6 -2977 18.0 1.96 -5.98 6.5 2.0 6 -40 J1835-09242 22.739 -0.744 500 0.1 - - 315 - 7.2 2.2 - -93 J1837-0822 23.918 -0.772 506 0.1 - - 144 - 7.3 2.2 17 -98 J1834-09 22.789 -0.505 529 7 - - - - 7.3 2.2 18 -64 J1834-0742 24.151 0.223 552 18 - - 0.385 - 7.7 2.3 13 30 J1832-0644 24.806 1.07 578 7 226 11.0 0.318 0.39 9 2.7 9 168 J1840-0753 24.698 -1.242 691 7 - - 69.4 - 11 3.3 12 -238 J1834-0633 25.173 0.763 707 9 - - 8.32 - 11 3.3 14 146 J1840-0626 25.933 -0.461 748 8 - - 1.3 - 11 3.3 19 -89 J1835-0600 25.758 0.829 780 20 - - 4.18 - 12 3.5 - 174 J1835-0847 23.331 -0.548 850 0.1 - - 27.7 - 13 3.5 12 -124 J1834-0812 23.709 0.001 1020 50 - - 0.781 - 14 4.0 - 0.24
Data from ATNFPC Adopted and Calculated Data in this Study PSR b DM err RM err RM/DM d err dCrab z degree degree pc/cm3 pc/cm3 rad/m2 rad/m2 Myr kpc kpc kpc pc J1841-04 27.49 0.09 29 3 - - - - 0.7 0.2 - 1 J1849-0317 29.834 -1.173 42.9 2.8 -31.9 3.8 0.481 -0.74 1.5 0.5 9 -31 J1834-0426 27.042 1.749 79.308 0.008 100 5.0 63.9 1.26 2.3 0.5 5.3†, 3.3 70 J1844-0433 28.096 -0.548 123.158 0.02 7 13.0 4.01 0.06 2.4 +1.0,-0.5 16.5†, 7.1 -23 J1847-0402 28.876 -0.939 141.979 0.005 117 8.0 0.183 0.82 3.5 +0.5,-0.3 5.4†, 3.4 -57 J1842-0415 28.086 0.111 188 4 -90 15.0 0.38 -0.48 3.6 +0.4,-0.2 13 7 J1847-0427 28.487 -1.12 188.3 0.01 - - 696 - 4 0.5 - -78 J1841-0345 28.424 0.437 194.32 0.06 450.5 2.6 0.0559 2.32 3.8 +0.4,-0.2 7 29 J1839-0332 28.462 0.934 195.1 001 - - 8.91 - 4 0.5 - 65 J1842-0359 28.347 0.174 195.98 0.08 326 9.0 57.4 1.66 3.8 0.4 10.8†, 3.6 12 J1847-0605 27.048 -1.867 207.9 1.8 354 21.0 2.65 1.7 4.2 +1.0,-0.5 8 -137 J1841-0310 28.968 0.776 216 12 - - 78.3 - 3.8 +0.6,-0.3 19 51 J1847-0438 28.371 -1.268 229 4 57 22.0 1.39 0.25 4.8 1.0 11 -106 J1845-0434 28.193 -0.785 230.8 0.2 -248 10.0 0.681 -1.07 4 +0.8, -0.4 5 -55 J1836-0436 27.167 1.13 231.5 0.3 14.9 3.7 3.38 0.06 4.9 +1.6, -0.8 5 97 J1846-0257 29.707 -0.198 237 7 - - 0.442 - 4.4 0.5 - -15 J1839-0402 28.016 0.73 242 3 - - 1.07 - 4.1 +0.8,-0.4 16 52 J1839-0459 27.147 0.321 243 3 - - 2.8 - 4 0.5 14 22 J1843-0408 28.374 -0.172 246 3 - - 5.18 - 4.5 0.5 18 -14 J1843-0510 27.391 -0.52 257 0.1 - - 2.73 - 4.2 +0.5, -0.3 28 -38 J1835-0349 27.681 1.858 269.6 0.7 - - 4.36 - 5.4 1.2 19 175 J1838-0549 26.295 0.183 276.6 0.4 - - 0.112 - 4.5 +0.5, -0.3 12 14 J1841-0524 27.024 -0.333 284.5 0.3 - - 0.0302 - 4.8 +0.5, -0.3 17 -28 J1839-0436 27.407 0.654 292.7 1.8 - - 2.92 - 4.8 0.6 16 55 J1845-0545 27.15 -1.337 315.9 1.2 - - 1.29 - 6 +3.0, -1.5 11 -140 J1844-0502 27.67 -0.769 318 5 - - 86 - 5.2 0.6 12 -70 J1837-0559 26.001 0.379 319.5 0.6 169 15.0 0.963 0.53 5 0.5 10 33 J1840-0559 26.345 -0.281 321.7 1.4 - - 1.42 - 5.1 0.5 13 -25 J1841-0425 27.818 0.279 325.487 0.015 416 0.8 0.461 1.28 5.1 0.6 29.1†, 4.1 25 J1839-0223 29.5 1.461 330 0.1 - - 4.21 - 6 +1.5, -1 23 153 J1840-0445 27.486 0.203 379 0.1 - - 0.593 - 5 1.0 12 18 J1844-0538 27.073 -0.941 411.71 0.04 16 16.0 0.417 0.04 8 3.0 4 -131 J1845-0635 26.348 -1.603 414 1 - - 1.2 - 8 +4.0, -2 12 -224 J1848-0511 27.945 -1.659 418 7 208 15.0 2.93 0.5 8 +4.0, -2 12 -232 J1844-0244 29.727 0.235 429 3 123 23.0 0.481 0.29 5.6 1.0 7 23 J1843-0459 27.581 -0.505 444.1 0.5 349.9 8.1 14 0.79 6.2 1.3 5 -55 J1839-0321 28.601 1.095 452.6 0.3 - - 0.302 - 7.5 1.5 14 143 J1847-0443 28.318 -1.361 454.9 2 - - 191 - 8 +4.0, -2 19 -190 J1835-0522 26.296 1.164 456 4 - - 36.4 - 8 +5.0, -2 16 163 J1842-0612 26.413 -0.898 485 10 -341 11.0 407 -0.7 8.2 +4.0, -2 10 -129 J1845-0316 29.39 -0.255 500 0.14 -68 11.0 0.371 -0.14 6.8 1.4 13 -30 J1841-0500 27.323 -0.034 532 1 -3058 3.0 0.416 -5.75 6.5 1.5 - -4 J1844-0302 29.395 0.243 533 0.1 - - 2.43 - 7.2 1.5 22 31 J1836-0517 26.51 0.915 564 5 - - 5.56 - 10 +4.0, -3 19 160 J1838-0453 27.07 0.708 617.2 0.4 -76 12.0 0.0519 -0.12 10.5 3.0 12 130 J1844-0452 27.752 -0.576 626 4 - - 6.28 - 10.5 4.0 17 -106 J1843-0355 28.484 0.056 797.7 0.6 239.7 9.8 2.02 0.3 9 +5.0, -3 8 9 J1844-0256 29.574 0.119 826 2 - - - - 9.8 +4.4, -3.4 10 20 J1844-0310 29.343 0.036 836.1 0.5 287.1 4.4 0.813 0.34 10 +4.5, -3.5 10 6 J1842-0309 29.078 0.584 955 7 - - 1.42 - 12 +6.0, -4 15 122
Data from ATNFPC Adopted and Calculated Data in this Study PSR b DM err RM err RM/DM d err dCrab z degree degree pc/cm3 pc/cm3 rad/m2 rad/m2 Myr kpc kpc kpc pc J1851-0053 32.1 -0.318 24 4 -7 16.0 25.6 -0.29 0.55 0.15 8 -3 J1848-0023 32.267 0.447 30.6 0.1 - - 5.29 - 0.7 0.2 10 5 J1843-0000 32.013 1.768 101.5 0.8 -52.9 3.8 1.79 -0.52 3 +1.0, -0.5 4 93 J1846+0051 33.162 1.44 140 3 -60.1 8.1 0.613 -0.43 4 +1.0, -0.5 13 101 J1848-0123 31.339 0.039 159.531 0.008 580 30.0 1.99 3.64 3.5 0.5 5.3†, 2 2 J1850+0026 33.246 0.353 201.4 1.2 -5.4 6.1 47.7 -0.03 3.8 0.5 6 23 J1852+0008 33.198 -0.222 254.9 1.8 - - 1.31 - 4.3 0.5 13 -17 J1852-0118 31.868 -0.783 286 3 - - 4.07 - 5 0.5 13 -68 J1839-0141 30.014 1.965 293.2 0.6 - - 2.49 - 5 +2.0, -1.0 - 171 J1844+00 32.624 1.88 345.54 0.2 - - - - 6.5 1.5 3 213 J1851-0114 31.812 -0.527 427.2 1.4 - - 6.08 - 5.7 +1.0, -0.5 14 -52 J1852-0127 31.706 -0.802 431 3 - - 1.32 - 6 +1.5, -1.0 10 -84 J1842-0153 30.283 1.022 434 5 151 21.0 2.48 0.35 6 1.0 10 107 J1853-0004 33.086 -0.468 437.5 0.1 648.7 4.7 0.288 1.48 5.8 +1.0, -0.5 9 -47 J1843-0211 30.084 0.768 441.7 0.9 -84.9 3.0 2.22 -0.19 6.2 1.0 8 83 J1841-0157 30.099 1.216 475 3 118 16.0 0.581 0.25 6.5 1.0 8 138 J1843-0137 30.543 1.087 486 3 - - 4.3 - 6.8 1.1 15 129 J1843-0050 31.295 1.36 507 7 - - 49.7 - 7.2 1.2 15 171 J1851-0029 32.542 -0.335 510 20 - - 1.73 - 6 1.0 11 -35 J1851-0241 30.515 -1.186 515 5 - - 0.866 - 7.2 1.2 17 -149 J1854+00 33.224 -0.57 532.9 0.01 - - - - 7.2 +2.0, -1.0 - -72 J1852+0013 33.282 -0.174 545 3 - - 1.08 - 6.5 1.0 14 -20 J1853+0011 33.338 -0.371 568.8 1.6 - - 0.188 - 6.7 1.0 17 -43 J1850-0006 32.764 0.093 570 20 - - 8.04 - 6.5 1.0 8 11 J1844-0030 31.71 1.271 605 3 173 26.0 1.67 0.29 9 +1.5, -1.0 12 200 J1847-0130 31.147 0.167 667 6 - - 0.0833 - 7 1.0 13 20 J1852+0031 33.523 0.017 787 17 341 11.0 0.356 0.43 7 +1.5, -1.0 3 2 J1850-0031 32.369 -0.041 895 8 - - 9.21 - 7.5 +1.5, -1.0 16 -5 J1850-0026 32.407 0.066 947 5 - - 0.0675 - 7.8 +1.5, -1.0 6 9 J1848-0055 31.798 0.171 1166 7 - - 3.22 - 9.5 2.0 17 28 J1849-0040 32.075 0.198 1234.9 0.1 - - 0.956 - 10 2.0 17 35
Data from ATNFPC Adopted and Calculated Data in this Study PSR b DM err RM err RM/DM d err dCrab z degree degree pc/cm3 pc/cm3 rad/m2 rad/m2 Myr kpc kpc kpc pc J1857+0057 34.417 -0.805 82.39 0.11 104 19.0 104 1.26 2.4 +0.5, -0.3 21†, 7.8 -34 J1856+0113 34.56 -0.497 96.74 0.12 -140 30.0 0.0203 -1.45 2.8 0.3 25.4†, 17.2 -24 J1901+0156 35.818 -1.367 105.394 0.007 -122 9.0 1.94 -1.16 3.2 +0.5, -0.3 12.7†, 12 -76 J1850+0124 34.025 0.959 118.89 0.05 - - 5180 - 3 0.5 17 50 J1853+0056 34.017 -0.036 180.9 1.2 - - 0.204 - 3.8 0.3 16 -2 J1901+0254 36.643 -0.855 185 5 -121.7 8.5 45.2 -0.66 4 +0.5, -0.3 10 -60 J1854+0306 35.992 0.834 192.4 5.2 - - 0.498 - 4.2 +0.5, -0.3 - 61 J1900+0227 36.17 -0.925 201.1 1.7 -52 30.0 1.04 -0.26 4.3 +0.5, -0.3 13 -69 J1849+0127 34.034 1.043 207.3 2.6 -165 12.0 0.307 -0.8 4.6 +0.8, -0.5 11 84 J1903+0135 35.727 -1.955 245.167 0.006 72.3 1.0 2.87 0.29 5.4 +1.0, -0.5 6.2†, 3.2 -184 J1857+0143 35.168 -0.571 249 3 41.9 4.3 0.071 0.17 4.7 0.5 9 -47 J1900+0308 36.798 -0.658 249.898 0.011 - - 13200 - 4.8 0.5 24 -55 J1901+0300 36.811 -0.974 253.887 0.002 - - 2700 - 5.3 +0.6, -0.3 22 -90 J1902+0248 36.738 -1.249 272 0.1 - - 8.06 - 5.6 +0.7, -0.3 18 -122 J1853+0505 37.65 1.956 279 3 - - 11.2 - 6.4 +1.0, -0.5 7 218 J1902+02 35.917 -1.436 281.2 0.01 - - - - 6 +0.8, -0.3 - -150 J1858+0319 36.714 -0.094 284 3 - - 134 - 4.6 0.4 31 -8 J1853+03 35.78 1.02 290.2 0.01 - - - - 6 +0.7, -0.4 - 107 J1903+0327 37.336 -1.014 297.5245 0.0006 - - 1810 - 6.1 +0.7, -0.4 7 -108 J1901+0124 35.381 -1.677 314.4 1.3 354 5.5 1.56 1.13 6.7 +1.0, -0.5 14 -196 J1852+0305 35.804 1.16 320 12 264 15.0 206 0.83 6.5 +0.8, -0.4 8 132 J1858+0241 36.18 -0.43 336 15 - - 3.06 - 5.5 0.5 24 -41 J1856+0404 37.128 0.745 341.3 0.7 -141 20.0 180 -0.41 5.9 +0.7, -0.4 11 77 J1901+0413 37.806 -0.232 352 3 213.6 5.6 0.321 0.61 5.5 0.5 7 -22 J1858+0346 37.083 0.182 386 1 - - 1.99 - 5.7 0.5 17 18 J1901+0320 36.999 -0.613 393 7 - - 19.3 - 6.8 0.9 8 -73 J1901+0331 37.213 -0.637 402.08 0.012 -237.4 1.5 1.39 -0.59 7 1.0 3.6†, 3.6 -78 J1855+0307 36.167 0.533 402.5 1.9 69.2 4.6 0.74 0.17 6.8 +1.0, -0.8 8 63 J1854+0317 36.209 0.824 404 8 - - 11.7 - 7.1 +1.0, -0.8 22 102 J1901+0234 36.37 -1.048 404 3 - - 0.609 - 7.2 +1.2, -0.8 20 -132 J1851+0118 34.153 0.504 418 7 - - 0.105 - 7 1.0 24 62 J1859+00 34.401 -1.587 420 3 - - - - 8 2.0 3 -222 J1855+0422 37.314 1.052 438 6 - - 28.6 - 7.8 +1.5, -1.0 11 143 J1854+0319 36.179 0.944 480.2 13 - - 181 - 8.6 +2.0, -1.0 18 142 J1858+02 35.46 -0.547 492.1 0.01 - - - - 7.5 +1.5, -1.0 - -72 J1857+0212 35.617 -0.39 506.77 0.18 423 21.0 0.164 0.83 7.7 +1.5, -1.0 6 -52 J1850+0242 35.265 1.403 540.068 0.009 - - 437 - 12 +3.0, -2.0 - 294 J1901+0355 37.58 -0.444 547 3 - - 0.69 - 8 +1.5, -1.2 19 -62 J1853+04 36.671 1.476 549.3 1.3 - - - - 11.5 3.0 - 296 J1856+0102 34.428 -0.648 554 3 556.9 8.2 8.04 1.01 8.1 +2.0, -1.0 12 -92 J1851+0233 35.181 1.232 606 4 - - 2.5 - 13 +3.0, -2.5 26 280 J1856+0245 36.008 0.057 623.5 0.2 - - 0.0206 - 7 1.0 10 7 J1855+0306 36.175 0.483 634 6 - - 3.71 - 9 2.0 31 76 J1857+0300 36.274 0.072 691 4 - - 4.62 - 7.3 1.0 33 9 J1858+0215 35.725 -0.493 702 0.1 - - 2.56 - 10 2.5 16 -86 J1857+0210 35.586 -0.393 783 11 - - 0.712 - 11 3.0 14 -75 J1855+0205 35.281 0.007 867.3 0.2 - - 60.5 - 8 +1.5, -1.0 17 1
Data from ATNFPC Adopted and Calculated Data in this Study PSR b DM err RM err RM/DM d err dCrab z degree degree pc/cm3 pc/cm3 rad/m2 rad/m2 Myr kpc kpc kpc pc J1908+0734 41.585 -0.27 11.104 0.011 -19 18.0 4.08 -1.71 0.7 0.2 25.1†, 10.2 -3 J1905+0400 38.095 -1.289 25.6923 0.0012 - - 12200 - 1.1 0.2 33 -25 J1909+0641 40.941 -0.94 36.7 0.2 - - 3.65 - 1.3 0.2 22 -21 J1907+0602 40.182 -0.894 82.1 1.1 - - 0.0195 - 2.2 +0.5, -0.4 128 -34 J1901+0621 39.687 0.756 94 7 -229 13.0 732 -2.44 2.5 0.5 11 33 J1906+0509 39.291 -1.083 99.5 1.9 - - 1.21 - 2.8 0.5 60.5†, 18.1 -53 J1902+0723 40.742 0.984 105 0.3 -272 30.0 36.8 -2.59 3 0.5 18 52 J1910+0714 41.52 -0.87 124.06 0.05 158 12.0 7.02 1.27 3.5 0.5 20.2†, 12.5 -53 J1913+0657 41.644 -1.712 142 3 - - 7.04 - 5 0.5 33 -149 J1906+0454 39.045 1.167 142.793 0.002 - - 11100 - 4 0.5 36 -81 J1913+0618 41.034 -1.96 155.987 0.003 - - 8290 - 6 0.5 31 -205 J1902+0556 39.501 0.21 177.486 0.013 -113 11.0 0.919 -0.64 4 0.5 12.1†, 6.8 15 J1904+0451 38.806 -0.787 182.705 0.004 - - 16900 - 4.5 0.5 22 -62 J1904+0412 38.163 -0.988 185.9 0.7 - - 10200 - 5 +0.5, -0.8 16 -86 J1908+0500 39.293 -1.403 201.42 0.02 120.6 6.6 1.78 0.6 5 +0.5, -0.7 19†, 8.4 -122 J1906+0746 41.598 0.147 217.7508 0.0004 150 10.0 0.113 0.69 4.5 0.5 49.4†, 10.1 12 J1914+0659 41.785 -1.846 225.3 0.2 - - 9460 - 5 0.5 13 -161 J1907+0731 41.5 -0.211 239.8 1.3 - - 0.313 - 4.8 0.5 13 -18 J1905+0709 40.944 0.065 245.34 0.1 272.7 4.4 2.08 1.11 4.9 0.5 5 6 J1906+0649 40.69 -0.152 249 4 -15.9 9.7 134 -0.06 5 0.5 14 -13 J1901+0716 40.569 1.056 252.81 0.07 282 13.0 4.46 1.12 5.5 0.5 23.7†, 7.9 101 J1905+0616 40.069 -0.169 256.05 0.01 136.5 6.1 0.116 0.53 5 0.5 66.3†, 10.5 -15 J1859+0601 39.245 0.903 276 7 - - 0.649 - 5.8 0.6 14 91 J1904+0738 41.18 0.68 278.32 0.08 - - 8.06 - 5.8 +0.5, -0.7 16 69 J1910+0728 41.74 -0.772 283.7 0.4 550 11.0 0.621 1.94 5.8 0.6 8 -78 J1910+0517 39.838 -1.835 300 2 - - 6.68 - 6 0.6 11 -192 J1859+07 40.022 1.514 303 2 - - - - 5.9 0.6 - 156 J1907+0345 38.075 -1.796 311.7 0.9 426.9 4.6 0.463 1.37 6.2 +0.5, -0.7 18 -194 J1900+0634 39.808 0.995 323.4 1.8 - - 1.21 - 6.3 0.5 15 109 J1903+0654 40.502 0.388 329 7 - - 1.18 - 6.5 +0.5, -0.7 23 44 J1907+0740 41.613 -0.102 332 3 571 15.0 13.6 1.72 6.5 +0.5, -0.8 12 -12 J1906+0414 38.478 -1.51 349 9 787 9.8 1.44 2.26 6.8 1.7 16 -179 J1909+0616 40.62 -1.21 352 4 12 30.0 0.582 0.03 6.2 +0.8, -0.7 13 -131 J1908+0457 39.267 -1.468 360 5 929 3.0 13.7 2.58 7 0.5 8 -179 J1855+0527 38.227 1.642 362 3 - - 0.0826 - 7 0.5 15 201 J1859+0603 39.27 0.932 378.6 2 - - 5.07 - 6.7 0.5 19 109 J1905+0414 38.246 -1.079 383 1 - - - - 6.8 0.5 - -128 J1903+0601 39.65 0.109 388 3 176.2 6.2 0.309 0.45 6.4 0.5 15 12 J1901+0511 38.715 0.084 410 7 - - 2.88 - 6.1 0.5 33 9 J1907+0631 40.515 -0.484 428.6 1.8 - - 0.0113 - 7.5 +0.8, -0.5 15 -63 J1901+0510 38.737 0.025 429 7 1275 14.0 0.313 2.97 6.3 0.5 9 3 J1904+0800 41.498 0.863 438.8 1.3 769.6 11.0 0.241 1.75 7.9 +1, -0.5 12 119 J1907+05 39.156 -1.17 456.7 0.01 - - - - 9 1.2 - -184 J1857+0526 38.438 1.187 466.4 1.2 951.3 7.1 0.8 2.04 9 1.2 9 186 J1906+0641 40.604 -0.304 472.8 0.3 371.5 2.3 1.98 0.79 8 1.5 28†, 4.5 -42 J1903+0415 38.032 -0.628 473.5 0.01 - - - - 8.7 1.0 - -95 J1906+0725 41.188 0.162 480.4 0.01 - - - - 8 1.0 33 23 J1910+0534 40.056 -1.668 484 3 - - 3.73 - 10 +3.0, -2.0 12 -291 J1902+0615 39.814 0.336 502.9 0.017 552.6 5.9 1.38 1.1 8.5 1.5 10†, 5.9 50 J1907+0534 39.717 -0.988 524 4 - - 5.73 - 10 +3.0, -1.5 12 -172 J1909+0749 41.909 -0.34 539.36 0.05 - - 0.0247 - 9 2.0 16 -53 J1900+0438 38.067 0.169 627 6 - - 1.53 - 9.5 +2.0, 2.5 22 28 J1905+0600 39.838 -0.277 730.1 1.9 - - 6.28 - 11 2.5 12 -53 J1901+0435 38.167 -0.148 1042.6 1 - - 1.26 - 13 3.0 4 -34 J1901+0459 38.49 0.087 1108 4 - - 0.886 - 13.5 +3.5, -3.0 22 20
Data from ATNFPC Adopted and Calculated Data in this Study PSR b DM err RM err RM/DM d err dCrab z degree degree pc/cm3 pc/cm3 rad/m2 rad/m2 Myr kpc kpc kpc pc J1917+0834 43.575 -1.892 29.18 0.06 - - 1.93 - 1.2 +0.4, -0.2 70.7†, 13.4 -40 J1915+0738 42.466 -1.803 39 0.08 -6.8 1.5 7.39 -0.17 1.7 0.3 34†, 12.8 -53 J1916+0951 44.556 -1.019 60.953 0.006 97 1.0 1.7 1.59 2 0.3 10.5†, 5.9 -36 J1913+0904 43.502 -0.684 95.3 0.6 - - 0.147 - 3 0.5 12 -36 J1914+1122 45.623 0.199 100 10 360.9 7.2 14.5 3.61 2.9 +0.3, -0.5 44.7†, 10.1 10 J1915+0752 42.623 -1.614 105.3 0.3 211.3 2.6 235 2.01 3.5 +0.5, -0.3 36†, 16.3 -99 J1904+1011 43.433 1.865 135 2 -98.1 8.6 107 -0.73 4.5 +1.0, -0.5 22.4†, 9.8 146 J1912+1036 44.794 0.152 147 0.5 147.3 6.9 0.411 1 4 0.3 37.1†, 16 11 J1909+1102 44.832 0.992 149.982 0.004 540 20.0 1.7 3.6 4.5 0.5 6.6†,4.2 78 J1913+0936 44.034 -0.553 157 2 - - 45.6 - 4.3 0.4 52.4†, 20 -42 J1903+0925 42.743 1.543 162 6 - - 0.153 - 4.8 +0.5, -0.3 17 129 J1913+1011 44.485 -0.167 178.8 0.3 196 12.0 0.169 1.1 4.5 0.5 8 -13 J1907+0859 42.707 0.661 190 3 - - 4.36 - 5.2 0.5 28 60 J1909+1148 45.494 1.416 199.8 0.5 - - 98.1 - 6.5 +1.5, -1.0 25 161 J1907+1149 45.29 1.832 202.8 1.5 - - 0.141 - 6.7 +1.0, -0.5 19 214 J1913+1050 45.09 0.081 231.1 0.9 - - 15.4 - 5 0.5 31 7 J1915+1009 44.707 -0.651 241.693 0.01 430 0.6 0.42 1.78 7 0.5 9.8†, 5.3 -80 J1908+0916 43.173 0.361 249.8 0.5 - - 134 - 5.4 0.6 21†, 15.6 34 J1906+0912 42.84 0.884 265 5 - - 92.9 - 6.3 0.5 13 97 J1914+08 43.319 -1.045 285 0.1 - - - - 7.5 0.8 - -137 J1916+0852 43.674 -1.448 295 10 - - 2.64 - 9 1.0 21 -227 J1920+1040 45.784 -1.59 304 9 733 16.0 5.42 2.41 9.5 1.5 10 -264 J1916+1023 45.031 -0.79 329.8 0.1 402 23.0 37.7 1.22 7.5 +0.5, -0.7 12 -103 J1911+09 43.163 -0.207 334.7 0.01 - - - - 6.5 0.5 - -23 J1913+1102 45.25 0.194 338.96 0.02 - - 2690 - 6.5 0.5 53 22 J1916+0844 43.538 -1.493 339.4 0.8 582 12.0 2.4 1.71 10.3 1.5 11 -268 J1913+0832 42.98 -0.862 355.2 1 484.8 5.5 0.466 1.36 8.5 0.7 8 -128 J1907+0918 43.024 0.73 357.9 0.1 - - 0.038 - 8.5 0.5 74.2†, 16.7 108 J1915+0838 43.337 -1.295 358 3 421.5 3.2 3.46 1.18 9 +1.5, -1.0 14 -203 J1916+1030 45.099 -0.638 387.2 0.3 - - 293 - 8.5 1.0 16 -95 J1909+0912 43.164 0.258 421.5 1.7 253.3 7.9 0.0987 0.6 8.2 +0.6, -0.4 12 37 J1913+1000 44.285 -0.194 422 3 497 18.0 0.792 1.18 8.2 +0.6, -0.5 10 -28 J1905+0902 42.555 1.056 433.4 0.1 - - 0.988 - 11 +1.5, -1.2 24 203 J1911+10 44.05 0.256 446.2 0.01 - - - - 8.3 1.0 - 37 J1908+0909 42.972 0.494 467.5 1.5 - - 0.153 - 8.4 +0.8, -0.5 16 72 J1908+0839 42.56 0.229 512.1 2.4 - - 1.23 - 9 1.0 11 36 J1913+1103 45.208 0.306 628.9 0.01 - - - - 11 1.5 25 59 J1913+1145 45.92 0.476 637 2.2 940 18.0 0.967 1.48 11.5 +1.8, -1.5 11 96 J1908+0833 42.469 0.171 700.1 2 - - 4.08 - 11 1.5 17 33 J1910+1027 44.335 0.682 705.7 0.01 - - - - 14 +3.0, -1.5 31 167
Data from ATNFPC Adopted and Calculated Data in this Study PSR b DM err RM err RM/DM d err dCrab z degree degree pc/cm3 pc/cm3 rad/m2 rad/m2 Myr kpc kpc kpc pc J1918+1541 49.894 1.36 13 2 - - 2.31 - 1 1 0.2 52† 24 J1918+1444 49.096 0.866 27.202 0.017 -41.7 3.5 0.0881 -1.53 1.7 0.3 37.1†, 7.5 26 J1911+1347 47.518 1.809 30.9883 0.0009 - - 4330 - 2 0.3 26 63 J1910+1256 46.564 1.795 38.0684 0.0005 78 19.0 8160 2.05 2.5 +0.3, -0.5 11 78 J1921+1419 49.058 0.021 91.64 0.04 164.8 3.1 1.75 1.8 3.4 +0.4, -0.5 26.2†, 9.1 1 J1917+1353 48.26 0.624 94.538 0.004 233 8.0 0.428 2.46 3.5 0.5 7.2†, 2.9 38 J1913+1400 47.881 1.592 145.052 0.005 435 30.0 10.3 3 4.7 1.0 20.6†, 6.8 131 J1929+1357 49.633 -1.81 150.7 0.3 - - 3.75 - 5 1.0 5 -158 J1913+1330 47.421 1.381 175.64 0.06 - - 1.69 - 5.5 +1.5, -1.0 - 133 J1920+1110 46.152 -1.199 182 3 650 25.0 51.8 3.57 6 1.0 12 -126 J1930+14 49.764 -1.966 209.2 0.01 - - - - 7 +1.0, -1.2 37 -240 J1926+1434 49.923 -1.039 211.41 0.08 249.3 2.7 95.6 1.18 7 1.1 15.96†, 10.8 -127 J1916+1312 47.576 0.451 237.009 0.011 280 15.0 1.22 1.18 5.9 1.0 13.5†, 6.8 46 J1918+1310 47.65 0.209 247.4 0.01 - - - - 6 1.0 - 22 J1910+1231 46.205 1.591 258.64 0.12 978 15.0 2.78 3.78 8.6 1.5 21†, 14.1 239 J1916+1225 46.811 0.225 265.31 0.03 - - 0.154 - 6.2 1.0 24 24 J1915+1410 48.275 1.2 273.7 0.3 - - 96.3 - 8.8 1.5 20 184 J1922+1131 46.762 -1.601 335 3 - - 347 - 11 2.0 21 -307 J1915+1144 46.041 0.189 338.3 0.01 - - - - 7 +1.5, -1.0 26 23 J1919+1314 47.895 -0.088 613.4 0.2 - - 2.39 - 11.5 +2.5, -1.5 16 -18 J1915+1149 46.115 0.228 702.1 0.01 - - - - 15 +3.0, -2.0 - 60
Data from ATNFPC Adopted and Calculated Data in this Study PSR b DM err RM err RM/DM d err dCrab z degree degree pc/cm3 pc/cm3 rad/m2 rad/m2 Myr kpc kpc kpc pc J1929+16 51.747 -0.692 12 9 - - - - 0.8 0.2 - -10 J1926+1613 51.252 -0.06 32.9 0.01 - - - - 1.25 0.25 - -1 J1932+1756 53.464 -0.52 53.189 0.009 - - 1530 - 1.75 +0.65, -0.45 35 -16 J1935+1726 53.368 -1.374 61.6 0.1 - - - - 2 +0.7, -0.5 9 -48 J1927+1856 53.811 0.941 99 1 74.4 5.8 2.11 0.75 2.8 +0.7, -0.5 31.6†, 10.1 46 J1928+1443 50.178 -1.22 101 5 - - 76.3 - 2.8 +0.7, -0.5 18 -60 J1929+1844 53.852 0.461 112 2 - - 8.19 - 2.9 0.5 36† 23 J1931+1536 51.406 -1.599 140 1 199 10.0 0.993 1.42 3.8 +0.8, -0.5 42.8†, 12.5 -106 J1919+1745 51.897 1.987 142.3 0.2 - - 19.3 - 3.9 +1.0, -0.5 17 135 J1923+1706 51.707 0.965 142.5 0.6 380 220.0 202 2.67 3.6 +0.7, -0.5 38.3†, 11.7 61 J1933+1726 53.179 -1.021 156.9 0.03 - - 6950 - 3.8 +0.7, -0.5 37 -68 J1928+1746 52.931 0.114 176.68 0.05 320 14.0 0.0826 1.81 4 0.5 14 8 J1926+1648 51.859 0.063 176.885 0.011 - - 0.511 - 4 0.5 16.6†, 6.5 4 J1930+17 52.847 -0.481 201 27 - - - - 4.7 1.0 22 -39 J1921+16 50.494 0.896 204.7 0.01 - - - - 4.9 +0.7, -0.5 - 77 J1919+1645 50.954 1.642 208 9 - - 41.3 - 5 +1.0, -0.5 19 143 J1924+1639 51.422 0.562 208 3 - - 0.977 - 4.9 0.5 16 48 J1935+1745 53.691 -1.313 214.6 0.4 - - 27.4 - 5.1 +0.8, -0.5 41.1†, 18.7 -117 J1925+1720 52.179 0.59 223.3 1.5 - - 0.115 - 5.2 0.5 28 54 J1922+1733 52.08 1.23 238 4 - - 0.28 - 5.5 +0.8, -0.5 7 118 J1928+15 50.64 -1.03 242 0.1 - - - - 5.5 +0.7, -0.5 - -99 J1927+1852 53.718 0.956 254 1 417 70.0 65.9 1.64 5.7 +0.7, -0.5 25.4†, 11.3 95 J1925+19 53.697 1.412 328 16 - - - - 7.8 1.5 - 192 J1921+1544 50.35 0.609 385 2 - - 2.32 - 8 +1.5, -1.0 16 85 J1924+1631 51.405 0.318 518.5 0.9 - - 0.128 - 10 +1.2, -0.8 26 56 J1924+17 51.715 0.733 527.4 0.01 - - - - 10.6 +1.5, -1.2 - 136 J1924+1628 51.245 0.481 542.9 0.01 - - - - 10.6 +1.2, -1.0 25 89
Data from ATNFPC Adopted and Calculated Data in this Study PSR b DM err RM err RM/DM d err dCrab z degree degree pc/cm3 pc/cm3 rad/m2 rad/m2 Myr kpc kpc kpc pc J1929+2121 56.117 1.751 66 12 - - 5.36 - 2 +0.8, -0.4 16 61 J1939+2134 57.509 -0.29 71.0237 0.0013 7.73 0.1 235 0.11 2.1 +0.4, -0.6 3†, 2 -11 J1938+2213 57.903 0.308 91 3 - - 0.062 - 2.5 0.5 47†, 9.7 13 J1946+2052 57.657 -1.975 93.965 0.003 - - 292 - 4 +1.0, -0.5 30 -138 J1934+19 54.609 -0.397 97.6 0.01 - - - - 2.6 0.5 24 -18 J1935+2025 56.051 -0.053 182 1 - - 0.0209 - 4.5 0.5 11 -4 J1936+20 55.712 -0.323 205.1 0.01 - - - - 4.8 0.5 - -27 J1932+2020 55.575 0.639 211.151 0.011 10 6.0 1.01 0.05 5 +0.6, -0.5 8.7†, 6.8 56 J1932+2220 57.356 1.554 219.2 0.5 173 11.0 0.0398 0.79 5.5 +0.8, -0.5 16.8†, 6.8 149 J1938+2012 56.205 -0.764 236.909 0.005 - - 55600 - 5.6 +0.6, -0.5 53 -75 J1926+2016 54.851 1.802 247 5 - - 1.35 - 6.2 +0.8, -0.5 21 195 J1936+21 56.814 0.164 264 11 - - - - 6 0.5 - 17 J1929+1955 54.879 1.018 281 4 - - 1.6 - 7 0.6 12 124 J1930+1852 54.096 0.265 308 4 - - 0.00289 - 6.7 0.5 31 31 J1938+2010 56.115 -0.672 327.7 0.8 - - 3.2 - 8.2 +1.5, -1.0 23 -96 J1931+1952 55.134 0.451 441 8 - - 78.8 - 9 +1.5, -1.0 21 71 J1926+1928 54.158 1.407 445 2 - - 14.9 - 10 +2.5, -1.0 52† 246 J1928+1923 54.281 1.016 476 14 - - 2.04 - 10 +2.0, -1.0 9 177 J1929+19 54.173 0.568 527 6 - - - - 11 1.5 - 109
Data from ATNFPC Adopted and Calculated Data in this Study PSR b DM err RM err RM/DM d err dCrab z degree degree pc/cm3 pc/cm3 rad/m2 rad/m2 Myr kpc kpc kpc pc J1954+2407 61.367 -1.872 80.5 0.4 - - 2.9 - 3 +1.0, -0.5 24 -98 J1946+24 60.306 -0.376 96 0.1 - - - - 3 0.5 - -20 J1946+2244 59.301 -1.07 140 20 2 20.0 23.8 0.01 5.9 +0.6, -0.4 27†, 18 -110 J1950+2414 61.098 -1.169 142.0842 0.0031 - - 3630 - 5.9 +0.7, -0.5 22 -120 J1939+2449 60.174 1.361 142.88 0.07 76.2 1.1 0.56 0.53 6 +1.0, -0.4 27† 143 J1943+2210 58.439 -0.73 174.089 0.003 - - 9170 - 7 +0.7, -0.5 37 -89 J1944+2236 58.9 -0.663 185.45 0.12 - - 7680 - 7.4 +0.7, -0.5 24 -86 J1949+2306 59.931 -1.423 196.3 0.5 - - 170 - 8.2 +1.2, -0.5 24 -204 J1948+2333 60.214 -1.045 198.2 0.8 - - 0.617 - 8.2 +1.0, -0.4 14 -150 J1940+2245 58.629 0.127 222.4 1.3 - - 0.323 - 8.2 0.4 19 18 J1946+2535 61.809 0.283 248.81 0.04 - - 1.45 - 8.5 0.5 11 42 J1940+2337 59.397 0.529 252.1 0.3 - - 0.113 - 8.8 0.6 28 81 J1941+2525 61.037 1.263 314.4 0.4 - - 0.227 - 13 +2.0,-1.2 15 287 J1934+2352 58.966 1.814 355.5 0.2 - - 0.0216 - 14 +3.0, -2.0 30 443
Data from ATNFPC Adopted and Calculated Data in this Study PSR b DM err RM err RM/DM d err dCrab z degree degree pc/cm3 pc/cm3 rad/m2 rad/m2 Myr kpc kpc kpc pc J1954+2923 65.924 0.772 7.932 0.007 -18 3.0 3950 -2.27 0.5 0.2 18.3†, 2.6 7 J1957+2516 62.769 -1.973 44.137 0.003 - - 2290 - 2 +1.0, -0.5 53 -69 J1955+2908 65.839 0.443 104.5159 0.0006 22.4 8.8 3270 0.21 4.2 0.5 12.1†, 7.1 32 J1957+2831 65.524 -0.225 138.99 0.08 -43.7 1.8 1.57 -0.31 5.3 0.5 7 -21 J1946+2611 62.321 0.595 165 3 -88.7 1.7 0.314 -0.54 6.3 0.5 38.3†, 9 65 J1953+2732 64.205 0.059 195.4 0.9 - - 11.9 - 6.5 +0.4, -0.8 23 7 J1955+2527 62.74 -1.571 209.971 0.003 - - 8470 - 8 +2.0, -1.0 14 -219 J1948+2551 62.207 0.131 289.27 0.05 - - 0.345 - 8.7 0.6 9 20 J1952+2630 63.254 -0.376 315.338 0.002 - - 76.9 - 10 1.0 26 -66
Data from ATNFPC Adopted and Calculated Data in this Study PSR b DM err RM err RM/DM d err dCrab z degree degree pc/cm3 pc/cm3 rad/m2 rad/m2 Myr kpc kpc kpc pc J1953+30 66.57 1.306 43.61 0.11 - - - - 2 +1.0, -0.5 - 46 J2006+3102 68.667 -0.53 107.16 0.01 - - 0.104 - 4.3 +0.6, -0.4 14 -40 J2000+29 66.232 -0.478 132.5 1.4 - - - - 5 +0.7, -0.5 - -42 J2010+3051 68.967 -1.326 133.756 0.002 -64 15.0 15700 -0.48 6.2 +1.0, -0.5 24 -143 J2002+3217 69.261 0.879 142.21 0.03 -90.2 1.3 0.105 -0.63 6.4 +0.8, -0.4 20†, 6.8 98 J2013+3058 69.485 -1.886 148.7 0.1 - - 28.8 - 7 +1.0, -0.5 29 -221 J1952+30 66.184 1.529 188.6 0.6 - - - - 7.5 +1.0, -0.5 - 200 J2007+3120 69.042 -0.535 191.5 0.2 - - 0.618 - 7 +0.7, -0.5 21 -65 J2002+30 67.917 -0.187 196 38 - - - - 7 1.0 - -23 J1958+30 66.856 0.417 199.3 0.4 - - - - 7.2 1.0 - 52 J2004+3137 69.011 0.021 234.82 0.008 30 6.0 0.449 0.13 7.8 0.5 12.3†, 5.6 3
Data from ATNFPC Adopted and Calculated Data in this Study PSR b DM err RM err RM/DM d err dCrab z degree degree pc/cm3 pc/cm3 rad/m2 rad/m2 Myr kpc kpc kpc pc J2018+3431 73.044 -0.841 222.35 0.07 - - 3.34 - 8.5 +1.2, -0.8 15 -125 J2009+3326 71.103 0.124 263.6 0.8 - - 15.5 - 8.2 0.8 19 18 J2011+3331 71.32 -0.049 298.58 0.06 - - 8.27 - 8.6 0.9 12 -7 J2004+3429 71.425 1.571 351 0.1 - - 0.0185 - 12.5 2.0 23 343 J2010+3230 70.391 -0.495 371.8 0.5 - - 6.32 - 12 2.0 22 -104
Data from ATNFPC Adopted and Calculated Data in this Study PSR b DM err RM err RM/DM d err dCrab z degree degree pc/cm3 pc/cm3 rad/m2 rad/m2 Myr kpc kpc kpc pc J2029+3744 76.898 -0.727 190.66 0.03 -6 1.8 1.56 -0.03 7 1.0 11†, 9.7 -89 J2030+3641 76.123 -1.438 246 0.7 514 1.0 0.488 2.09 9.5 +1.5, -0.8 19 -238 J2021+3651 75.222 0.111 367.5 1 524 4.0 0.0172 1.43 11 1.0 24 21 J2022+3842 76.888 0.96 429.1 0.5 270 0.1 0.00894 0.63 13 2.0 - 218
Data from ATNFPC Adopted and Calculated Data in this Study PSR b DM err RM err RM/DM d err dCrab z degree degree pc/cm3 pc/cm3 rad/m2 rad/m2 Myr kpc kpc kpc pc J2053+4650 86.861 1.302 98.0828 0.0006 -174 11.0 1160 -1.77 - - - 39 J2032+4127 80.224 1.028 114.67 0.04 215 1.0 0.201 1.87 1.5 +0.2, -0.1 - 27 J2113+4644 89.003 -1.266 141.26 0.09 -218.7 0.1 22.5 -1.55 2.2⋆ +0.36, -0.32⋆ 3.1†, 1.7 -49