The Large Dispersion and Scattering of FRB 20190520B are Dominated by the Host Galaxy
Abstract
The repeating fast radio burst FRB 20190520B is localized to a galaxy at , much closer than expected given its dispersion measure . Here we assess implications of the large DM and scattering observed from FRB 20190520B for the host galaxy’s plasma properties. A sample of 75 bursts detected with the Five-hundred-meter Aperture Spherical radio Telescope shows scattering on two scales: a mean temporal delay ms, which is attributed to the host galaxy, and a mean scintillation bandwidth MHz, which is attributed to the Milky Way. Balmer line measurements for the host imply an H emission measure (galaxy frame) pc cm, implying of order the value inferred from the FRB DM budget, pc cm-3 for . Combining and yields a nominal constraint on the scattering amplification from the host galaxy , where describes turbulent density fluctuations and represents the geometric leverage to scattering that depends on the location of the scattering material. For a two-screen scattering geometry where arises from the host galaxy and from the Milky Way, the implied distance between the FRB source and dominant scattering material is pc. The host galaxy scattering and DM contributions support a novel technique for estimating FRB redshifts using the relation, and are consistent with previous findings that scattering of localized FRBs is largely dominated by plasma within host galaxies and the Milky Way.
1 Introduction
A substantial fraction of cosmic baryons is in the intergalactic medium (IGM), but they are notoriously difficult to measure with most cosmological observations. Fast radio bursts (FRBs) offer a promising new probe of this baryon content by measuring dispersive propagation delays caused by ionized media along the line of sight (LOS), including the IGM (Macquart et al., 2020). However the contribution to the dispersion measure (DM) from the host galaxies of FRB sources remains one of the largest sources of uncertainty in determining the cosmic baryon fraction of the IGM from FRBs. Recently, the repeating FRB 20190520B (hereafter FRB 190520) was discovered by Niu et al. (2021) with the Five-hundred-meter Aperture Spherical radio Telescope (FAST, Nan et al. 2011; Li et al. 2019) and found to have a large pc cm-3 but a relatively small redshift for its dwarf host galaxy, J160204.31111718.5 (hereafter referred to as HG190520). The large implied DM contributed by the host galaxy is an example where the uncertainty in estimating the DM contribution from the IGM is much larger than often assumed.
The vast majority of known FRBs do not have redshift measurements, and require an inventory of DM contributions from the Milky Way, intervening galaxies, and host galaxies in order to disentangle the DM contribution of the IGM and obtain redshift estimates. For FRB 190520, naive estimates of the DM budget without the host localization would place the source at a redshift , demonstrating the significant impact that underestimated host DMs can have on DM-derived distances. These results raise the question of whether the interstellar medium (ISM) of HG190520 contains an anomalously large electron density content, or whether other FRB host galaxy DMs are being systematically underestimated.
It has recently been demonstrated that a combined analysis of FRB scatter broadening along with DM can significantly improve redshift estimates (Cordes et al., 2021). Like dispersion, scattering can occur anywhere along the LOS, but it appears to be dominated by host galaxies, from which it is manifested as temporal broadening of bursts by a time , and more weakly by the disk of the Milky Way, as intensity variations with a characteristic frequency scale , often called the scintillation bandwidth.
Scattering from the ISM of the Milky Way is characterized using observations of the pulsar population, leading to the NE2001 Galactic electron density model (Cordes & Lazio, 2002) and YMW16 (Yao et al., 2017), and in this paper we use NE2001 when necessary. The measured burst scattering time from the host galaxy is used in tandem with the relation to improve the estimated DM contribution of the host galaxy and consequently a propagation-based redshift, . Moreover, combining DM and scattering constraints on the host galaxy ISM (or any other medium along the LOS, such as a galaxy halo) yields information about turbulence-driven density fluctuations in the ionized gas. The statistical properties of density fluctuations can be quantified using the fluctuation parameter , which is proportional to (Ocker et al., 2021, and references therein). It is parameterized as in the context of a medium comprising cloudlets with filling factor , internal and cloud-to-cloud variance quantified by and , and inner and outer scales .
Radio diagnostics are combined with optical imaging and Balmer line spectroscopy to determine or constrain the temperature of ionized gas, which can help discriminate between Milky Way type interstellar media from gas in extreme conditions in the local environment of FRB sources. As such, combining the DM and scattering budgets for a given FRB can not only bolster a redshift estimate for the host galaxy, but can also help characterize the host galaxy ISM, particularly when a host galaxy association yields complementary observations.
In this paper, we seek to distinguish large-scale properties of ionized gas in FRB 190520’s host galaxy using the average DM and scattering characteristics of 75 bursts detected by FAST between April and September 2020. Section 2 summarizes key observations of the FRB and provides measurements of the mean scattering time and scintillation bandwidth. In Section 3 the DM contribution of the host galaxy is interpreted in tandem with Balmer line measurements and the observed scattering, in order to infer properties of the host galaxy ISM. Section 4 demonstrates how the construction of a joint scattering-DM budget for this FRB improves its redshift estimation in the absence of a localization. Implications of these results for the plasma properties of HG190520 are discussed further in Section 5.
We use the following notation to refer to DM contributions from various LOS components: is the host galaxy DM contribution in the source frame; is the Milky Way contribution (which we occasionally separate into halo and disk components); and is the IGM contribution in the observer frame. Similar notation may be used for different LOS contributions to scattering. refers to the DM contribution of the host galaxy inferred from H emission.
2 Key Observations of FRB 190520
FRB 190520 was discovered in the Commensal Radio Astronomy FAST Survey (CRAFTS, Li et al. 2018) with the FAST telescope in drift-scan mode (Zhu et al., 2020). The four bursts initially discovered in 2019, along with 75 other bursts detected through follow-up tracking observations in 2020, are discussed by Niu et al. (2021), who report a mean pc cm-3. Radio imaging with the Karl G. Jansky Very Large Array (VLA) showed the presence of a compact, persistent radio source (PRS) spatially coincident with the burst source, with a flux density of Jy at 3 GHz. Follow-up observations at Green Bank Observatory have also revealed extreme rotation measure (RM) variations over a week-long timespan, indicative of a highly dynamic source environment (Anna-Thomas et al., 2022).
2.1 Optical Imaging and Spectroscopy
Localization of the FRB enabled optical and infrared observations with CFHT/MegaCam, Subaru/MOIRCS, Palomar/DBSP, and Keck/LRIS that revealed the FRB host to be a dwarf galaxy at a redshift . The optical spectrum obtained with Keck/LRIS shows H, H, Å, and Å (Niu et al., 2021) and will be discussed further in a separate paper (C.W. Tsai et al., in preparation).
The Milky Way extinction is estimated to be from the Schlafly & Finkbeiner (2011) Galactic dust extinction map, which yields assuming . After correction for Milky Way extinction, the H and H fluxes are erg cm-2 s-1 and erg cm-2 s-1. The H/H line ratio yields an estimate of the intrinsic extinction within the host galaxy equal to 0.8, implying an intrinsic H flux erg cm-2 s-1.
While the host galaxy was unresolved due to atmospheric seeing, we estimate the approximate host galaxy dimensions from the CFHT/MegaCam images to be about 0.5 by 0.5 arcseconds, yielding an H surface density Rayleighs (R) in the source frame, using . The error quoted on only accounts for the measurement error of , and does not include uncertainty in the size of the host galaxy. The source frame surface density implies an emission measure in the source frame (),
| (1) |
where is the temperature in units of K.
2.2 Time-frequency Structure of Radio Bursts
We present a detailed analysis of the 75 bursts detected with FAST in 2020 (Niu et al., 2021) that identifies temporal broadening of bursts from multipath propagation as well as frequency structure imposed on burst spectra. We attribute these to scattering in the host galaxy HG190520 and in the Milky Way, respectively, because the pulse broadening is too large to be caused by the IGM or by the halos of either galaxy and the observed frequency structure is consistent with expectations based on scintillation measurements of Galactic pulsars. Later we interpret pulse broadening and scintillation together to place an upper bound on the distance of the host scattering region from the FRB source and also to characterize the ISM of the host galaxy.
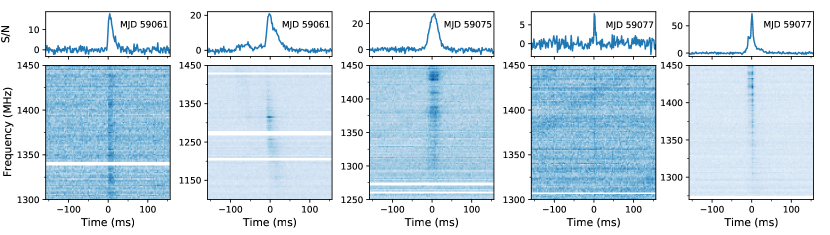
The dynamic spectra of five bursts from FRB 190520 are shown in Figure 1 for a 300 ms window centered on each burst and covering which is slightly different for each burst. Above each dynamic spectrum is the burst profile obtained by averaging over frequency. The bursts have been dedispersed with values of DM that maximize the temporal structure (as opposed to maximizing signal-to-noise ratio (S/N); Hessels et al. 2019). There are nominal DM variations pc cm-3 between observing epochs that are highly influenced by burst structure, and it is unclear whether these variations are related to density variations along the LOS or some other process. The average burst DM is (Niu et al., 2021). The FAST digital backend employed a polyphase filterbank that applied a Hamming window to the original voltage data, which were then downsampled to provide the frequency and time resolutions of 0.122 MHz and 96 , respectively. The combined effects of the Hamming window and downsampling yield a resolution function that we estimate to have a width approximately equal to MHz, which is added in quadrature to the downsampled resolution of 0.122 MHz to approximate the actual frequency resolution of the data for the scintillation bandwidth analysis.
The majority of the bursts from FRB 190520 discussed here were detected in the upper part of the FAST observing band, to GHz, in part because of their emitted spectral shapes but also because substantial radio frequency interference (RFI) between 1.1 and 1.3 GHz contaminated many of the observations. Three bursts had RFI covering more than of their visible bandwidth and were excluded from the sample, leaving 72 bursts in the following analysis.
The bursts in Figure 1 display intensity structure in time and frequency that varies substantially from burst to burst. Structure that is intrinsic to the emission process, which may include the drift of intensity islands to later times at lower frequencies (the so-called ‘sad trombone’ effect; e.g. Hessels et al. 2019), is modified by pulse broadening that varies strongly with frequency () and scintillation intensity frequency structure characterized by the scintillation bandwidth (). The spectral index is for a Kolmogorov electron density spectrum and for scales in the inertial range between the inner and outer scales. Very strong scattering causes scales smaller than the inner scale to dominate, giving , as will other forms of the density spectrum that are steeper than the Kolmogorov form.
2.2.1 Pulse Broadening Analysis
Burst profiles are the convolution of the emitted burst shape with a pulse broadening function (PBF), often taken to be a one-sided exponential , where is the Heaviside function (or unit step function). While pulsar observations indicate the relevance of non-exponential PBFs (e.g. from scattering by Kolmogorov-like density fluctuations distributed along the LOS), the exponential form suffices for our goals here, which require only a characteristic scattering time, .
Bursts in Figure 1 show varying degrees of asymmetry that ordinarily would be interpreted as scatter broadening if the broadening time follows the scaling. Burst (a) shows plausible scatter broadening whereas bursts (c), (d), and (e) do not. Burst (b) shows asymmetry but this may be due to drifting (sad-trombone) substructure, as the time-frequency drift of this burst is inconsistent with the scaling that would be expected from assuming an incorrect DM. Some of these differences may result from variations in the bursts’ spectra, with those more concentrated at higher frequencies expected to show smaller scattering times and vice versa. However, not all of the variations in asymmetry seen among the burst sample can be explained this way. Measurements of Galactic pulsars show much more consistency in asymmetries from scattering, implying either that the asymmetries evident in Figure 1 are not due to scattering or that the scattering varies substantially between bursts.
In the following we first demonstrate that the timescale for asymmetries visible in some of the bursts do in fact scale with frequency as expected from scattering (on average). We then characterize the apparent range of variability of between bursts.
To assess the presence of scattering, we analyze the shapes of bursts in the Fourier domain by calculating their power spectra . The advantage of this approach is that the spectrum is the product of the emitted burst spectrum and the PBF spectrum, so the shapes of these factors do not depend on the mean arrival time of the burst (owing to the shift theorem for Fourier analysis). Averaging bursts in the time domain, by contrast, would be strongly affected by frequency-time drifts that differ between bursts or burst components,
We compute 1D profiles for the sample of 72 bursts in three radio frequency subbands, GHz, GHz, and GHz, by averaging over frequency and calculating power spectra as the squared magnitude of the (FFT) of each profile. We use a larger bandwidth in the lowest radio frequency subband due to the low number of bursts with emission in this subband, and we omit the GHz band from all bursts due to strong RFI. The resulting power spectra are averaged over all bursts falling within a given subband: about 15 burst power spectra are averaged in the GHz subband and about 70 spectra in the upper two subbands.
Figure 2 shows the mean spectra for the three radio-frequency subbands plotted against fluctuation frequency (). We interpret their shapes using the product of the spectrum for an exponential PBF, with a Gaussian-shaped power spectrum, for an assumed Gaussian burst shape for emitted profiles using as the half-width at .
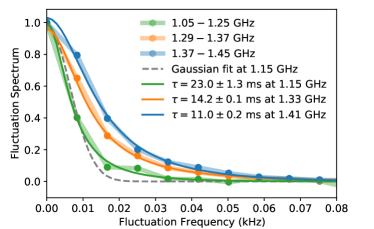
Figure 2 also shows the fit of the product to the mean burst power spectrum centered on 1.41 GHz, which yields ms and a full-width-at-half-maximum of the Gaussian component ms. An independent fit at 1.33 GHz yields ms and ms, and a fit at 1.15 GHz yields ms and ms. These three scattering times are consistent with a frequency scaling to within 1 standard deviation. The difference between the Gaussian FWHM fit within each subband is largely due to different bursts occupying different parts of the radio frequency band. A Gaussian pulse spectrum fit at 1.15 GHz is also shown in Figure 2 for comparison. A simultaneous fit to all three frequency subbands assuming yields ms at 1.41 GHz with a reduced chi-square . Assuming yields similar results, ms at 1.41 GHz with . Due to the slightly smaller we adopt the former value, ms at 1.41 GHz, as the mean scattering time for the remainder of our analysis.
Our scattering time estimates are about 80% larger than those in Niu et al. (2021), who report ms at 1.25 GHz, equivalent to ms at 1.41 GHz ( discrepancy). This scattering time was also based on a burst shape model comprising an exponential PBF convolved with a Gaussian function, but fitting was done in the time domain, rather than the frequency domain, on a smaller number of bursts that showed apparent scatter broadening. Another difference is that the fits were done on burst shapes obtained by integrating over the entire frequency range rather than in subbands. The observed tendency for this set of bursts to be stronger at higher frequencies in the FAST band, combined with the scaling, is likely to have resulted in smaller scattering times estimated from this procedure.
While the aggregate sample of bursts has a mean scattering time ms at 1.41 GHz, there is preliminary evidence that may fluctuate from burst to burst. While some bursts with show frequency-dependent temporal asymmetries consistent with scattering timescales ms at 1.4 GHz, two bursts in the sample are symmetric across the entire radio frequency band and have FWHM ms, suggesting that may vary by at least ms. However, many of the bursts have too low to distinguish between intrinsic spectral variations and scattering on an individual basis. A more detailed analysis and interpretation of these apparent scattering variations will be discussed in a separate paper.
2.2.2 Frequency Structure in Burst Spectra
Observed burst spectra consist of emitted spectral shapes modified by multipath propagation. Emitted bursts are consistent with amplitude modulated shot noise, where shots of ns duration determine the overall spectral shape while also, in concert with the modulations, inducing frequency structure with characteristic frequency scales equal to the reciprocals of characteristic burst widths (e.g. Nimmo et al., 2022, and references therein). Bursts with ms widths produce kHz structure, but MHz frequency scales can be produced if there is substructure on microsecond scales. We refer to this frequency structure as ‘self-noise’.
The spectral modulation from self-noise is 100% (i.e. RMS intensity = mean intensity). In this picture, drifting spectral islands are part of the amplitude modulation and modulated shots determine the center frequencies and spectral widths of the islands. An alternative view is that spectral islands are extrinsically produced by plasma lensing but the systematic trend for lower-frequency islands to arrive later is not naturally produced by lensing (e.g. Cordes et al., 2017).
Diffractive interstellar scintillation (DISS) from multipath scattering in the ISM of the Galaxy also produces 100% intensity variations vs. both time and frequency for a point source in the strong-scintillation regime (e.g. Rickett, 1990). The short durations of FRBs imply that DISS will only be identifiable in the frequency domain because scintillation timescales are generally much larger than burst durations. The characteristic frequency scale of DISS, the scintillation bandwidth , is typically estimated as the half-width-at-half-maximum (HWHM) of the intensity autocorrelation function (ACF). While self-noise and DISS share similar statistics, the strong, characteristic frequency dependence of from DISS resulting from scattering is likely distinct from that for self-noise frequency structure.
2.2.3 Scintillation Frequency Structure Analysis
Galactic DISS has been measured in a fairly small sample of FRBs thus far, including FRB 20110523A (Masui et al., 2015), FRB 20121102A (hereafter FRB 121102; Hessels et al. 2019), FRB 20180916B (Marcote et al., 2020), FRB 20200120E (Nimmo et al., 2022), and several FRBs in CHIME/FRB Catalog 1111https://www.chime-frb.ca/catalog (Schoen et al., 2021). Successful detection of Galactic DISS depends on two main factors: sufficient frequency resolution to resolve and small-enough extragalactic scattering so that the wavefronts incident on the Galaxy have sufficient spatial coherence.
At 1 GHz is generally predicted to be MHz using the NE2001 model (Cordes & Chatterjee, 2019, Figure 6) and for FRB 190520 (, ) the prediction is MHz. The frequency sampling of the FAST data MHz formally resolves this nominal DISS bandwidth but, as shown below, the measured is smaller than the predicted value, requiring special attention to the actual frequency resolution, which is slightly larger than . This resolution quenches the kHz frequency structure from self-noise but any burst substructure smaller than about s may contribute to burst spectra.
The spatial-coherence requirement implies that the angular diameter, and thus the scattering time , produced by extragalactic scattering is sufficiently small to allow fully modulated Galactic DISS to occur. The angular diameter depends on the distance of the extragalactic scattering screen from the FRB source, so the occurrence of DISS implies an upper bound on that distance (Section 3.3; Cordes & Chatterjee 2019).
Operationally, the scintillation bandwidth is estimated as the HWHM of the intensity ACF after due allowance for a narrow spike at zero lag from radiometer noise. For and a thin screen, the theoretical form for the ACF is Lorentzian (e.g. Gwinn et al., 1998),
| (2) |
where we have included an extra term to account approximately for the spectral window function used in the data acquisition, which synthesizes a polyphase filterbank that approximates a Hamming window.
Our analysis relies on the strong frequency dependence of to identify DISS. Similar to pulse broadening, most of the burst spectra discussed here lack sufficient S/N to fit for a scintillation bandwidth individually; instead, the burst ACFs are calculated within frequency subbands and then averaged to produce a mean ACF. We adopt slightly different subband divisions to calculate the scintillation bandwidth: GHz, GHz, and GHz; not only are these subbands generally free of RFI, but they also yield mean burst profiles that are contiguously sampled in frequency and subsequently have consistent lag spacing in the ACF, producing uniform sampling in the average ACFs.
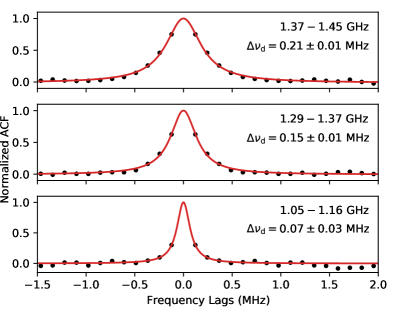
After each burst in the 72-burst sample is divided into subbands, the on-burst spectrum is averaged in time. A linear fit to the off-burst noise spectrum is subtracted from the on-burst spectrum before calculating the burst ACF. All burst ACFs with power in a given subband are then averaged within that subband to produce a single, mean ACF. The mean ACFs for each subband are shown in Figure 3, along with nonlinear least squares fits of the modified Lorentzian model. The zero-lag noise spike is excluded, and the amplitude of the Lorentzian is left as a free parameter within each subband.
We find MHz at 1.105 GHz, MHz at 1.33 GHz, and MHz at 1.41 GHz. Together these imply from a least-squares fit to the exponent, which is consistent with the frequency scaling expected for inertial-range Kolmogorov turbulence (), and re-scaling the best-fit value of at 1.41 GHz yields MHz at 1 GHz. Alternatively, fixing the spectral index to and fitting for across all three subbands simultaneously yields a best-fit value at 1 GHz. These fitting approaches are consistent with each other and with the scintillation bandwidth independently inferred from GBT observations at 5 GHz by Anna-Thomas et al. (2022), demonstrating that the estimated decorrelation bandwidths are consistent with DISS. Because the zero-lag noise spike in the ACF is large due to the generally low signal-to-noise ratios of the bursts and residual contributions from self-noise, we are unable to estimate the intensity modulation index reliably. Nonetheless, burst self-noise is not expected to be frequency dependent in the same way as DISS, so the lack of a constraint on the modulation index does not impact our interpretation of the ACF.
The scintillation bandwidth predicted by NE2001 along the FRB LOS is MHz at 1 GHz, almost 10 times larger than the measured value. While a number of FRBs with published scintillation bandwidths are broadly consistent with the NE2001 predictions (e.g. Ocker et al., 2021; Schoen et al., 2021), significant deviation from the NE2001 prediction has been observed in at least one other case, FRB 20201124A, and may be related to localized density structure that is not incorporated in the model (Main et al., 2022). Although FRB 190520 lies at a high Galactic latitude (), its longitude of suggests that extra ionized gas associated with the Galactic Center could induce more Galactic scattering (and hence a smaller ) than expected. Future calibration of electron density models may benefit from considering these discrepancies.
Recently, giant pulses (GPs) from pulsars have been proposed as physical analogs for FRBs due to shared characteristics, especially their short durations, spectral luminosities, and complex time-frequency structure (Cordes & Wasserman, 2016; Hessels et al., 2019). The association of the Galactic FRB 20200428 with a coincident X-ray burst from the magnetar SGR 1935+2154 (Bochenek et al., 2020) as well as the detection of radio-GP-like emission from the magnetar XTE J1810197 (Caleb et al., 2022) intriguingly suggests a link between GPs, magnetar bursts, and FRBs (Nimmo et al., 2022). Observations with high fractional bandwidth of the Crab pulsar revealed a banding effect in the spectra of GPs very similar to that seen in FRBs. The banding is intrinsic to the GP emission and shifts within the length of the scattering tail (Bij et al., 2021), and may be explained by highly relativistic plasma traveling outward from the light cylinder of the pulsar. Although the emission mechanisms of GPs and FRBs are likely not the same, if the FRB emission mechanism arises from highly relativistic plasma (as in some theoretical predictions; Lyutikov, 2021), such structure might be present in FRB spectra. While we do not find strong evidence for similar frequency banding in bursts from FRB 190520 that cannot be explained solely by scintillation, we note that the S/N of most bursts is insufficient to identify such an effect and that the fractional bandwidth of our data set is not large.
3 Properties of the Host Galaxy
Here we combine constraints on the dispersion measure of the host galaxy with the estimated emission measure and scattering measurements to deduce properties of the host galaxy ISM.
3.1 DM Inventory Analysis
We summarize briefly the analysis reported in Niu et al. (2021) that disentangles the contributions to DM from the MW, the IGM, and the host galaxy,
| (3) |
where we separately discuss the disk and halo components of the MW, , while we lump together all DM components of the host galaxy and define to be the dispersion measure in the galaxy frame (rather than observer’s frame). Our analysis follows that in Cordes et al. (2021):
-
1.
The NE2001 model is used to estimate and a % uncertainty is incorporated with a flat distribution;
-
2.
The MW halo contribution is modeled as a flat distribution in the interval ;
-
3.
The combined trapezoidal disk and halo distribution gives where the uncertainty is simply the RMS DM.
-
4.
The contribution from the IGM is estimated using a log-normal distribution with mean , and RMS where and
(4) Here for a flat CDM universe with a matter density and is the fraction of baryons in the ionized IGM, for a constant assumed value of the baryon density . Constants were evaluated from the Planck 2018 analysis (Planck Collaboration et al., 2020) implemented in Astropy (Astropy Collaboration et al., 2013, 2018).
-
5.
The posterior (PDF) for is calculated using a flat prior and by marginalizing over the distributions just described above. No uncertainties were included for the measured redshift or DM. We used a baryonic fraction as the best fit value found in Cordes et al. (2021), although we also varied between 0.4 and 1.2 in our analysis, where the case allows for the possibility that FRBs are found in overdense regions with an effective value of exceeding the true cosmological average.
The calculated posterior yields a median and 68% probable interval, (host frame) or in the observer’s frame. The corresponding IGM contribution is , which also includes uncertainties in the MW contribution along with cosmic variance of the IGM.
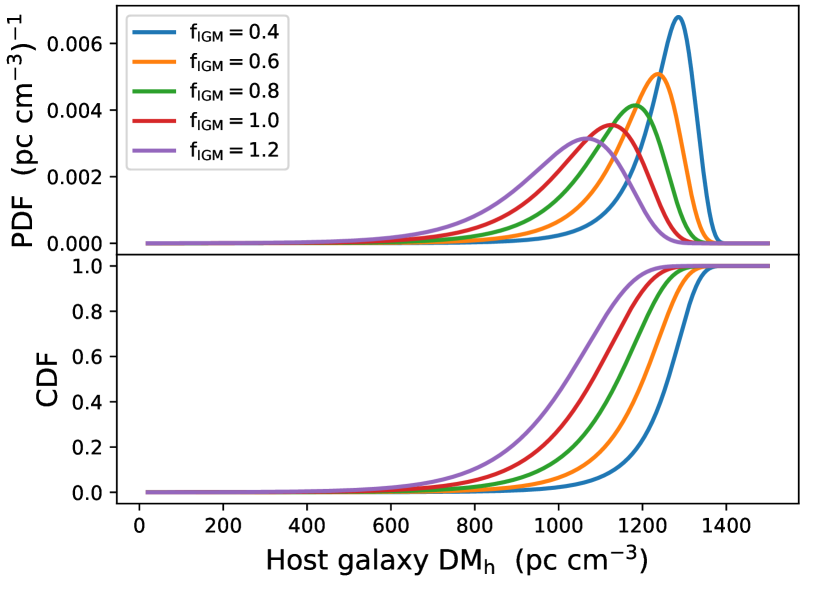
Figure 4 shows posterior PDFs and (CDFs) for for five values of that bracket the nominal value used to report our results. Even for the largest value of , the lower bound (84% probability) exceeds 850 (or 682 in the observer’s frame), far larger than the maximum of the probable range for the IGM contribution (413 ), again for .
3.2 Joint Likelihood Analysis of Dispersion Measure and Balmer Lines
The source-frame EM reported in §2.1 can be used to estimate a model-dependent DM from the host galaxy that probes the portion of the LOS along which H emitting gas is prevalent. A priori, the path length probed by the observed H may be longer than that probed by dispersed bursts if the FRB source is located partway through the H emitting gas; however, the H path length could instead be smaller if there are significant amounts of ionized gas that emit little H.
The equivalent DM contribution from H emitting gas is related to EM by
| (5) |
(Tendulkar et al., 2017; Ocker et al., 2020, and references therein), where , , and are parameters in the ionized cloudlet model that characterize cloud-to-cloud and intracloud density fluctuations and the cloud filling factor, respectively, and is the path length through the gas. FRB 190520 is offset from the host galaxy center by about (Niu et al., 2021), or about 5 kpc, which gives a sense of the scale of path lengths that might reasonably be sampled by the FRB; that being said, the FRB DM only traces a portion of the H emitting gas. Joint constraints on and from the H emission and the DM inventory can therefore, at least in theory, constrain the gas temperature and , but in the absence of independent measurements of and we must make assumptions about the reasonable ranges of these parameters.
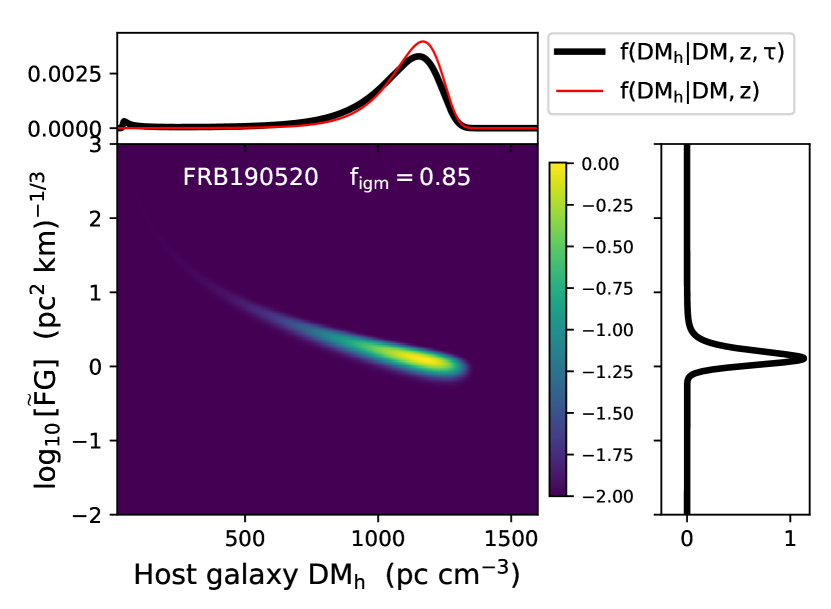
We first demonstrate the relationship between and temperature by constructing a likelihood function for using the observed H surface density and physically motivated priors for , , and . For , we adopt a log-normal prior with a mean of 2 kpc and standard deviation of 4.5 kpc, which is motivated by the physical scale of the host galaxy . In the ionized cloudlet model, , , and . For warm ionized gas () , whereas for hot ionized gas () can be much larger . We therefore adopt a flat prior on the composite parameter restricted to the range [1, 50] (which encapsulates a range of cases between , , and , ). H emission is typically observed between temperatures of about 5,000 to 16,000 K (Draine, 2011), so we adopt a log-normal prior on with a mean of and a standard deviation of . The H surface density in the source frame is also given a Gaussian prior with a mean and standard deviation set by the values inferred from the observed H luminosity, Rayleighs. For , we initially adopt a flat prior restricted to the range [100, 2000] pc cm-3, so that we can explicitly show how scales with for the observed . We then use a numerical grid search to calculate the likelihood function for as , where is the function relating , , , and based on Equations 1 and 5.
The resulting likelihood function for vs. is shown in Figure 5, along with the range of that is independently constrained by the DM budget in Section 3.1. Previous studies typically assumed to convert H EM to DM, but in this case adopting yields pc cm-3, less than half the value inferred from the DM budget, assuming the prior on . In order for the H emission to explain the FRB’s , needs to be almost an order of magnitude larger. A numerical joint likelihood estimate of and the PDF for calculated in Section 3.1 yields K. This constraint on assumes that the entire H EM is attributable to the gas responsible for , but the FRB LOS likely only probes a fraction of the H emission observed from the entire galaxy. As such, this constraint on could be regarded as a lower bound, because the temperature would need to be even larger for the FRB to account for only a fraction of the total H EM.
There are a few scenarios that may make the FRB DM budget consistent with the H emission observed from the host galaxy. One scenario is that the temperature of gas sampled by the FRB is higher than typical for warm, H emitting gas. Another is that the density fluctuation parameter is significantly different than our nominal assumptions, which may be the case if turbulence in the host galaxy is significantly different than in the Milky Way. Yet another alternative is that the H EM conforms to and , but the total includes contributions from other (fully) ionized gas in the host galaxy. Any one (or a combination) of these scenarios could explain both the observed H luminosity and the implied by the FRB DM budget, but determining which scenario is the most plausible requires additional information about the properties of the host galaxy across multiple phases of its ISM.
3.3 Scattering in the Host Galaxy
In §2.2 we established that radio scattering of bursts from FRB 190520 is manifested in two ways: through intensity scintillations from scattering in the MW and pulse broadening from scattering in the host galaxy. Extragalactic scattering can attenuate MW scintillations by reducing the coherence length of the radio waves incident on the MW, , below that needed to produce 100% intensity modulations, where is the observed angular size of the scattered source. Here we present a brief summary and defer a more detailed analysis to a paper in preparation.
The pulse broadening time from an extragalactic screen is , where source-observer distance, scattering-layer-observer distance, and is the distance of the scattering layer from the source. (Often the expression for would have a factor rather than , but when is taken as the RMS image size of a circular image in one dimension, , leading to our expression.) Using 1 for a distant FRB source and a scattering screen in the host galaxy at we have . The coherence length of the scattered waves is then .
The required minimum coherence length is the size of the scattering cone from Galactic scattering projected onto the Galactic scattering screen. Using analogous definitions, the observed scattering angle from Galactic scattering is and , . Requiring then yields the inequality,
| (6) |
for in Gpc, in kpc, and in GHz (Cordes & Chatterjee, 2019). For s (; see Section 2.2.3) and Mpc , we find kpc2. Owing to the FRB’s high Galactic latitude, any Galactic scattering will be dominated by the thick disk within kpc (Ocker et al., 2020). Hence, the estimated distance between the extragalactic scattering screen and FRB source is kpc, entirely consistent with scattering in the host galaxy. This upper limit is less than of the distance between the FRB source and peak star-forming region in the galaxy, and fourteen times smaller than the current upper limit on the size of the associated PRS, 1.4 kpc (Niu et al., 2021). It therefore appears highly likely that the pulse broadening of FRB 190520 is dominated by gas within HG190520, including material near or within the FRB local environment.
3.3.1 Host Galaxy Scattering Parameters
The cloudlet model used in §3.2 also yields an expression for the scattering time in terms of the DM contributed by a scattering layer in , a source at redshift , and a scattering layer at redshift ,
| (7) |
where the observing frequency is in GHz. The geometric factor depends on the relative locations of the source, lens, and observer, and for scattering of a source located within a scattering medium at large distances from the observer, . For scattering of a source at cosmological distances by an intervening galaxy, , where is the path length through the lens. The pre-factor in Equation 7 is for in Mpc and all other distances in Gpc. The dimensionless factor converts the mean scattering delay to the time that is typically estimated from observed pulses. For the remainder of our analysis, we assume . The parameter has units , where , , and have been defined previously, and and are the outer and inner scales of the turbulence wavenumber spectrum in pc and km, respectively (Ocker et al., 2021, and references therein).
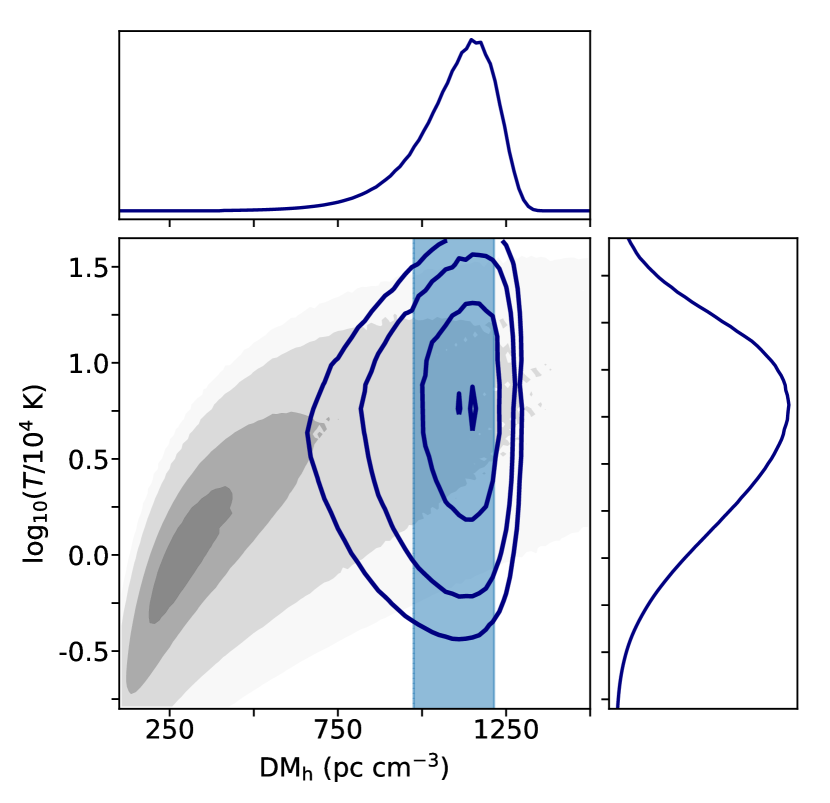
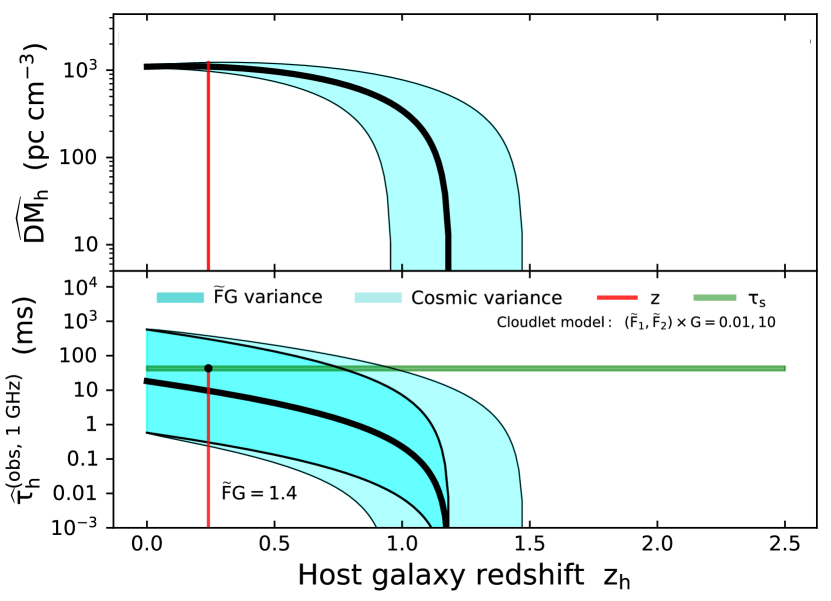
Figure 6 shows the combined estimates of the host galaxy’s dispersion measure (top panel) and scattering time estimate (bottom panel) vs. redshift, corresponding to the hypothetical case where the redshift is not known. The figure indicates that if the redshift had not been measured, a redshift up to nearly would be allowed given uncertainties in the contributions from the Milky Way and IGM. However, larger redshifts imply a smaller , making it less likely to account for the measured scattering time for a host galaxy ISM similar to the Milky Way ISM. If the measured DM were dominated by the IGM contribution, the scattering time would be highly anomalous for values of encountered in the Milky Way. Instead, the scattering time is consistent with a large host DM using a reasonable value of for the median value of . Figure 7 shows the results of a full posterior analysis for and , which yields a median value and 68% probable region, .
4 Redshift Estimation Using Dispersion Measures and Scattering Times
In Cordes et al. (2021) we demonstrated that, in the absence of a direct measurement, redshifts estimated using a combined dispersion-scattering (-) estimator are less biased than those from a -only based estimator and also have less scatter among the (only) nine FRB sources other than FRB 190520 with both redshift and scattering measurements available. Application of the same technique to FRB 190520 supports this conclusion more strongly: a -only based estimate yields a redshift that is too large by a factor of five while incorporation of scattering brings the estimate in line with the measured redshift. The bottom panel of Figure 6 shows that the measured redshift designated by the vertical red line corresponds to a scattering time estimated for a typical value of that well matches the measured value (horizontal green line).
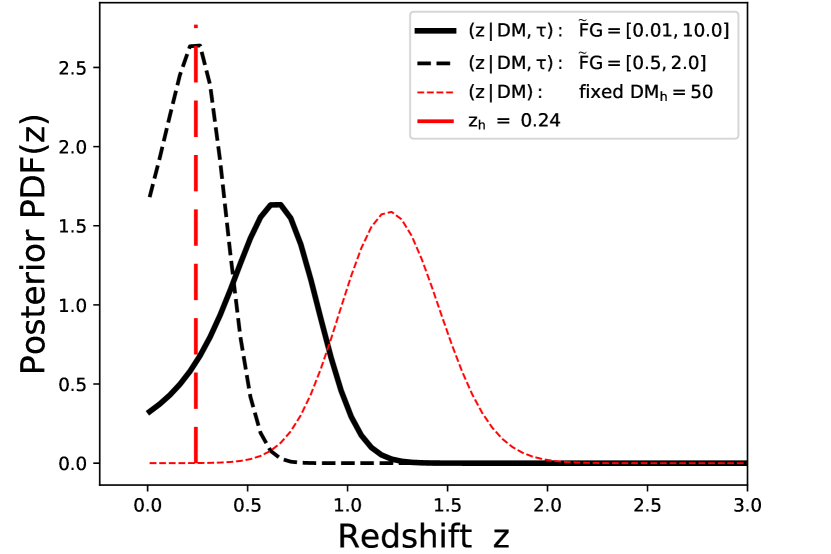
Figure 8 shows posterior PDFs for the redshift of FRB 190520 using three redshift estimators that are independent of the measured redshift (Cordes et al., 2021):
-
1.
A DM-based estimate, , that uses only the DM inventory and a fixed contribution from the host galaxy, .
- 2.
-
3.
A second DM-scattering estimator, , that uses a wider range of values.
The cases shown are based on , a value that minimizes bias and scatter of redshift estimates for the FRBs analyzed in Cordes et al. (2021). For FRB 190520 the best case is the DM-scattering estimator using a narrow range of , although use of the wider range is also consistent with the measured redshift with reasonable probability. However, the DM-only estimator is, not surprisingly, highly inconsistent.
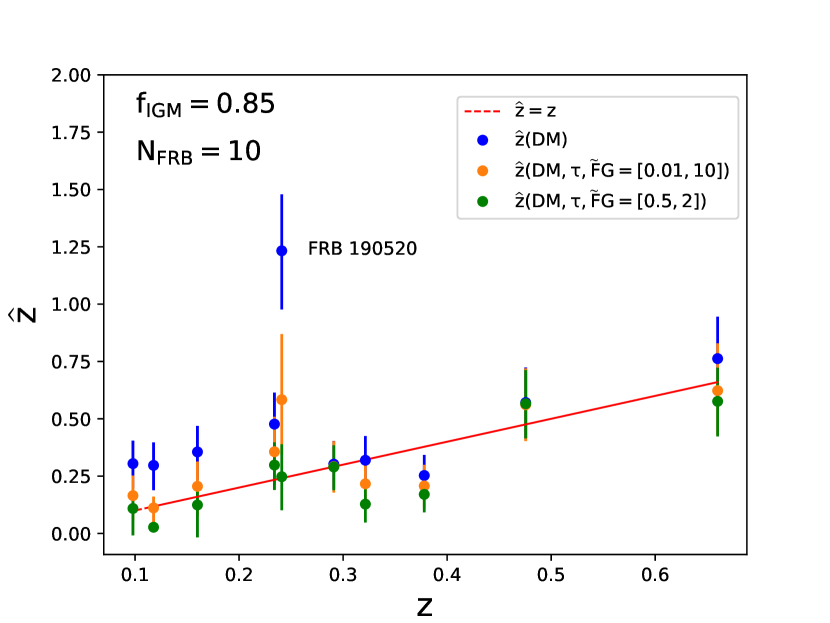
The performance of these estimators on FRB 190520 is compared in Figure 9 with the nine other FRBs analyzed previously that had both scattering and redshift measurements (these include: FRBs 180924, 181112, 190102, 190523, 190608, 190611, 191001, 200430, and 20201124A). Error bars on redshift estimates represent 68% probable regions centered on median redshift values calculated from the posterior PDFs. Four of the FRBs shown in Figure 9, 181112, 190523, 191001, and 200430 have both scattering in their host galaxies and values of (comparable to that of FRB 121102), and FRB 200430 has been proposed as a promising candidate for PRS searches (Law et al., 2022).
Inclusion of FRB 190520 in the sample yields the same overall result as in Cordes et al. (2021) that inclusion of scattering dramatically reduces the scatter of redshift measurements. In addition, this methodology allows a preferred range of to be identified, as demonstrated and discussed in Cordes et al. (2021). The value of inferred for FRB 190520 lies within the range found for the other FRBs examined in Cordes et al. (2021) and shown in Figure 9; this range of is consistent with values inferred for the Milky Way ISM using Galactic pulsars.
5 Discussion and Summary
The host galaxy of FRB 190520 exhibits extreme plasma properties compared to the host galaxies of other localized FRBs. The substantially lower than expected redshift implies that the host galaxy dominates the FRB DM budget. Given the small DM contribution expected from the host galaxy halo, the majority of the host DM likely originates in the host ISM and the FRB circum-source environment. A large is found through both the DM inventory, which yields (host frame), and through Balmer line observations. Assuming a nominal temperature of K for the H emitting gas yields a DM of about 300 pc cm-3 (host frame), which is still large compared to the DMs of other FRB host galaxies, but is significantly lower than the inferred from the FRB DM inventory. The H emission could be made consistent with a much larger DM if the gas temperature and density fluctuation statistics are significantly different from those considered typical of the warm ionized medium in the Milky Way. The FRB DM also receives contributions from the IGM and Milky Way, but these contributions comprise less than of the total DM budget for this LOS.
Negligible scattering is expected from the IGM at the FRB redshift (Macquart & Koay, 2013). We constrain the scattering contributions from the host galaxy and Milky Way along this LOS through measurements of scatter broadening and scintillation. The FRB mean scattering time of ms at 1.41 GHz, equivalent to ms at 0.6 GHz, is larger than any of the scattering times observed in CHIME/FRB Catalog 1, which only contains two FRBs with ms (Amiri et al., 2021). Correcting for selection biases in CHIME/FRB Catalog 1 suggests there should be a substantial population of highly scattered FRBs (Amiri et al., 2021), of which FRB 190520 is clearly an example.
Combining with for FRB 190520 yields a value for that is similar to values of found for other FRBs with both measured redshifts and scattering attributable to their host galaxies (see Section 4, and Cordes et al., 2021). This result affirms that a scattering-based redshift estimator can produce more robust redshift predictions than a DM-only redshift estimator, when scattering is observed from the host galaxy. Combined with the mean scintillation bandwidth MHz at 1.41 GHz, the measured scattering time implies a distance between the FRB source and dominant extragalactic scattering layer pc. This upper bound on is far more stringent than upper limits inferred from the scintillation bandwidths of other localized FRBs (e.g. Masui et al., 2015), and could suggest that scattering occurs in the FRB circum-source environment.
If FRB 190520 is embedded in a synchrotron-emitting nebula similar to that proposed for FRB 121102, then the lack of a synchrotron self-absorption signature in the observed PRS spectrum down to 1.4 GHz (Niu et al., 2021) yields an approximate lower limit on the size of the nebula . Using the formalism of Margalit & Metzger (2018) and the observed PRS flux density at 3 GHz Jy, we find cm pc, over three orders of magnitude smaller than the upper limit on . This constraint on is very similar to that of the FRB 121102 PRS, due to their comparable flux densities and distances. The relativistic electrons responsible for the PRS would not contribute to dispersion or scattering, but the upper limit on could potentially support a scenario where dispersion and scattering arise within a supernova remnant or merger ejecta surrounding a magnetar and synchrotron nebula (Margalit et al., 2018).
Further disentangling the host galaxy ISM from the FRB near-source environment in terms of their DM and scattering contributions involves several factors that are not well-constrained. The only independent constraint on the host galaxy DM comes from the observed H emission, but it is unclear how much of that H emission is traced by the FRB LOS. It is also unclear whether the entire measured scattering time could be attributed to the FRB circum-source environment. Moving the scattering plasma layer closer to the source reduces the geometric leverage to scattering, quantified as , where is the fractional screen location ( at the source and at the observer) and is the total distance between the source and observer. For a screen very close to the source, , and a corresponding increase in the level of turbulence (quantified as or slightly differently as ) is required to produce the same amount of scattering.
A smaller distance between the source and scattering layer also reduces the allowed width of the scattering layer. If the entire observed DM comes from this same scattering layer, then the layer’s mean electron density must also increase. For a plasma layer with and a width of order pc, cm-3, which implies an pc cm-6 and a negligible optical depth due to free-free absorption at 1.4 GHz. However, if the layer width decreases to pc then cm-3 and pc cm-6, and reducing the width to pc yields cm-3 and pc cm-6. At such high densities free-free absorption can play a role in FRB detectability, although it has been demonstrated that free-free absorption can be suppressed in plasma within pc of FRB sources due to Coulomb collisions in the surrounding plasma (Lu & Phinney, 2020). We have assumed here that the scattering and DM are contributed by a single plasma layer, but a more complex plasma configuration within the host galaxy is entirely possible.
Observations of DM and scattering are sensitive to path-integrated electron column densities and fluctuations. While complementary observations of scatter broadening, Galactic DISS, and angular broadening can be used to infer where scattering occurs along an FRB LOS and even within a host galaxy, deconstructing the DM budget within a host galaxy to infer properties of the host ISM and FRB near-source environment will benefit from higher spatial resolution H measurements and observations at complementary wavelengths (e.g. Chittidi et al., 2021; Tendulkar et al., 2021). It is still unclear whether the unusually large DM and scattering observed from FRB 190520 constitute unique features of its near-source environment and/or its host galaxy ISM more broadly; however, given both the large H EM and the stringent upper limit on the distance between the FRB source and dominant scattering plasma, it appears likely that both regions (ISM and circum-source) contribute significantly to the total DM and scattering observed. Regardless, our results are consistent with previous findings that the scattering of localized FRBs can be accounted for by plasma in their host galaxies and the Milky Way. Continued application of detailed DM and scattering budgets will not only resolve the plasma density and turbulence within the distant galactic environments of localized FRBs (e.g. Simard & Ravi, 2021), but will also improve redshift estimates for FRBs that have not yet been associated with their host galaxies.
References
- Amiri et al. (2021) Amiri, M., Andersen, B. C., Bandura, K., et al. 2021, ApJS, 257, 59, doi: 10.3847/1538-4365/ac33ab
- Anna-Thomas et al. (2022) Anna-Thomas, R., Connor, L., Burke-Spolaor, S., et al. 2022, arXiv e-prints, arXiv:2202.11112. https://arxiv.org/abs/2202.11112
- Astropy Collaboration et al. (2013) Astropy Collaboration, Robitaille, T. P., Tollerud, E. J., et al. 2013, A&A, 558, A33, doi: 10.1051/0004-6361/201322068
- Astropy Collaboration et al. (2018) Astropy Collaboration, Price-Whelan, A. M., Sipőcz, B. M., et al. 2018, AJ, 156, 123, doi: 10.3847/1538-3881/aabc4f
- Bij et al. (2021) Bij, A., Lin, H.-H., Li, D., et al. 2021, ApJ, 920, 38, doi: 10.3847/1538-4357/ac1589
- Bochenek et al. (2020) Bochenek, C. D., Ravi, V., Belov, K. V., et al. 2020, Nature, 587, 59, doi: 10.1038/s41586-020-2872-x
- Caleb et al. (2022) Caleb, M., Rajwade, K., Desvignes, G., et al. 2022, MNRAS, 510, 1996, doi: 10.1093/mnras/stab3223
- Chittidi et al. (2021) Chittidi, J. S., Simha, S., Mannings, A., et al. 2021, ApJ, 922, 173, doi: 10.3847/1538-4357/ac2818
- Cordes & Chatterjee (2019) Cordes, J. M., & Chatterjee, S. 2019, ARAA, 57, 417, doi: 10.1146/annurev-astro-091918-104501
- Cordes & Lazio (2002) Cordes, J. M., & Lazio, T. J. W. 2002, arXiv e-prints, astro. https://arxiv.org/abs/astro-ph/0207156
- Cordes et al. (2021) Cordes, J. M., Ocker, S. K., & Chatterjee, S. 2021, arXiv e-prints, arXiv:2108.01172. https://arxiv.org/abs/2108.01172
- Cordes & Wasserman (2016) Cordes, J. M., & Wasserman, I. 2016, MNRAS, 457, 232, doi: 10.1093/mnras/stv2948
- Cordes et al. (2017) Cordes, J. M., Wasserman, I., Hessels, J. W. T., et al. 2017, ApJ, 842, 35, doi: 10.3847/1538-4357/aa74da
- Cordes et al. (1991) Cordes, J. M., Weisberg, J. M., Frail, D. A., Spangler, S. R., & Ryan, M. 1991, Nature, 354, 121, doi: 10.1038/354121a0
- Dai et al. (2022) Dai, S., Feng, Y., Yang, Y. P., et al. 2022, arXiv e-prints, arXiv:2203.08151. https://arxiv.org/abs/2203.08151
- Draine (2011) Draine, B. T. 2011, Physics of the Interstellar and Intergalactic Medium (Princeton University Press)
- Feng et al. (2022) Feng, Y., Li, D., Yang, Y.-P., et al. 2022, Science, 375, 1266, doi: 10.1126/science.abl7759
- Gwinn et al. (1998) Gwinn, C. R., Britton, M. C., Reynolds, J. E., et al. 1998, ApJ, 505, 928, doi: 10.1086/306178
- Harvey-Smith et al. (2011) Harvey-Smith, L., Madsen, G. J., & Gaensler, B. M. 2011, ApJ, 736, 83, doi: 10.1088/0004-637X/736/2/83
- Hessels et al. (2019) Hessels, J. W. T., Spitler, L. G., Seymour, A. D., et al. 2019, ApJL, 876, L23, doi: 10.3847/2041-8213/ab13ae
- Law et al. (2022) Law, C. J., Connor, L., & Aggarwal, K. 2022, ApJ, 927, 55, doi: 10.3847/1538-4357/ac4c42
- Li et al. (2019) Li, D., Dickey, J. M., & Liu, S. 2019, Research in Astronomy and Astrophysics, 19, 016, doi: 10.1088/1674-4527/19/2/16
- Li et al. (2018) Li, D., Wang, P., Qian, L., et al. 2018, IEEE Microwave Magazine, 19, 112, doi: 10.1109/MMM.2018.2802178
- Lu & Phinney (2020) Lu, W., & Phinney, E. S. 2020, MNRAS, 496, 3308, doi: 10.1093/mnras/staa1679
- Lyutikov (2021) Lyutikov, M. 2021, ApJ, 922, 166, doi: 10.3847/1538-4357/ac1b32
- Macquart & Koay (2013) Macquart, J.-P., & Koay, J. Y. 2013, ApJ, 776, 125, doi: 10.1088/0004-637X/776/2/125
- Macquart et al. (2020) Macquart, J. P., Prochaska, J. X., McQuinn, M., et al. 2020, Nature, 581, 391, doi: 10.1038/s41586-020-2300-2
- Main et al. (2022) Main, R. A., Hilmarsson, G. H., Marthi, V. R., et al. 2022, MNRAS, 509, 3172, doi: 10.1093/mnras/stab3218
- Marcote et al. (2020) Marcote, B., Nimmo, K., Hessels, J. W. T., et al. 2020, Nature, 577, 190, doi: 10.1038/s41586-019-1866-z
- Margalit & Metzger (2018) Margalit, B., & Metzger, B. D. 2018, ApJL, 868, L4, doi: 10.3847/2041-8213/aaedad
- Margalit et al. (2018) Margalit, B., Metzger, B. D., Berger, E., et al. 2018, MNRAS, 481, 2407, doi: 10.1093/mnras/sty2417
- Masui et al. (2015) Masui, K., Lin, H.-H., Sievers, J., et al. 2015, Nature, 528, 523, doi: 10.1038/nature15769
- Nan et al. (2011) Nan, R., Li, D., Jin, C., et al. 2011, International Journal of Modern Physics D, 20, 989, doi: 10.1142/S0218271811019335
- Nimmo et al. (2022) Nimmo, K., Hessels, J. W. T., Kirsten, F., et al. 2022, Nature Astronomy, 6, 393, doi: 10.1038/s41550-021-01569-9
- Niu et al. (2021) Niu, C. H., Aggarwal, K., Li, D., et al. 2021, arXiv e-prints, arXiv:2110.07418v2. https://arxiv.org/abs/2110.07418v2
- Ocker et al. (2020) Ocker, S. K., Cordes, J. M., & Chatterjee, S. 2020, ApJ, 897, 124, doi: 10.3847/1538-4357/ab98f9
- Ocker et al. (2021) —. 2021, ApJ, 911, 102, doi: 10.3847/1538-4357/abeb6e
- Planck Collaboration et al. (2020) Planck Collaboration, Aghanim, N., Akrami, Y., et al. 2020, A&A, 641, A6, doi: 10.1051/0004-6361/201833910
- Pol et al. (2021) Pol, N., Burke-Spolaor, S., Hurley-Walker, N., et al. 2021, ApJ, 911, 121, doi: 10.3847/1538-4357/abe70d
- Rickett (1990) Rickett, B. J. 1990, araa, 28, 561
- Schlafly & Finkbeiner (2011) Schlafly, E. F., & Finkbeiner, D. P. 2011, ApJ, 737, 103, doi: 10.1088/0004-637X/737/2/103
- Schoen et al. (2021) Schoen, E., Leung, C., Masui, K., et al. 2021, Research Notes of the American Astronomical Society, 5, 271, doi: 10.3847/2515-5172/ac3af9
- Simard & Ravi (2021) Simard, D., & Ravi, V. 2021, arXiv e-prints, arXiv:2107.11334. https://arxiv.org/abs/2107.11334
- Tendulkar et al. (2017) Tendulkar, S. P., Bassa, C. G., Cordes, J. M., et al. 2017, ApJL, 834, L7, doi: 10.3847/2041-8213/834/2/L7
- Tendulkar et al. (2021) Tendulkar, S. P., Gil de Paz, A., Kirichenko, A. Y., et al. 2021, ApJL, 908, L12, doi: 10.3847/2041-8213/abdb38
- Yao et al. (2017) Yao, J. M., Manchester, R. N., & Wang, N. 2017, ApJ, 835, 29, doi: 10.3847/1538-4357/835/1/29
- Zhu et al. (2020) Zhu, W., Li, D., Luo, R., et al. 2020, ApJL, 895, L6, doi: 10.3847/2041-8213/ab8e46