34th Symposium on Naval Hydrodynamics
Washington, DC, USA, 26 June-1 July 2022
Modal analysis of bluff body wakes
S. Nidhan1, D. Gola1, and S. Sarkar1
(1University of California San Diego, La Jolla, USA)
Abstract
Spectral proper orthogonal decomposition (SPOD) analyses are performed for unstratified and stratified wakes of a circular disk at Reynolds number, , where is the freestream velocity and is the diameter of the circular disk. At , three diameter-based Froude numbers, , and are analyzed. We find that in the unstratified configuration, two modes: (i) the vortex shedding (VS) mode () and (ii) the double helix (DH) mode () are the most dominant features. At far-downstream distances, DH mode is dominant while at near and intermediate locations, VS mode dominates the energetics. Reconstruction of TKE and Reynolds shear stresses are also explored at near and far wake locations. In the stratified cases ( and ), the vortex shedding mode (at ) dominates the wake. At intermediate to late streamwise locations (), we establish through pressure wave flux reconstruction that the VS mode is responsible for the internal gravity wave (IGW) generation. A comparison between the SPOD decomposition analyses between and is also performed at . Preliminary results show that the low-Re wake is also dominated by the VS mode but exhibits more coherence, namely higher contribution of leading SPOD modes, than the high-Re wake.
Introduction
Townsend [1] hypothesized that turbulent wakes forget their initial conditions far from the wake generator. However experimental [2] and numerical [3, 4] studies have shown that the effect of initial conditions can remain embedded in these flows for large downstream distances (). Hence, it is expected that initial conditions, like the shape and characteristic of wake generator, can significantly influence the coherent structures [5, 6] in the wake. These structures can carry significant amount of turbulent kinetic energy (TKE) and Reynolds stresses. Hence, an in-depth understanding of coherent structures is fundamental to uncover the complete picture of how a turbulent wake evolves.
In the presence of stratification, several distinctive features emerge in turbulent wakes, e.g. steady lee-waves in the downstream [7], multistage wake decay [8], unsteady internal gravity waves (IGWs) at intermediate to late buoyancy times [9, 10] and emergence of pancake vortices [11]. Previous works of Bonneton et al. [12] and Lin et al. [13] have shown the existence of vortex shedding (VS) frequency at select locations in the near wake at intermediate Reynolds numbers. However, there are still some open questions: (i) Is the VS mode present even at large downstream locations in stratified wakes? (ii) How energetic are the coherent structures in stratified wakes compared to the unstratified counterpart?, and (iii) How much do they contribute to the unsteady IGW generation mechanism?
To this end, the objective of this work was to analyze the energetics of coherent structures in unstratified and stratified wakes at a moderately high Re. We use the datasets of Chongsiripinyo and Sarkar [14] of flow past a circular disk at and . Here, , , , and correspond to free-stream velocity, body diameter, buoyancy frequency and kinematic viscosity of the fluid. Spectral proper orthogonal decomposition (SPOD) is used to analyze the evolution of these coherent structures for downstream location extending to . SPOD has been shown to effectively distill the coherent features in various different flow configurations, e.g. wall bounded flows [15, 16], turbulent jets [17], etc. Contrary to methods like dynamic mode decomposition [18], SPOD provides an ordered set of modes at a given frequency St. In this paper, we summarize the key findings of Nidhan et al. [19, 20] for the wake. In addition, we present preliminary comparison between SPOD analyses of flow past a circular disk at , with and results. The aim of this comparison is to assess the change in modal energy content when Re is changed. In future, we wish to leverage the findings from this ongoing study to provide realistic inflow conditions to body-exclusive simulations [21] for high Re wakes.
Methodology
For the numerical implementation of SPOD, two-dimensional data (at a given ) of all flow variables at each timestep is flattened into a column vector and assembled in a snapshot matrix , where is the temporal snapshot and is the total number of snapshots employed for the SPOD. Thereafter, the temporal mean is subtracted from the snapshot matrix:
| (1) |
The matrix is then divided into overlapping blocks with entries in each block as follows:
| (2) |
where denotes the block of data containing temporal snapshots. Each block is then Fourier transformed in time resulting in the matrix:
| (3) |
Following this, all the Fourier realization at a specific frequency from matrices are collected into a a single matrix as follows:
| (4) |
Once is formed, we obtain the SPOD eigenvalues and eigenmodes by eigenvalue decomposition of the weighted cross-spectral density matrix where is a diagonal matrix containing eigenvalues ranked in decreasing order of energy content from to . The corresponding spatial eigenmodes can be obtained as . is a diagonal matrix containing the numerical quadrature weights. Multiplication by ensures that the obtained SPOD eigenvalues optimally capture the area-integrated sum of the defined energy norm at any given cross-section.
Since the wake has azimuthal symmetry, its snapshots are first azimuthally decomposed and then eigenvalue decomposition is performed for each azimuthal wavenumber . Note that the azimuthal decomposition is not performed for the stratified cases as the stratification kills the azimuthal symmetry in the flow. For all cases, we perform SPOD one axial location () at a time due to significant computational cost of performing a SPOD in wakes that cover downstream location until . For SPOD, a single snapshot entry would have comprised of elements, making the computation intractable for snapshots.
The parameters for SPOD analysis of stratified cases at are as follows: (i) total number of snapshots with consecutive snapshots separated by and for and , respectively, (ii) number of frequencies , and (iii) overlap between blocks , resulting in total of SPOD modes at each frequency. For the wake, snapshots with are employed while keeping the other SPOD parameters same as in the stratified cases. For at , and are kept the same with and which gives SPOD modes for this case. Readers are referred to Towne et al. [22] and Schmidt and Colonius [23] for more details regarding the theoretical and numerical aspects of SPOD algorithm.
Results
SPOD analysis of unstratified wake at
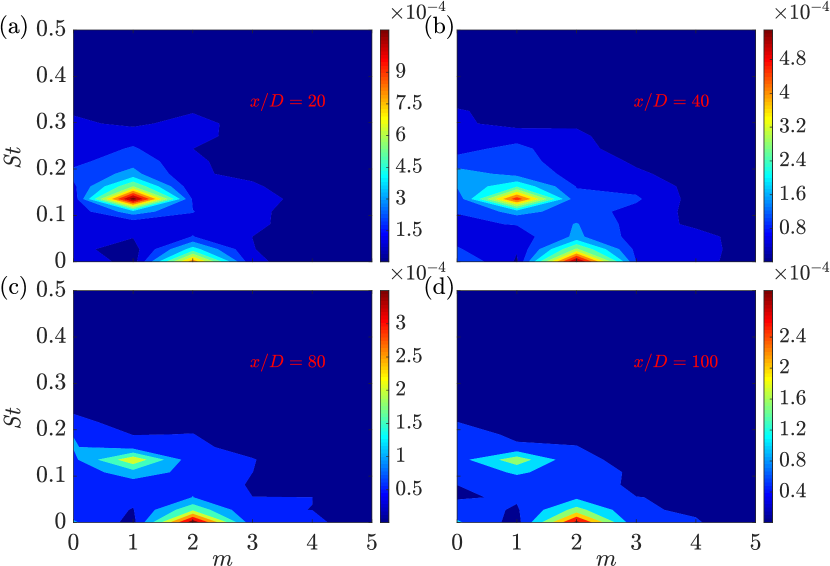
Energetics in the unstratified wake is found to be dominated by two distinct coherent structures at intermediate and large downstream locations as shown in figure 1: (i) the vortex shedding (VS) mode with , and (ii) the double helix (DH) mode with . Here, is the azimuthal mode number, is the SPOD modal index, and is the Strouhal number.
While the has long been attributed to the vortex shedding mechanism in the wake of a disk [24, 25, 6], the importance of the DH mode was first elucidated by Johansson et al. [26]. The prominent peak at should be interpreted as a quasi-steady structure in the limit of given the discrete nature of the Fourier transform employed for the numerical data. From figure 1, one can also infer that the dominance of the VS mode in the intermediate wake gives way to the dominance of the DH mode at late downstream locations. Additionally, we find that the overall dominance of the azimuthal mode over appeared around . At the same streamwise location, the mean defect decay also transitions from the non-equilibrium decay [27] of to the classical decay of [14].
The reconstruction quality of TKE and using SPOD modes has also been assessed. By definition, SPOD modes are constructed to be optimal for the area-integrated TKE and an accurate reconstruction of is not guaranteed. However, we find that the fidelity of SPOD modes in reconstructing the Reynolds shear stress is significantly better compared to the TKE reconstruction.
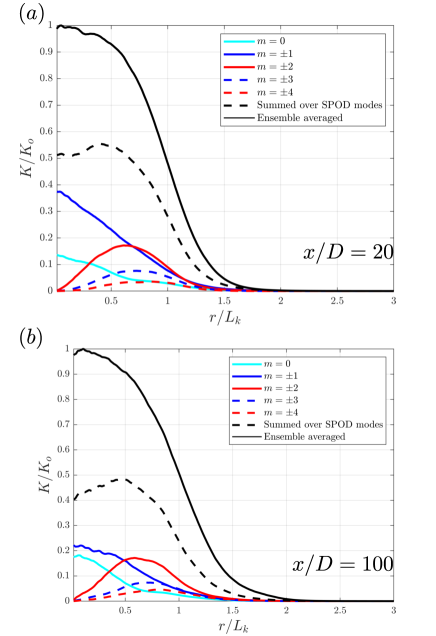
Figure 2 shows the TKE reconstruction using SPOD modes at two downstream locations of and using the () triplets mentioned in the caption. At the centerline, the qualitative trend of the reconstructed TKE remains similar with approximately accuracy at both intermediate and far wake locations. Away from the wake core, the reconstruction quality improves owing to the less turbulent state of the flow away from the centerline. It can also be noted that the reconstruction quality slightly deteriorates in the centerline with increasing . are the leading individual azimuthal contributors to the overall TKE.
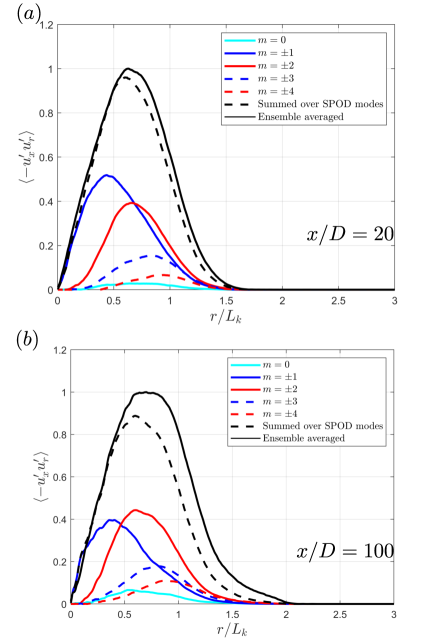
Likewise, figure 3 compares the reconstruction of with the corresponding actual value at four locations and . The same sets of modes as in figure 2 are employed for reconstruction. The reconstruction turns out to have significantly higher fidelity for than for TKE. Azimuthal modes and are the two major contributors to the Reynolds shear stress followed by and . mode carries significantly less in contrast to its high contribution towards TKE. Interested readers are referred to Nidhan et al. [19] for an in-depth analysis on trends of TKE and reconstruction.
SPOD analysis of stratified wakes at
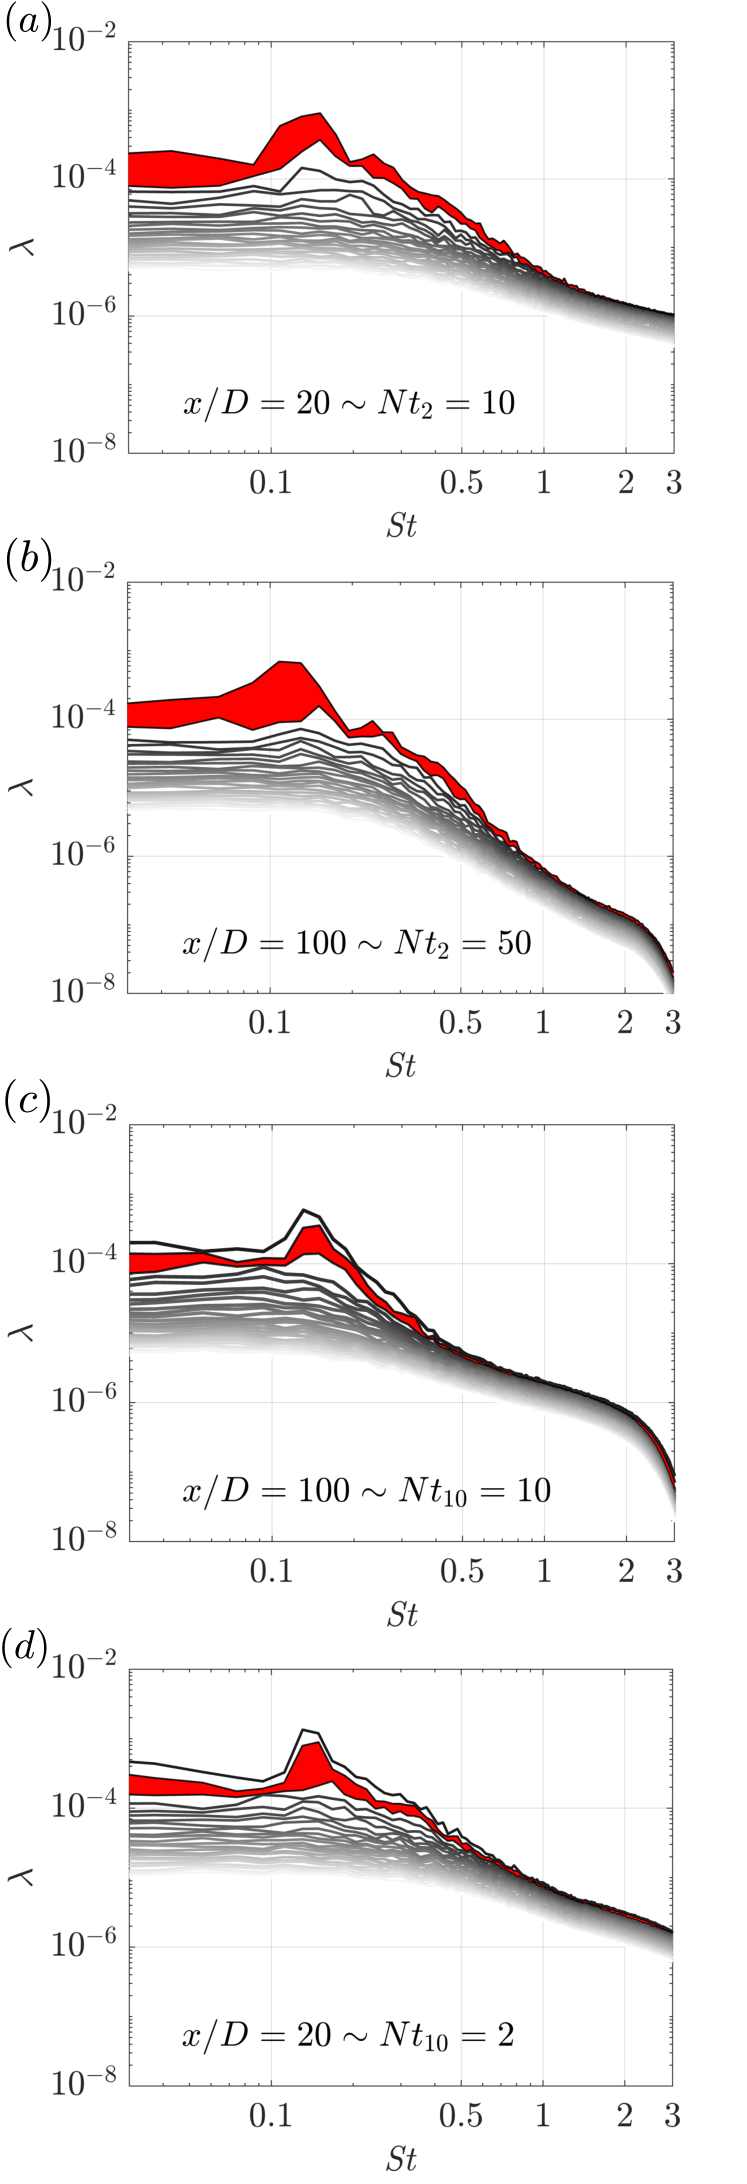
Figure 4 shows the SPOD eigenspectra in the intermediate () and far wake () for and . In all four plots, a prominent peak at can be observed. As discussed in the previous section, this frequency corresponds to the vortex shedding (VS) frequency in flow past a circular disk in unstratified environment. There is a significant gap between the optimal and sub-optimal SPOD modes around VS frequency (shaded by red). This implies that the dynamics in the proximity of the VS mode is low-rank, being primarily dominated by leading SPOD modes at the VS frequency. At , energy in all modes steeply decreases in both wakes. In the wake, we shade the region between second and third eigenvalues since the first two SPOD modes are similar in energy content. On further investigation, we find that the first and second SPOD eigenmodes at the VS frequency in the wake have a similar spatial structure, but with a rotation in their orientation. We hypothesize that these two modes at the VS frequency are the manifestation of azimuthal modes in the weakly stratified wake.
Figure 4 establishes that the VS mechanism is active in the stratified wakes even at far downstream location (). To compare how energetic is the VS mode in stratified wakes compared to dominant modes in the unstratified wake, we compare the variation of the energy contained in the leading 15 SPOD modes across , and wakes in figure 5. For , variation of energy in and modes, the two most energetic azimuthal modes, are shown. Figure 5 shows that the decay of energy around the dominant frequencies is the slowest for the , followed by and wakes, respectively. This observation establishes that the body-induced coherence is sustained for long distances in the stratified wakes as compared to their unstratified counterpart.
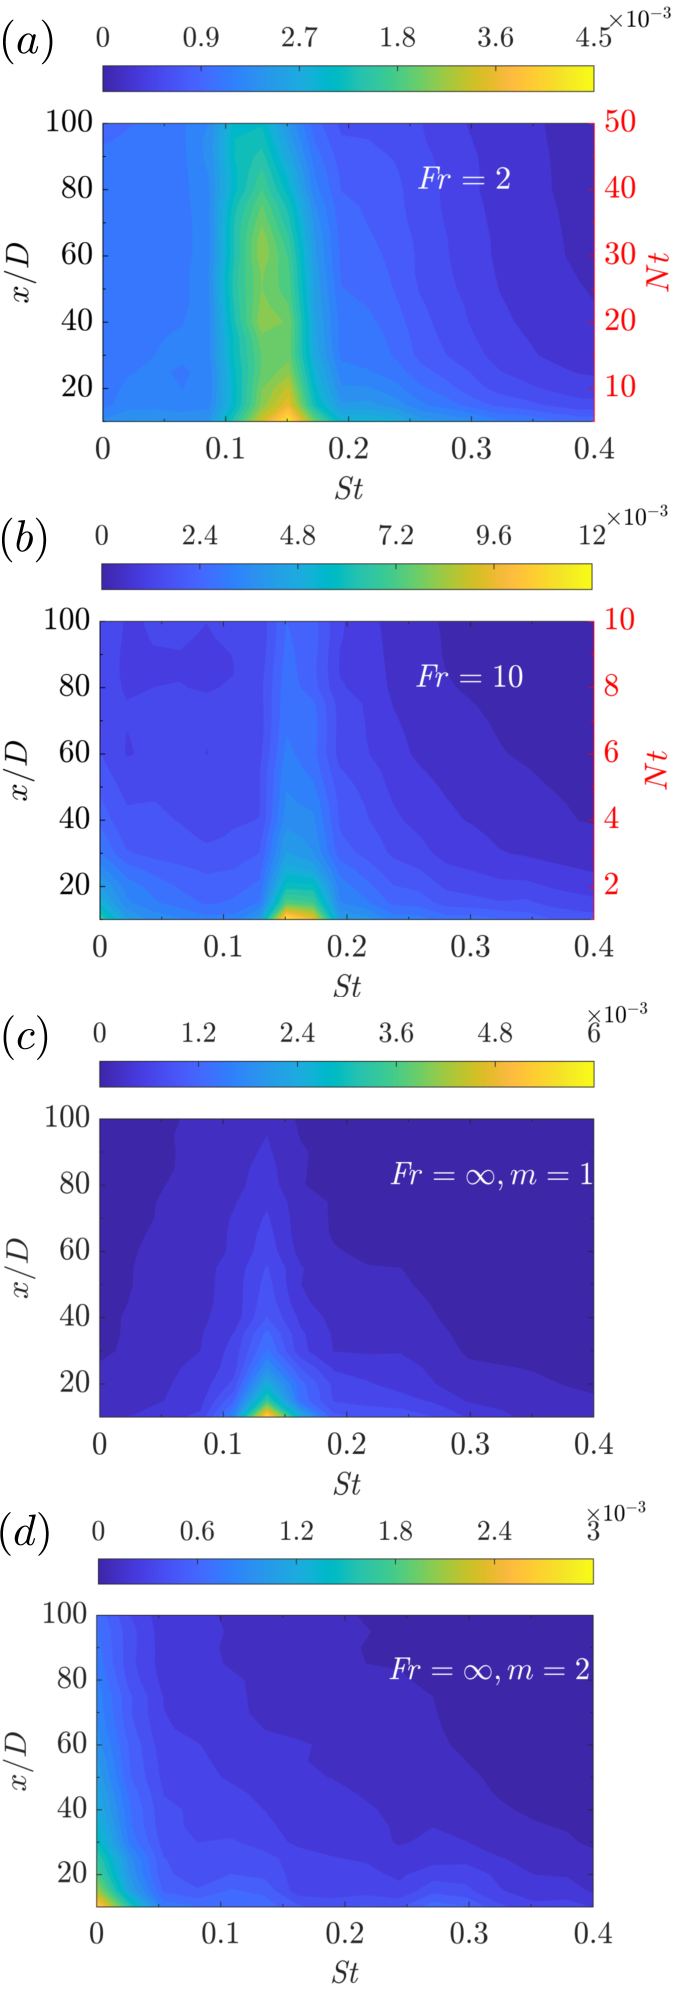
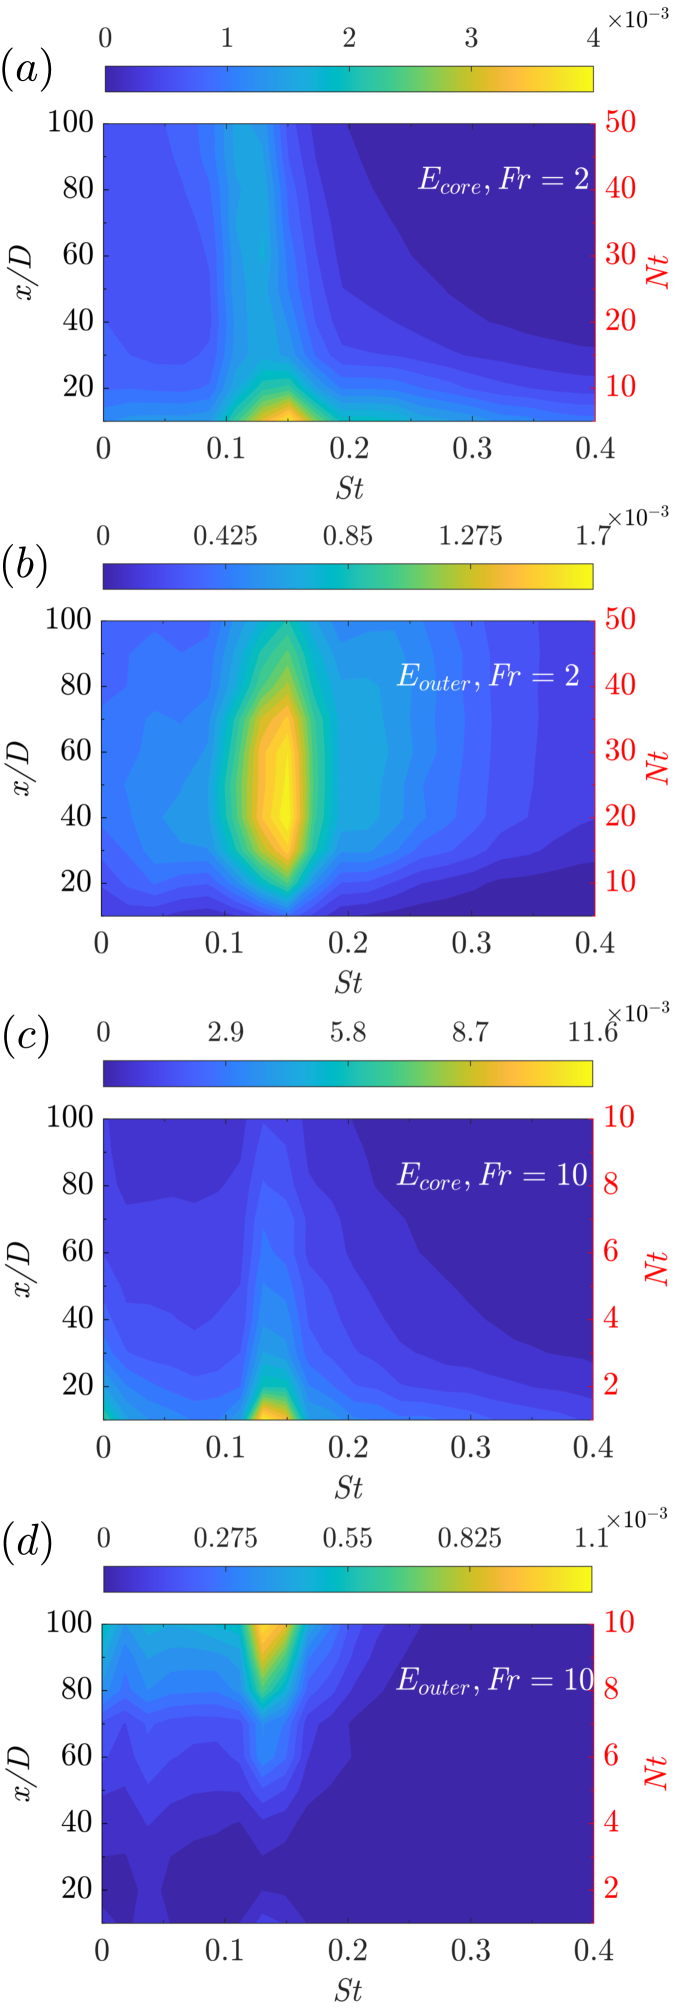
To investigate the reason behind the sustenance of the coherent features in the stratified wakes for large , we plotted the energy partitioned between wake core and outer wake region for and wakes as shown in figure 6. The wake core is defined by an ellipse with major and minor axes being two-times horizontal TKE based wake width (Chongsiripinyo and Sarkar [14]) and vertical TKE based wake width at a given . The energy in the wake core of both Fr (figure 6(a,c)) decay with . However, in the outer wake, we see accumulation of energy in (a) wake from () and (b) wake from (). The energy in outer wake is concentrated in the vicinity of the VS frequency. At similar locations, visualization of SPOD modes at the VS frequency (not shown here for brevity), show IGWs emanating from wake core to outer wake. Other numerical works employing temporal model for wakes, e.g., deStadler and Sarkar [28], Abdilghanie and Diamessis [9] and Rowe et al. [10] have also found emission of IGWs in the wake core for . Results from our SPOD analyses are in qualitative agreement with these work. Going a step further, SPOD analysis establishes that these IGWs are primarily emitted at the VS frequency (at least in wakes with ), indicating a strong causal link between the VS mechanism and IGW generation in stratified wakes.
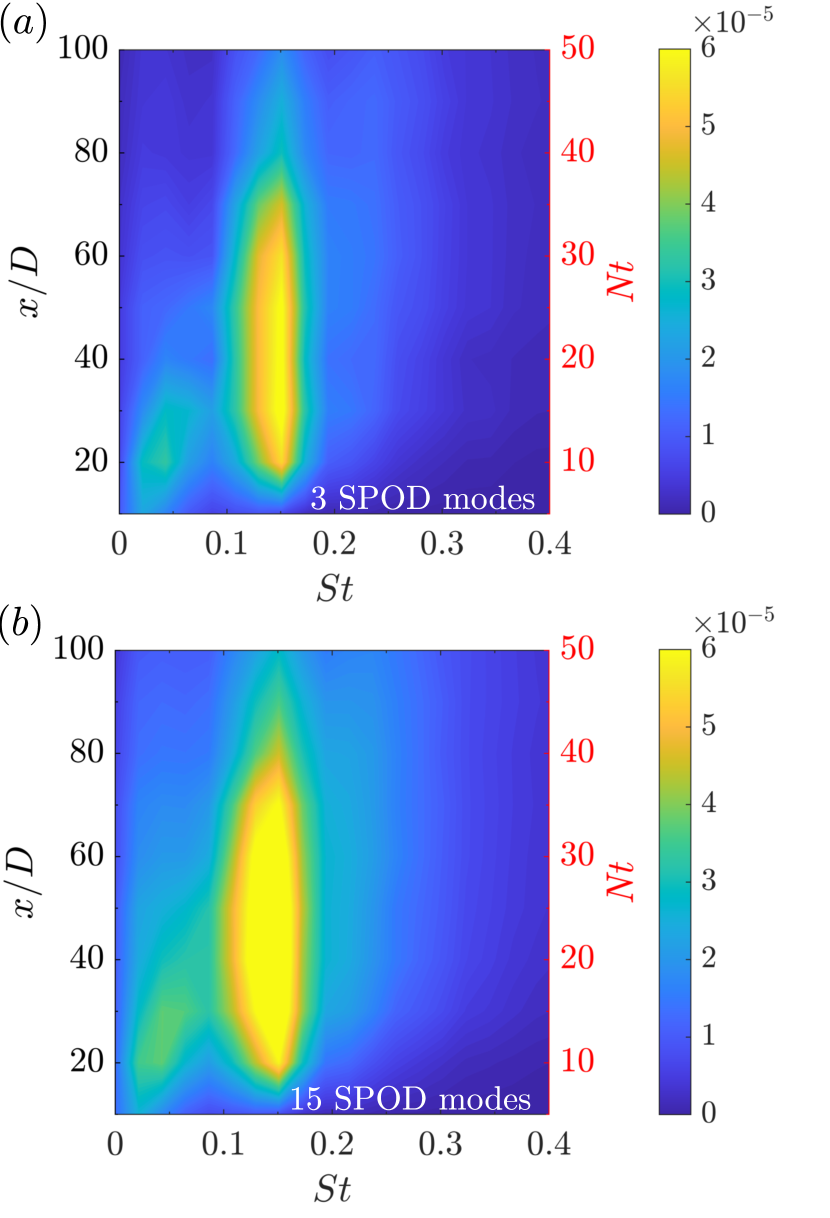
Figure 7 shows the reconstructed radial pressure wave flux, , integrated in the outer wake region for the wake. It is important to note that is responsible for transferring energy from the wake core to the outer wake through IGWs (Rowe et al. [10]). The reconstruction has been performed using leading 3 and leading 15 SPOD modes in figure 7(a,b), respectively. Both plots show a strong contribution of the VS mechanism to the pressure wave flux term. The evolution of with is very similar to the variation of energy in the outer wake region in the wake (figure 6b). Figure 7 establishes a causal link between the IGW generation process and the VS mechanism showing that it is the VS mode that contributes primarily to the emission of IGWs.
Comparison of the modal content between and wakes at
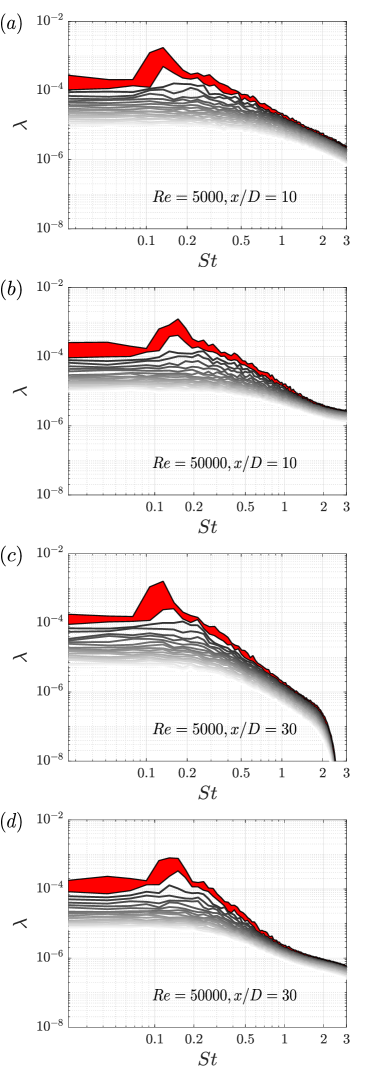
We now briefly describe the differences between the modal content at and . Figure 8 compares SPOD eigenspectra between and , at . Both cases exhibit peaks at the VS frequency of . However, the two Reynolds numbers differ in the energy difference between the leading two modes. This difference is higher at the lower Reynolds number of and appears to increase with increasing or .
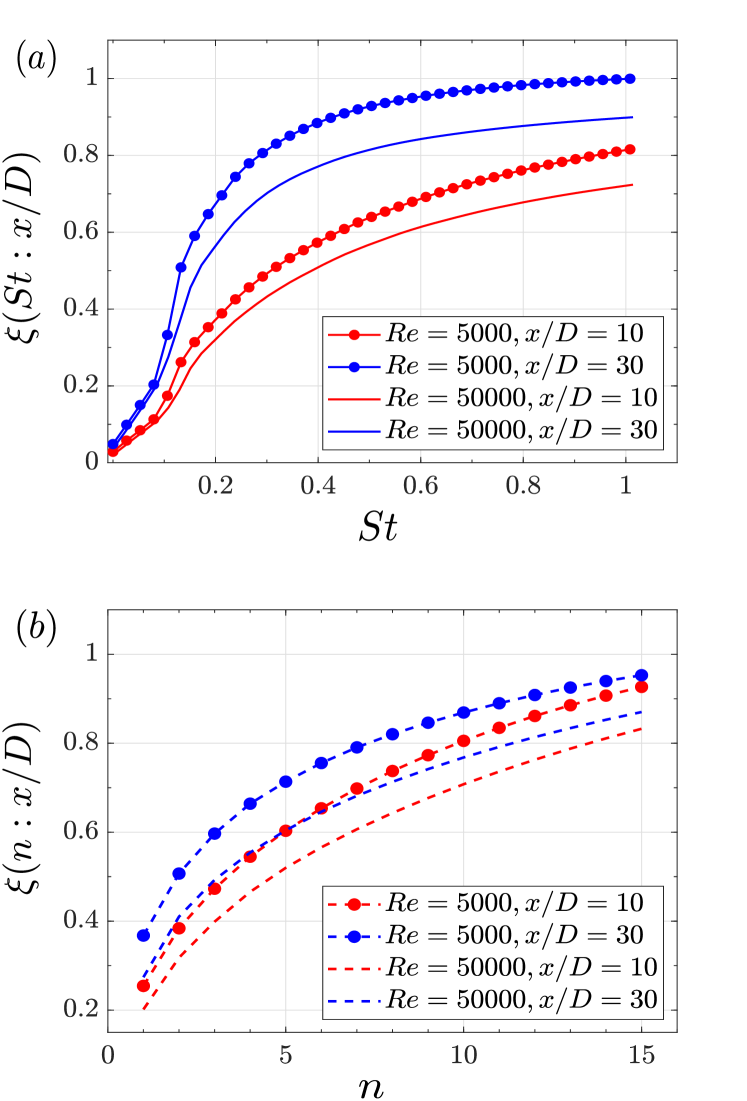
Figure 9 (a) shows the cumulative energy as a function of the frequency. This energy is calculated by summing over all the number of modes for both the cases and plotting it against frequency. For (which includes the VS frequency), there is little difference between the two cases. As St increases, the case with the higher Re of has progressively larger value of relative to , signifying increasing energetic importance of fine-scale motions. It is worth noting that, at for , almost all of the energy is contained in frequencies corresponding to . Quantitatively, at more than of the energy in is captured in frequencies corresponding to and at almost all the energy is captured at frequencies corresponding to . A similar comparison is done in figure 9 (b), where the cumulative energy, now summed over all the frequencies, is plotted against the modal index. We see that the case has higher energy content in lower SPOD modes as compared to the cases. The modal indices up to collectively, are enough to capture more than of the energy until , whereas for that number is .
Conclusions
In this work, we employ spectral proper orthogonal decomposition (SPOD) to analyze the coherent structures in the turbulent wake of a circular disk at and and . The analysis encompasses an unprecedented downstream distance of where is the body diameter and is the streamwise coordinate. The obtained SPOD eigenvalues are a function of distance () and frequency (St) in stratified wakes. In the case of unstratified wake, these eigenvalues vary with , St, and (azimuthal wavenumber). A preliminary comparison between SPOD results of and is also performed at . In future, we wish to leverage the similarity in the modal content across different Re to widen the scope of body-exclusive simulations (VanDine et al. [21]) in modeling high Re flows.
In the wake, two modes: (i) the vortex shedding (VS) mode and (ii) the double helix (DH) mode dominate the energetics until . For a circular disk, VS mode resides at and while the DH mode resides at . At near and intermediate distances, the VS mode is more dominant compared to the DH mode while at farther downstream locations (), DH mode emerges as the dominant structure in the flow. This finding is in accord with previous experimental study of Johansson et al. [29]. However, additionally we find that the overall dominance of the mode with respect to the mode occurs at the same [19] where the defect velocity () decay rate changes (Chongsiripinyo and Sarkar [14]) from to . Besides and modes, summed contribution from and is also significant. We discuss the evolution of their eigenspectra in more detail in Nidhan et al. [19]. Reconstruction of second-order statistics such as TKE and Reynolds stress () using SPOD modes further uncover the dominance of and modes compared to other azimuthal modes at all . Interestingly, shows better reconstruction quality than TKE for the same set of modes, pointing towards the low-rank nature of .
SPOD analyses of the stratified wakes reveal the dominance of the VS mechanism in the near and far wake of both and . Further analyses reveal that the energy in the frequencies around VS decays the slowest for , followed by the and wake, respectively. This implies that the body-induced coherence is prolonged in the stratified wakes compared to their unstratified counterpart. Partitioning the energy at between the wake core and outer wake region reveal that the energy appears in the outer wake region for (i) in the wake and (ii) in the wake. The elevated energy levels in the outer wake region are concentrated around the VS frequency in both wakes, indicating a link between the IGW generation mechanism and VS mechanism. The causal link is further confirmed by reconstructing the radial pressure wave flux in the wake using SPOD modes. Reconstructed shows a strong imprint of the VS mode at similar where we observe increased energy content in the outer wake region of the wake.
Comparison of the SPOD eigenspectrum between and shows that although both the spectra look qualitatively similar with dominant peaks near the disk vortex shedding frequency, the relative contributions of the higher SPOD modes and frequencies are not the same. When comparing the cumulative modal energy content, the results show that fewer SPOD modes and frequencies are required to capture the same amount of energy in the wake than in the wake.
Overall, our results show that the shape of wake generator can have a lasting impact on the flow evolution, in both unstratified and stratified conditions. Particularly, in stratified wakes, body-generated VS coherence can dictate the course of IGW generation at intermediate . Thus, moving ahead, it is crucial to embed the characteristics of wake generator in the initial conditions to capture accurate flow physics. At higher Re, explicitly modeling the wake generator becomes prohibitively expensive. Thus, there is a need for alternate approaches to incorporate wake generator features in numerical simulations at higher Re. Similarity in the large scale coherent structures across lower and higher Re can be exploited towards this purpose in the future works.
Acknowledgments
We gratefully acknowledge the support of the Office of Naval Research grant N0014-20-1-2253.
References
- [1] A. A. R. Townsend. The structure of turbulent shear flow. Cambridge University Press, 1976.
- [2] P. M. Bevilaqua and P. S. Lykoudis. Turbulence memory in self-preserving wakes. J. Fluid Mech., 89(3):589–606, 1978.
- [3] J. A. Redford, I. P. Castro, and G. N. Coleman. On the universality of turbulent axisymmetric wakes. J. Fluid Mech., 710:419–452, November 2012.
- [4] J.L. Ortiz-Tarin, S. Nidhan, and S. Sarkar. High-Reynolds-number wake of a slender body. J. Fluid Mech., 918:A30, July 2021.
- [5] S. Taneda. Visual observations of the flow past a sphere at Reynolds numbers between and . J. Fluid Mech., 85(1):187–192, March 1978.
- [6] S. Cannon, F. Champagne, and A. Glezer. Observations of large-scale structures in wakes behind axisymmetric bodies. Exp Fluids, 14(6):447–450, May 1993.
- [7] J. L. Ortiz-Tarin, K. C. Chongsiripinyo, and S. Sarkar. Stratified flow past a prolate spheroid. Phys. Rev. Fluids, 4(9):094803, September 2019.
- [8] G. R. Spedding. The evolution of initially turbulent bluff-body wakes at high internal Froude number. J. Fluid Mech., 337:283–301, April 1997.
- [9] A. M. Abdilghanie and P. J. Diamessis. The internal gravity wave field emitted by a stably stratified turbulent wake. J. Fluid Mech., 720:104–139, April 2013.
- [10] K. L. Rowe, P. J. Diamessis, and Q. Zhou. Internal gravity wave radiation from a stratified turbulent wake. J. Fluid Mech., 888:A25, April 2020.
- [11] G R Spedding. The streamwise spacing of adjacent coherent structures in stratified wakes. Phys. Fluids, 14(11):10, 2002.
- [12] P. Bonneton, J. M. Chomaz, and E. J. Hopfinger. Internal waves produced by the turbulent wake of a sphere moving horizontally in a stratified fluid. J. Fluid Mech., 254:23–40, September 1993.
- [13] Q. Lin, D. L. Boyer, and H. J. S. Fernando. Turbulent wakes of linearly stratified flow past a sphere. Phys. Fluids A: Fluid Dynamics, 4(8):1687–1696, 1992.
- [14] K. Chongsiripinyo and S. Sarkar. Decay of turbulent wakes behind a disk in homogeneous and stratified fluids. J. Fluid Mech., 885:A31, February 2020.
- [15] S. D. Muralidhar, B. Podvin, L. Mathelin, and Y. Fraigneau. Spatio-temporal proper orthogonal decomposition of turbulent channel flow. J. Fluid Mech., 864:614–639, April 2019.
- [16] L. I. Abreu, A. V. G. Cavalieri, P. Schlatter, R. Vinuesa, and D. S. Henningson. Spectral proper orthogonal decomposition and resolvent analysis of near-wall coherent structures in turbulent pipe flows. J. Fluid Mech., 900, 2020.
- [17] O. T. Schmidt, A. Towne, G. Rigas, T. Colonius, and G. A. Bres. Spectral analysis of jet turbulence. J. Fluid Mech., 855:953–982, November 2018.
- [18] S. Nidhan, J. L. Ortiz-Tarin, K. Chongsiripinyo, S. Sarkar, and P. J. Schmid. Dynamic Mode Decomposition of Stratified Wakes. In AIAA Aviation 2019 Forum, Dallas, Texas, June 2019. American Institute of Aeronautics and Astronautics.
- [19] S. Nidhan, K. Chongsiripinyo, O. T. Schmidt, and S. Sarkar. Spectral proper orthogonal decomposition analysis of the turbulent wake of a disk at Re = 50 000. Phys. Rev. Fluids, 5(12):124606, December 2020.
- [20] S. Nidhan, O. T. Schmidt, and S. Sarkar. Analysis of coherence in turbulent stratified wakes using spectral proper orthogonal decomposition. J. Fluid Mech., 934, 2022.
- [21] A. VanDine, K. Chongsiripinyo, and S. Sarkar. Hybrid spatially-evolving DNS model of flow past a sphere. Comput Fluids, 171:41–52, July 2018.
- [22] A. Towne, O. T. Schmidt, and T. Colonius. Spectral proper orthogonal decomposition and its relationship to dynamic mode decomposition and resolvent analysis. J. Fluid Mech., 847:821–867, 2018.
- [23] O. T. Schmidt and T. Colonius. Guide to spectral proper orthogonal decomposition. AIAA Journal, 58(3):1023–1033, 2020.
- [24] H. V. Fuchs, E. Mercker, and U. Michel. Large-scale coherent structures in the wake of axisymmetric bodies. J. Fluid Mech., 93(1):185–207, July 1979.
- [25] E. Berger, D. Scholz, and M. Schumm. Coherent vortex structures in the wake of a sphere and a circular disk at rest and under forced vibrations. J. Fluids Struct., 4(3):231–257, May 1990.
- [26] P. B. V. Johansson and W. K. George. The far downstream evolution of the high-Reynolds-number axisymmetric wake behind a disk. Part 2. Slice proper orthogonal decomposition. J. Fluid Mech., 555:387, May 2006.
- [27] J. C. Vassilicos. Dissipation in turbulent flows. Annu. Rev. Fluid Mech., 47(1):95–114, January 2015.
- [28] M. B. de Stadler, N. R. Rapaka, and S. Sarkar. Large eddy simulation of the near to intermediate wake of a heated sphere at Re=10,000. Int. J. Heat Fluid Fl., 49:2–10, October 2014.
- [29] P. B. V. Johansson, W. K. George, and S. H. Woodward. Proper orthogonal decomposition of an axisymmetric turbulent wake behind a disk. Phys. Fluids, 14(7):2508, 2002.