A Hardware-Aware System for Accelerating Deep Neural Network Optimization
Abstract
Recent advances in Neural Architecture Search (NAS) which extract specialized hardware-aware configurations (a.k.a. ”sub-networks”) from a hardware-agnostic ”super-network” have become increasingly popular. While considerable effort has been employed towards improving the first stage, namely, the training of the super-network, the search for derivative high-performing sub-networks is still largely under-explored. For example, some recent network morphism techniques allow a super-network to be trained once and then have hardware-specific networks extracted from it as needed. These methods decouple the super-network training from the sub-network search and thus decrease the computational burden of specializing to different hardware platforms. We propose a comprehensive system that automatically and efficiently finds sub-networks from a pre-trained super-network that are optimized to different performance metrics and hardware configurations. By combining novel search tactics and algorithms with intelligent use of predictors, we significantly decrease the time needed to find optimal sub-networks from a given super-network. Further, our approach does not require the super-network to be refined for the target task a priori, thus allowing it to interface with any super-network. We demonstrate through extensive experiments that our system works seamlessly with existing state-of-the-art super-network training methods in multiple domains. Moreover, we show how novel search tactics paired with evolutionary algorithms can accelerate the search process for ResNet50, MobileNetV3 and Transformer while maintaining objective space Pareto front diversity and demonstrate an 8x faster search result than the state-of-the-art Bayesian optimization WeakNAS approach.
1 Introduction
Artificial intelligence (AI) researchers are continually pushing the state-of-the-art by creating new deep neural networks (DNNs) for different application domains (e.g., computer vision, natural language processing). In many cases, the DNNs are created and evaluated on the hardware platform available to the researcher at the time (e.g., GPU). Furthermore, the researcher may have only been interested in a narrow set of performance metrics such as accuracy when evaluating the network. Therefore, the network is inherently optimized for a specific hardware platform and specific metrics.
However, users wanting to solve the same problem for which the network was designed may have different hardware platforms available and may be interested in different and/or multiple performance metrics (e.g., accuracy and latency). The performance of the network provided by the researcher is then suboptimal for these users.
Unfortunately, optimizing the network for the user’s hardware and performance metrics (a.k.a. objectives) is a time-consuming effort requiring highly specialized knowledge. Network optimization is typically done manually with a great deal of in-depth understanding of the hardware platform since certain hardware characteristics (e.g., clock speed, number of logical processor cores, amount of cache memory, amount of RAM) will affect the optimization process. The optimization process is also affected by the characteristics of the input data to the DNN (e.g., batch size, image size). Finally, any change to the performance objectives (e.g., going from latency to power consumption), input data characteristics (e.g., increasing the batch size), hardware characteristics (e.g., changing the number of dedicated logical cores) or hardware platform (e.g., going from GPU to CPU) would require starting this expensive optimization process again. With this in mind, we adopt a ”super-network” approach for addressing the hardware-aware model optimization task. This neural architecture search (NAS) approach generates a highly-diverse set of architectural options (a.k.a. sub-networks) for a reference architecture and allows us to exploit an extremely large search space to find optimal models for a particular hardware and objective setting. Additionally, this approach offers insight into what constitutes an optimal model for a given hardware setting.
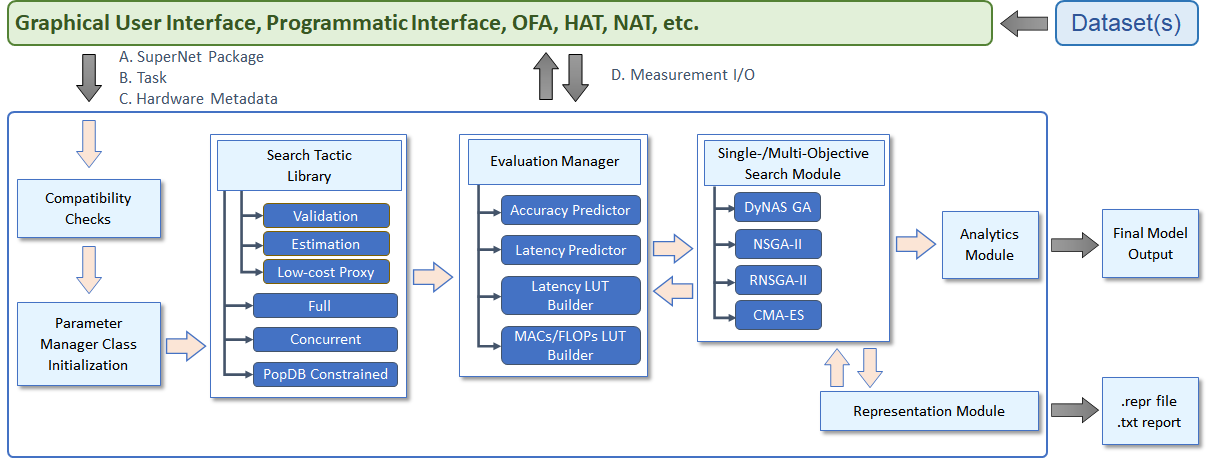
We propose an overall system design (Figure 1) which allows users to automatically and efficiently find networks that are optimized for their hardware platform. This design also works jointly with any existing or future super-network framework. In this work, demonstrate its application in the image classification and machine translation domains using the Once-For-All (OFA) [1] and Hardware-Aware Transformers (HAT) [2] super-network frameworks respectively. Our solution provides DNN architectures applicable to specified application domains and optimized for specified hardware platforms in significantly less time than could be done manually.
In this work, our primary contributions (1) demonstrate a modular and flexible system for accelerating sub-network discovery for any super-network framework, (2) examine why models need to be re-optimized based on the hardware platform, (3) show the efficiency of evolutionary algorithms for generating a diverse set of models, (4) demonstrate an accelerated approach to finding optimal sub-networks termed ConcurrentNAS, and (5) propose a novel unsupervised methodology to automatically reduce the search space termed PopDB.
2 Related Work
Many state-of-the-art neural architecture search (NAS) methods focus on decreasing the time required to find optimal models. Some of these approaches use the concept of a super-network, that is, a structure from which smaller sub-networks can be extracted. A recent approach, OFA, significantly reduces the time required for the search stage by decoupling training and search. Efficient mechanisms, such as accuracy, latency, and FLOPs predictors are used to speed up the search, avoiding the need for evaluating large portions of the model space which, depending on the sample size, is often unfeasible. The main focus of OFA was on computer vision architectures (MobileNetV3, ResNet50).
There have been attempts from the same research group to extend the OFA approach to Natural Language Processing (NLP). Hardware-aware Transformers (HAT) [2] achieve this goal by extending network elasticity to this domain. In HAT, the authors introduce arbitrary encoder-decoder attention, to break the information bottleneck between the encoder and decoder layers in Transformers [3]. Additionally, they propose heterogenous transformer layers to allow for different layers to have different parameters. Using these techniques for constructing the design space, HAT discovers efficient models for different hardware platforms.
The main limiting factor to improving sub-network search is the size of the model space which is defined by the elastic parameters (i.e., the super-network parameters which vary in sub-networks) and the values they can take. There are two themes in research to address this problem: find ways to improve the search time and find ways to reduce the search space complexity. SemiNAS uses a encoder-predictor-decoder framework with LSTMs to predict the accuracy of architectures but is limited to a single-objective context [4]. LaNAS recursively partitions the search space based on the sub-network performance [5]. Recently, WeakNAS [6] demonstrated that SemiNAS and LaNAS give sub-optimal performance and showed how Bayesian optimization paired with weak predictors could be used to accelerate the sub-network search. In the results section we benchmark against WeakNAS to demonstrate the efficiency of our system. Many works such as OFA and WeakNAS take the approach of first training predictors and followed by search where an optional fine-tuning phase of the discovered sub-networks is used to push those models to achieve state-of-the-art performance. Neural Architecture Transfer (NAT) takes a creative approach to training super-networks by using genetic algorithms to inform configurations of the super-network on which to focus training [7] and show benefits over the related NSGA-Net work [8]. However, this approach is tied to the hardware platform the super-network is trained on and would require full training to be redone if the resulting super-network was deployed on a different platform (e.g., trained on GPU, deployed onto Raspberry Pi). Our solution stands outside of the super-network training and fine-tuning mechanics in order to make it generally compatible with any arbitrary super-network framework. It could be jointly used with a NAT approach to inform the training process or used with the popular OFA and HAT approaches to accelerate the post-training sub-network search.
A successful approach to reduce the search space complexity based on principles introduced by [9], is CompOFA [10]. CompOFA uses the relationships between elastic parameters to avoid exploring large areas of the model space, significantly improving the time required to find optimal sub-networks. However, the CompOFA approach trades off objective space accuracy due to the search space reduction, requires the supervised application of model architecture-specific expertise and would not translate clearly to other domains.
3 System Description
Given the growing popularity of super-network DNN architectures across a plethora of machine learning problem domains, we describe a flexible hardware-aware super-network search system in Figure 1. For an arbitrary super-network framework and objective space (accuracy, latency, multiply-accumulates (MACs), etc.), our system automates the architecture search process and extracts sub-networks which are optimal for a set of one or more objectives. The system can be interfaced with popular super-network NAS approaches, such as OFA, and can be used in both during training search (e.g., NAT) and post-training search (e.g., HAT) scenarios. The system also works well with off-the-shelf pre-trained super-networks for cases where a user does not have the capability to run training or fine-tuning on their end. Further, if the same super-network topology is used across multiple hardware configurations, the statistical representations of the elastic parameters along with the optimal Pareto front can be used to inform the next sub-network search via warm-start or constrained search approaches which are described in the following sections.
The key sub-network search components of the system are the search tactic library, evaluation manager, and the search module. The search tactic library offers a variety of choices for how to treat the high-level flow of the search such as determining how objectives will be measured (e.g., validation, estimation, proxy) while the other aspect relates to the search flow of the evaluation manager and search module (e.g., full search, concurrent search). For this work, we refer to a measurement of the one or more objectives of a sub-network as an evaluation where a validation evaluation is the actual measurement of an objective and a prediction evaluation is the predicted measurement of an objective. Additionally, proxy scores can be used as a simple heuristic of performance such a model parameter counts or scores such as work by [11]. The evaluation manager handles requests for validation measurement data from the attached super-network framework (e.g., sub-network accuracy and latency) and handles the predictor training and/or look-up table (LUT) construction. The search module handles the system library of single- and multi-objective evolutionary search algorithms (MOEAs) and their associated tuning parameters (e.g., mutation rate, crossover rate, etc.). Other peripheral modules are the analytics module which automates the plotting and descriptive statistics about the search results and the representation module which stores information about past searches and analyses. We describe the details of these system components in more detail in the next section.
4 Methods
In this section we describe the details of the system components and provide the methodologies for the various search tactics. To demonstrate our system on the sub-network search task, we start by showing the use of multi-objective evolutionary algorithm (MOEA) approaches, specifically NSGA-II [12]. Next, we highlight the use of warm-start search which works by taking the best sub-network population from a previous NAS run, and using that population as the seed for a different search on a different hardware configuration. Finally, we highlight a novel approach to sub-network search acceleration called ConcurrentNAS that leverages the capabilities of weakly trained predictors to minimize the number of validation measurements. Through these examples we demonstrate how our system can accelerate the sub-network search process when interfaced with existing NAS approaches such as OFA and HAT.
4.1 Problem Formulation
Consider a pre-trained super-network with weights , a set of sub-network architectural configurations derived from the super-network and competing objectives where . Each of the sub-network configurations is a valid set of parameters used during training of the super-network. For example, a given will contain values used for each elastic depth and kernel size during super-network training. Our system aims to minimize the objectives to find an optimal sub-network . In other words,
| (1) |
In the case of maximizing an objective (e.g., accuracy), the objectives can be negated to transform it to a minimization problem. During optimization, multiple will be found in different regions of the objective space and form a Pareto front. It is this set of optimal sub-networks that are the points on the Pareto front illustrated in Figure 2.
In later comparative studies we use the hypervolume indicator [13] to measure how well the Pareto front approximates the optimal solution as shown in Figure 2. When measuring two objectives, the hypervolume term represents the dominated area of the Pareto front. In the results, we refer to the search solution that has saturated after many evaluations as the near-optimal Pareto front.

OFA offers super-networks based on the ResNet50 [14] and MobileNetV3 [15] architectures, while HAT provides a machine translation model that we call the Transformer super-network. The size of the search space of sub-networks derived from the MobileNetV3 super-network is and for the Transformer super-network.
4.2 Evolutionary Algorithms
In this work we focus on applying multi-objective evolutionary algorithm (MOEA) approaches to the sub-network search problem due to our own success with such approaches and those shown by [7] and [8]. We choose to use multi-objective (two objectives) over single or many-objective approaches as they are easily interpreted from a Pareto front visual standpoint, but note that our system works with any number of objectives. We limit the MOEA algorithm to NSGA-II for consistency of results and modify the base algorithm to ensure that unused parameters in the search space (e.g., lower block depth can mean other elastic parameters are not used) are accounted for when preventing duplicates. In short, NSGA-II is a generational loop process whereby a population of individuals (sub-networks encoded in terms of the elastic parameters of the super-network) undergo variation via crossover and mutation to create a child population, followed by non-dominated sorting with diversity preservation to select the next generation’s population. For this work, we use a mutation rate of and a crossover rate of 0.9. We also note that RNSGA-II [16], MO-CMA-ES [17], and AGE-MOEA [18] have been successfully tested with the system. Furthermore, our system allows for the end-user to apply their own optimization algorithms while still leveraging the other components (e.g., search tactics, evaluation module) of the system. For a detailed survey and overview of evolutionary algorithms, we point the reader to work by [19].
4.3 Predictors
Since validation evaluations of performance objectives, such as top-1 accuracy and latency, require a large amount of time, we follow the work in [1] and [2] and employ predictors. More specifically, we predict top-1 accuracy of sub-networks derived from ResNet50 and MobileNetV3 super-networks, BLEU score of sub-networks derived from Transformer super-networks and latency of sub-networks derived from all three super-networks. However, unlike prior work which use multi-layer perceptrons (MLPs) to perform prediction, we employ much simpler methods such as ridge and support vector machine regression (SVR) predictors. The authors of [7] and [20] have found that MLPs are inferior to other methods of prediction for low training example counts. We have found that these simpler methods converge more quickly, require fewer training examples and require much less hyper-parameter optimization than MLPs. The combination of accuracy / latency prediction and using simple predictors allows us to significantly accelerate the selection of sub-networks with minimal prediction error. See Section 5.4 for a detailed analysis of our predictor performance.
4.4 Full Search
In our system, full search means that objective predictors (e.g., accuracy, latency) are first trained from a sampling of measurements (random or supervised) from the super-network architecture space followed by an extensive search using those predictors to estimate architecture performance in the objective space. For example, a full search approach could consist of training accuracy and latency predictors on a GPU platform, and then running a NSGA-II search using these predictors. Another approach is using full search with a warm-start population derived from the most optimal population from another completed search. In our results we show that a full search with warm-start can accelerate the search process by an order of magnitude.
4.5 Concurrent Search
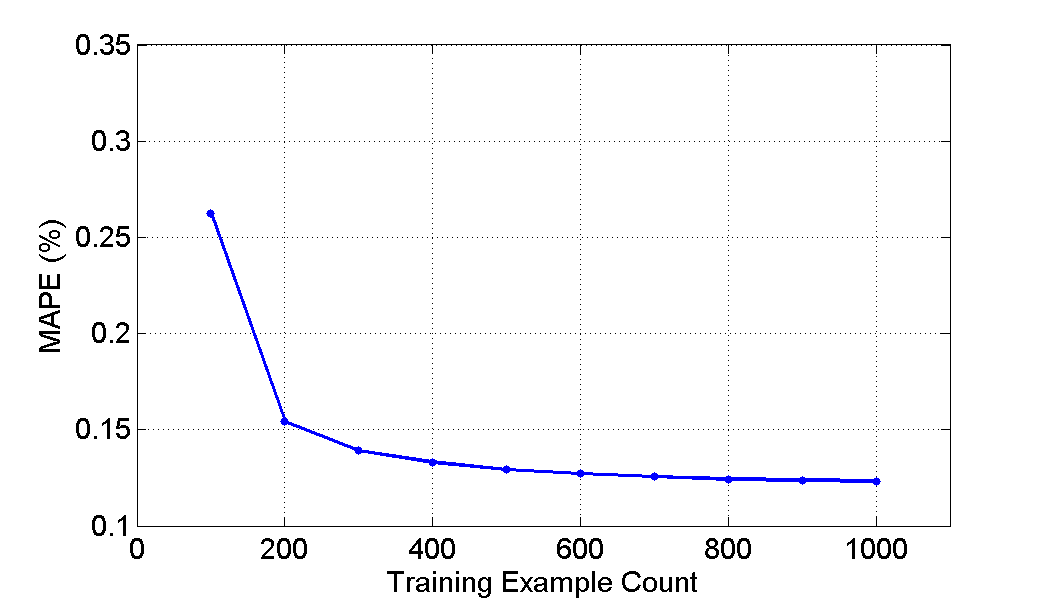
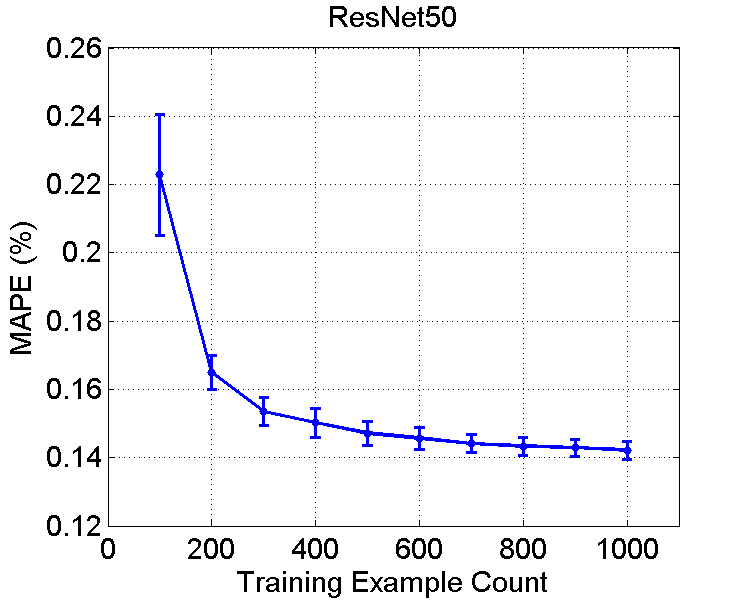
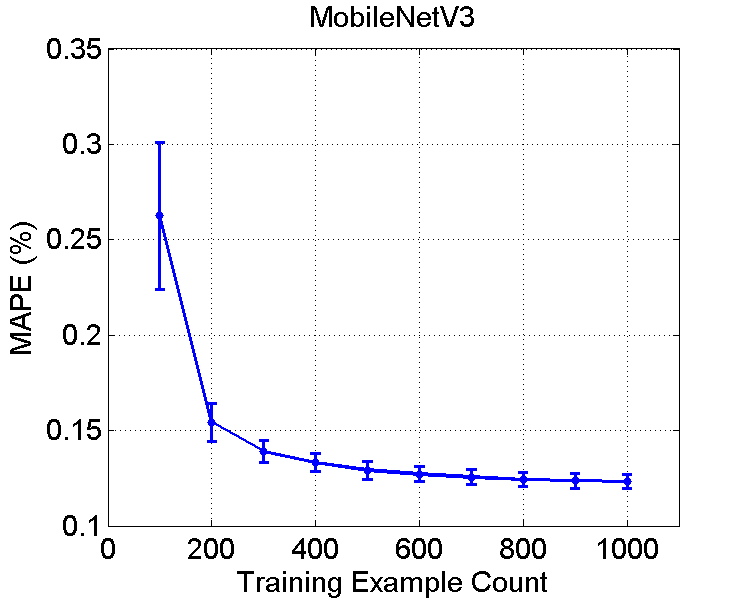
While using trained predictors can speed up the post-training search process, there is still a substantial cost to training predictors as the number of training samples is usually between 1000 and 4000 samples [1]. In the scenario where compute resources are limited, the goal is to reduce the number of validation measurements as much as possible. As shown in Figure 3, the accuracy predictor can achieve acceptable mean absolute percentage error (MAPE) in as few as 100 training samples. We build on this insight that weak predictors can offer value during search even when searching holistically across the full Pareto front range. We term this approach concurrent neural architecture search (ConcurrentNAS) since we are iteratively searching with and training a predictor as described in Algorithm 1. We first take either a randomly sampled or warm-start population to serve as the initial ConcurrentNAS population and then measure each objective score for the individuals (sub-networks) in the population and store the result. The result is combined with all previously saved results and used to train a ”weak” predictor. By weak predictor we imply a predictor that has been trained on a relatively small number of training samples. For each iteration, we run a full evolutionary algorithm search (NSGA-II in this work) using the predictor for a high number of generations (e.g., ) to let the algorithm explore the weak predictor objective space sufficiently. Finally, we select the best sub-networks from the evolutionary search to inform the next round of predictor training and so on until the iteration criterion is met or an end-user decides sufficient sub-networks have been identified. We note that a ConcurrentNAS approach can be applied with any single-, multi-, or many-objective evolutionary algorithm and generalizes to work with any super-network framework. Additionally, it provides the flexibility for changing evolutionary parameter tuning parameters as the iterations progress and allows for constraining a subset of objectives to validation evaluations only.
4.6 Population Density-Based Constraints
In order to minimize the number of samples required to reach the optimal Pareto front during search, we aim to construct a smaller architecture search space . We describe here a method for constructing the reduced search space in an unsupervised fashion for a family of hardware platforms that share similar characteristics to a single platform which we have already optimized.
Density-based clustering [21, 22] groups points that are packed tightly together in the feature space and are assigned a non-negative label. During clustering, these methods mark outlier points as noise.
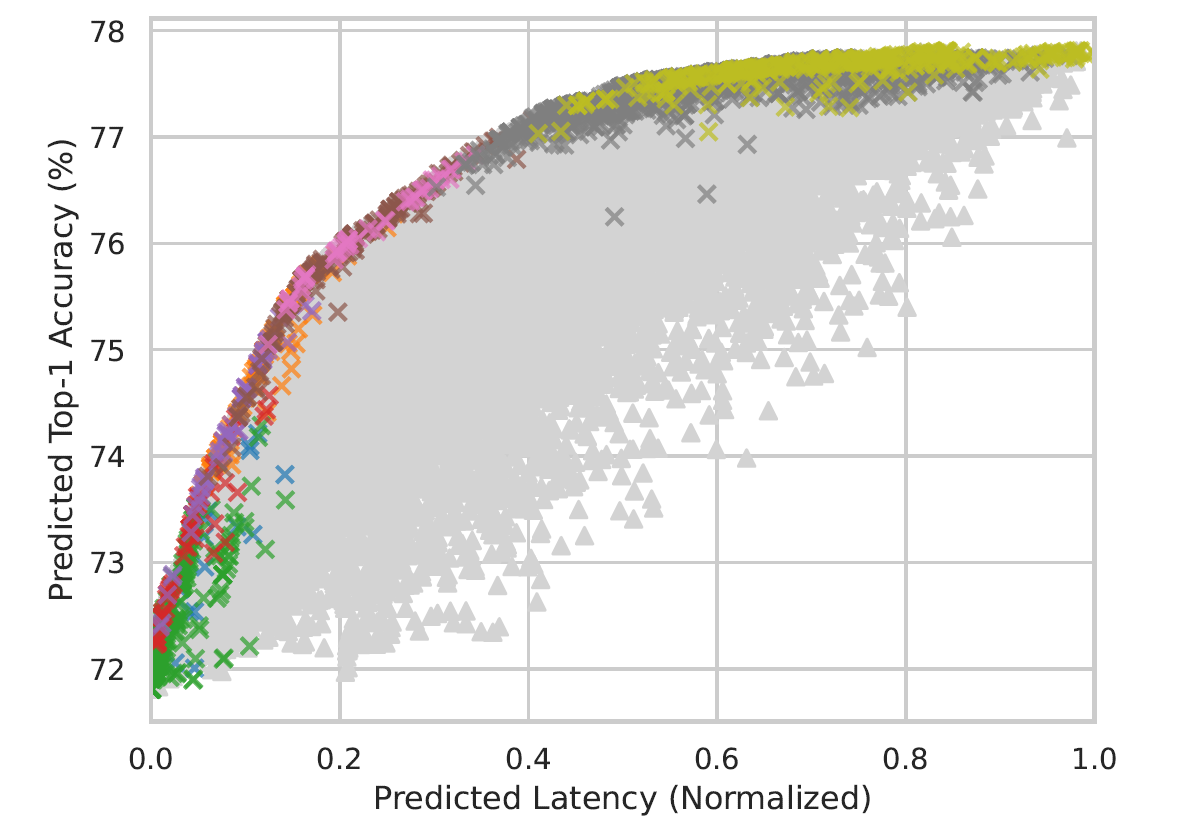
In practice, clustering using HDBSCAN over the history of full search over a platform will find the heavily explored regions of the search space. This occurs because, due to the evolutionary algorithm, populations will be heavily concentrated around regions of the search space that show good performance along the Pareto front. This tendency to cluster points along the front is shown in Figure 4.
We compute the relative frequencies of all elastic parameters values belonging to non-noise clusters. Then, for every elastic parameter, particular values are excluded from the constrained search space if they do not exceed a threshold defined for that elastic parameter.
We refer to this method of constructing a smaller architecture search space that uses the population densities as population density-based (PopDB) constraints.
4.7 Test Platforms and Considerations
In this work we use both CPU and GPU platforms for evaluating our system. The hardware platforms and their characteristics are shown in Table 1.
| Name | Memory |
|
|
||||
|---|---|---|---|---|---|---|---|
| Intel® Xeon® Platinum 8180 | 192 GB | 56 | Skylake (SKX) | ||||
| Intel® Xeon® Platinum 8280 | 192 GB | 56 | Cascade Lake (CLX) | ||||
| NVIDIA® Tesla® V100 | 32 GB | 32 | Skylake (SKX) | ||||
| NVIDIA® Tesla® A100 | 32 GB | 32 | Cascade Lake (CLX) |
Since our results have latency objective metrics from different manufacturers and there are possible proprietary issues in sharing what could be perceived as official benchmark data, we normalize latencies to be within . More specifically, the normalized latency is given by
| (2) |
where is the unnormalized latency, is the minimum unnormalized latency and is the maximum unnormalized latency. Using normalized latency does not change the underlying search results we are demonstrating. For comparative latency performance metrics related to our test platforms, we point the reader to the MLCommons111https://mlcommons.org benchmark suite.
5 Results
A primary goal of our system is to accelerate the sub-network search to address the issue that various hardware platforms and hardware configurations have uniquely optimal sub-networks in their respective super-network parameter search spaces. Figure 5 shows that an optimal set of sub-networks found on a CPU platform may not transfer to the optimal objective region on a GPU platform and vice versa. Furthermore, within a hardware platform, Figure 6 shows that sub-network configurations found to be optimal to one CPU hardware configuration (e.g., batch size = 1, thread count = 1), do not transfer optimally to other hardware batch size / thread count configurations.


5.1 Full Search
The sub-network search progression using our system’s modified NSGA-II approach is illustrated across various super-networks as shown in Figure 7. The initial population of the genetic algorithm is randomly sampled from the super-network parameter space as a starting point. As the search progresses through the crossover/mutation and non-dominated diversity preserving sorting, a progression towards the optimal solution region is observed. Both MobileNetV3 and ResNet50 super-networks, being image classification based, show a similar progression in the search whereas the Transformer super-network shows set of discrete clusters that arise due to the different number of decoder layers in the sub-networks.
One insight from Figure 6 is that while the ”best” sub-networks found on one hardware configuration do not always translate to the near-optimal Pareto region for another, they could be used as an initial population for a new search on a different hardware setup. The transferable population or ”warm-start” approach is shown in Figure 8. The biggest advantage of warm-start is that it gives a starting population that spans the full range of the objective space region and thus introduces a diverse and better performing population at the start. Due to the crossover/mutation mechanics of the genetic algorithm search, there are still sub-networks that are sampled behind the warm-start front, but the density of those samples is far less than a randomly initialized NSGA-II search.


5.2 Concurrent Search
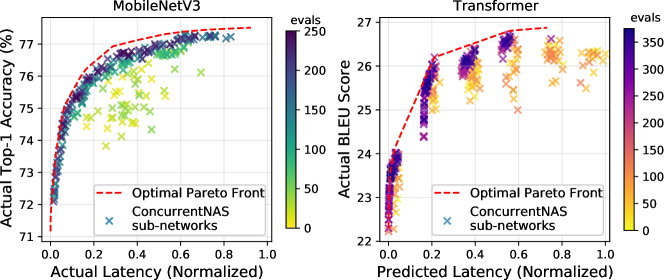
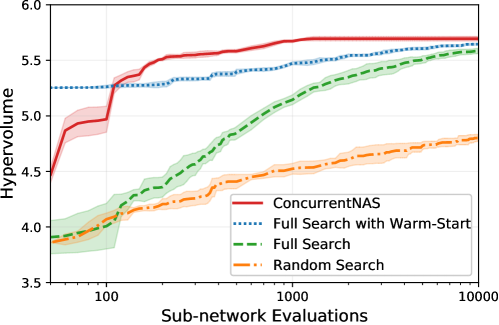
The main goal of ConcurrentNAS is to reduce the total number of validation measurements required to find optimal model architectures for a given super-network. Additionally, a ConcurrentNAS approach offers the benefit of providing the actual validation population results. Figure 9 shows the evolution of the concurrent search of sub-networks derived from MobileNetV3 and Transformer super-networks respectively where as opposed to Figure 7, the sub-network search accelerates towards the near-optimal Pareto front in only a few generations. The ConcurrentNAS validation measurement cost in evaluations versus hypervolume when compared across approaches is shown in Figure 10. As expected a full validation-only search approach with a warm-start population immediately translates to a larger hypervolume in early evaluations. A full search with 10,000 evaluations or more would eventually catch up to the warm-start approach. A more important observation is how quickly ConcurrentNAS overtakes full search, since each concurrent validation population represents the best ”learned” objective space information from the predictors. This highlights how rapidly sub-network search can be accelerated and the usefulness of ConcurrentNAS when optimizing for many hardware platforms and configurations.
For a comparative benchmark, we evaluate the total number of validation evaluations needed by ConcurrentNAS against those of WeakNAS [6] for the pre-trained OFA MobileNetV3-w1.2 super-network. Figure 11 shows the sub-networks identified in 800 and 1000 evaluations by WeakNAS versus those found by ConcurrentNAS in only 100 evaluations. Table 2 shows the post-search (but prior to fine-tuning) metrics for validation evaluations, top-1 accuracy, and MACs between approaches. We limit the comparison in Table 2 to the pre-trained OFA MobileNetV3-w1.2 super-network that was used by WeakNAS. It is important to note that state-of-the-art accuracy results shown by WeakNAS and OFA represent specific post-search fine-tuning approaches that increase the accuracy of the identified sub-networks.

| Approach |
|
|
|
||||||
|---|---|---|---|---|---|---|---|---|---|
| WeakNAS | 1000 | 78.71 | 484 | ||||||
| WeakNAS | 800 | 78.70 | 513 | ||||||
| ConcurrentNAS | 100 | 78.81 | 478 |
5.3 PopDB Search Space Reduction
In Figure 12 we show the measured hypervolume of a ConcurrentNAS search on MobileNetV3 using a constrained search space with size (see Section 4.6). The threshold was set to for all elastic parameters. With this threshold out of kernel size, out of width, and out of depth elastic parameters had values eliminated from the search space. This suggests that kernel sizes of the MobileNetV3 super-network is more invariant across platforms than either depth or width. We observed the effect of a constrained search space as a faster increase in hypervolume during search. Both constrained and unconstrained searches converge to close to the same maximum hypervolume, and that this is consistent across the hardware platforms we considered.

5.4 Predictor Analysis
As described in Section 4.3, our work makes extensive use of predictors to accelerate the selection of sub-networks, particularly in the case of concurrent search (see Section 4.5). Predictors are necessary since performing actual measurements of metrics such as accuracy or latency would be prohibitively slow. In light of their importance, a better understanding of their performance is needed.
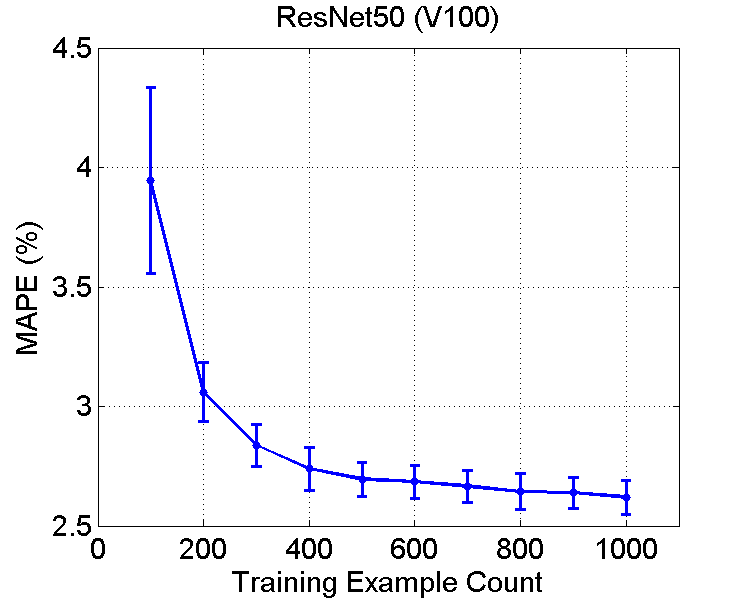
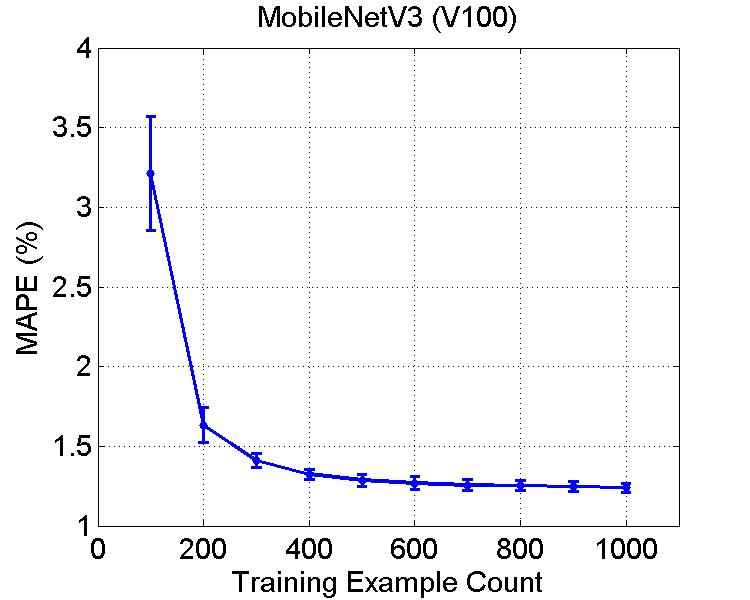
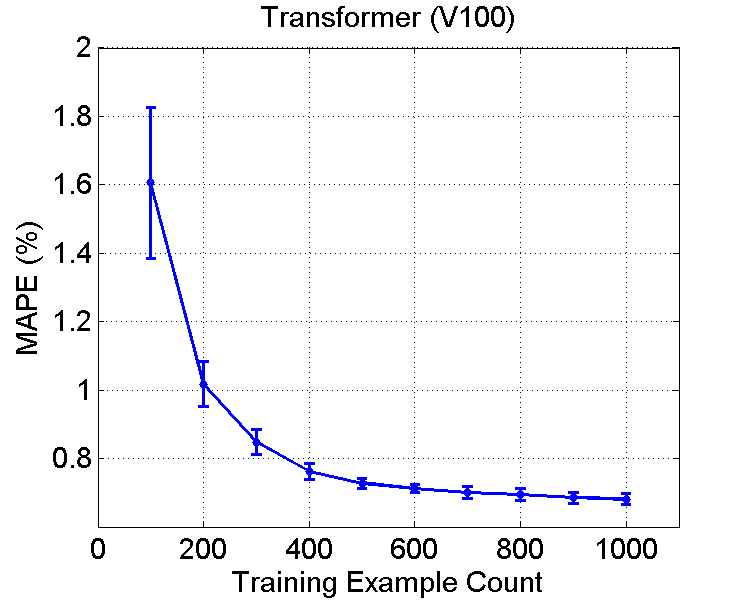
The analysis of the predictors is performed over a number of different trials to account for variance in the results. In each trial, the data sets for each predictor are first split into train and test sets. Subsets of the train data set with 100 to 1000 examples are used to train the predictor. For a given trial, the same test set with 500 examples is then used to compute the prediction mean absolute percentage error (MAPE). This process is repeated for a total of 10 trials.
5.4.1 Accuracy Prediction
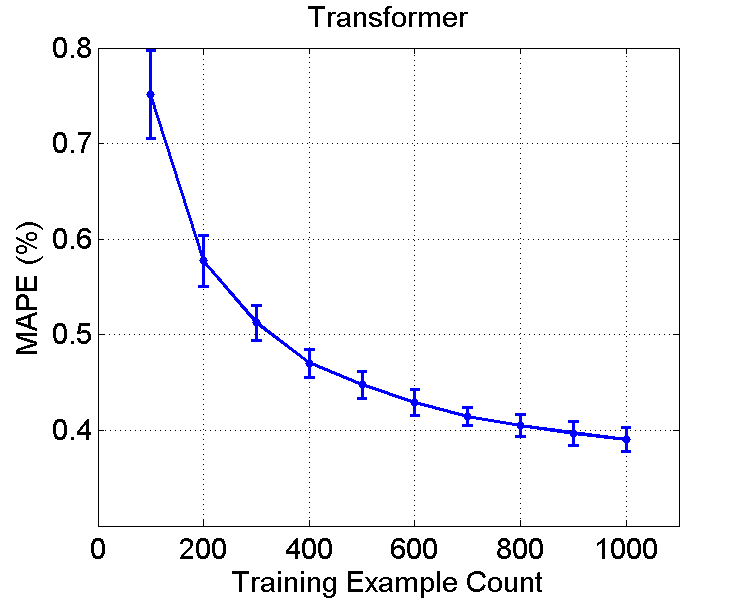
We use a ridge predictor to perform top-1 accuracy prediction for sub-networks derived from ResNet50 and MobileNetV3 super-networks and a support vector machine regression (SVR) predictor to perform bilingual evaluation understudy (BLEU) [23] score prediction for sub-networks derived from the Transformer super-network. The MAPE of these predictors as a function of the number of training examples is shown in Figure 13. In each case, the predictors demonstrate low MAPE for small training example counts and fast convergence.
To visualize accuracy of the predictors, the correlation between actual and predicted top-1 accuracies / BLEU scores are shown in Figure 14. Along with each correlation is the associated Kendall rank correlation coefficient . The actual and predicted accuracies are highly correlated and distributed tightly around the ideal correlation line.


5.4.2 Latency Prediction
Not only do we predict accuracy to accelerate the sub-network search, we employ latency prediction to further decrease search time. Latency prediction is preferable to LUTs, since a given LUT will be highly specialized to a hardware platform / configuration. Also, trained predictors are, in general, more tolerant to noise in the measurements.
Similar to the analysis described in Section 5.4.1, we use a ridge predictor to perform latency prediction for sub-networks derived from ResNet50, MobileNetV3 and Transformer super-networks. The MAPE of the predictor for an NVIDIA V100 as a function of the number training examples is shown in Figure 15. Much like the results for accuracy prediction, the latency predictor demonstrates both fast convergence and low MAPE for few training samples.
The values between actual and predicted latencies of sub-networks derived from ResNet50, MobileNetV3 and Transformer super-networks along with different hardware platforms are shown in Table 3. The latency predictor is highly accurate and produces values greater than 0.86 for all combinations.
| SKX | CLX | V100 | A100 | |
|---|---|---|---|---|
| ResNet50 | 0.8984 | 0.8690 | 0.8675 | 0.8637 |
| MobileNet | 0.9821 | 0.9826 | 0.9311 | 0.9360 |
| Transformer | 0.9206 | 0.8999 | 0.9180 | 0.8838 |
6 Conclusion
We have proposed and demonstrated a comprehensive system that more efficiently finds a diverse set of sub-networks from a pre-trained super-network than prior methods. By applying our system to a multi-objective (e.g., latency and accuracy) performance space, we have significantly accelerated the search of these sub-networks using novel tactics and algorithms and highly accurate objective predictors. Further, we have shown that even for a given hardware platform (e.g., CPU or GPU), the hardware configuration (e.g., number of threads) must be considered during the search / optimization process. Our approach does not require the super-network to be refined for the target task a priori. We have shown that it interfaces seamlessly with state-of-the-art super-network training methods OFA and HAT. Finally, we have shown that sub-network search is 8x faster with ConcurrentNAS than state-of-the-art WeakNAS approach, and we further accelerate the search with our proposed unsupervised search space reduction technique PopDB.
References
- [1] Han Cai, Chuang Gan, Tianzhe Wang, Zhekai Zhang, and Song Han. Once-for-all: Train one network and specialize it for efficient deployment. arXiv preprint arXiv:1908.09791, 2019.
- [2] Hanrui Wang, Zhanghao Wu, Zhijian Liu, Han Cai, Ligeng Zhu, Chuang Gan, and Song Han. Hat: Hardware-aware transformers for efficient natural language processing. arXiv preprint arXiv:2005.14187, 2020.
- [3] Ashish Vaswani, Noam Shazeer, Niki Parmar, Jakob Uszkoreit, Llion Jones, Aidan N. Gomez, Lukasz Kaiser, and Illia Polosukhin. Attention is all you need, 2017.
- [4] Renqian Luo, Xu Tan, Rui Wang, Tao Qin, Enhong Chen, and Tie-Yan Liu. Semi-supervised neural architecture search. CoRR, abs/2002.10389, 2020.
- [5] Linnan Wang, Saining Xie, Teng Li, Rodrigo Fonseca, and Yuandong Tian. Sample-efficient neural architecture search by learning action space, 2021.
- [6] Junru Wu, Xiyang Dai, Dongdong Chen, Yinpeng Chen, Mengchen Liu, Ye Yu, Zhangyang Wang, Zicheng Liu, Mei Chen, and Lu Yuan. Stronger nas with weaker predictors, 2021.
- [7] Zhichao Lu, Gautam Sreekumar, Erik Goodman, Wolfgang Banzhaf, Kalyanmoy Deb, and Vishnu Naresh Boddeti. Neural architecture transfer. IEEE Transactions on Pattern Analysis and Machine Intelligence, 43(9):2971–2989, Sep 2021.
- [8] Zhichao Lu, Ian Whalen, Vishnu Boddeti, Yashesh Dhebar, Kalyanmoy Deb, Erik Goodman, and Wolfgang Banzhaf. Nsga-net: Neural architecture search using multi-objective genetic algorithm, 2019.
- [9] Mingxing Tan and Quoc Le. EfficientNet: Rethinking model scaling for convolutional neural networks. In Kamalika Chaudhuri and Ruslan Salakhutdinov, editors, Proceedings of the 36th International Conference on Machine Learning, volume 97 of Proceedings of Machine Learning Research, pages 6105–6114. PMLR, 09–15 Jun 2019.
- [10] Manas Sahni, Shreya Varshini, Alind Khare, and Alexey Tumanov. Compofa: Compound once-for-all networks for faster multi-platform deployment. arXiv preprint arXiv:2104.12642, 2021.
- [11] Joseph Mellor, Jack Turner, Amos Storkey, and Elliot J. Crowley. Neural architecture search without training, 2021.
- [12] Kalyanmoy Deb, Amrit Pratap, Sameer Agarwal, and TAMT Meyarivan. A fast and elitist multiobjective genetic algorithm: Nsga-ii. IEEE transactions on evolutionary computation, 6(2):182–197, 2002.
- [13] Eckart Zitzler and Lothar Thiele. Multiobjective evolutionary algorithms: a comparative case study and the strength pareto approach. IEEE transactions on Evolutionary Computation, 3(4):257–271, 1999.
- [14] Kaiming He, Xiangyu Zhang, Shaoqing Ren, and Jian Sun. Deep residual learning for image recognition. arxiv 2015. arXiv preprint arXiv:1512.03385, 2015.
- [15] Andrew Howard, Mark Sandler, Grace Chu, Liang-Chieh Chen, Bo Chen, Mingxing Tan, Weijun Wang, Yukun Zhu, Ruoming Pang, Vijay Vasudevan, et al. Searching for mobilenetv3. In Proceedings of the IEEE/CVF International Conference on Computer Vision, pages 1314–1324, 2019.
- [16] Kalyanmoy Deb and J. Sundar. Reference point based multi-objective optimization using evolutionary algorithms. In Proceedings of the 8th Annual Conference on Genetic and Evolutionary Computation, GECCO ’06, page 635–642, New York, NY, USA, 2006. Association for Computing Machinery.
- [17] Christian Igel, Nikolaus Hansen, and Stefan Roth. Covariance matrix adaptation for multi-objective optimization. Evolutionary computation, 15:1–28, 02 2007.
- [18] Annibale Panichella. An adaptive evolutionary algorithm based on non-euclidean geometry for many-objective optimization. In Proceedings of the Genetic and Evolutionary Computation Conference, GECCO ’19, page 595–603, New York, NY, USA, 2019. Association for Computing Machinery.
- [19] Michael T. Emmerich and André H. Deutz. A tutorial on multiobjective optimization: Fundamentals and evolutionary methods. Natural Computing: An International Journal, 17(3):585–609, September 2018.
- [20] Anonymous. What to expect of hardware metric predictors in NAS. In Submitted to The Tenth International Conference on Learning Representations, 2022. under review.
- [21] Martin Ester, Hans-Peter Kriegel, Jörg Sander, Xiaowei Xu, et al. A density-based algorithm for discovering clusters in large spatial databases with noise. In KDD’96, pages 226–231. AAAI Press, 1996.
- [22] Ricardo JGB Campello, Davoud Moulavi, and Jörg Sander. Density-based clustering based on hierarchical density estimates. In Pacific-Asia conference on knowledge discovery and data mining, pages 160–172. Springer, 2013.
- [23] Kishore Papineni, Salim Roukos, Todd Ward, and Wei Jing Zhu. Bleu: a method for automatic evaluation of machine translation. In Proceedings of the 40th annual meeting of the Association for Computational Linguistics, pages 311–318, 10 2002.