Precise Q value measurements of 112,113Ag and 115Cd with the Canadian Penning trap for evaluation of potential ultra-low Q value -decays
Abstract
- Background
-
An ultra-low Q value -decay can occur from a parent nuclide to an excited nuclear state in the daughter such that 1 keV. These decay processes are of interest for nuclear -decay theory and as potential candidates in neutrino mass determination experiments. To date, only one ultra-low Q value -decay has been observed—that of 115In with = 147(10) eV. A number of other potential candidates exist, but improved mass measurements are necessary to determine if these decay channels are energetically allowed and, in fact, ultra-low.
- Purpose
-
To perform precise -decay Q value measurements of 112,113Ag and 115Cd and to use them in combination with nuclear energy level data for the daughter isotopes 112,113Cd and 115In to determine if the potential ultra-low Q value -decay branches of 112,113Ag and 115Cd are energetically allowed and 1 keV.
- Method
-
The Canadian Penning Trap at Argonne National Laboratory was used to measure the cyclotron frequency ratios of singly-charged 112,113Ag and 115Cd ions with respect to their daughters 112,113Cd and 115In. From these measurements, the ground-state to ground-state -decay Q values were obtained.
- Results
-
The 112Ag 112Cd, 113Ag 113Cd, and 115Cd 115In -decay Q values were measured to be (112Ag) = 3990.16(22) keV, (113Ag) = 2085.7(4.6) keV, and (115Cd) = 1451.36(34) keV. These results were compared to energies of excited states in 112Cd at 3997.75(14) keV, 113Cd at 2015.6(2.5) and 2080(10) keV, and 115In at 1448.787(9) keV, resulting in precise values for the potential decay channels of –7.59(26) keV, 6(11) keV, and 2.57(34) keV, respectively.
- Conclusion
-
The potential ultra-low Q value decays of 112Ag and 115Cd have been ruled out. 113Ag is still a possible candidate until a more precise measurement of the 2080(10) keV, 1/2+ state of 113Cd is available. In the course of this work we have found the ground state mass of 113Ag reported in the 2020 Atomic Mass Evaluation [Wang, et al., Chin. Phys. C 45, 030003 (2021)] to be lower than our measurement by 69(17) keV (a 4 discrepancy).
I Introduction
Nuclear -decays offer insight into the underlying weak interaction processes that govern them, and the in-medium effects that modify them due to their occurrence inside the atomic nucleus Severijns et al. (2006); Haaranen et al. (2016). The majority of unstable nuclides known to exist decay via allowed -decay and have relatively large Q values. This results in them having typically short lifetimes, and making them fairly straight-forward to observe. However, there are a number of isotopes with low -decay Q values and/or high forbiddenness, which results in them having much longer half-lives. These isotopes are important tools for applications such as direct neutrino mass determination experiments e.g. Aker et al. (2019); Gastaldo et al. (2017); Alpert et al. (2015); Arnaboldi et al. (2003), and radioactive dating e.g. Chechev (2011). It is also important to categorize and understand these rare decays since they can contribute to backgrounds in other rare event experiments, such as neutrinoless double -decay (0) and dark matter searches Kostensalo and Suhonen (2018). They also provide a testing ground for nuclear theory under atypical conditions Mustonen and Suhonen (2010a).
Ground-state to ground-state (gs–gs) -decays have Q values covering a wide energy range from 2.5 keV up to 10 MeV. However, under special circumstances, such as a decay from the ground state of the parent nuclide to a nearby excited state in the daughter, the Q value can be much lower. Such a decay, with 1 keV, is known as an ultra-low (UL) Q value -decay Mustonen and Suhonen (2010b).
To date, the only known UL Q value -decay is that of the 115In(9/2+) ground state to the 115Sn(3/2+) first excited state. This decay was discovered by Cattadori, et al. at the Laboratori Nazionali del Gran Sasso in 2005 Cattadori et al. (2004), and was later confirmed at the HADES underground laboratory in 2009 Wieslander et al. (2009a); Andreotti et al. (2011). In these experiments, the 115In(9/2+) 115Sn(3/2+) -decay was inferred via the detection of the 497.5 keV -ray emitted from the = 11 ps, 3/2+ state. Precise Penning trap measurements of the 115In – 115Sn mass difference by groups at Florida State University Mount et al. (2009) and the University of Jyväskylä Wieslander et al. (2009b), combined with the precisely known energy of the 115Sn(3/2+) state, showed that this decay is energetically allowed with a value of 147(10) eV 111Here we use Qβ = 497.489(10) keV from Ref. Wang et al. (2017) and E[115Sn(3/2+)] = 497.342(3) keV from the recent measurement of Ref. Zheltonozhsky et al. (2018).. Theoretical descriptions of this UL Q value decay showed significant discrepancies between the calculated and measured partial half-life Mustonen and Suhonen (2010b); Suhonen and Mustonen (2010). The identification of additional UL Q value decays, and measurements of their partial half-lives are required to aid further theoretical developments. Furthermore, UL Q value -decays have the potential to be new candidates for direct neutrino mass determination experiments, since the fraction of decays in the energy interval close to the endpoint, which is relevant for the determination of the neutrino mass, goes as Ferri et al. (2015).
Potential UL Q value decay branches were identified in 115Cd Haaranen and Suhonen (2013) and 135Cs Mustonen and Suhonen (2011) with values of -2.8(4.0) keV and 0.5(1.1) keV respectively, limited by the uncertainties in the masses of the parent and/or daughter isotopes. Since Ref. Haaranen and Suhonen (2013) was published, new atomic mass data in the 2016 Atomic Mass Evaluation (AME2016) Wang et al. (2017) gave an UL Q value for 115Cd of 3.1(0.7) keV222This Q value remains the same in the most recent 2020 update to the Atomic Mass Evaluation (AME2020) Wang et al. (2021).. Although this would indicate that this transition is not UL, we note that in AME2016 and AME2020 the 115Cd mass is determined entirely through a () reaction measurement linking it to 114Cd. Since atomic masses obtained via nuclear reaction data are not always reliable, and because the mass of 114Cd was determined from an older mass spectrometry technique, a direct Penning trap measurement of the 115Cd Q value is called for. Recently, the ground-state Q value of 135Cs was measured with the JYFLTRAP Penning trap and the Q value of the potential UL decay branch was determined to be = 0.44(31) keV de Roubin et al. (2020), showing that it is indeed energetically allowed with 1 keV.
Additional potential UL Q value decay candidates have been identified in the literature Mustonen and Suhonen (2010c); Suhonen (2014); Kopp and Merle (2010); Gamage et al. (2019). Again, more precise mass data for the parent and/or daughter isotopes are required to determine whether these decays are energetically allowed and if their Q values are ultra-low. In collaboration with the LEBIT group at the National Superconducting Cyclotron Laboratory, we recently investigated and ruled out two candidates identified in Ref. Gamage et al. (2019): 89Sr and 139Ba Sandler et al. (2019). The JYFLTRAP group recently ruled out potential UL Q value decays in 72As Ge et al. (2021a), and showed that 159Dy does have an electron capture decay branch to an excited state in the daughter with a value of around 1 keV Ge et al. (2021b). They are also investigating other candidates Kankainen et al. (2020).
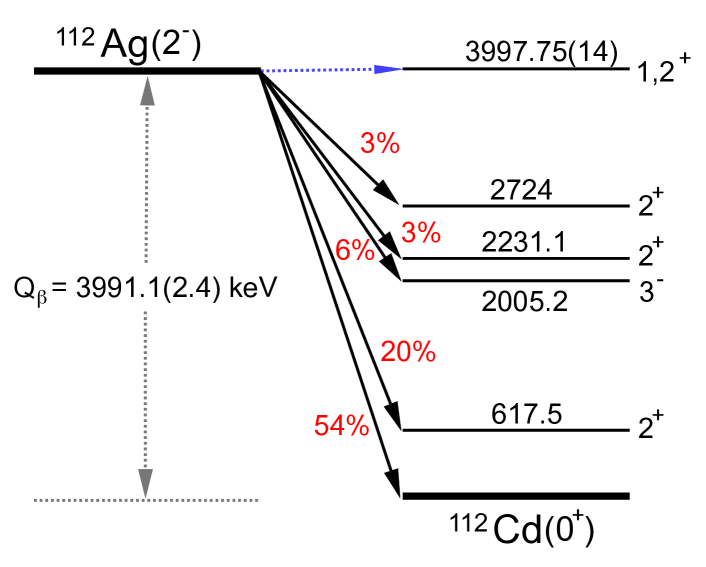
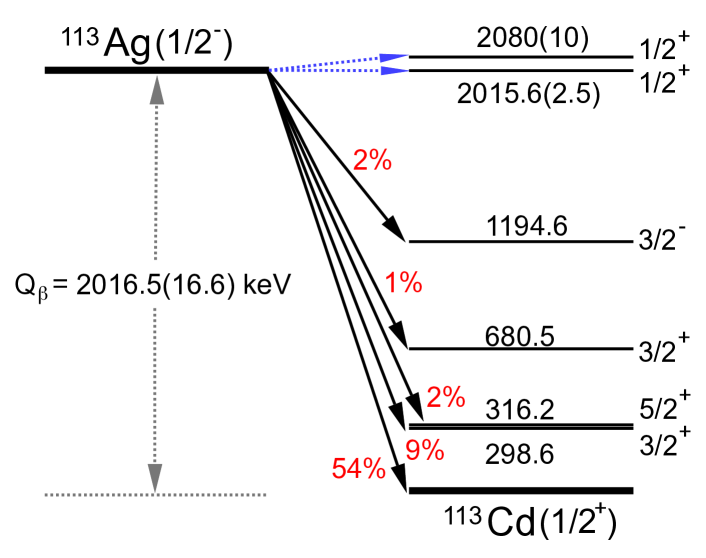
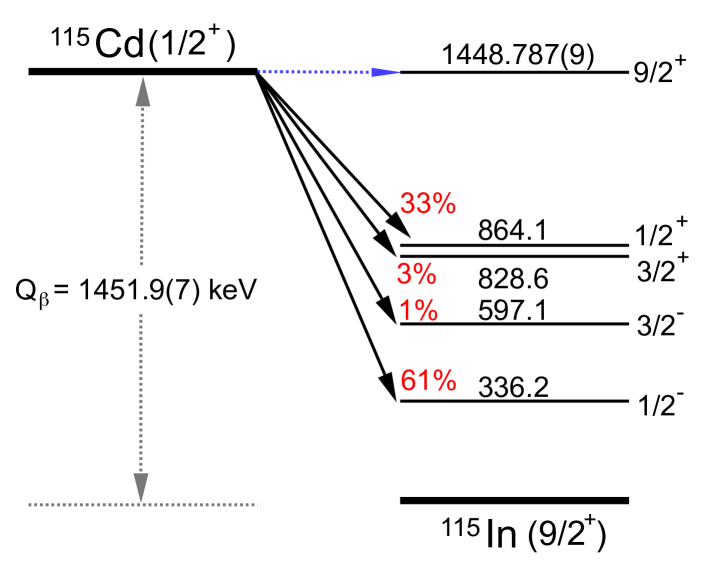
In this paper we present the first direct measurement of the 115Cd gs–gs Q value () and determination of the Q value of the potential UL decay branch identified in Ref. Haaranen and Suhonen (2013). We also investigate two potential UL Q value candidates identified in Ref. Gamage et al. (2019): 112,113Ag. Decay schemes for all three candidates are shown in Fig. 1. For 112Ag and 115Cd, potential UL Q value decays are to the 1 or 2+ level at 3997.8 keV in 112Cd, and to the 9/2+ level at 1448.8 keV in 115In, respectively. In the case of 113Ag, two potential UL Q value branches to 1/2+ states in 113Cd at 2015.6 keV and 2080 keV are shown. A decay to the lower energy state was identified as a potential UL Q value transition based on the gs–gs Q value obtained using mass data from AME2016 Wang et al. (2017), but was ruled out by our measurement presented here. Based on our new result, a decay to the higher energy state was later identified as a potential UL Q value transition.
II Experimental Description
The 112,113Ag, and 115Cd gs–gs Q values were obtained via measurements of the cyclotron frequency ratio of singly-charged ions of the parent and daughter isotopes using the Canadian Penning Trap (CPT) at Argonne National Laboratory (ANL) Savard et al. (2001); Orford et al. (2020).
CPT is currently coupled to the Californium Rare Isotope Breeder Upgrade (CARIBU) facility that produces neutron-rich rare isotopes via spontaneous fission of 252Cf Savard et al. (2008). Fission products are thermalized in a gas catcher Savard et al. (2003) and extracted as singly- or doubly-charged ions. The ions are then accelerated and go through a high-resolution mass separator to select ions of a particular . The selected ions then enter into a radio-frequency quadrupole (RFQ) cooler and buncher to prepare low emittance bunches for injection into the CARIBU multi-reflection time-of-fight mass separator (MR-TOF-MS) Hirsh et al. (2016) where the next stage of mass selection occurs as ions reflect between electrostatic mirrors and separate in time-of-flight with respect to their mass, providing typical mass resolving powers of up to 100,000. A Bradbury-Nielsen Gate (BNG) Bradbury and Nielsen (1936) is then used to select a particular isotope. However, depending on the mass difference between isobars, more than one species can pass through the BNG. Finally, ion bunches are accumulated and further cooled in a linear Paul trap before being injected into the Penning trap.
The CPT has a hyperbolic geometry with compensation ring and tube electrodes and is immersed in a uniform 5.9 T magnetic field produced by a superconducting solenoidal magnet. Ions confined in the Penning trap undergo three normal modes of motion: axial, reduced-cyclotron, and magnetron, with characteristic frequencies , and , respectively Brown and Gabrielse (1986). By combining measurements of the observable normal mode frequencies, one can obtain the free-space cyclotron frequency for an ion with charge-to-mass ratio in a magnetic field of strength :
| (1) |
At the CPT, is measured using the so-called Phase-Imaging Ion Cyclotron Resonance (PI-ICR) technique that was originally developed and implemented by the SHIP-TRAP group Eliseev et al. (2013, 2014). This technique enables a measurement of the total phase accumulated by an ion in its reduced-cyclotron or magnetron motion during a precisely defined time interval, that in turn can be used to determine the ion’s frequency in the trap. The phase determination is performed by ejecting ions from the trap onto a position sensitive micro channel plate (MCP) detector, preserving the ion’s phase information.
In this work, the direct method for determining described in Ref. Eliseev et al. (2014) was used Orford et al. (2020). This method involves two separate phase measurements known as the reference spot measurement and the final spot measurement (an additional measurement at the start of the experiment is also required to determine the spot on the MCP that corresponds to the center of the trap). For both the reference and final spot measurements, the reduced-cyclotron motion of the ion is first excited to a well-defined radius via a pulsed rf dipole drive at a frequency close to . For the reference spot, a quadrupole rf drive pulse at frequency is immediately applied, which converts the ion’s reduced-cyclotron motion into magnetron motion. The ion is then allowed to accumulate phase in its magnetron motion for a specific time period before being ejected from the trap. For the final spot, the quadrupole rf drive pulse is applied after a phase accumulation period of length , so that the ion accumulates mass-dependent reduced-cyclotron phase before its reduced-cyclotron motion is converted into magnetron motion. The ion then remains in its magnetron orbit for an additional period of time until it is ejected such that the total time spent in the trap during the reference and final spot measurements is the same. The cyclotron frequency, , is determined from the total phase difference between the reference and measurement spots during the time interval Eliseev et al. (2014)
| (2) |
where is the measured angle between the reference and final spot and is the number of complete revolutions for an ion with cyclotron frequency during time .
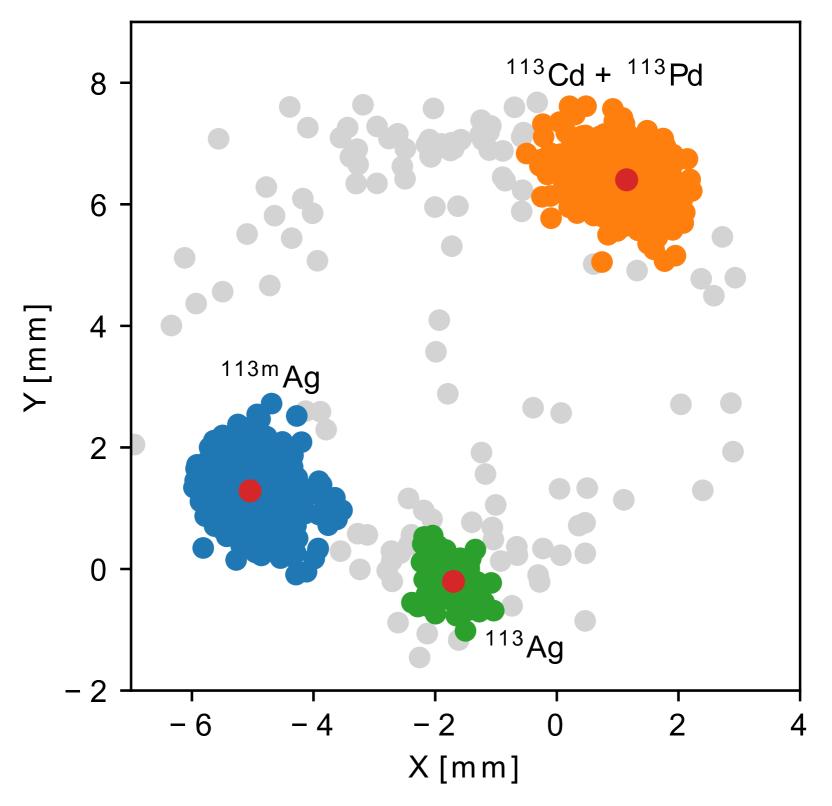
In order to obtain , the central coordinates and associated uncertainties of the reference spot and final spot need to be determined. This was done using an unsupervised learning cluster-finding model, the Gaussian mixture model, which has been developed based on an expectation–maximization algorithm, see e.g. Ref. Weber et al. (2022). For the final phase measurement, there can be several spots along with the spot corresponding to the ion of interest depending on contaminants present in the beam. In such cases, was carefully chosen so that the spot of interest is well separated from the other spots. Such an example can be seen in Figure 2, which displays the output of the cluster-finding model and shows the presence of = 113 isobars 113Ag, Ag, 113Cd, and 113Pd. Typically 100 – 500 ions were accumulated in a spot to enable a determination of to a precision of 3 – 5 mHz. Such a measurement took 2 – 30 mins, depending on the rate at which the isotope of interest was delivered to the Penning trap. If necessary, this rate was limited to allow only a few ions per shot into the trap to avoid potential systematic frequency shifts due to ion-ion interactions.
III Data and Analysis
III.1 Experimental Runs and Data
The experimental data were acquired during three separate runs in 2016, 2017 and 2018. During the initial 2016 run, data were taken for the ratios of interest 112Ag+/112Cd+, 113Ag+/113Cd+, and 115Cd+/115In+, and for test ratios 112Sn+/112Cd+ and 115In+/115Sn+ that involve isotopes whose masses have already been precisely measured with Penning traps Mount et al. (2009); Wieslander et al. (2009b); Rahaman et al. (2009). In this data we observed shifts in the Q values calculated from the test ratio measurements of up to 10 keV compared to literature values. We also observed variations in the Q values for different times that were found to result from variations in for different times.
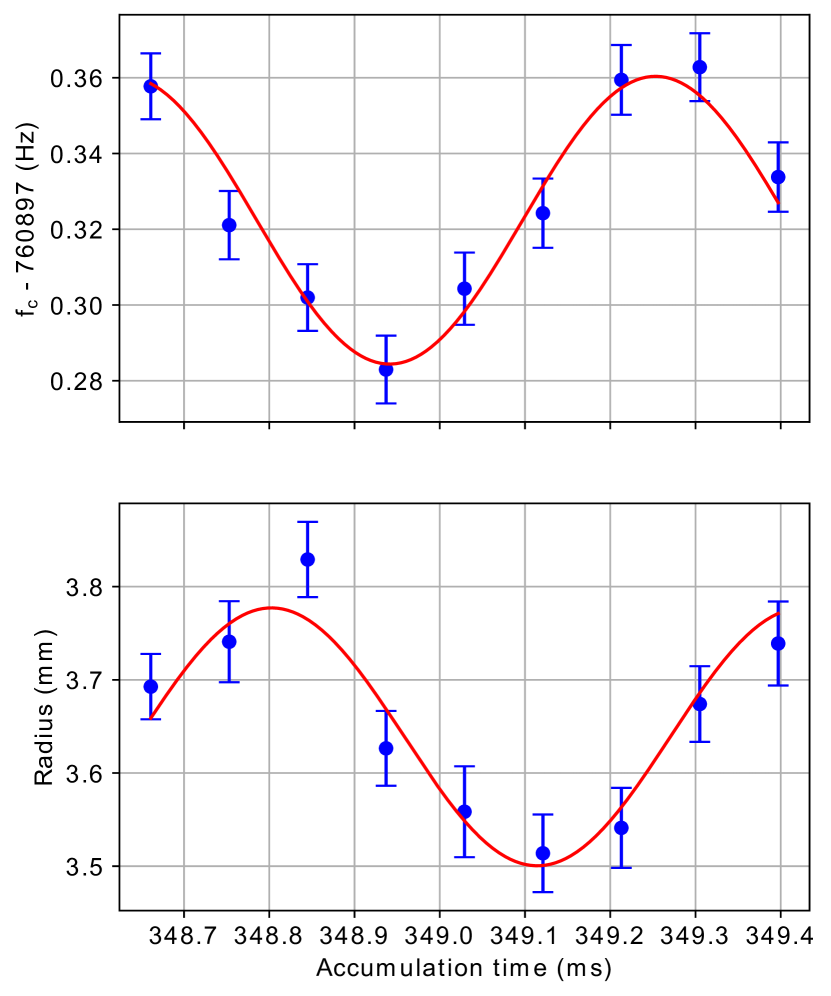
After the 2016 run, it was discovered that these shifts were due to a systematic sinusoidal variation of as a function of with a frequency corresponding to the magnetron frequency of ions in the trap. A corresponding systematic variation was observed in the final radial position of the ions on the MCP with a 90∘ phase shift compared to the data, see Figure 3 and Ref. Orford et al. (2020). These observations indicate that ions injected into the trap had some initial magnetron motion with a reproducible amplitude and phase when they were initially confined in the trap, before their reduced-cyclotron motion was first driven by the pulsed rf dipole drive. This motion is then transferred to the final magnetron motion of the ions before they are ejected from the trap, with a phase that depends on the phase accumulated during the period. Hence, the position of the final spot on the MCP is modified slightly resulting in a final radial position and phase, , that depend on . Following this discovery, a second experimental run was performed in 2017 with the ion pairs 115Cd+/115In+ and 115In+/115Sn+, and a third experimental run was undertaken in 2018 to take additional data and data for the ion pairs 112Ag+/112Cd+ and 112Sn+/112Cd+.
During the 2017 and 2018 runs, was systematically varied to map out and account for the sinusoidal variation of versus . A sinusoidal fit to the data of the form
| (3) |
was then performed. In this fit, is the amplitude of the sine fit function, is a phase offset, and is the baseline cyclotron frequency when no systematic shift occurs. Hence, and its associated uncertainty are extracted. In this fit, was constrained to the measured magnetron frequency. We note that, although the magnitude of the shift in does not depend on , does because from Eqn. (2) goes as 1/.
The procedure to measure in this way was then repeated with the other isotope for the parent-daughter pair so that the Q value could be obtained, as discussed in section IV. Depending on the isotope pair, between one and three measurements were performed for each isotope, alternating between the two.
After obtaining for ions of the parent and daughter isotopes, the cyclotron frequency ratio, corresponding to the inverse mass ratio of the ions, was obtained:
| (4) |
In the case that more than one measurement was performed for parent and/or daughter isotope, neighboring measurements for one ion were linearly interpolated to the time of the measurement of the other ion to account for temporal magnetic field drifts. A weighted average of all resulting cyclotron frequency ratio measurements for a given ion pair was then obtained. The average cyclotron frequency ratios, after applying the systematic corrections discussed below, are given in Table 1.
| Ion Pair | Yr. | ||||
| / | ‘16 | 0(48) | 48(5) | 8 | 0.999 961 658(49) |
| / | ‘18 | 0(0) | -1.6(2) | 2.1 | 0.999 961 721 5(21) |
| / | ‘16 | 0(48) | 18(2) | 9 | 0.999 981 445(49) |
| / | ‘18 | 0(0) | 2.1(2) | 2.4 | 0.999 981 582 2(24) |
| 113Ag+/113Cd+ | ‘16 | 0(42) | 2.3(2) | 12 | 0.999 980 169(44) |
| 113Ag+/113mAg+ | ‘16 | 0(41) | 7.5(8) | 15 | 0.999 999 616(44) |
| / | ‘16 | -4(9) | 15(2) | 1.4 | 0.999 986 451 4(93) |
| / | ‘17 | 0(0) | -19(2) | 6.0 | 0.999 986 435 5(63) |
| / | ‘18 | 0(0) | -1.4(2) | 3.9 | 0.999 986 440 1(39) |
| Average | 0.999 986 440 3(31) | ||||
| / | ‘16 | 26(13) | 5(1) | 2.2 | 0.999 995 361(13) |
| / | ‘17 | 0(0) | 14(2) | 3.9 | 0.999 995 351 8(44) |
| / | ‘18 | 0(0) | 4.9(5) | 7.0 | 0.999 995 332 7(70) |
III.2 Systematic Corrections and Checks
During the experimental runs in 2017 and 2018, the data were obtained by measuring as a function of and extracting the baseline value, , from a fit using Eqn. (3). This procedure enabled us to account for the phase dependent shift to as a function of so that it did not affect the cyclotron frequency ratio, . Hence there is no correction to the 2017 or 2018 data in Table 1.
For the 2016 data, measurements were performed for each ratio at specific times, resulting in frequencies and corresponding ratios that did suffer from systematic shifts. In the case of 115Cd+/115In+, we were able to use the parameters from the fit of Eqn. (3) to the 2017 data to correct the 2016 data. The correction, , and the corrected ratio are shown in Table 1. After this correction, there is good agreement between the corrected 2016 115Cd+/115In+ data and the data taken in 2017 and 2018. As such, we averaged 115Cd+/115In+ data from all three runs to obtain the average ratio listed in Table 1 to be used to determine the 115Cd gs-gs -decay Q value.
Correcting the 2016 data was possible because the 2017 data was taken within two months of the 2016 data and no significant changes to the CPT apparatus were made. Before the 2018 run, some 18 months after the 2017 run, a magnet quench had occurred, requiring the magnet to be re-energized, and a new voltage source for the Penning trap electrodes had been installed. As such, the parameters from the fit of Eqn. (3) to the 2018 data did not reproduce those from the 2017 data. Hence, we were not able to use the 2018 data to correct the 2016 112Ag+/112Cd+ data. We also did not take additional data at in 2018 because the 2016 data was sufficient to rule out the potential UL Q value decay branch. As such, we do not apply a correction, , to the 2016 112,113Ag data. Instead, we include an uncertainty due to this effect that we estimate from Eqn. (2) and (3) based on the that was used and the variation in the observed orbital radius of the ion spot on the MCP, as seen, for example, in Figure (3). We also applied the correction to the 2016 115In+/115Sn+ test ratio data, and included the systematic uncertainty due to this effect in the 112Sn+/112Cd+ test ratio, as reported in Table II.
After the 2018 run, a smaller, additional systematic shift to data taken using the PI-ICR technique at the CPT was discovered Orford et al. (2020). This shift affected the phase of the reference spot and is due to contaminant ions of the same nominal in the trap. During the pulsed rf dipole drive at that is used to initially drive the ions to their reduced cyclotron orbit, and also during the pulsed rf quadrupole drive at that is used to convert cyclotron motion into magnetron motion, ions accumulate a phase difference that depends on . Because the and drive pulses are of short duration (500 s), the resulting phase difference is typically small (5∘), and a separation of different species in the reference spot is not observed. However, depending on the proportion of contaminant ions to the ion of interest entering the trap, the weighted average phase of the reference spot can be systematically offset from the phase of just the ions of interest Orford et al. (2020). This effect can be corrected for by determining the percentage of contaminant ions vs ions of interest and calculating the corresponding weighted phase shift. This correction was accounted for in the data, and has been included in Table 1 as the correction .
Our cyclotron frequency ratio measurements of 112Sn+/112Cd+ and 115In+/115Sn+ were performed to serve as an independent check of our measurements by comparing them to the inverse mass ratios calculated with data listed in the AME2020 Wang et al. (2021). We also observed the 113mAg isomer, so were able to obtain the ratio 113mAg+/113Ag+, which can be compared to the mass ratio of the 113Ag ground and isomeric state. A comparison of these data is shown in Table 2.
| Ion Pair | Year | (10-9) | |
|---|---|---|---|
| 112Sn+/112Cd+ | 2016 | 0.999 981 582 5(37) | -137(49) |
| 2018 | -0.3(4.4) | ||
| / | 2016 | 0.999 999 586 4(10) | 30(44) |
| 2016 | 9(13) | ||
| / | 2017 | 0.999 995 351 9(2) | -0.2(4.4) |
| 2018 | -19(7) |
IV Results and Discussion
IV.1 values for 112,113Ag and 115Cd -decay
The goal of this work was to obtain gs–gs -decay Q values for 112,113Ag and 115Cd. These Q values, defined as the energy equivalent of the mass difference between parent and daughter atoms, can be determined from the measured cyclotron frequency ratios via
| (5) |
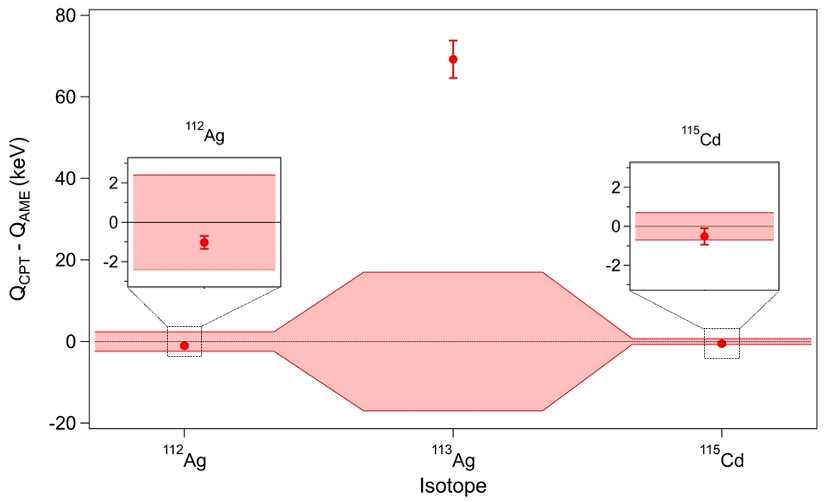
where and are the mass of the parent and daughter atoms, respectively, and is the mass of the electron. The conversion factor from atomic mass units to keV, 1 u keV/ from Ref. Tiesinga et al. (2021) was used. The average cyclotron frequency ratios listed in Table 1 were used to obtain these Q values, and the results are listed in Table 3. Daughter atomic masses were taken from the AME2020 Wang et al. (2021), and from the most recent CODATA recommended values of the fundamental physical constants Tiesinga et al. (2021). Q values obtained in this work are compared to those from the AME2020 in Table 3 and in Fig. 4.
Our Q values for 112Ag and 115Cd are slightly lower, but in agreement with the values obtained from the AME2020. Our result for 112Ag is a factor of 10 more precise, while that for 115Cd is about a factor of two more precise. Our result for 113Ag shows a significant, 4 discrepancy compared to the AME2020, and is a factor of three more precise.
. Decay 112Ag 112Cd 3990.16(22) 3991.1(2.4) -1.0(2.4) 113Ag 113Cd 2085.7(4.6) 2016.5(16.6) 69.2(17.3) 115Cd 115In 1451.36(34) 1451.88(65) -0.52(73)
IV.2 Evaluation of values for 112,113Ag and 115Cd
Using the new Q values listed in Table 3, the potential UL Q values for decay branches to excited states in the daughter nuclei can be evaluated via
| (6) |
where is the gs–gs Q value from Table 3, and is the energy of the final state in the daughter, from Ref. nnd . The values that we obtained are listed in Table 4.
Our new values definitively show that the potential UL Q value decay for 112Ag identified in Ref. Gamage et al. (2019) is not energetically allowed, and that the potential UL Q value decay for 115Cd identified in Ref. Haaranen and Suhonen (2013) is not 1 keV and hence not ultra-low. The fact that our new value for 113Ag deviates from the AME value by 69 keV, means that the potential UL Q value decay to the 1/2+ state in 113Cd at 2015.6 keV is 1 keV and is ruled out. However, there is another 1/2+ state in 113Cd at 2080(10) keV that an UL Q value decay could potentially go to. Currently, the 10 keV uncertainty in the energy of this state is too large to say anything more definitive.
| Decay | |||
|---|---|---|---|
| CPT | AME | ||
| 112Ag 112Cd | 3997.75(14) | -7.59(26) | -6.6(2.4) |
| 113Ag 113Cd | 2015.6(2.5) | 70.1(5.2) | 0.9(16.8) |
| 2080(10) | 5.7(11.0) | -63.5(19.4) | |
| 115Cd 115In | 1448.787(9) | 2.57(34) | 3.1(0.7) |
IV.3 Mass Excesses for 112,113Ag and 115Cd
The ratios in Table 1 were used to obtain absolute atomic masses for the parent nuclides, 112,113Ag, and 115Cd, via
| (7) |
with corresponding values for taken from Ref. Wang et al. (2021). Mass excesses were then obtained and are listed in Table 5 where they are compared with the values from the AME2020 Wang et al. (2021).
| Isotope | This work | AME2020 | ME |
|---|---|---|---|
| (keV/) | (keV/) | (keV/) | |
| 112Ag | -1.0(2.4) | ||
| 113Ag | 69.2(17.2) | ||
| 115Cd | -0.5(0.8) |
The mass excesses for 112Ag and 115Cd are in good agreement with the AME2020 data, but are factors of approximately seven and two more precise, respectively. Our result for 113Ag shows that it is less bound by 69.2(17.2) keV compared to the AME2020 value, a 4 discrepancy. The mass of 113Ag in AME2020 is derived almost entirely from three 113Ag -decay measurements Matumoto and Tamura (1970); Fogelberg et al. (1990), the most precise of which is listed as a private communication to the Nuclear Data Group from 1957 Wang et al. (2021). The 115Cd mass, on the other hand is derived from a reaction linking it to 114Cd, and the 112Ag mass is from a Penning trap measurement performed by the ISOLTRAP group Breitenfeldt et al. (2010). We note that we did observe the 113mAg isomer in addition to the 113Ag ground state, as shown in Fig. 2, and determined their mass difference to be 40.4(4.6) keV/, consistent with the literature value of 43.5(1) keV Kondev et al. (2021) for the energy of the isomeric state.
V Conclusion
We have performed precise determinations of the gs–gs -decay Q values of 112,113Ag, and 115Cd by measuring the cyclotron frequency ratios of singly-charged parent and daughter ions with the Canadian Penning Trap mass spectrometer. By comparing these Q values with excited state energy levels in the daughter nuclei, the values for potential UL Q value decays of 112Ag and 115Cd were found to be –7.59(26) keV and 2.57(34) keV respectively. The former is not energetically allowed and the latter is too large (i.e. 1 keV) to be considered as an UL decay, ruling both out as potential UL Q value -decays. Our Q value measurement of 113Ag indicated a 69(17) keV discrepancy compared to data from the AME2020. This result ruled out the potential UL Q value decay to the 1/2+, 2015.6 keV state in 113Cd, but indicated a new potential UL Q value branch to the 1/2+ at 2080(10) keV. Hence, 113Ag is still a potential candidate with a of 6(11) keV, but a more precise determination of the 113Cd(1/2+, 2080 keV) state energy will be required to further evaluate this decay branch.
We also report improved atomic masses for 112,113Ag and 115Cd. The atomic masses of 112Ag and 115Cd are in good agreement with the AME2020 values, and have had their uncertainties reduced by factors of seven and two, respectively. We observed an 70 keV discrepancy in the mass of 113Ag compared to the AME.
Acknowledgments
This material is based upon work supported by the US Department of Energy, Office of Science, Office of Nuclear Physics under contract No. DE-AC02-06CH11357 and Award No. DE-SC0015927, by NSERC (Canada), Application No. SAPPJ-2015-00034 and SAPPJ-2018-00028, and by the National Science Foundation under grant No. PHY-1713857. Support was also provided by Central Michigan University.
References
- Severijns et al. (2006) N. Severijns, M. Beck, and O. Naviliat-Cuncic, Rev. Mod. Phys. 78, 991 (2006).
- Haaranen et al. (2016) M. Haaranen, P. C. Srivastava, and J. Suhonen, Phys. Rev. C 93, 034308 (2016).
- Aker et al. (2019) M. Aker, K. Altenmüller, M. Arenz, M. Babutzka, J. Barrett, S. Bauer, M. Beck, A. Beglarian, J. Behrens, T. Bergmann, et al. (KATRIN Collaboration), Phys. Rev. Lett. 123, 221802 (2019).
- Gastaldo et al. (2017) L. Gastaldo et al. (ECHo Collaboration), The European Physical Journal Special Topics 226, 1623 (2017).
- Alpert et al. (2015) B. Alpert et al. (HOLMES Collaboration), The European Physical Journal C 75, 112 (2015).
- Arnaboldi et al. (2003) C. Arnaboldi, C. Brofferio, O. Cremonesi, E. Fiorini, C. Lo Bianco, L. Martensson, A. Nucciotti, M. Pavan, G. Pessina, S. Pirro, E. Previtali, M. Sisti, A. Giuliani, B. Margesin, and M. Zen, Phys. Rev. Lett. 91, 161802 (2003).
- Chechev (2011) V. P. Chechev, Phy. At. Nucl. 74, 1713 (2011).
- Kostensalo and Suhonen (2018) J. Kostensalo and J. Suhonen, Int. J. Mod. Phys. A 33, 1843008 (2018).
- Mustonen and Suhonen (2010a) M. T. Mustonen and J. Suhonen, AIP Conference Proceedings 1304, 401 (2010a).
- Mustonen and Suhonen (2010b) M. T. Mustonen and J. Suhonen, J. Phys. G: Nucl. Part. Phys. 37, 064008 (2010b).
- Cattadori et al. (2004) C. M. Cattadori, M. D. Deo, M. Laubenstein, L. Pandola, and V. I. Tretyak, Nucl. Phys. A 748, 333 (2004).
- Wieslander et al. (2009a) J. S. E. Wieslander, J. Suhonen, T. Eronen, M. Hult, V.-V. Elomaa, A. Jokinen, G. Marissens, M. Misiaszek, M. T. Mustonen, S. Rahaman, C. Weber, and J. Äystö, Phys. Rev. Lett. 103, 122501 (2009a).
- Andreotti et al. (2011) E. Andreotti, M. Hult, R. González de Orduña, G. Marissens, J. S. E. Wieslander, and M. Misiaszek, Phys. Rev. C 84, 044605 (2011).
- Mount et al. (2009) B. J. Mount, M. Redshaw, and E. G. Myers, Phys. Rev. Lett. 103, 122502 (2009).
- Wieslander et al. (2009b) J. S. E. Wieslander, J. Suhonen, T. Eronen, M. Hult, V.-V. Elomaa, A. Jokinen, G. Marissens, M. Misiaszek, M. T. Mustonen, S. Rahaman, C. Weber, and J. Äystö, Phys. Rev. Lett. 103, 122501 (2009b).
- Wang et al. (2017) M. Wang, G. Audi, F. Kondev, W. Huang, S. Naimi, and X. Xu, Chin. Phys. C 41, 030003 (2017).
- Zheltonozhsky et al. (2018) V. A. Zheltonozhsky, A. M. Savrasov, N. V. Strilchuk, and V. I. Tretyak, Europhys. Lett. 121, 12001 (2018).
- Suhonen and Mustonen (2010) J. Suhonen and M. Mustonen, Progress in Particle and Nuclear Physics 64, 235 (2010), neutrinos in Cosmology, in Astro, Particle and Nuclear Physics.
- Ferri et al. (2015) E. Ferri, D. Bagliani, M. Biasotti, G. Ceruti, D. Corsini, M. Faverzani, F. Gatti, A. Giachero, C. Gotti, C. Kilbourne, et al., Phys. Procedia 61, 227 (2015).
- Haaranen and Suhonen (2013) M. Haaranen and J. Suhonen, The European Physical Journal A 49, 93 (2013).
- Mustonen and Suhonen (2011) M. Mustonen and J. Suhonen, Physics Letters B 703, 370 (2011).
- Wang et al. (2021) M. Wang, W. Huang, F. Kondev, G. Audi, and S. Naimi, Chinese Physics C 45, 030003 (2021).
- de Roubin et al. (2020) A. de Roubin, J. Kostensalo, T. Eronen, L. Canete, R. P. de Groote, A. Jokinen, A. Kankainen, D. A. Nesterenko, I. D. Moore, S. Rinta-Antila, J. Suhonen, and M. Vilén, Phys. Rev. Lett. 124, 222503 (2020).
- Mustonen and Suhonen (2010c) M. T. Mustonen and J. Suhonen, AIP Conf. Proc. 1304, 401 (2010c).
- Suhonen (2014) J. Suhonen, Physica Scripta 89, 054032 (2014).
- Kopp and Merle (2010) J. Kopp and A. Merle, Phys. Rev. C 81, 045501 (2010).
- Gamage et al. (2019) N. D. Gamage, R. Bhandari, M. H. Gamage, R. Sandler, and M. Redshaw, Hyp. Int. 240, 43 (2019).
- Sandler et al. (2019) R. Sandler, G. Bollen, N. D. Gamage, A. Hamaker, C. Izzo, D. Puentes, M. Redshaw, R. Ringle, and I. Yandow, Phys. Rev. C 100, 024309 (2019).
- Ge et al. (2021a) Z. Ge, T. Eronen, A. de Roubin, D. A. Nesterenko, M. Hukkanen, O. Beliuskina, R. de Groote, S. Geldhof, W. Gins, A. Kankainen, A. Koszorús, J. Kotila, J. Kostensalo, I. D. Moore, A. Raggio, S. Rinta-Antila, J. Suhonen, V. Virtanen, A. P. Weaver, A. Zadvornaya, and A. Jokinen, Phys. Rev. C 103, 065502 (2021a).
- Ge et al. (2021b) Z. Ge, T. Eronen, K. S. Tyrin, J. Kotila, J. Kostensalo, D. A. Nesterenko, O. Beliuskina, R. de Groote, A. de Roubin, S. Geldhof, W. Gins, M. Hukkanen, A. Jokinen, A. Kankainen, A. Koszorús, M. I. Krivoruchenko, S. Kujanpää, I. D. Moore, A. Raggio, S. Rinta-Antila, J. Suhonen, V. Virtanen, A. P. Weaver, and A. Zadvornaya, Phys. Rev. Lett. 127, 272301 (2021b).
- Kankainen et al. (2020) A. Kankainen, T. Eronen, D. Nesterenko, A. de Roubin, and M. Vilén, Hyperfine Interactions 241, 43 (2020).
- Savard et al. (2001) G. Savard, R. Barber, C. Boudreau, F. Buchinger, J. Caggiano, J. Clark, J. Crawford, H. Fukutani, S. Gulick, J. Hardy, et al., Hyperfine Interactions 132, 223 (2001).
- Orford et al. (2020) R. Orford, J. Clark, G. Savard, A. Aprahamian, F. Buchinger, M. Burkey, D. Gorelov, J. Klimes, G. Morgan, A. Nystrom, et al., Nuclear Instruments and Methods in Physics Research Section B: Beam Interactions with Materials and Atoms 463, 491 (2020).
- Savard et al. (2008) G. Savard, S. Baker, C. Davids, A. Levand, E. Moore, R. Pardo, R. Vondrasek, B. Zabransky, and G. Zinkann, Nuclear Instruments and Methods in Physics Research Section B: Beam Interactions with Materials and Atoms 266, 4086 (2008).
- Savard et al. (2003) G. Savard, J. Clark, C. Boudreau, F. Buchinger, J. Crawford, H. Geissel, J. Greene, S. Gulick, A. Heinz, J. Lee, A. Levand, M. Maier, G. Münzenberg, C. Scheidenberger, D. Seweryniak, K. Sharma, G. Sprouse, J. Vaz, J. Wang, B. Zabransky, and Z. Zhou, Nuclear Instruments and Methods in Physics Research Section B: Beam Interactions with Materials and Atoms 204, 582 (2003).
- Hirsh et al. (2016) T. Y. Hirsh, N. Paul, M. Burkey, A. Aprahamian, F. Buchinger, S. Caldwell, J. A. Clark, A. F. Levand, L. L. Ying, S. T. Marley, G. E. Morgan, A. Nystrom, R. Orford, A. P. Galván, J. Rohrer, G. Savard, K. S. Sharma, and K. Siegl, Nuclear Instruments and Methods in Physics Research Section B: Beam Interactions with Materials and Atoms 376, 229 (2016), proceedings of the XVIIth International Conference on Electromagnetic Isotope Separators and Related Topics (EMIS2015), Grand Rapids, MI, U.S.A., 11-15 May 2015.
- Bradbury and Nielsen (1936) N. E. Bradbury and R. A. Nielsen, Phys. Rev. 49, 388 (1936).
- Brown and Gabrielse (1986) L. S. Brown and G. Gabrielse, Rev. Mod. Phys. 58, 233 (1986).
- Eliseev et al. (2013) S. Eliseev, K. Blaum, M. Block, C. Droese, M. Goncharov, E. Minaya Ramirez, D. Nesterenko, Y. N. Novikov, and L. Schweikhard, Physical Review Letters 110, 082501 (2013).
- Eliseev et al. (2014) S. Eliseev, K. Blaum, M. Block, A. Dörr, C. Droese, T. Eronen, M. Goncharov, M. Höcker, J. Ketter, E. M. Ramirez, et al., Applied Physics B 114, 107 (2014).
- Weber et al. (2022) C. Weber, D. Ray, A. Valverde, J. Clark, and K. Sharma, Nuclear Instruments and Methods in Physics Research Section A: Accelerators, Spectrometers, Detectors and Associated Equipment 1027, 166299 (2022).
- Rahaman et al. (2009) S. Rahaman, V.-V. Elomaa, T. Eronen, J. Hakala, A. Jokinen, A. Kankainen, J. Rissanen, J. Suhonen, C. Weber, and J. Äystö, Phys. Rev. Lett. 103, 042501 (2009).
- Kondev et al. (2021) F. Kondev, M. Wang, W. Huang, S. Naimi, and G. Audi, Chinese Physics C 45, 030001 (2021).
- Tiesinga et al. (2021) E. Tiesinga, P. J. Mohr, D. B. Newell, and B. N. Taylor, Rev. Mod. Phys. 93, 025010 (2021).
- (45) “National nuclear data center,” https://www.nndc.bnl.gov/.
- Matumoto and Tamura (1970) Z.-I. Matumoto and T. Tamura, Journal of the Physical Society of Japan 29, 1116 (1970).
- Fogelberg et al. (1990) B. Fogelberg, Y. Zongyuan, B. Ekström, E. Lund, K. Aleklett, and L. Sihver, Zeitschrift für Physik A Atomic Nuclei 337, 251 (1990).
- Breitenfeldt et al. (2010) M. Breitenfeldt, C. Borgmann, G. Audi, S. Baruah, D. Beck, K. Blaum, C. Böhm, R. B. Cakirli, R. F. Casten, P. Delahaye, M. Dworschak, S. George, F. Herfurth, A. Herlert, A. Kellerbauer, M. Kowalska, D. Lunney, E. Minaya-Ramirez, S. Naimi, D. Neidherr, M. Rosenbusch, R. Savreux, S. Schwarz, L. Schweikhard, and C. Yazidjian, Phys. Rev. C 81, 034313 (2010).