Orbital Dynamics at Atmospheric Pressure in a Lensed, Dual-beam, Optical Trap
Abstract
Orbital optical trapping of a dielectric micro-particle in air was studied experimentally using a lensed, counter-propagating dual-beam trap, and by numerical simulations employing ray optics. The essential attributes of particle dynamics are evaluated as functions of the transverse offset between the beams, the axial offset between the laser foci and the total laser power, both experimentally and computationally. We find that the Q-factor of the orbital motion in this previously unexplored scheme is at least two orders of magnitude higher than values attainable with conventional trapping. Under our experimental conditions, silica micro-spheres orbit up to a maximum frequency of kHz at atmospheric pressure, which can be further increased by increasing the optical power in the trap. With the help of simulations, we discuss how the experimental technique presented here can be further modified to enhance the Q factor of particle’s orbital motion. The evolution of orbital frequencies can be a useful signature in analyzing the kinetics of deposition or loss of materials from the surface of levitated particles in a controlled environment. Hence, the approach reported here could find application as an in situ single particle technique for probing reactions relevant to atmospheric chemistry.
keywords:
orbital optical trap, dual-beam trap, ray optics approximation, Q factor, trapped particle dynamicsDepartment of Chemistry] Department of Chemistry, Indiana University, Bloomington, IN 47405, U.S. Physics Department] Physics Department, Indiana University, Bloomington, IN 47405, U.S. Department of Chemistry] Department of Chemistry, Indiana University, Bloomington, IN 47405, U.S. \phone+1 (812) 8560087
1 Introduction
Since its inception in 19701, optical trapping has been widely used as a non-contact and non-invasive method to separate and characterize individual microscopic particles for a broad range of applications2, 3, 4. Optical traps, when coupled with other techniques or applied independently, have proven to be powerful tools in identifying and quantifying the changes in physical parameters associated with a particle interacting with its surrounding medium, for a broad range of phenomena ranging from biomolecular affinity to quantum friction to ultra-precise torque sensors 5, 6, 7, 8, 9. Quantitative measurements of torque and other dynamic parameters can be performed with exquisite accuracy if trapping is carried out in vacuum 10, 9. However, because of its relevance for atmospheric processes, there is also great interest in techniques that would allow resolving the state of aerosol particles in interaction with a vapor phase 11. In this work, we isolate and manipulate single particles at atmospheric pressure by employing an orbital optical trap, wherein the particle is moving on a stable, closed trajectory in the field of two counter-propagating, focused laser beams. The stability is due to a balance between optically induced forces and frictional drag and allows precise measurement of the orbital period, much like a suspension spring in a pendulum clock allows for the accurate measurement of the pendulum period. Through numerical and experimental analyses of particle dynamics in such a trapping scheme, we lay down a formalism to disentangle the key parameters leading to a particle’s dynamics. The emerging theoretical framework suggests that such orbital optical traps carry significant promise for real-time, precise measurements of accretion, shrinkage, and oxidative aging of aerosol particles – phenomena for which discrepancies between various models point to the need for additional experimental data12.
While control of the rotational motion of a particle resulting from the transfer of spin and/or orbital angular momentum of light have led to a series of interesting microrheological findings 13, 14, 15, 16, a relatively less explored optomechanical effect is the orbital momentum that can be imparted to a particle by a pair of counter-propagating laser beams, where neither beam carries orbital angular momentum. The first experimental demonstration of a dielectric particle moving around a periodic orbit inside a dual-beam trap was acquired with cleaved optical fibers aligned to have an angular offset between them, with water as the medium surrounding the particle17. Later, this phenomenon was also observed in fiber-optic traps with a transverse offset between parallel beams18, 19, 20. However, in these experiments, the period was only a few Hz and the quality factor associated with the periodic motion was very low on account of the high viscosity of an aqueous medium.
Subsequently, orbital motion of dielectric micro-particles was achieved in both air21 and low vacuum22, with counter-propagating, dual-beam offset fiber optic traps. While convenient, fiber optic based traps have physical limitations related to geometric constraints, which limit spatial control. Specifically, they are limited to strongly divergent beams only. In addition, the fiber shaft precludes the realization of extended closed orbits, and may induce aerodynamic effects. To address these challenges and explore more widely the possibilities of a free space experiment, we have studied trapping in air with a lensed, dual-beam assembly employing a pair of focused laser beams for particle control. This new trapping scheme adds another degree of freedom to the toolbox of optical manipulation which allows the particle to move to and around either focus, thus exposing it to both converging and diverging beams. This modification provides an additional mechanism to selectively control the distribution of optical forces in the trap. Moreover, as it will be shown later, a practical advantage of the lensed dual-beam scheme is the access to orbits that are less sensitive to the initial conditions.
We analyze the dynamics of orbital trapped particles by measuring the period, velocities around the trajectory, and the shape of the orbit. Under our experimental conditions, the power spectral distribution of particle’s motion exhibits sharp peaks with narrow widths, at least two orders of magnitude narrower than those associated with periodic oscillation of a trapped particle in air. The apparent quality factors are also considerably higher than what has been reported for trapping with fiber optic traps in low vacuum22. Since high mechanical Q factors are desirable for accurate determination of change in the resonance frequency upon particle size and/or mass change23, 24, our results have significant implications for the use of optical trapping to probe the kinetics of surface reactions on levitated particles at atmospheric pressure.
In addition, with the help of numerical simulations we study the trajectory stability and shape as a function of the location at which particle enters the optical trap, and examine why having control over the point of entry might be beneficial for the implementation of this system as a precision sensor.
2 Experimental Details
A schematic of the experimental apparatus used for dual-beam trapping of particles in air is shown in Figure 1. Optical trapping of silica microspheres was performed with a 1064 nm, linearly polarized cw laser. The nearly-Gaussian trapping beam was split into two halves of equal power using a non-polarizing beamsplitter cube and focused by two identical microscope objectives (Nikon 40x Super Plan Fluor ELWD) of working distance 3.5 mm, inside the sample chamber made of glass (wall thickness150 m). The Gaussian beam waist radius in the focal plane, w0, measured by the knife edge method was 1.5 m, for both beams. The counter-propagating laser beams were parallel, and their linear polarization states were set to be orthogonal to each other with the help of a half-wave plate, to avoid interference111In a few cases when the wave-plate was removed, there were no significant differences in the stable orbits.. The microscope objectives were placed on manual translation mounts with differential micrometers to aid the displacement of beams along the direction of laser propagation () and in one of the perpendicular directions (). Gravity acts along the - direction. A low power, visible (632.8 nm) laser for imaging and detection purposes was aligned along the optical axis ().
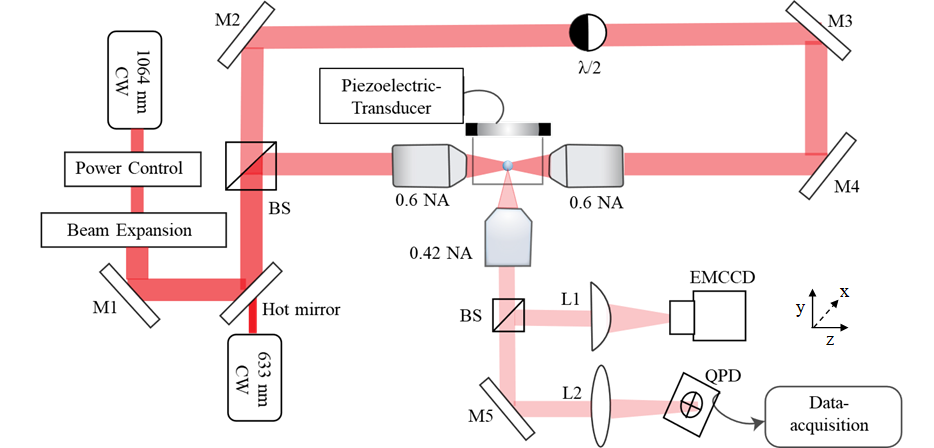
Silica spheres of diameter 4.820.38 m were initially dispersed on a silica glass coverslip. To overcome the attractive van der Waals and capillary interactions between particles and the glass substrate, the coverslip was oscillated with a piezoelectric transducer (70-2221, APC International Ltd.). To achieve the high accelerations necessary to detach the particles from the glass surface, the piezo-transducer was driven with a high power ( W) square wave at the resonance frequency ( kHz) of the piezoelectric ring for 1 millisecond. The ultrasonic launcher assembly was placed above the optical trap, Figure 1. The coverslip holding the particles and the glass chamber formed a sealed enclosure to ensure protection from air currents. The terminal speed of a descending particle was calculated to be mm/s.
A long working distance objective (Mitutouyo Plan Apo 20X) was aligned perpendicular to the optical trap axis (along axis) to collect scattered light from the trapped particle. Half of the scattered light was directed to a quadrant photodiode to measure the displacement of particle along the axis of propagation of laser beams (), and along one of the transverse axes (). The other half of scattered light was projected onto an EMCCD camera (iXon +897, Andor Technology) to visualize particle motion employing short exposure times and determine the speed of the particle along its trajectory.
3 Simulation of Particle Dynamics
The optical force acting on a particle in a dual-beam optical trap was calculated using a formalism based on the ray (geometric) optics approximation, which is valid when the size of the particle is much larger than the wavelength of illumination. For our case of sphere diameters m, this constraint is marginally satisfied. Under the ray optics approximation, a focused laser beam is considered to consist of a collection of rays and the forces acting on the particle due to individual rays reflecting and/or refracting at surfaces are calculated25, 26. The optical force from a single ray was divided into two orthogonal components which were calculated using the following equations25.
| (1) |
where is the refractive index of the surrounding medium ( for our case) and is the speed of light in vacuum. The unit vectors and are parallel and perpendicular to the ray of light, respectively, and both lie in the plane of incidence. For a spherical particle, the additional rays produced by subsequent reflections and/or refractions all lie also in the same plane of incidence. Since a force on the sphere is determined by a change in ray direction, these forces must also lie in the original plane of incidence and hence can be expanded in terms of and alone. The fractions of momentum transferred by light to the particle in the direction parallel and perpendicular to the ray, and , respectively, are given by the following expressions 27.
| (2) |
where and are the angle of incidence and angle of refraction of the ray of light. and are Fresnel coefficients of reflection and transmission, respectively. Rather than sorting out the amount of and polarization to associate with each incident ray depending on where it hits the surface, we simply use average values: , .
In equation 1, denotes the differential power in an incident ray hitting a small patch of surface area () on the sphere and is given by the following equation:
| (3) |
where is the intensity of the beam, which we describe with a Gaussian profile.
Although most of the equations we use and present here are from reference 25, their version of our equation 3 is different. Instead of , they have the cosine of the sphere’s polar angle (measured from the -axis) where it is struck by the incident ray. Since this angle can exceed , its cosine may be negative which has the unphysical implication . Another difference is that the expression for the parameter is attributed to .
Optical forces from individual rays from both beams were integrated over the whole surface area of the particle illuminated by the beam and their projections along the and transverse directions were calculated. The total forces when the sphere’s center is at are called axial, , and transverse, .
A spherical particle moving in an optical trap at the location is also influenced by a viscous drag force from the surrounding medium:
| (4) |
where Pas is the dynamic viscosity of air28, is the radius of the silica sphere and is its velocity. The trajectory of a trapped particle was determined by solving Newton’s equation of motion in two dimensions.
| (5) |
where is the mass of the particle. Others have gone further than our simple treatment. For instance one can allow in the medium for random, Langevin forces in addition to viscous drag 21, 22. One also can do a full 3D calculation of forces, including forces and motion in the the -direction 21, 22. We have done a few 3D calculations but find that the motion in the plane is scarcely changed, with the excursions along being a small fraction of a micron. The results presented here were all done in 2D, within the plane.
The particle positions at different times separated by small increments (t) were computed by numerically solving the finite-difference form of equation 5 using a Runge-Kutta order approach. Typically, t was taken to be 10 s or less. The initial velocity of the particle was kept below 1 m/ms in the plane to roughly match its magnitude under our experimental conditions. When the beam powers and focusing lenses are identical, the optical forces vanish half way between both the two focal planes and the two beam axes. This point is chosen as the coordinate system origin. We call the separation between the axes and the separation between the focal planes. For , the axis of the beam coming from the right (left) crosses the -axis at . We assume the beam on the right (left) has its focal plane at , where . These choices suggest that the motion away from the origin should be counterclockwise. This qualitative behavior occurs in all our calculations, after the decay of initial transients. A further consequence of our choices of common beam powers and identical lenses is that the optical forces are antisymmetric under inversion through the origin. This means,
| (6) |
The reason for this antisymmetry is that inverting the 2D coordinates of the sphere switches which focal plane and beam axis it is closest to. In all our calculations, will be positive and, except where explicitly noted, will be positive too, and usually 35 . The two beam powers are identical, with usually 0.25 W. In most of our calculations, the silica sphere’s radius () is 2.5
4 Results and discussion
The optical forces acting on a silica sphere in a trapping configuration with two collinear (=0, =35m) and counter-propagating beams are presented in Figure 2. As expected, raising the common laser power, , smoothly increases these forces. When the sphere is on the or axis, it feels a restoring force only in the transverse or axial direction in Figure 2a or Figure 2b. Close to the origin, these forces are linear in the displacement from the origin. Their limiting slopes give an estimate of the trap stiffness which is here N/m for either direction. If a sphere is released from rest on an axis, it moves along the axis like a damped oscillator, coming to rest at the origin. If the sphere starts instead at an off-axis point, it follows a decaying Lissajous path to the origin. Figures LABEL:f:decay,LABEL:f:trap illustrate these behaviors. Further away from the origin, the magnitude of the transverse force reaches a maximum more quickly than the axial force, which does not have a maximum until has moved past a focal plane. As the sphere, moving along the -axis and away from the origin, goes through a focal plane, the rays striking it switch from diverging to converging, resulting in additional structure in the axial force profile. Finally, we note that the maximum restoring force along the axial direction is several times higher than the restoring force along the transverse direction, in contrast to single beam optical traps29.
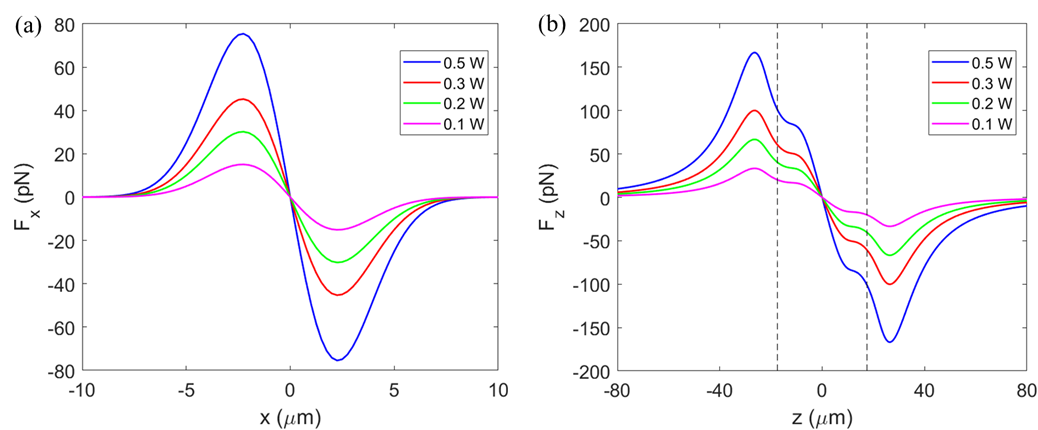
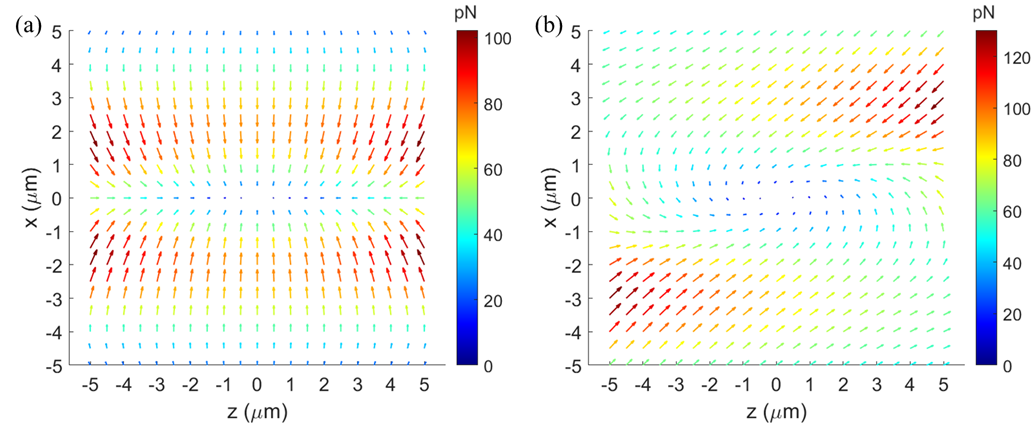
Figure 3 compares the distribution of optical forces over two dimensions for zero or non-zero beam transverse offset. In both cases, the antisymmetry under inversion of the optical force field is obvious. When the beams are collinear in Figure 3a, the optical force is directed mostly towards the center which leads to the motions discussed in the previous paragraph. However when a transverse offset is present as in Figure 3b, a “swirling” of the force field becomes evident, suggesting that rotational orbits will be possible. In this case, the curl of the total force is non-zero around the trap center. Thus, the force cannot be generated by a Hamiltonian of the familiar isotropic kinetic energy + scalar potential type 30. A line integral of the optical force on a closed path that surrounds the origin will be non-zero, which means that the forces are non-conservative and that one needs the viscous drag in order to stabilize an orbit. Another subtle feature of Figure 3b is that contrary to the impression gained by looking at the red arrows, the beam axes are not at = but in fact at == . Only by going to larger values of do the separate effects of the two beams become clear. See Figure S3 for the case with =6 along with the force field profile of a single beam in Figure S4.
Examples illustrating different stable closed trajectories, after transients (typically less than 5 ms), associated with different transverse offsets are shown in Figure 4. The common beam power is again 0.25 W. The calculations were all started with the sphere stationary at ()=(0,1 m). We have plotted the results in different ways to emphasize different features. For Figure 4b and 4c, we have used identical ranges for the and axes, adapted to the size of the orbit. This prevents the force vectors from appearing to be rotated due to a stretching of one axis. The force vectors then better appear to be “guiding” the sphere along its trajectory. We have used quotes here because forces only directly produce accelerations, not velocities or locations. In addition, the plotted force field omits the drag force. The orbit in Figure 4b is confined well inside the focal planes and its frequency is 1587 Hz. The projections of the sphere’s location along the and axes were analyzed as a function of time, after it had settled into the stable orbit (Figure LABEL:f:fieldb). The trajectory in Figure 4c is not a stable orbit for our viscosity. However, if the viscosity is reduced by a factor of 2, a stable, nearly elliptical orbit is obtained.
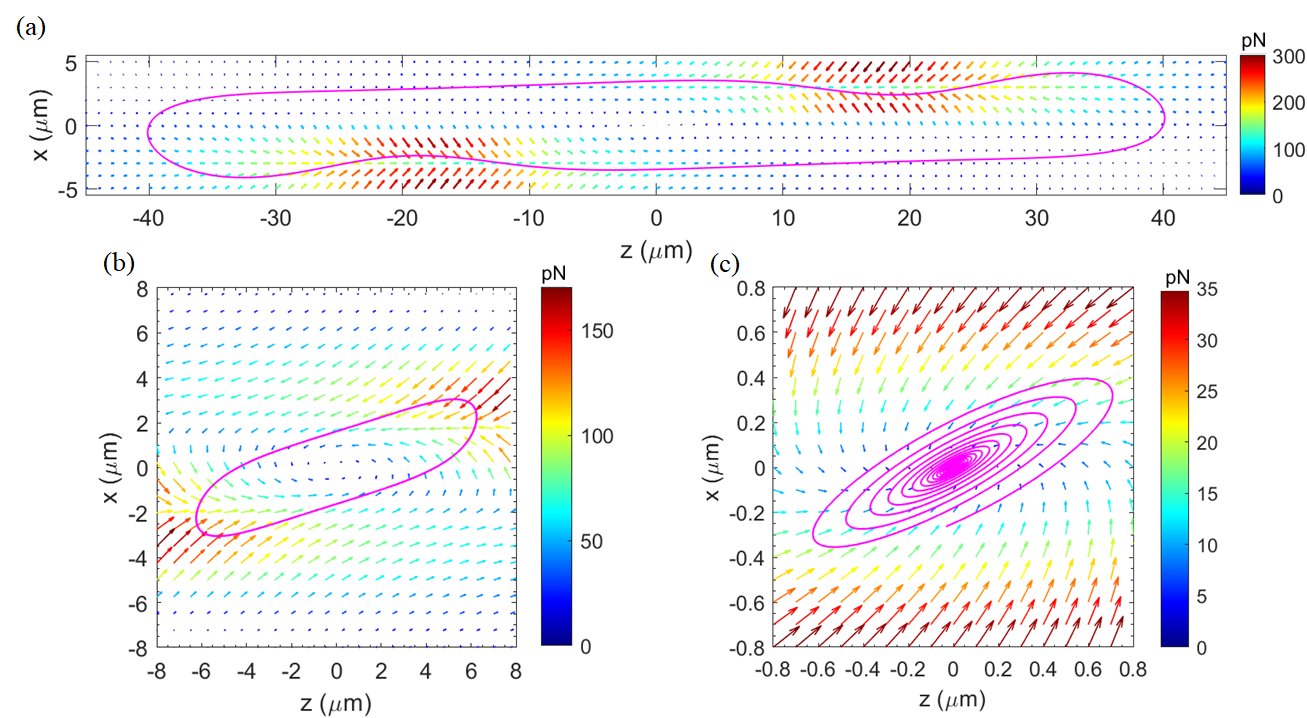
For the case of Figure 4a, we have stretched the axes to be able to include the whole orbit. The ratio of the orbit’s length/width is nearly 10 and the orbit extends past each focal plane. Such an orbit is physically impossible in a dual fiber trap. There are noticeable dips in the trajectory when the sphere is close to the focal points of the beams. These can be understood by zooming in on sections of the orbit (Figure LABEL:f:zoom). The orbit’s frequency is 474 Hz. The time-domain signal for the sphere’s location around this orbit is shown in Figure LABEL:f:fielda. The -component shows a fine structure when the sphere is in the region of the dips. The electric field intensity distribution inside the trap corresponding to trapping schemes shown in Figure 4a,b can be found in Figure LABEL:f:arch.
There are some common features of the stable, single-loop orbits in Figure 4a,b. The sphere moves counterclockwise around its orbit and each orbit is centered about the origin. Indeed the orbits have an inversion symmetry about the origin in that if a point is on the orbit then so too is the point and its velocity there is the negative of that at . These symmetries arise from the antisymmetry of the optical forces, equation 6, but do not always occur. Orbits that lack such inversion symmetry will be shown later.
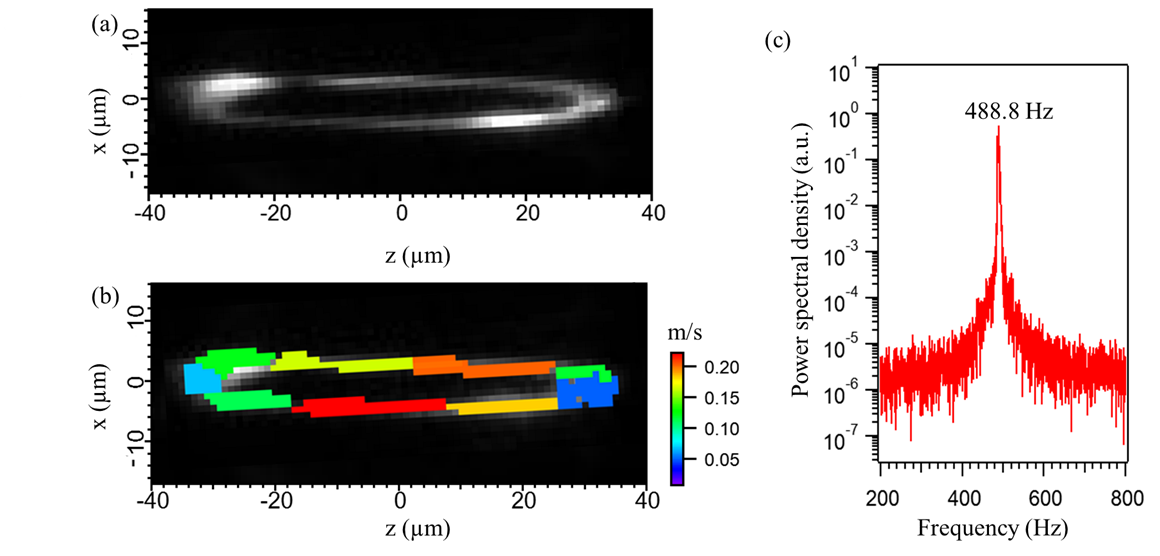
Experimental results for the particle dynamics in a dual-beam trap with a transverse offset of 6 m and an axial offset of m are presented in Figure 5. The EMCCD image of particle’s orbit acquired at an exposure time of 3 ms/frame is shown in Figure 5a. The maximum displacements of the particle along axial and transverse axes agree well with the simulation results for the same experimental parameters (Figure 4a). The speed of the particle at different locations on its trajectory is mapped along the orbit in Figure 5b. According to our calculations, the particle attains maximum speed in the vicinity of the laser foci, while moving along the dips in the trajectory shown in Figure 4a. Even though these fine features of the orbit are not well resolved in the EMCCD image, it is evident from the speed distribution that the particle moves the fastest on the quasi-linear segments of the trajectory where the dips are expected. We note that the maximum measured velocity (10’s of cm/s), and the particle diameter are similar to values encountered in the updraft of cloud aerosol particles 31, which makes lensed orbital trapping interesting for controlled laboratory experiments of atmospheric relevance.
The scattered light power spectrum result of the micro-sphere motion along axis is shown in Figure 5c. The power spectral distribution was calculated using the following equation:
| (7) |
where is the power spectral distribution corresponding to the sphere’s displacement in real time (), is the duration over which the signal is recorded and is the observation angular frequency. The power spectrum shows a distinct peak corresponding to sphere’s orbital frequency at 488.8 Hz, which is consistent with the theoretical prediction.
To further test the computational approach against the experiment, we have examined how the orbital frequency and spatial extent of the trajectories change separately with transverse offset, axial offset, and laser power, Figure 6 and Figure 7. Figure 6 a,b shows the changes in orbital frequency and maximum axial displacement of the particle (), respectively, upon varying with and held constant.
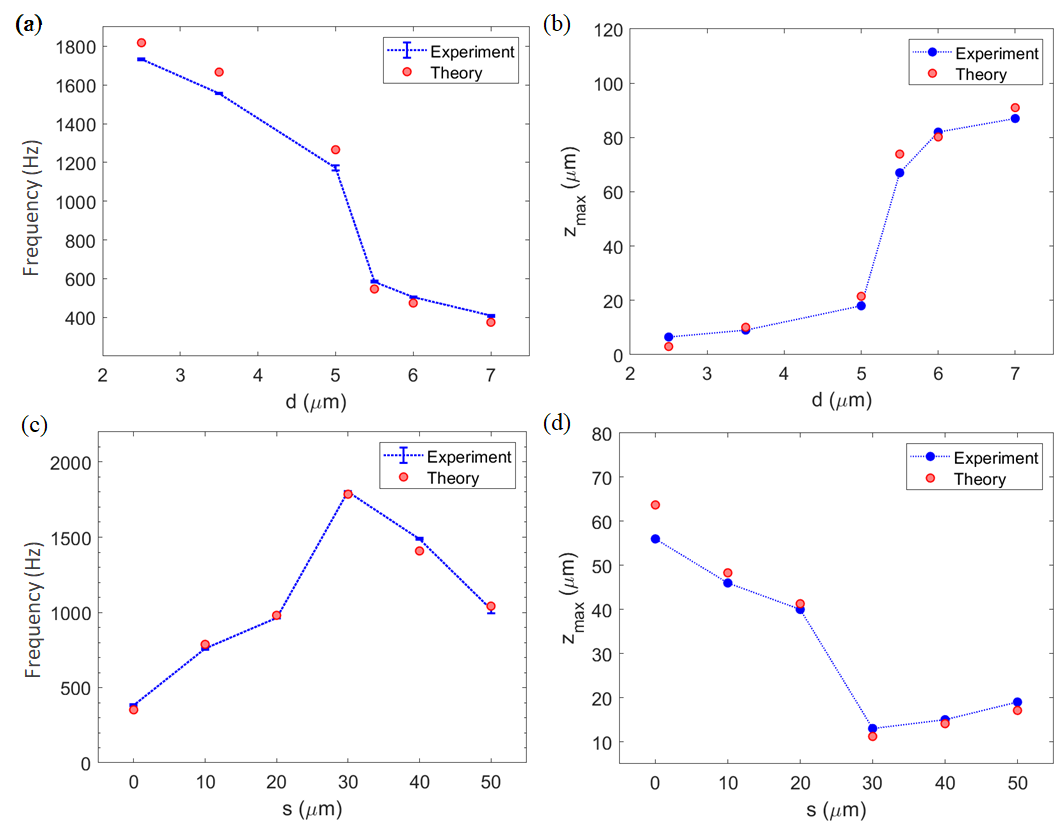
On increasing , the orbital frequency decreases with a more rapid drop around =5 m. In contrast, the orbit size increases with with a more rapid rise near =5 m. The typical speed of the sphere slightly increases over the range of , so the key to the frequency decrease is the large increase in the orbit size - see Figs.4a,b and below.
Next, we explored how particle dynamics are changed by variations in at fixed and , Figure 6c,d. The changes are not monotonic in : the orbital frequency first increases and then after =30 decreases, while has a shallow minimum near =30. Again a rationale is based on considering orbit size. When is small, is considerably larger than and a large orbit implies (with only a modest increase in speed) that the orbital frequency will be smaller. In the limit of large , the optical forces near the origin become very weak and the viscous drag leads to lower speeds in orbits of nearly constant size, which implies a decrease in orbital frequency. In a lensed, dual-beam trap, both negative and positive axial offsets can be realized. Crossing the two foci for negative axial offsets destabilizes the optical trap leading to particle escape. This result was also predicted by the theoretical model (Figure LABEL:f:escape).
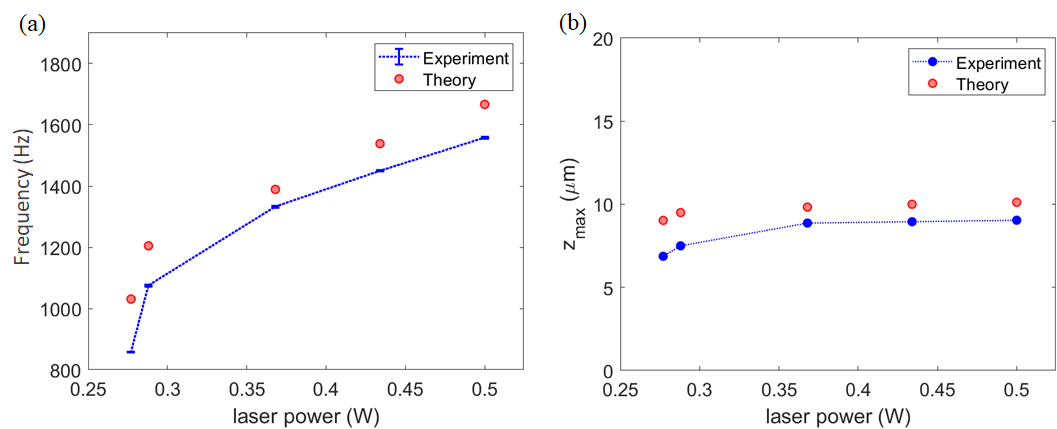
Lastly, we studied the change in particle response when the common laser power of the beams, , is varied while keeping and fixed. Figure 7. Upon increasing the optical power, the particle experiences an increased magnitude of optical force resulting in an increase in the orbital frequency. Interestingly, the orbit size quickly reaches a saturation value while the frequency continues to grow. To maintain a balance between optical and drag forces the speeds in an orbit need to increase when increases, leading to greater frequencies since is saturating. With reasonable laser powers, kHz frequencies can be attained inside a dual-beam lensed orbital trap.
To summarize our results so far, there is good agreement between experiments and simulations for the dependencies on , , and , which suggests that the several approximations made in constructing our theoretical model are reasonable.
Since, for a given pressure, the dynamics of the particle in the trap depends on its size, mass, and composition, changes in the dynamics, measurable as frequency shifts and/or orbit shape can be indicative of particular changes in the particle properties. The next question to address is whether orbital trapping could qualify as an analytical technique for the in-situ characterization of the chemical and physical changes occurring on single particles in interaction with a gaseous medium. So far, we have seen that one can obtain sharp frequency peaks under experimental conditions that are relevant to atmospheric ones, which have not been explored much, yet (for instance, accretion at drift velocities relevant to updrafts in clouds).
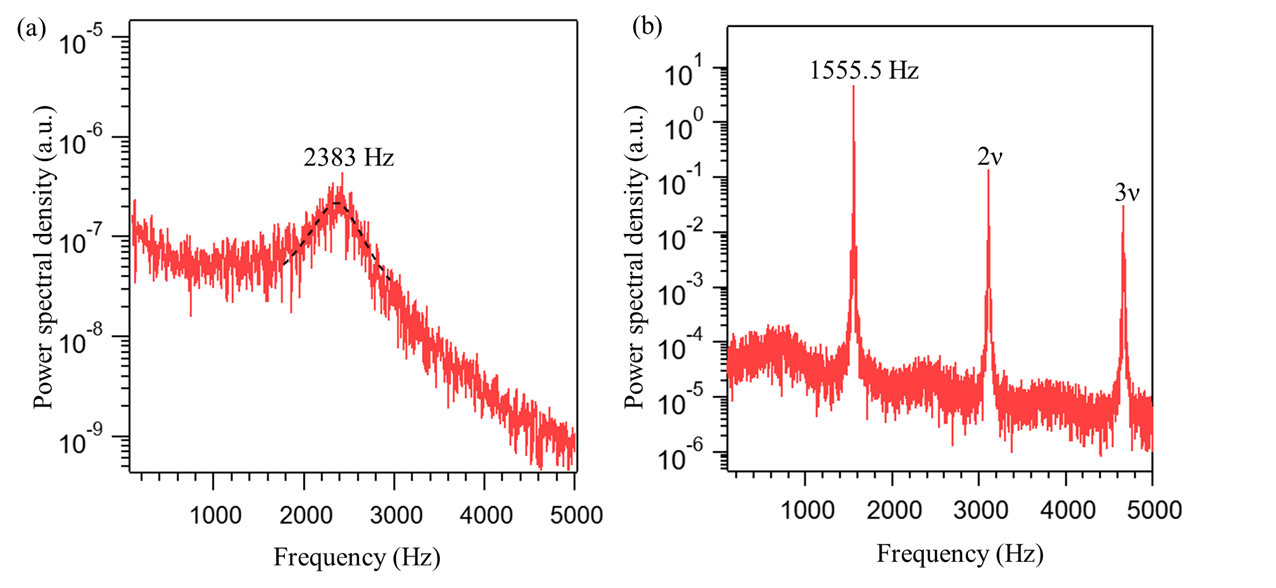
A comparison of power spectra of scattered light collected from a particle, under two different trapping scenarios is given in Figure 8. The power spectrum for periodic oscillation of particle in a dual-beam trap with coaxial beams (Figure 8a) was fit with the following equation32, 33
| (8) |
The resonance frequency () and the linewidth () of the distribution were measured to be 2383 Hz and 530 Hz, respectively. The quality factor for the collinear trap configuration is thus , Figure 8a. Figure 8 b, corresponds to the frequency spectrum of particle dynamics in a dual-beam trap with a transverse offset. The orbital frequency () was determined to be 1555.5 Hz, with a linewidth of 10 Hz. The data were acquired over a duration of s. The quality factor in this case is . The spectrum also contains peaks for higher harmonics of the fundamental frequency. This is due to the non-harmonic nature of the particle’s orbital motion.
Compared to the oscillatory motion in a traditional trap, the sustained orbital rotation of a particle results in scattered light power spectra with much sharper peaks. Comparable spectral linewidths for conventionally trapped microspheres have only been attained in vacuum conditions33.
From the point of view of applications, like for atmospheric aerosol studies, observation of reaction kinetics on levitated particles often require broad time scales, from ms to hundreds of seconds. When using the maximum bandwidth of the acquisition system the observation time was extended to 8 seconds, and the spectral signatures of a particle in an orbital trap with a transverse offset of 5.5 m showed an intriguing form of broadening. The spectrum contained a collection of distinct peaks spanning a frequency range of less than 10 Hz, Figure 9. The linewidth associated with the individual peaks from this distribution was about 0.2 Hz. The existence of multiple, well-separated peaks in the power spectrum suggests that there are different “modes” or metastable dynamic states, and the actual trajectory might not be described by a simple single orbit as the calculations suggest. Later on, we will discuss a possible explanation for this result, which suggests a pathway to an even higher quality factor (and thus, sensitivity) for the orbital optical trap. For now, it is worth noting that, if a trapping scheme could be engineered to stabilize the particle in one of the states corresponding to a single narrow peak in Figure 9, it should be possible to obtain very narrow linewidths thus enhancing sensitivity to changes in mass or size of the particle. The scattered light power spectrum under the same experimental parameters, recorded for a wider frequency range can be found in Figure LABEL:f:spectrum.
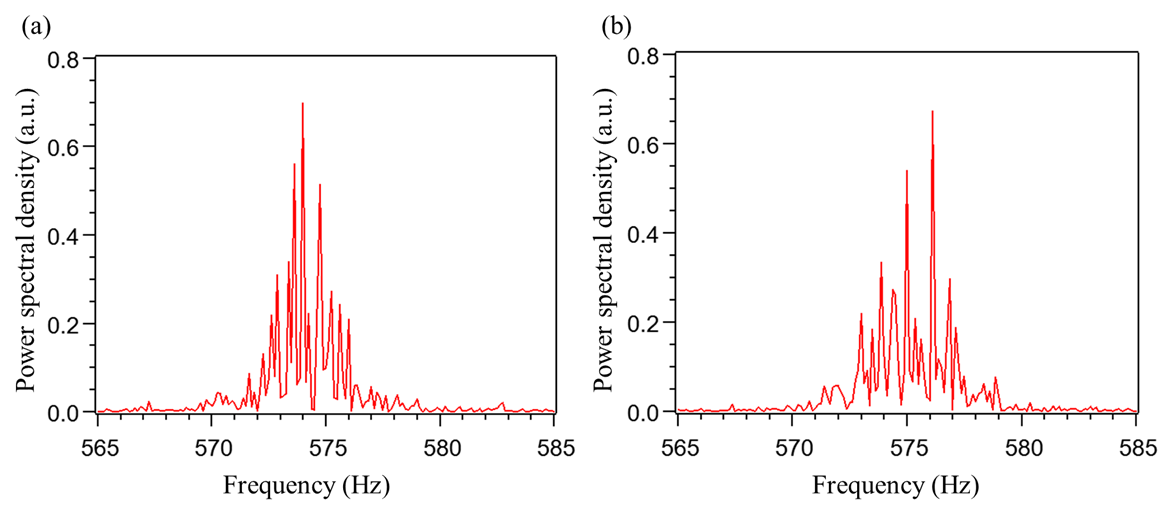
Calculations based on the ray optics approximation (Figure LABEL:f:freq), indicate that the orbital frequency varies nearly linearly with respect to particle radius. For the aforementioned experimental parameters, a change in frequency of 0.2 Hz corresponds to a change in particle radius of 2 nm. However, when the transverse offset between the beams was decreased to 3 m, the linewidth associated with the sharpest peak in the distribution (power spectrum given in Figure LABEL:f:peaks_2) was adequate to resolve a change in radius of 0.5 nm (Figure LABEL:f:freqb) or about a 0.06% mass change of particle under consideration. Thus, by tuning the laser parameters, orbital trapping can be made extremely sensitive towards deposition or loss of materials on the surface of a trapped particle.
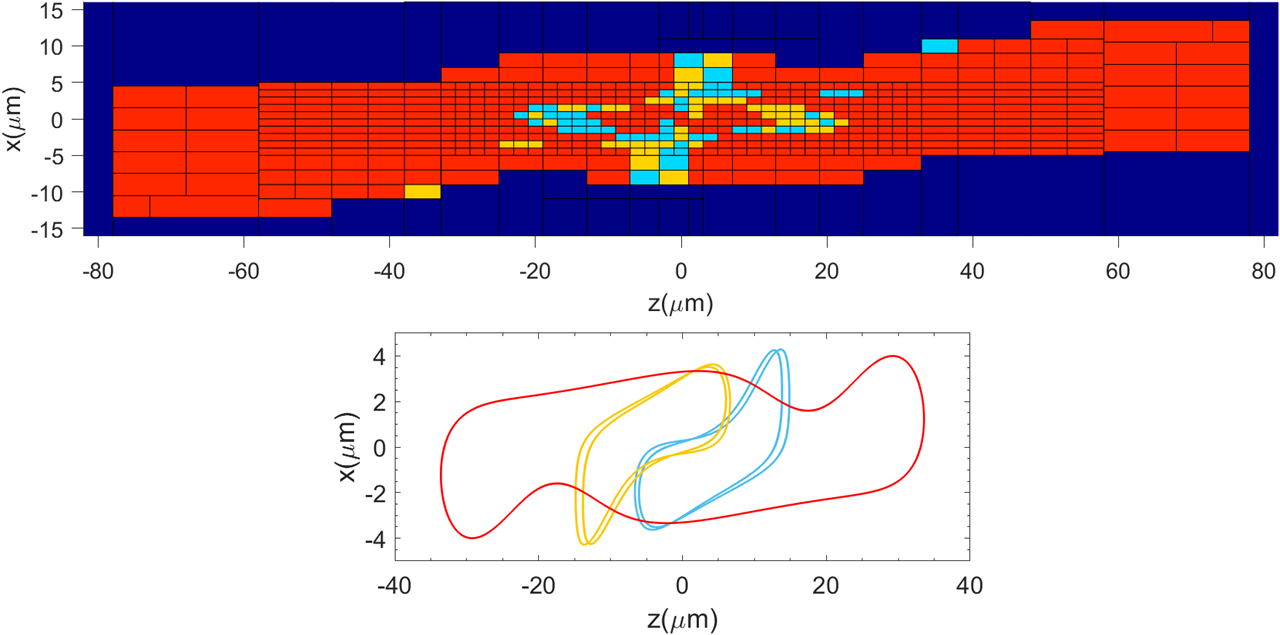
To discern the appearance of multiple peaks in the power spectrum, we investigated whether it is feasible for the particle to progress along more than one trajectory under the same experimental conditions. To this end, we simulated the dynamics of a particle by systematically varying its point of entry in the optical field in a dual-beam trap with a transverse offset of 5 m, Figure 10. (A similar analysis for a trapping scheme with =4 m can be found in Figure LABEL:f:pixelplot). Our survey results indicate that, depending on where it starts, the particle could be advancing along one of the three distinct periodic orbits (Figure 10) color-coded in red, yellow and pale blue. The regions of instability in the trap are highlighted in indigo. The red orbit has an inversion symmetry and a frequency of 621 Hz. The pale blue and yellow trajectories are degenerate orbits. They both have an asymmetric structure, but are related to each other by inversion through the origin. This means that if a point () is on a yellow orbit, the point () is on a blue orbit. They also differ from the rest of the orbits we have seen so far in that they are double-loop orbits. The particle spends the same amount of time in individual loops of the orbit. The orbital frequency (associated with a single loop) in this case is 1266 Hz. The -projection of these orbits as a function of time are presented in Figure LABEL:f:zpro. If the particle is initially launched in the area ranging from -30 m to +30 m in the axial () direction and -10 m to +10 m in the transverse () direction, it will be difficult to predict the exact orbit along which the particle moves during the course of an experiment since even a mere 2 m difference in the point of entry along either axis can entirely change the course of the particle. Unfortunately, all three orbits lie in this area, and as evident from Figure 10, there are multiple locations at which the orbits crossover. Hence, even a slight external perturbation, such as thermal fluctuations, could result in the particle migrating randomly from one orbit to another. Thus, we propose that the presence of multiple peaks in the power spectrum can be attributed to orbit cross-over. The real trajectory of the particle may not be a simple, closed orbit as predicted by our theory, which at this time does not include any random, Langevin forces.
Our analysis suggests that, in order to obtain superior resolving power, particle motion has to be stabilized along a single orbit. Although there are various sites in the trap where the orbits overlap, the orbital frequency associated with the red trajectory in Figure 10 is nearly half of that of the other orbits. Therefore, we hypothesize that, once the particle’s dynamics is initiated along the red orbit, shifting to another path might be unfavorable. To attain selectivity towards the red orbit, the particle must be loaded at least 30 m away from the origin in the axial direction. With our current experimental setup, preferential launching of particles into specific regions in the trap can not be achieved. Future experiments will address this challenge.
The possibility of more than one type of particle trajectory for the same laser parameters complicates the trends shown in Figure 6. However, the orbits we observe in our experiments always closely match with one of the orbits predicted by the theory in its shape and frequency. Whether other choices of , , and could lead to different types of orbits is yet to be fully explored. A complete optimization of orbital trapping is worth pursuing, in view of the potential of this technology for studying systems mimicking atmospheric aerosol particles in reactive environments. Previously, quantitative measurements of atmospherically relevant reactions on levitated, solid particles were achieved by monitoring the time evolution of Raman signatures of the trapped particles34, 35, 36. Kinetics of evaporation, hydration and coagulation of levitated micro-droplets were studied in general by combining optical trapping with other optical techniques37, 38, 39, 40. The approach presented here is amenable to in-situ simultaneous spectroscopic and precise physical properties measurements.
5 Conclusion
Orbital optical trapping of a micro-particle in air was demonstrated with a lensed, dual-beam trap with a transverse offset. The characteristics of particle dynamics were analyzed by varying the optical power, the transverse offset between the beams, and the axial offsets between the laser foci, both experimentally and computationally. Under our experimental conditions, the spectral features associated with orbital trapping exhibit higher Q factors than conventional, single focus trapping. Considering that the evolution of orbital frequencies can be correlated to changes in physicochemical properties of the particle in real time, the orbital trapping technique could be applied in the future to probing the kinetics of surface reactions on free, single particles and levitated micro-droplets held in a controlled environment. Once fully optimized, our experimental scheme could provide a powerful, standalone method to explore surface reactions occurring on levitated particles.
Contains details on particle dynamics in collinear dual-beam trap, optical force distribution and electric field intensity mapping for different trapping schemes, scattered light power spectra obtained under different trapping conditions, radius dependence of orbital frequency
A.R. thanks Dr. Irina Tsvetkova for helpful discussions. The work was partly supported by the U.S. Army Research Office through award #W911NF1310490.
References
- Ashkin 1970 Ashkin, A. Acceleration and Trapping of Particles by Radiation Pressure. Physical Review Letters 1970, 24, 156–159
- Gao et al. 2017 Gao, D.; Ding, W.; Nieto-Vesperinas, M.; Ding, X.; Rahman, M.; Zhang, T.; Lim, C. T.; Qiu, C. W. Optical manipulation from the microscale to the nanoscale: Fundamentals, advances and prospects. Light: Science and Applications 2017, 6, e17039
- Bradac 2018 Bradac, C. Nanoscale Optical Trapping: A Review. Advanced Optical Materials 2018, 6, 1800005
- Bustamante et al. 2021 Bustamante, C. J.; Chemla, Y. R.; Liu, S.; Wang, M. D. Optical tweezers in single-molecule biophysics. Nature Reviews Methods Primers 2021, 1, 25
- Block et al. 1997 Block, S. M.; Wang, M. D.; Yin, H.; Landick, R.; Gelles, J. Stretching DNA with Optical Tweezers. Biophysical Journal 1997, 72, 1335–1346
- Madsen et al. 2021 Madsen, L. S.; Waleed, M.; Casacio, C. A.; Terrasson, A.; Stilgoe, A. B.; Taylor, M. A.; Bowen, W. P. Ultrafast viscosity measurement with ballistic optical tweezers. Nature Photonics 2021, 15, 386–392
- Ito et al. 2007 Ito, S.; Sugiyama, T.; Toitani, N.; Katayama, G.; Miyasaka, H. Application of fluorescence correlation spectroscopy to the measurement of local temperature in solutions under optical trapping condition. Journal of Physical Chemistry B 2007, 111, 2365–2371
- Gong et al. 2018 Gong, Z.; Pan, Y. L.; Videen, G.; Wang, C. Optical trapping-Raman spectroscopy (OT-RS) with embedded microscopy imaging for concurrent characterization and monitoring of physical and chemical properties of single particles. Analytica Chimica Acta 2018, 1020, 86–94
- Gonzalez-Ballestero et al. 2021 Gonzalez-Ballestero, C.; Aspelmeyer, M.; Novotny, L.; Quidant, R.; Romero-Isart, O. Levitodynamics: Levitation and control of microscopic objects in vacuum. Science 2021, 374, eabg3027
- Stickler et al. 2021 Stickler, B. A.; Hornberger, K.; Kim, M. S. Quantum rotations of nanoparticles. Nat Rev Phys 2021, 3, 589–597
- Krieger et al. 2012 Krieger, U. K.; Marcolli, C.; Reid, J. P. Exploring the complexity of aerosol particle properties and processes using single particle techniques. Chem. Soc. Rev. 2012, 41, 6631–6662
- Houle et al. 2021 Houle, F. A.; Miles, R. E.; Pollak, C. J.; Reid, J. P. A purely kinetic description of the evaporation of water droplets. J. Chem. Phys. 2021, 154, 054501
- Arita et al. 2011 Arita, Y.; McKinley, A. W.; Mazilu, M.; Rubinsztein-Dunlop, H.; Dholakia, K. Picoliter rheology of gaseous media using a rotating optically trapped birefringent microparticle. Analytical Chemistry 2011, 83, 8855–8858
- Bishop et al. 2004 Bishop, A. I.; Nieminen, T. A.; Heckenberg, N. R.; Rubinsztein-Dunlop, H. Optical microrheology using rotating laser-trapped particles. Physical Review Letters 2004, 92, 198104
- Ahn et al. 2020 Ahn, J.; Xu, Z.; Bang, J.; Ju, P.; Gao, X.; Li, T. Ultrasensitive torque detection with an optically levitated nanorotor. Nature Nanotechnology 2020, 15, 89–93
- Asavei et al. 2009 Asavei, T.; Loke, V. L.; Barbieri, M.; Nieminen, T. A.; Heckenberg, N. R.; Rubinsztein-Dunlop, H. Optical angular momentum transfer to microrotors fabricated by two-photon photopolymerization. New Journal of Physics 2009, 11, 093021
- Blakely et al. 2008 Blakely, J. T.; Gordon, R.; Sinton, D. Flow-dependent optofluidic particle trapping and circulation. Lab on a Chip 2008, 8, 1350–1356
- Chen et al. 2016 Chen, X.; Xiao, G.; Yang, K.; Xiong, W.; Luo, H. Characteristics of the orbital rotation in dual-beam fiber-optic trap with transverse offset. Optics Express 2016, 24, 16952
- Xiao et al. 2016 Xiao, G.; Yang, K.; Luo, H.; Chen, X.; Xiong, W. Orbital rotation of trapped particle in a transversely misaligned dual-fiber optical trap. IEEE Photonics Journal 2016, 8, 1–8
- Xu et al. 2016 Xu, X.; Cheng, C.; Zhang, Y.; Lei, H.; Li, B. Dual focused coherent beams for three-dimensional optical trapping and continuous rotation of metallic nanostructures. Scientific Reports 2016, 6, 29449
- Li et al. 2018 Li, W.; Li, N.; Shen, Y.; Fu, Z.; Su, H.; Hu, H. Dynamic analysis and rotation experiment of an optical-trapped microsphere in air. Applied Optics 2018, 57, 823–828
- Zhu et al. 2021 Zhu, X.; Li, N.; Yang, J.; Chen, X.; Hu, H. Revolution of a trapped particle in counter-propagating dual-beam optical tweezers under low pressure. Optics Express 2021, 29, 11169–11180
- Lavrik and Datskos 2003 Lavrik, N. V.; Datskos, P. G. Femtogram mass detection using photothermally actuated nanomechanical resonators. Applied Physics Letters 2003, 82, 2697–2699
- Ni et al. 2012 Ni, K. K.; Norte, R.; Wilson, D. J.; Hood, J. D.; Chang, D. E.; Painter, O.; Kimble, H. J. Enhancement of mechanical Q factors by optical trapping. Physical Review Letters 2012, 108, 214302
- Sidick et al. 1997 Sidick, E.; Collins, S. D.; Knoesen, A. Trapping forces in a multiple-beam fiber-optic trap. Applied Optics 1997, 36, 6423–6433
- Chen et al. 2016 Chen, X.; Xiao, G.; Luo, H.; Xiong, W.; Yang, K. Dynamics analysis of microsphere in a dual- beam fiber-optic trap with transverse offset. Optics Express 2016, 24, 7575–7584
- Ashkin 1992 Ashkin, A. Forces of a single-beam gradient laser trap on a dielectric sphere in the ray optics regime. Biophysical Journal 1992, 61, 569–582
- Kaye and Laby 1995 Kaye, G. W. C.; Laby, T. H. Tables of physical and chemical constants, 16th ed.; Essex, England; New York: Longman, 1995
- Rohrbach 2005 Rohrbach, A. Stiffness of optical traps: Quantitative agreement between experiment and electromagnetic theory. Physical Review Letters 2005, 95, 168102
- Berry and Shukla 2015 Berry, M. V.; Shukla, P. Hamiltonian curl forces. Proc. R. Soc. A Math. Phys. Eng. Sci. 2015, 471, 20150002
- Guibert et al. 2003 Guibert, S.; Snider, J. R.; Brenguier, J. L. Aerosol activation in marine stratocumulus clouds: 1. Measurement validation for a closure study. J. Geophys. Res. Atmos. 2003, 108, 8628
- Berg-Sørensen and Flyvbjerg 2004 Berg-Sørensen, K.; Flyvbjerg, H. Power spectrum analysis for optical tweezers. Review of Scientific Instruments 2004, 75, 594–612
- Li et al. 2011 Li, T.; Kheifets, S.; Raizen, M. G. Millikelvin cooling of an optically trapped microsphere in vacuum. Nature Physics 2011, 7, 527–530
- Rkiouak et al. 2014 Rkiouak, L.; Tang, M. J.; Camp, J. C.; McGregor, J.; Watson, I. M.; Cox, R. A.; Kalberer, M.; Ward, A. D.; Pope, F. D. Optical trapping and Raman spectroscopy of solid particles. Physical Chemistry Chemical Physics 2014, 16, 11426–11434
- Tang et al. 2014 Tang, M. J.; Camp, J. C.; Rkiouak, L.; McGregor, J.; Watson, I. M.; Cox, R. A.; Kalberer, M.; Ward, A. D.; Pope, F. D. Heterogeneous interaction of SiO2with N2O5: Aerosol flow tube and single particle optical levitation-Raman spectroscopy studies. Journal of Physical Chemistry A 2014, 118, 8817–8827
- Gong et al. 2019 Gong, Z.; Pan, Y. L.; Videen, G.; Wang, C. Chemical reactions of single optically trapped bioaerosols in a controlled environment. Aerosol Science and Technology 2019, 53, 853–859
- David et al. 2016 David, G.; Esat, K.; Ritsch, I.; Signorell, R. Ultraviolet broadband light scattering for optically-trapped submicron-sized aerosol particles. Physical Chemistry Chemical Physics 2016, 18, 5477–5485
- Ingram et al. 2017 Ingram, S.; Cai, C.; Song, Y. C.; Glowacki, D. R.; Topping, D. O.; O’Meara, S.; Reid, J. P. Characterising the evaporation kinetics of water and semi-volatile organic compounds from viscous multicomponent organic aerosol particles. Physical Chemistry Chemical Physics 2017, 19, 31634–31646
- Buajarern et al. 2007 Buajarern, J.; Mitchem, L.; Reid, J. P. Characterizing the formation of organic layers on the surface of inorganic/aqueous aerosols by Raman spectroscopy. Journal of Physical Chemistry A 2007, 111, 11852–11859
- Wang et al. 2021 Wang, C.; Pan, Y.-L.; Videen, G. Optical trapping and laser-spectroscopy measurements of single particles in air: a review. Measurement Science and Technology 2021, 32, 102005