RadioTransformer: A Cascaded Global-Focal Transformer for Visual Attention–guided Disease Classification
Abstract
In this work, we present RadioTransformer, a novel student-teacher transformer framework, that leverages radiologists’ gaze patterns and models their visuo-cognitive behavior for disease diagnosis on chest radiographs. Domain experts, such as radiologists, rely on visual information for medical image interpretation. On the other hand, deep neural networks have demonstrated significant promise in similar tasks even where visual interpretation is challenging. Eye-gaze tracking has been used to capture the viewing behavior of domain experts, lending insights into the complexity of visual search. However, deep learning frameworks, even those that rely on attention mechanisms, do not leverage this rich domain information for diagnostic purposes. RadioTransformer fills this critical gap by learning from radiologists’ visual search patterns, encoded as ‘human visual attention regions’ in a cascaded global-focal transformer framework. The overall ‘global’ image characteristics and the more detailed ‘local’ features are captured by the proposed global and focal modules, respectively. We experimentally validate the efficacy of RadioTransformer on 8 datasets involving different disease classification tasks where eye-gaze data is not available during the inference phase. Code: https://github.com/bmi-imaginelab/radiotransformer
Keywords:
Eye-gaze, visual attention, chest radiographs, disease classification.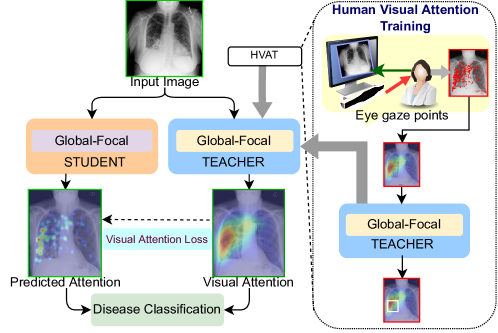
1 Introduction
Medical image interpretation and associated diagnosis relies largely on how domain experts study images. Radiologists hone their image search skills during years of training on medical images from different domains. In fact, studies have shown that systematic visual search patterns can lead to improved diagnostic performance [15, 43]. Current diagnostic and prognostic models, however, are limited to image content semantics such as disease location, annotation, and severity level, and do not take this rich auxiliary domain knowledge into account. They primarily implement hand-crafted descriptors or deep architectures that learn textural and spatial features of diseases [5, 62]. The spatial dependencies of intra-image disease patterns, often implicitly interpreted by expert readers, may not be adequately captured via image feature representation learning alone.
Recent works have utilized transformer-based architectures that leverage attention from radiological scans to provide better diagnosis [54, 59]. This is a significant advancement, as the models learn self-attention across image patches to determine diagnostically relevant regions-of-interest. Although these approaches integrate long-range feature dependencies and learn high-level representations, they lack apriori domain knowledge, fundamentally rooted in disease pathophysiology and its manifestation on images. Recently, it has been demonstrated that deep-learning networks can be trained to learn radiologists’ attention level and decisions [48]. However, it is still unclear how effectively and efficiently such search patterns can be used to improve a model’s decision-making ability. To address this gap, we propose to leverage domain experts’ systematic viewing patterns, as the basis of underlying attention and intention, to guide a deep learning network towards improved disease diagnosis.
Motivation. The motivation for our approach stems from a) understanding the importance of human visual attention in medical image interpretation, and b) understanding the medical experts’ search heuristics in decision-making. Medical image interpretation is a complex process that broadly comprises a global-focal approach involving a) identifying suspicious regions from a global perspective, and b) identifying specific abnormalities with a focal perspective. During the global screening process, a radiologist scans for coarse low-contrast features in which certain textural attributes are analyzed and prospective abnormal regions of interest are identified. In the focal process, the regions of abnormalities are re-examined to determine the severity, type of disease, or reject the assumption of abnormality. For example, while analyzing a chest radiograph for COVID-19, a radiologist skims through the thoracic region at a glance to identify suspicious regions based on intensity variations. This helps in selective identification by eliminating ‘obviously healthy’ regions. The focal feature learning process involves a more critical analysis of the suspicious regions to understand the structural and morphological characteristics of specific regions and their surroundings. This typically involves domain-specific features such as distribution of infiltrates and accumulation of fluid. We use this as a motivation to design RadioTransformer, a global-focal transformer that integrates a radiologist’s visual cognition with the self-attention-based learning of transformers. This improves their class activation regions, leading to a probabilistic score from attention features that correlates highly with human visual attention based diagnosis.
The objective of our work is to augment the learning capabilities of deep networks in a disease diagnosis setting with domain-specific expert viewing patterns in a cognitive-aware manner.
Contributions. The primary contributions of this work can be summarized as follows:
-
1.
A novel student-teacher based global-focal RadioTransformer architecture, constituting transformer blocks with shifting windows, is proposed to leverage the radiologists’ visual attention in order to improve the diagnostic accuracy. The global module learns high-level coarse representations and the focal module learns low-level granular representations with two-way lateral connections to address the semantic attention gap with smoothed moving average training.
-
2.
A novel visual attention loss (VAL) is proposed to train the student network with the visual attention regions from the teacher network. This loss teaches the student network to focus on regions from teacher-generated visual attention using a weighted combination of attention region overlap and regression of center and boundary points.
Figure 1 shows an overview of the proposed RadioTransformer architecture consisting of the global-focal student-teacher network with a novel Visual Attention Loss. While the underlying concepts of the proposed framework are domain-agnostic, in this work we have validated it on pulmonary and thoracic disease classification on chest radiographs.
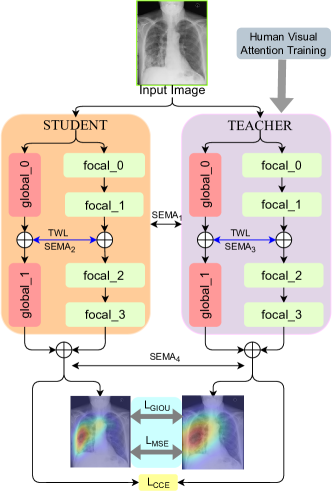
Figure 2: Global-Focal Student-Teacher network implemented using shifting window blocks cascaded in series with TWL connections and layered SEMA. 2 Related work
Eye-gaze tracking in Radiology. Eye-tracking studies have been conducted in radiology to draw insights into the visual diagnosis process [40, 15]. Experts’ visual search patterns have been studied in various diseases [33, 89, 39, 50, 92, 55] to understand their relationship with the diagnostic performance of radiologists [82, 14, 2]. Clinical error in diagnostic interpretation has often been attributed to reader fatigue and strain, which has been extensively validated via eye-tracking studies [73, 83, 17, 80]. Variations in cognition and perceptual patterns while viewing images can cause the same image being interpreted differently by different experts. This has led to a few studies displaying eye-positions from experts as a visual aid to improve diagnostic performance of novice readers [43, 37]. The dependence of diagnostic decisions on visual search patterns presents a unique opportunity to integrate this rich auxiliary domain information in computer-aided diagnosis systems.
Visual attention–driven learning. In the context of image interpretation, visual attention refers to the cognitive operations that direct an observer’s attention to specific regions in an image. We represent visual attention as saliency maps constructed by tracking users’ eye movements. Eye-gaze [35] has been used in several computer vision[53, 30] studies for head-pose estimation, human-computer interaction, driver vigilance monitoring, etc. Human eyes tend to focus on visual features, such as corners [46], luminance [72], visual onsets[75, 76], dynamic events [24, 25], color, intensity, and orientation[27, 60, 26]. Image perception, in general, is hence tightly coupled with visual attention of the observer. Several methods, involving gaze analysis, have been proposed for tasks such as object detection [90, 91, 58], image segmentation [52, 66], object referring [79], action recognition [49, 81, 41, 22], and action localization [69]. Other specialized methods use visual attention for goal-oriented localization [44] and egocentric activity recognition [51]. A recent work incorporated sonographer knowledge in the form of gaze tracking data on ultrasounds to enhance anatomy classification tasks [61]. In another study [71], Convolutional Neural Networks (CNN) trained on eye tracking data were shown to be equivalent to the ones trained on manually annotated masks for the task of tumor segmentation.
Despite evidence of the importance of expert gaze patterns in improving image interpretation, their role in machine-learning driven disease classification in radiology, is still under explored. The interpretation of radiology images is a complex task, requiring specialized viewing patterns unlike the more general visual attention in other tasks. For example, determining whether a lesion is cancerous or not involves the following hierarchical steps: a) detecting the presence of a lesion, b) recognizing whether it is pathologic, c) determining the type, and finally, d) providing a diagnosis. These sequential analysis patterns, to some extent, are captured by the visual search patterns which are not leveraged by machine learning models. To bridge this gap, our proposed work uses the visual attention knowledge from radiologists to train a transformer-based model for improving disease classification on chest radiographs.
Disease classification on chest radiographs. Reliable classification of cardiothoracic and pulmonary diseases on chest radiographs is a crucial task in Radiology, owing to the high morbidity and mortality resulting from such abnormalities. Several methods have been proposed to address this, of which the most prominent baselines, ChexNet [65], and CheXNext [64], use a Densenet-121 [21] backbone. Attention-based models such as [84], and DuaLAnet[74], have also been proposed for this diagnostic task. CheXGCN [6] and SSGE[7] are Graph Convolutional Network (GCN)–based methods; the latter proposes a student-teacher based SSL method. More recently, attempts have been made to develop methods for diagnosis and prognosis of COVID-19 from chest radiographs. Most of these methods [23, 85, 87, 47, 3] use backbones of deep convolution neural network for COVID-19 prediction. Although, CNN-based methods have achieved tremendous success through generic feature extraction strategies, these architectures often fail to comprehensively encode spatial features from a biological viewpoint[36].
To address this limitation, transformer-based approaches, such as vision transformers [12], have been proposed. The self-attention mechanism in transformers integrates global information by encoding the relative locations of the patches. Few recent works have proposed vision transformers for COVID-19 prediction task [54, 59]. However, the efficacy of shifting window based [45] transformer architectures has not been evaluated in this domain. These recent methods compute self-attention among patches within local windows. As an example, Swin-UNet [4] implements swin transformer blocks for medical image segmentation. These blocks are well suited to characterize intra-image disease heterogeneity, a very crucial factor affecting diagnosis and patient prognosis. This motivates our choice of using shifting window blocks in the proposed global-focal network.
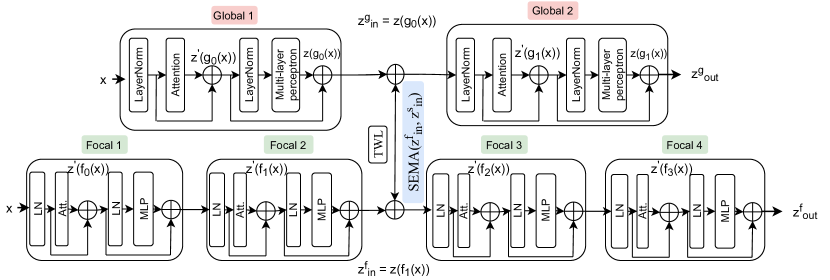
Figure 3: Overall global-focal network. There are two global networks, and four focal networks connected in parallel inside a Student or Teacher network. The components of the global and focal network are similar, where LN: Layer Normalization, Att.: Attention, MLP: Multi-layer Perceptron. The output of Focal 2 is connected with Global 1 with a TWL connection with SEMA applied to it. 3 Proposed methodology
Figure 2 presents an overview of the end-to-end framework of the proposed RadioTransformer global-focal student-teacher network. This comprises two parallel architectures, a student and a teacher model. Both student and teacher networks have global and focal network components. Four focal blocks in each model are cascaded with two global blocks in parallel. The global and focal blocks are connected via a two-way lateral (TWL) connection [10, 13, 42] with smoothed exponential moving average (SEMA). SEMA regulates the attention features shared between the global and focal blocks to bridge the attention gap caused by different learning scales across these networks.
The teacher model is trained with human visual attention obtained from visual search patterns of radiologists. The student model learns from the teacher network using VAL and a classification loss. There are two TWL connections between the teacher and student models coupled with layered SEMA. The proposed architecture is explained in the following subsections.
3.1 Global-focal architecture
Global-focal networks can be described as a single-stream architecture where the two components operate in parallel. The global network consists of two and the focal network consists of four shifting-window transformer blocks (Figure 3). This draws its analogy from the pathways that involve the Parvo, Magno, and Konio ganglion cells [88, 56]. The focal network is inspired by the functioning of slow responding Parvo cells (in the ‘what’ pathway), and the global network is inspired by the fast Magno cells (in the ‘where’ pathway).
Global-focal network. The teacher and student networks are variants of global-focal architecture. The primary idea of the global-focal architecture is to pseudo-replicate learning of attention in a detailed shifting window fashion as shown in Supplementary Figure 1. The focal and global layers are represented as and , respectively, where and .
Focal network. The focal network is implemented to learn high contrast and focal information from shifting the windows incrementally on four blocks that are cascaded in a series. The first block of the focal network has multi-layer perceptron head, , attention head, , and shift size, . The second, third and fourth blocks operate with incremental shifting window size , and , where .
Global network. The global network consists of two shifting-window blocks cascaded in series. The motivation for implementing global network is to learn low contrast global information from two incremental shift sizes. The first block in the global network has a shift size and the second block has a shift size . The multi-layer perceptron head of the global network is incremental and can be represented as . The attention head of the global network is incremental and can be represented as , where .
TWL connections. TWL connections between global and focal architectures are introduced to address the inherent semantic attention averaging between the two. The TWL connections are established between layers {, } and {, }. These constitute weighted addition of the outputs from the aforementioned layers coupled with SEMA on the weighted addition outputs. This can be represented as,
(1) where, and are the hyper-parameters for weighted addition of the outputs from the global-focal networks represented as . is the output from the global network and is the output from the focal network, where in is the intermediate, and out is the final output. are the outputs from the intermediate layers of the focal and global networks, respectively. are the final outputs from the focal and global networks, respectively. This is shown in Figure 3. The smoothed moving average is given by,
(2) where is the smoothed-value of the current variable in the current iteration for different , and is the smoothed-value of the variable from the previous iteration for a different . is the smoothing decay hyperparameter of the global-focal TWL connection. This is represented as , where is the number of samples in the current iteration.
Student-teacher network. A student-teacher network is proposed in this work. The teacher network learns visual attention patterns only from radiologist’s eye gaze maps, while the student learns more specific disease attributes directly from the medical images by leveraging attention information provided by the teacher. Generally, the visual attention maps from radiologists can be noisy and may exhibit variability. Incorporating this variability in addition to distinct disease patterns is not feasible in single-stream architectures. Hence, we need a student-teacher learning framework so that the student can learn this soft information from the teacher. Also, the student-teacher network reduces the complexity of training a single network with the visual attention maps and further fine-tuning for downstream tasks. Here, the model is compressed with just the teacher trained with the visual attention maps.
Teacher network. The teacher network is a cascaded global-focal learning network with two global and four local blocks connected in parallel, represented as:
(3) (4) where is the input to the teacher network, which is subject to hard augmentation techniques with stateless high-value intervals of brightness, contrast, hue, and saturation. is the intermediate output of the teacher network with , , and , as the hyperparameters for weighted addition of the intermediate and final outputs from global and focal blocks, respectively.
Student network. The input to the student network is softly augmented with stateless relatively low-value intervals of brightness, contrast, hue, and saturation as compared to the teacher network. The student predicts probability values of the disease classes along with an attention region. This attention region is subjected to VAL, described in Section 3.2, with the output of the attention region from the teacher network. The student network can be represented as
(5) (6) where is the input to the student network. is the intermediate output of the student network with , , and {, } as the hyperparameters for weighted addition of the intermediate and final outputs from the global and focal blocks of the student network, respectively.
TWL connections. TWL connections between student and teacher architectures are introduced between layers {, } and {, }. The weighted addition of the outputs from the aforementioned layers are coupled with SEMA. This is represented as:
(7) (8) where is the output from the intermediate TWL connection of student-teacher network and is the SEMA from this layer.
(9) (10) where is the output from the final layer of student-teacher network and are the , as shown in Figure 2. Also, are the SEMAs for the intermediate layers of the student global-focal, and teacher global-focal network. The augmentation strategies are explained in the Supplementary section.
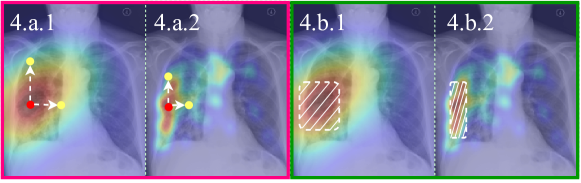
Figure 4: Visual Attention Loss, . 4.a.* illustrates the computation of , where the red dot is the center point of the attention region, and the yellow dots are the height, and width. 4.b.* shows , where the attention region overlap is shown with dashed boxes. {4.a.1, 4.b.1} are the predicted attention regions, and {4.a.2, 4.b.2} are the human visual attention regions. 3.2 Visual attention loss
The visual attention regions are obtained from the teacher network and the predicted attention regions are obtained from the student network. We propose a novel visual attention loss (VAL) function to train the student network. VAL includes a GIoU and a MSE loss, as shown in Figure 4. We use a hyperparameter to induce weights in the losses with .
(11) where is the visual attention region predicted from the teacher network and is the attention region predicted from the student network. is the smallest convex hull of and . The regression loss between the predicted keypoints and keypoints from visual attention is represented as
(12) where are the center points and are height, and width of the attention region. is the keypoint of . is the keypoint of . is the number of samples in a particular batch. The final loss is calculated as:
(13) where is the proposed VAL and are the hyperparameters used for weighted addition of the two losses.
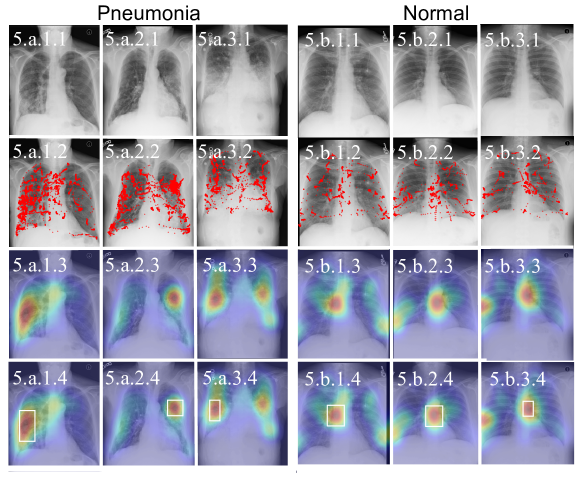
Figure 5: Human Visual Attention. 5.a.*.* series represents Pneumonia and 5.b.*.* series represents normal examples from [32]. Chest X-Rays from patient are shown in the first row as 5.*.*.1, the raw eye-gaze points from radiologists is shown in the second row as 5.*.*.2, human visual attention maps are shown in the third row as 5.*.*.3, and the corresponding bounding boxes are shown in the fourth row as 5.*.*.4 .
3.3 Human visual attention
Pre-processing. In this subsection, we discuss the methodology for extracting visual search patterns from eye-tracking data and generating visual attention maps of radiologists. The eye-tracking data [32] consists primarily of a) raw eye-gaze information (as shown in Figure 5.*.*.2), and b) fixations information, captured from radiologists while they are analyzing chest radiographs in a single-screen setting. The eye-gaze points are reflective of the diagnostic search patterns. The cumulative attention regions, represented as heatmaps (Figure 5.*.*.3), are human attention regions reflective of diagnostically important areas. A multi-dimensional Gaussian filter with standard deviation, , is used to generate these attention heatmaps. Contours from these attention heatmaps are selected with a thresholding value of and, subsequently, bounding boxes are generated from the contour with the largest area, as shown in Figure 5.*.*.4.
Human visual attention training (HVAT). Next, the teacher network is trained with the eye-tracking data from [32]. The teacher network has a classification head to provide an output probability value and a detection head to output key points. The probability value is a vector, where represents the number of different types of disease labels. The key-points output is , where are the x and y coordinates of the center, and are the height and width respectively. Also, Categorical Crossentropy loss is used for classification, and weighted addition of Generalized Intersection-with-Union (GIoU) loss[67] and Mean Squared Error (MSE) loss for detection.
4 Datasets and environment
Datasets. The proposed architecture is evaluated on eight different datasets consisting of two pneumonia classification, four COVID-19 classification (TCIA-SBU [68, 11], and MIDRC [78, 77, 11] only for testing) , and two thoracic disease classification cohorts. Further dataset details are provided in the Supplementary section. The datasets along with the train-validation-test splits are shown in Table 1.
Table 1: Train-Validation-Test splits used across all experiments Name Cell RSNA SIIM Rad NIH VBD MIDRC SBU Train 4200 21158 4433 14815 77871 47539 - - Valid 1032 3022 633 2116 17304 6791 - - Test 624 6045 1266 4233 25596 13582 1241 14220 Environment. All experiments were performed on the Google Cloud Platform in a compute node with 2 vCPUs, 16 GB RAM, and 20 GB disk memory. The baselines and proposed architectures were trained on a cloud TPU of either type v2-8 or v3-8 with version 2.8.0. All implementations are in TensorFlow [1] and Keras [8] v2.8.0.
5 Experiments and results
Implementation. During HVAT, the teacher network is trained on eye-gaze data from [31, 16] which contains radiologist eye-gaze points on 1083 chest x-rays from the MIMIC-CXR dataset [29, 28, 16] (details in subsection 3.3). All the images are resized to pixels. The output of the teacher network is a vector of probability values and a vector of keypoints. All the baseline models are trained with images uniformly resized to pixels. They are trained with Adam optimizer with a batch size of 64 for 50 epochs. The initial learning rate (LR) is set to . The LR is scheduled with an exponential LR scheduler with decay steps = and decay rate = 0.2. There is an early stopping criteria with patience = 20 with the task to minimize the validation loss. The proposed RadioTransformer architecture follows the same training standards.
Table 2: Quantitative Comparison. F1() and AUC() are reported for the baselines and RadioTransformer(RadT) Classification Pneumonia COVID-19 14-Thoracic COVID-19 (Test) Dataset Cell[34] RSNA[70] SIIM[38] Rad[9, 63] NIH[86] VBD[57] MIDRC[77, 78] SBU[68, 11] Architectures F1 AUC F1 AUC F1 AUC F1 AUC F1 AUC F1 AUC F1 AUC F1 AUC R50[19] 59.78 81.70 93.75 98.91 43.01 98.85 94.03 99.27 11.91 74.04 21.76 95.86 23.04 96.32 15.11 65.16 R101[19] 71.93 83.64 94.84 99.21 39.22 96.98 85.36 97.62 11.20 73.30 32.77 96.24 22.31 93.87 24.22 99.20 R152[19] 74.30 87.49 91.97 98.57 43.04 98.18 70.21 87.90 10.67 71.37 32.42 96.58 19.22 83.09 24.58 99.61 R50v2[20] 78.96 87.32 96.60 99.44 47.99 99.79 92.82 99.06 11.42 73.11 34.11 96.32 23.93 98.72 18.71 78.27 R101v2[20] 52.11 71.23 96.39 99.33 45.83 99.26 97.46 99.82 11.99 73.46 32.18 96.55 04.86 42.13 19.43 82.47 R152v2[20] 53.44 71.97 95.30 99.01 47.10 99.71 97.76 99.82 11.93 73.23 32.69 96.54 23.07 95.89 23.03 96.25 D121[21] 70.05 81.97 96.25 99.34 47.59 99.82 95.72 99.51 13.81 78.83 28.71 96.01 24.88 99.82 20.67 88.35 D169[21] 59.18 76.56 88.86 95.60 46.40 99.68 94.33 99.52 15.21 79.90 32.90 96.46 24.97 99.84 20.13 85.95 D201[21] 71.93 82.98 95.43 99.04 48.17 99.83 97.81 99.85 14.84 81.38 34.66 96.41 24.99 99.99 21.08 89.53 ViT-B16[12] 73.85 83.40 76.35 86.06 36.22 95.74 88.25 98.42 05.50 82.06 34.80 95.69 08.47 42.15 11.49 50.22 ViT-B32[12] 70.02 76.41 79.11 90.74 30.42 92.12 86.73 98.09 06.51 83.77 30.57 94.58 17.50 76.52 18.26 77.75 ViT-L16[12] 69.59 83.31 85.41 94.53 34.16 95.75 90.11 98.70 08.16 81.60 33.99 95.40 11.17 47.79 15.54 62.72 ViT-L32[12] 76.38 87.07 69.32 88.86 28.45 92.54 88.40 98.35 06.35 84.96 33.24 95.36 10.21 47.35 03.92 30.82 CCT[18] 62.10 71.18 80.60 92.04 32.63 95.33 92.52 99.11 08.08 85.37 30.25 95.12 23.98 98.53 19.43 83.21 Swin0[45] 66.04 83.74 96.27 99.57 47.63 99.66 97.53 99.92 07.90 74.62 34.30 95.08 13.74 63.07 17.77 75.47 Swin1[45] 73.74 86.91 96.65 99.58 47.30 99.56 94.94 99.64 08.30 74.18 34.27 95.13 15.47 69.00 17.64 73.68 RadT 77.40 88.80 98.75 99.85 48.74 99.65 99.39 99.98 04.21 85.43 37.32 96.84 18.17 79.60 22.18 94.76 5.1 Quantitative results
We report the F1 Score and Area-Under-Curve (AUC) for all experiments. Detailed results are shown in the Supplementary section. We compare our method with architectures such as different variations of ResNet [19], ResNetv2 [20], DenseNet [21], Vision Transformer [12], Compact Convolution Transformers [18], and two variations of Swin Transformers [45]. Note that we show our comparison results primarily on the most prominent backbones (DenseNet-121 [21], vision transformer [12], etc.) used by the baselines [65, 64, 54] and not on individual implementations. As shown in Table 2, our proposed architecture, mentioned as RadT, outperforms other methods on all six datasets. Note that the F1 scores are computed without any standard averaging such as macro, micro or weighted. This is why, F1 scores on 14-class classification datasets, such as, NIH, and VinBigData are comparatively lower than the reported scores on RSNA, Radiography, etc. However, in these datasets where lower F1 scores are reported, the AUC of the proposed framework still outperforms the baselines.
Table 3: Ablation Study. Accuracy(), AUC(), F1(), Precision(), and Recall() are shown for different ablations on three datasets Dataset RSNA[70] Radiography[63, 9] VinBigData[57] Ablations Ac. AUC F1 Pr. Re. Ac. AUC F1 Pr. Re. Ac. AUC F1 Pr. Re. Focal 85.01 92.69 80.96 85.01 85.01 91.05 98.92 90.82 91.38 90.60 63.18 95.62 28.34 94.84 48.19 Global 86.45 93.99 83.26 86.45 86.45 89.91 98.65 88.90 90.38 89.44 62.46 95.46 25.79 95.53 47.54 Focal+HVAT 87.00 94.12 84.15 87.00 87.00 92.33 99.08 91.46 92.82 91.55 65.43 96.35 33.18 90.24 51.81 Global+HVAT 90.46 96.29 88.60 90.46 90.46 91.26 98.76 90.41 91.52 91.00 65.02 96.32 32.56 92.27 50.17 Focal+HVAT+VAL 89.68 95.88 87.62 89.68 89.68 93.04 99.22 92.66 93.35 92.66 65.32 96.31 33.49 92.30 50.44 Global+HVAT+VAL 89.76 96.00 87.51 89.76 89.76 91.05 98.76 90.32 91.47 90.60 64.97 96.16 31.85 91.73 50.41 GF+HVAT+VAL(RadT) 98.94 99.85 98.75 98.94 98.94 99.43 99.98 99.39 99.48 99.41 66.54 96.84 37.32 82.35 57.90 Ablation experiments. Here, we discuss the categorical inference on all the individual components of our proposed network. In Table 3, the ablation experiment results for different components are summarized for three different datasets. The global network outperforms the focal network for the binary classification task in the RSNA dataset. This signifies that for simple binary classification, where global feature representations generally lead to a clear distinction between labels, the global network performs better. This is, in fact, true for radiologists’ decision making as well; the results provide a justification for the designed global-focal approach. For the Radiography and VinBigData datasets, which are multi-class classification tasks, focal network performs better than the global network owing to diagnostic relevance of the more granular details in the images. It is also evident from the results that when HVAT is used along with global-focal networks, the scores improve. Interestingly, when VAL is added, scores are not significantly higher than the previous ablations. There are primarily two reasons: a) VAL lacks in distilling the visual attention from the teacher to the student when using only individual global and focal blocks; the performance improves when VAL distills the visual attention from combined global-focal blocks of the teacher, and b) attention loss between the two visual attention regions may not converge well with regression of key-points and minimizing of GIoU.
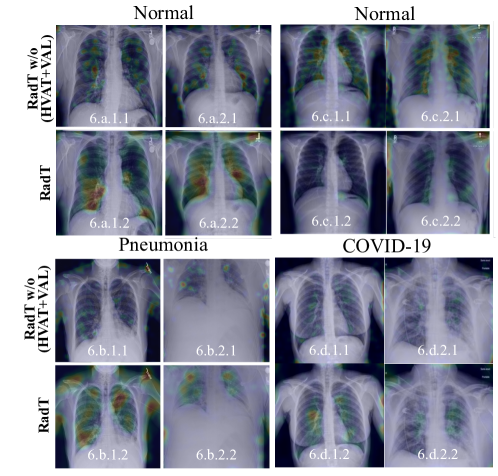
Figure 6: Qualitative Comparison. Comparison of the class activation maps from RadioTransformer are shown on two datasets. {6.a.*.* , 6.b.*.*} are from {normal, pneumonia} classes of the RSNA dataset, and {6.c.*.*, 6.d.*.*} are from {normal, COVID-19} of the Radiography dataset. {6.*.*.1, 6.*.*.2} are the class activation maps generated from {RadT w/o (HVAT+HVAL), RadT}. 5.2 Qualitative results
Figure 6 illustrates the qualitative differences between RadT w/o (HVAT+VAL), and RadT. RadT w/o (HVAT+VAL) is the basic backbone of our proposed RadioTransformer architecture, i.e., the global-focal student-teacher network without HVAT and VAL. The first column, 6.a.*.*, and 6.b.*.*, are normal and pneumonia samples from the RSNA dataset. Similarly, 6.c.*.* are normal, and 6.d.*.* are COVID-19, from the Radiography dataset. The images in 6.*.*.1 and 6.*.*.2 are the class activation maps from RadT w/o (HVAT+VAL) and RadT, respectively. We can observe clear differences in attention region patterns between these two rows. The attention regions in the first row are relatively discretized and the inconsistency in overlap with the white regions (infiltrates/fluids) is quite prominent. However, in the second row, relatively continuous attention regions are observed with consistent overlap with the disease patterns. Similarly, in 6.c.*.1, attention regions observed are more discrete in nature, unlike 6.c.*.2. For normal chest radiographs, this potentially signifies that RadT focuses intrinsically on regions that may be significant for a radiologist to diagnose and reject the presence of infiltrates/fluids. On the contrary, RadT w/o (HVAT+VAL) attempts to identify non-overlapping regions with visual attention to reject the presence of infiltrates/fluids. Also, we observe that the attention regions from RadT w/o (HVAT+VAL) cover a larger area than those from RadT, implying that lack of visual attention knowledge leads to low confidence in decision-making and hence the model needs to search a comparatively larger space to conclusively accept or reject a claim. In 6.b.2.*, it is observed that for a lung densely filled with fluid, RadT w/o (HVAT+VAL) focuses on a comparatively sparse and large region. However, RadT focuses on regions with dense fluid accumulation. These qualitative findings suggest that RadioTransformer inherently analyzes the regions with a visuo-cognitive approach similar to that of a radiologist.
6 Conclusion
This paper presents RadioTransformer, a novel visual attention–driven transformer framework, motivated by radiologists’ visuo-cognitive approaches. Unlike existing techniques that rely only on visual information for diagnostic tasks, RadioTransformer leverages eye-gaze patterns from experts to train a global-focal student-teacher network. Our framework learns and implements hierarchical search patterns to improve the diagnostic performance of transformer architectures. When evaluated on eight datasets, comprising over 260,000 images, the proposed architecture outperforms SOTA approaches. Our qualitative analysis shows that by integrating visual attention into the network, RadioTransformer focuses on diagnostically relevant regions of interest leading to higher confidence in decision making. To the best of our knowledge, no method has been proposed that integrates gaze data from expert radiologists to improve the diagnostic performance of deep learning architectures. This work paves the way for radiologist-in-the-loop computer-aided diagnosis tools.
Acknowledgements The reported research was partly supported by NIH 1R21CA258493-01A1, NIH 75N92020D00021 (subcontract), and the OVPR and IEDM seed grants at Stony Brook University. The content is solely the responsibility of the authors and does not necessarily represent the official views of the National Institutes of Health.
References
- [1] Abadi, M., Agarwal, A., Barham, P., Brevdo, E., Chen, Z., Citro, C., Corrado, G.S., Davis, A., Dean, J., Devin, M., et al.: Tensorflow: Large-scale machine learning on heterogeneous distributed systems. arXiv preprint arXiv:1603.04467 (2016)
- [2] Bertram, R., Kaakinen, J., Bensch, F., Helle, L., Lantto, E., Niemi, P., Lundbom, N.: Eye movements of radiologists reflect expertise in ct study interpretation: A potential tool to measure resident development. Radiology 281(3), 805–815 (2016)
- [3] Canayaz, M.: Mh-covidnet: Diagnosis of covid-19 using deep neural networks and meta-heuristic-based feature selection on x-ray images. Biomedical Signal Processing and Control 64, 102257 (2021)
- [4] Cao, H., Wang, Y., Chen, J., Jiang, D., Zhang, X., Tian, Q., Wang, M.: Swin-unet: Unet-like pure transformer for medical image segmentation. arXiv preprint arXiv:2105.05537 (2021)
- [5] Cheerla, A., Gevaert, O.: Deep learning with multimodal representation for pancancer prognosis prediction. Bioinformatics 35(14), i446–i454 (2019)
- [6] Chen, B., Li, J., Lu, G., Yu, H., Zhang, D.: Label co-occurrence learning with graph convolutional networks for multi-label chest x-ray image classification. IEEE journal of biomedical and health informatics 24(8), 2292–2302 (2020)
- [7] Chen, B., Zhang, Z., Li, Y., Lu, G., Zhang, D.: Multi-label chest x-ray image classification via semantic similarity graph embedding. IEEE Transactions on Circuits and Systems for Video Technology (2021)
- [8] Chollet, F., et al.: Keras: Deep learning library for theano and tensorflow. URL: https://keras. io/k 7(8), T1 (2015)
- [9] Chowdhury, M.E.H., Rahman, T., Khandakar, A., Mazhar, R., Kadir, M.A., Mahbub, Z.B., Islam, K.R., Khan, M.S., Iqbal, A., Emadi, N.A., Reaz, M.B.I., Islam, M.T.: Can ai help in screening viral and covid-19 pneumonia? IEEE Access 8, 132665–132676 (2020). https://doi.org/10.1109/ACCESS.2020.3010287
- [10] Christoph, R., Pinz, F.A.: Spatiotemporal residual networks for video action recognition. Advances in neural information processing systems pp. 3468–3476 (2016)
- [11] Clark, K., Vendt, B., Smith, K., Freymann, J., Kirby, J., Koppel, P., Moore, S., Phillips, S., Maffitt, D., Pringle, M., et al.: The cancer imaging archive (tcia): maintaining and operating a public information repository. Journal of digital imaging 26(6), 1045–1057 (2013)
- [12] Dosovitskiy, A., Beyer, L., Kolesnikov, A., Weissenborn, D., Zhai, X., Unterthiner, T., Dehghani, M., Minderer, M., Heigold, G., Gelly, S., et al.: An image is worth 16x16 words: Transformers for image recognition at scale. arXiv preprint arXiv:2010.11929 (2020)
- [13] Feichtenhofer, C., Fan, H., Malik, J., He, K.: Slowfast networks for video recognition. In: Proceedings of the IEEE/CVF international conference on computer vision. pp. 6202–6211 (2019)
- [14] Fox, S.E., Faulkner-Jones, B.E.: Eye-tracking in the study of visual expertise: methodology and approaches in medicine. Frontline Learning Research 5(3), 29–40 (2017)
- [15] Van der Gijp, A., Ravesloot, C., Jarodzka, H., Van der Schaaf, M., Van der Schaaf, I., van Schaik, J.P., Ten Cate, T.J.: How visual search relates to visual diagnostic performance: a narrative systematic review of eye-tracking research in radiology. Advances in Health Sciences Education 22(3), 765–787 (2017)
- [16] Goldberger, A.L., Amaral, L.A., Glass, L., Hausdorff, J.M., Ivanov, P.C., Mark, R.G., Mietus, J.E., Moody, G.B., Peng, C.K., Stanley, H.E.: Physiobank, physiotoolkit, and physionet: components of a new research resource for complex physiologic signals. circulation 101(23), e215–e220 (2000)
- [17] Hanna, T.N., Zygmont, M.E., Peterson, R., Theriot, D., Shekhani, H., Johnson, J.O., Krupinski, E.A.: The effects of fatigue from overnight shifts on radiology search patterns and diagnostic performance. Journal of the American College of Radiology 15(12), 1709–1716 (2018)
- [18] Hassani, A., Walton, S., Shah, N., Abuduweili, A., Li, J., Shi, H.: Escaping the big data paradigm with compact transformers. arXiv preprint arXiv:2104.05704 (2021)
- [19] He, K., Zhang, X., Ren, S., Sun, J.: Deep residual learning for image recognition. In: Proceedings of the IEEE conference on computer vision and pattern recognition. pp. 770–778 (2016)
- [20] He, K., Zhang, X., Ren, S., Sun, J.: Identity mappings in deep residual networks. In: European conference on computer vision. pp. 630–645. Springer (2016)
- [21] Huang, G., Liu, Z., Van Der Maaten, L., Weinberger, K.Q.: Densely connected convolutional networks. In: Proceedings of the IEEE conference on computer vision and pattern recognition. pp. 4700–4708 (2017)
- [22] Huang, Y., Cai, M., Li, Z., Lu, F., Sato, Y.: Mutual context network for jointly estimating egocentric gaze and action. IEEE Transactions on Image Processing 29, 7795–7806 (2020)
- [23] Hussain, E., Hasan, M., Rahman, M.A., Lee, I., Tamanna, T., Parvez, M.Z.: Corodet: A deep learning based classification for covid-19 detection using chest x-ray images. Chaos, Solitons & Fractals 142, 110495 (2021)
- [24] Itti, L.: Quantifying the contribution of low-level saliency to human eye movements in dynamic scenes. Visual Cognition 12(6), 1093–1123 (2005)
- [25] Itti, L., Baldi, P.: Bayesian surprise attracts human attention. Vision research 49(10), 1295–1306 (2009)
- [26] Itti, L., Koch, C.: A saliency-based search mechanism for overt and covert shifts of visual attention. Vision research 40(10-12), 1489–1506 (2000)
- [27] Itti, L., Koch, C.: Computational modelling of visual attention. Nature reviews neuroscience 2(3), 194–203 (2001)
- [28] Johnson, A., Bulgarelli, L., Pollard, T., Horng, S., Celi, L.A., Mark IV, R.: Mimic-iv (version 0.4). PhysioNet (2020)
- [29] Johnson, A., Pollard, T., Mark, R., Berkowitz, S., Horng, S.: Mimic-cxr database. PhysioNet https://doi. org/10.13026/C2JT1Q (2019)
- [30] Kar, A., Corcoran, P.: A review and analysis of eye-gaze estimation systems, algorithms and performance evaluation methods in consumer platforms. IEEE Access 5, 16495–16519 (2017)
- [31] Karargyris, A., Kashyap, S., Lourentzou, I., Wu, J., Tong, M., Sharma, A., Abedin, S., Beymer, D., Mukherjee, V., Krupinski, E., et al.: Eye gaze data for chest x-rays
- [32] Karargyris, A., Kashyap, S., Lourentzou, I., Wu, J.T., Sharma, A., Tong, M., Abedin, S., Beymer, D., Mukherjee, V., Krupinski, E.A., et al.: Creation and validation of a chest x-ray dataset with eye-tracking and report dictation for ai development. Scientific data 8(1), 1–18 (2021)
- [33] Kelly, B.S., Rainford, L.A., Darcy, S.P., Kavanagh, E.C., Toomey, R.J.: The development of expertise in radiology: in chest radiograph interpretation,“expert” search pattern may predate “expert” levels of diagnostic accuracy for pneumothorax identification. Radiology 280(1), 252–260 (2016)
- [34] Kermany, D.S., Goldbaum, M., Cai, W., Valentim, C.C., Liang, H., Baxter, S.L., McKeown, A., Yang, G., Wu, X., Yan, F., et al.: Identifying medical diagnoses and treatable diseases by image-based deep learning. Cell 172(5), 1122–1131 (2018)
- [35] Kleinke, C.L.: Gaze and eye contact: a research review. Psychological bulletin 100(1), 78 (1986)
- [36] Konwer, A., Bae, J., Singh, G., Gattu, R., Ali, S., Green, J., Phatak, T., Prasanna, P.: Attention-based multi-scale gated recurrent encoder with novel correlation loss for covid-19 progression prediction. In: International Conference on Medical Image Computing and Computer-Assisted Intervention. pp. 824–833. Springer (2021)
- [37] Kundel, H.L., Nodine, C.F., Krupinski, E.A.: Computer-displayed eye position as a visual aid to pulmonary nodule interpretation. Investigative radiology 25(8), 890–896 (1990)
- [38] Lakhani, P., Mongan, J., Singhal, C., Zhou, Q., Andriole, K.P., Auffermann, W.F., Prasanna, P., Pham, T., Peterson, M., Bergquist, P.J., et al.: The 2021 siim-fisabio-rsna machine learning covid-19 challenge: Annotation and standard exam classification of covid-19 chest radiographs. (2021)
- [39] Lee, A., Chung, H., Cho, Y., Kim, J.L., Choi, J., Lee, E., Kim, B., Cho, S.J., Kim, S.G.: Identification of gaze pattern and blind spots by upper gastrointestinal endoscopy using an eye-tracking technique. Surgical Endoscopy pp. 1–8 (2021)
- [40] Lévêque, L., Bosmans, H., Cockmartin, L., Liu, H.: State of the art: Eye-tracking studies in medical imaging. Ieee Access 6, 37023–37034 (2018)
- [41] Li, Y., Liu, M., Rehg, J.: In the eye of the beholder: Gaze and actions in first person video. IEEE Transactions on Pattern Analysis and Machine Intelligence (2021)
- [42] Lin, T.Y., Dollár, P., Girshick, R., He, K., Hariharan, B., Belongie, S.: Feature pyramid networks for object detection. In: Proceedings of the IEEE conference on computer vision and pattern recognition. pp. 2117–2125 (2017)
- [43] Litchfield, D., Ball, L.J., Donovan, T., Manning, D.J., Crawford, T.: Viewing another person’s eye movements improves identification of pulmonary nodules in chest x-ray inspection. Journal of Experimental Psychology: Applied 16(3), 251 (2010)
- [44] Liu, Y., Zhou, L., Bai, X., Huang, Y., Gu, L., Zhou, J., Harada, T.: Goal-oriented gaze estimation for zero-shot learning. In: Proceedings of the IEEE/CVF Conference on Computer Vision and Pattern Recognition. pp. 3794–3803 (2021)
- [45] Liu, Z., Lin, Y., Cao, Y., Hu, H., Wei, Y., Zhang, Z., Lin, S., Guo, B.: Swin transformer: Hierarchical vision transformer using shifted windows. arXiv preprint arXiv:2103.14030 (2021)
- [46] Mackworth, N.H., Morandi, A.J.: The gaze selects informative details within pictures. Perception & psychophysics 2(11), 547–552 (1967)
- [47] Mahmud, T., Rahman, M.A., Fattah, S.A.: Covxnet: A multi-dilation convolutional neural network for automatic covid-19 and other pneumonia detection from chest x-ray images with transferable multi-receptive feature optimization. Computers in biology and medicine 122, 103869 (2020)
- [48] Mall, S., Brennan, P.C., Mello-Thoms, C.: Can a machine learn from radiologists’ visual search behaviour and their interpretation of mammograms—a deep-learning study. Journal of digital imaging 32(5), 746–760 (2019)
- [49] Mathe, S., Sminchisescu, C.: Dynamic eye movement datasets and learnt saliency models for visual action recognition. In: European conference on computer vision. pp. 842–856. Springer (2012)
- [50] McLaughlin, L., Hughes, C., Bond, R., McConnell, J., Cairns, A., McFadden, S.: The effect of a digital training tool to aid chest image interpretation: Hybridising eye tracking technology and a decision support tool. Radiography 27(2), 505–511 (2021)
- [51] Min, K., Corso, J.J.: Integrating human gaze into attention for egocentric activity recognition. In: Proceedings of the IEEE/CVF Winter Conference on Applications of Computer Vision. pp. 1069–1078 (2021)
- [52] Mishra, A., Aloimonos, Y., Fah, C.L.: Active segmentation with fixation. In: 2009 IEEE 12th international conference on computer vision. pp. 468–475. IEEE (2009)
- [53] Modi, N., Singh, J.: A review of various state of art eye gaze estimation techniques. Advances in Computational Intelligence and Communication Technology pp. 501–510 (2021)
- [54] Mondal, A.K., Bhattacharjee, A., Singla, P., AP, P.: xvitcos: Explainable vision transformer based covid-19 screening using radiography (2021)
- [55] Moser, T., Lohmeyer, Q., Meboldt, M., Distler, O., Becker, M.O.: Visual assessment of digital ulcers in systemic sclerosis analysed by eye tracking: implications for wound assessment. Clinical and Experimental Rheumatology 38(3), 137–139 (2020)
- [56] Murray, I., Plainis, S.: Contrast coding and magno/parvo segregation revealed in reaction time studies. Vision research 43(25), 2707–2719 (2003)
- [57] Nguyen, H.Q., Lam, K., Le, L.T., Pham, H.H., Tran, D.Q., Nguyen, D.B., Le, D.D., Pham, C.M., Tong, H.T., Dinh, D.H., et al.: Vindr-cxr: An open dataset of chest x-rays with radiologist’s annotations. arXiv preprint arXiv:2012.15029 (2020)
- [58] Papadopoulos, D.P., Clarke, A.D., Keller, F., Ferrari, V.: Training object class detectors from eye tracking data. In: European conference on computer vision. pp. 361–376. Springer (2014)
- [59] Park, S., Kim, G., Oh, Y., Seo, J.B., Lee, S.M., Kim, J.H., Moon, S., Lim, J.K., Ye, J.C.: Vision transformer for covid-19 cxr diagnosis using chest x-ray feature corpus. arXiv preprint arXiv:2103.07055 (2021)
- [60] Parkhurst, D., Law, K., Niebur, E.: Modeling the role of salience in the allocation of overt visual attention. Vision research 42(1), 107–123 (2002)
- [61] Patra, A., Cai, Y., Chatelain, P., Sharma, H., Drukker, L., Papageorghiou, A.T., Noble, J.A.: Efficient ultrasound image analysis models with sonographer gaze assisted distillation. In: International Conference on Medical Image Computing and Computer-Assisted Intervention. pp. 394–402. Springer (2019)
- [62] Prasanna, P., Mitra, J., Beig, N., Partovi, S., Singh, G., Pinho, M., Madabhushi, A., Tiwari, P.: Radiographic-deformation and textural heterogeneity (r-depth): an integrated descriptor for brain tumor prognosis. In: International Conference on Medical Image Computing and Computer-Assisted Intervention. pp. 459–467. Springer (2017)
- [63] Rahman, T., Khandakar, A., Qiblawey, Y., Tahir, A., Kiranyaz, S., Kashem, S.B.A., Islam, M.T., Al Maadeed, S., Zughaier, S.M., Khan, M.S., et al.: Exploring the effect of image enhancement techniques on covid-19 detection using chest x-ray images. Computers in biology and medicine 132, 104319 (2021)
- [64] Rajpurkar, P., Irvin, J., Ball, R.L., Zhu, K., Yang, B., Mehta, H., Duan, T., Ding, D., Bagul, A., Langlotz, C.P., et al.: Deep learning for chest radiograph diagnosis: A retrospective comparison of the chexnext algorithm to practicing radiologists. PLoS medicine 15(11), e1002686 (2018)
- [65] Rajpurkar, P., Irvin, J., Zhu, K., Yang, B., Mehta, H., Duan, T., Ding, D., Bagul, A., Langlotz, C., Shpanskaya, K., et al.: Chexnet: Radiologist-level pneumonia detection on chest x-rays with deep learning. arXiv preprint arXiv:1711.05225 (2017)
- [66] Ramanathan, S., Katti, H., Sebe, N., Kankanhalli, M., Chua, T.S.: An eye fixation database for saliency detection in images. In: European Conference on Computer Vision. pp. 30–43. Springer (2010)
- [67] Rezatofighi, H., Tsoi, N., Gwak, J., Sadeghian, A., Reid, I., Savarese, S.: Generalized intersection over union (June 2019)
- [68] Saltz, J., et al.: Stony brook university covid-19 positive cases [data set] (2021)
- [69] Shapovalova, N., Raptis, M., Sigal, L., Mori, G.: Action is in the eye of the beholder: Eye-gaze driven model for spatio-temporal action localization. In: Advances in Neural Information Processing Systems. pp. 2409–2417. Citeseer (2013)
- [70] Shih, G., Wu, C.C., Halabi, S.S., Kohli, M.D., Prevedello, L.M., Cook, T.S., Sharma, A., Amorosa, J.K., Arteaga, V., Galperin-Aizenberg, M., et al.: Augmenting the national institutes of health chest radiograph dataset with expert annotations of possible pneumonia. Radiology: Artificial Intelligence 1(1), e180041 (2019)
- [71] Stember, J.N., Celik, H., Krupinski, E., Chang, P.D., Mutasa, S., Wood, B.J., Lignelli, A., Moonis, G., Schwartz, L., Jambawalikar, S., et al.: Eye tracking for deep learning segmentation using convolutional neural networks. Journal of digital imaging 32(4), 597–604 (2019)
- [72] Tatler, B.W., Baddeley, R.J., Vincent, B.T.: The long and the short of it: Spatial statistics at fixation vary with saccade amplitude and task. Vision research 46(12), 1857–1862 (2006)
- [73] Taylor-Phillips, S., Stinton, C.: Fatigue in radiology: a fertile area for future research. The British journal of radiology 92(1099), 20190043 (2019)
- [74] Teixeira, V., Braz, L., Pedrini, H., Dias, Z.: Dualanet: Dual lesion attention network for thoracic disease classification in chest x-rays. In: 2020 International Conference on Systems, Signals and Image Processing (IWSSIP). pp. 69–74. IEEE (2020)
- [75] Theeuwes, J.: Stimulus-driven capture and attentional set: selective search for color and visual abrupt onsets. Journal of Experimental Psychology: Human perception and performance 20(4), 799 (1994)
- [76] Theeuwes, J., Kramer, A.F., Hahn, S., Irwin, D.E., Zelinsky, G.J.: Influence of attentional capture on oculomotor control. Journal of experimental psychology: human perception and performance 25(6), 1595 (1999)
- [77] Tsai, E.B., Simpson, S., Lungren, M.P., Hershman, M., Roshkovan, L., Colak, E., Erickson, B.J., Shih, G., Stein, A., Kalpathy-Cramer, J., et al.: Data from medical imaging data resource center (midrc) - rsna international covid radiology database (ricord) release 1c - chest x-ray, covid+ (midrc-ricord-1c). The Cancer Imaging Archive (2021)
- [78] Tsai, E.B., Simpson, S., Lungren, M.P., Hershman, M., Roshkovan, L., Colak, E., Erickson, B.J., Shih, G., Stein, A., Kalpathy-Cramer, J., et al.: The rsna international covid-19 open radiology database (ricord). Radiology 299(1), E204–E213 (2021)
- [79] Vasudevan, A.B., Dai, D., Van Gool, L.: Object referring in videos with language and human gaze. In: Proceedings of the IEEE Conference on Computer Vision and Pattern Recognition. pp. 4129–4138 (2018)
- [80] Vertinsky, T., Forster, B.: Prevalence of eye strain among radiologists: influence of viewing variables on symptoms. American Journal of Roentgenology 184(2), 681–686 (2005)
- [81] Vig, E., Dorr, M., Cox, D.: Space-variant descriptor sampling for action recognition based on saliency and eye movements. In: European conference on computer vision. pp. 84–97. Springer (2012)
- [82] Waite, S., Grigorian, A., Alexander, R.G., Macknik, S.L., Carrasco, M., Heeger, D.J., Martinez-Conde, S.: Analysis of perceptual expertise in radiology–current knowledge and a new perspective. Frontiers in human neuroscience 13, 213 (2019)
- [83] Waite, S., Kolla, S., Jeudy, J., Legasto, A., Macknik, S.L., Martinez-Conde, S., Krupinski, E.A., Reede, D.L.: Tired in the reading room: the influence of fatigue in radiology. Journal of the American College of Radiology 14(2), 191–197 (2017)
- [84] Wang, H., Wang, S., Qin, Z., Zhang, Y., Li, R., Xia, Y.: Triple attention learning for classification of 14 thoracic diseases using chest radiography. Medical Image Analysis 67, 101846 (2021)
- [85] Wang, L., Lin, Z.Q., Wong, A.: Covid-net: A tailored deep convolutional neural network design for detection of covid-19 cases from chest x-ray images. Scientific Reports 10(1), 1–12 (2020)
- [86] Wang, X., Peng, Y., Lu, L., Lu, Z., Bagheri, M., Summers, R.M.: Chestx-ray8: Hospital-scale chest x-ray database and benchmarks on weakly-supervised classification and localization of common thorax diseases. In: Proceedings of the IEEE conference on computer vision and pattern recognition. pp. 2097–2106 (2017)
- [87] Wong, A., Lin, Z.Q., Wang, L., Chung, A.G., Shen, B., Abbasi, A., Hoshmand-Kochi, M., Duong, T.Q.: Covid-net s: Towards computer-aided severity assessment via training and validation of deep neural networks for geographic extent and opacity extent scoring of chest x-rays for sars-cov-2 lung disease severity. arXiv preprint arXiv:2005.12855 (2020)
- [88] Yoonessi, A., Yoonessi, A.: Functional assessment of magno, parvo and konio-cellular pathways; current state and future clinical applications. Journal of ophthalmic & vision research 6(2), 119 (2011)
- [89] Yoshie, T., Matsuda, Y., Arakawa, Y., Otsubo, H., Araga, T., Tatsuno, K., Takaishi, S., Usuki, N., Ueda, T.: The influence of experience on gazing patterns during endovascular treatment: Eye-tracking study. Journal of Neuroendovascular Therapy pp. oa–2021 (2021)
- [90] Yun, K., Peng, Y., Samaras, D., Zelinsky, G.J., Berg, T.L.: Exploring the role of gaze behavior and object detection in scene understanding. Frontiers in psychology 4, 917 (2013)
- [91] Yun, K., Peng, Y., Samaras, D., Zelinsky, G.J., Berg, T.L.: Studying relationships between human gaze, description, and computer vision. In: Proceedings of the IEEE Conference on Computer Vision and Pattern Recognition. pp. 739–746 (2013)
- [92] Zimmermann, J.M., Vicentini, L., Van Story, D., Pozzoli, A., Taramasso, M., Lohmeyer, Q., Maisano, F., Meboldt, M.: Quantification of avoidable radiation exposure in interventional fluoroscopy with eye tracking technology. Investigative radiology 55(7), 457–462 (2020)