H i gas playing hide-and-seek around a powerful FRI-type quasar at
Abstract
We present optical spectroscopic and milli-arcsecond scale radio continuum observations of the quasar M1540-1453 (= 2.1040.002) that shows associated H i 21-cm absorption at = 2.1139. At sub-kpc scales, the powerful radio source with 1.4 GHz luminosity of W Hz-1 shows Fanaroff-Riley (FR) class I morphology caused by the interaction with dense gas within 70 pc from the AGN. Interestingly, while there are indications for the presence of absorption from low-ionization species like Fe ii, Si ii and Si iii in the optical spectrum, the expected strong damped absorption is not detected at the redshift of the H i 21-cm absorber. In comparison to typical high- quasars, the emission line is much narrower. The ‘ghostly’ nature of the H i absorber partially covering the broad line region of extent 0.05 pc and the detection of widespread H i 21-cm absorption covering the diffuse radio source (extent 425 pc) imply the presence of a large clumpy H i halo – which may have been blown by the jet-ISM interaction. Further observations are needed to confirm the ‘ghostly’ nature of the absorber, and obtain a better understanding of the role played by the jet-ISM interaction in shaping the radio morphology of this powerful AGN. The study showcases how joint radio and optical analysis can shed light on gaseous environment and origin of radio morphology in AGN at high redshifts, when these are still the assembly sites of giant galaxies.
1 Introduction
Through the detection of extended emission, it is now well established that nearly all high- () quasars are embedded in low-density warm gas (T K) halos extending over few tens to hundred kpc (e.g., Borisova et al., 2016). The spatially resolved distribution and kinematics of this gas exhibits signatures of either infalling or outflowing material, potentially providing evidence for cold accretion flows and active galactic nuclei (AGN) feedback processes (e.g., Arrigoni Battaia et al., 2018; Shukla et al., 2021).
Interestingly, quasar absorption-line studies suggest a very low covering factor of the high H i column density ((H i)) gas around quasars. Specifically, only 2-5% of the quasars show a damped system (DLA; with log (H i) cm-2) within 3000 km s-1 to the systemic redshift, (referred to as proximate DLAs or PDLAs; Ellison et al., 2002; Gupta et al., 2021a). PDLAs associated with AGN may represent radiation feedback driven gas outflows, and subsequent inflows i.e., ‘fountain’ within the ionization cone shaped by the torus (e.g., Wada, 2012). The leaked radiation from the broad- and/or narrow emission line regions (i.e., BLR and/or NLR) of the quasars can fill the absorption trough and influence the detectability of such absorbers (Finley et al., 2013). In the case of PDLAs identified through the presence of associated strong metal and H2 absorption lines, 40-50% show detectable emission in the DLA trough, implying that the absorbing cloud only partially covers the BLR (e.g., Fathivavsari et al., 2018; Noterdaeme et al., 2019). In certain cases, hereafter referred as ‘ghostly’ DLA, the PDLA close to the central engine is so compact (1 pc) that the leaked emission completely fills the trough and its presence is confirmed only by the detection of the Ly absorption line (e.g., Fathivavsari et al., 2017).
Despite rarity, a complete census and detailed investigations of these absorbers provide crucial insights into different feedback processes operating in quasar host galaxies (e.g., Noterdaeme et al., 2021a, b). By revealing the chemical composition, clumpiness, and physical conditions in denser and colder phases of gas at parsec to kpc scales from the nucleus, these absorption line studies can bridge the gap in our understanding of how the ubiquitous halo gas and circumnuclear disk fuel the AGN activity (see Combes et al., 2014; García-Burillo et al., 2019; Storchi-Bergmann & Schnorr-Müller, 2019, for examples of nearby AGN where central regions are spatially resolvable in emission lines) in distant quasars.
In the radio-loud regime, the H i 21-cm line absorption toward parsec scale radio jet and extended lobe emission can complement the inherently one-dimensional exploration of optical/ultraviolet absorption line studies (e.g., Adams et al., 2009; Srianand et al., 2015). Further, when the radio source is young i.e., still embedded within the host galaxy’s interstellar medium (ISM), the properties of the ambient medium can also be used to understand the origin of Fanraoff-Riley Class I (FRI; edge darkened) and Fanaroff-Riley class II (FRII; edge brightened) division and evolution of radio jets (e.g., Sutherland & Bicknell, 2007; Wagner et al., 2012). The more powerful FRII sources typically have 1.4 GHz spectral luminosity, W Hz-1, while the FRI sources predominantly have lower luminosities. The FRI/FRII dichotomy is among the most debated issues in astrophysics, and it is unclear whether it originates from fundamental differences in the central engine i.e., black hole spin and accretion mode (Celotti et al., 1997; Ghisellini & Celotti, 2001), or jet composition (Reynolds et al., 1996), or jet deceleration caused by the ambient clumpy medium (e.g., Bicknell, 1995; Mukherjee et al., 2016).
Here, we present optical spectroscopy and 1.5 GHz milliarcsecond (mas)-scale imaging of a powerful radio quasar - M1540-1453 (= 2.1; RA: 15:40:15.23530.0003; Dec: -14:53:42.4090.011). The radio source was identified as a high- quasar through a large optical survey of mid-infrared color-selected powerful radio sources (Gupta et al., 2021b). The associated radio continuum emission corresponds to a 1.4 GHz spectral luminosity, = W Hz-1 and radio loudness, = = 4864). The associated black hole mass () and Eddington ratio () are 9.2 and 0.08, respectively (Gupta et al., 2021b).
Besides being amongst the most powerful radio loud quasars (RLQs) known in the Universe (Gupta et al., 2021b), M1540-1453 further stands out for the presence of a cold atomic gas reservoir revealed through the strong H i 21-cm absorption ((H i) = (2.060.01)()() cm-2 at = 2.1139; Gupta et al., 2021a)111Here is the spin temperature in Kelvin and is the covering factor of the H i gas.. The 90% of the total H i 21-cm absorption optical depth is within, = 167 km s-1. At , associated H i 21-cm absorption has been detected in only three other cases (Briggs et al., 1993; Moore et al., 1999; Aditya et al., 2021). In general, and based on sensitive low-frequency radio spectroscopic surveys with existing facilities, the powerful quasars at show an extremely small H i 21-cm absorption detection rate (%; Gupta et al., 2021a). The joint radio and optical investigation of M1540-1453 presented here suggests that unlike the majority of powerful RLQs the radio jets in this case exhibit FRI morphology, are interacting with the host galaxy ISM, and are embedded in a H i halo with signatures of infall. Further, the absence of strong H i absorption in the optical spectrum implies a possible ‘ghostly’ DLA.
Throughout this paper we use the CDM cosmology with =0.315, =0.685 and H0=67.4 km s-1 Mpc-1 (Planck Collaboration et al., 2020). At , = 8.5 kpc.
2 Observations and data analysis
2.1 Optical Observations
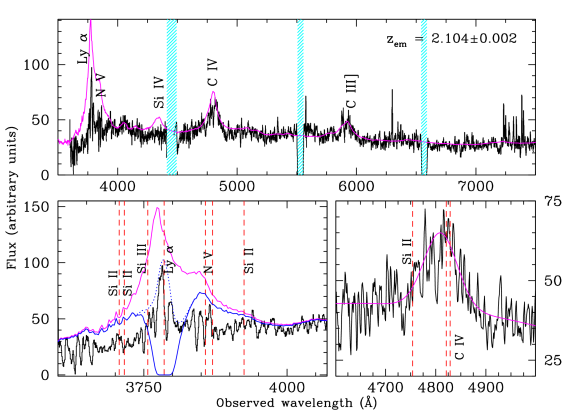
The optical discovery spectrum of M1540-1453 was obtained on 2015 August 07 using the Robert Stobie Spectrograph (RSS) on the Southern African Large Telescope (SALT) as part of a large survey of radio-bright (200 mJy at 1.4 GHz) AGN (details in Krogager et al., 2018; Gupta et al., 2021b) for the MeerKAT Absorption Line Survey (MALS; Gupta et al., 2017). This spectrum covers 4486–7533Å, that is, only C iv 1549 and C iii] 1909 emission lines. The spectral resolution is at 6041 Å. As the C iv emission line profile is affected by intrinsic absorption, we use a Gaussian fit to it to estimate the systemic redshift, = (see bottom right panel in Fig. 1). This is lower than the redshift, = 2.113, we quoted in (Gupta et al., 2021a) which was based on the peak of the C iv emission without correcting for the presence of absorption. Note that the peak of the C iii] emission line is also affected by absorption.
Intrigued by the detection of a strong H i 21-cm absorption line, we obtained additional SALT spectra on 2021 April 4 and 7 covering the H i line (see Fig. 1). Interestingly, the emission line from the quasar is weak and narrow, and the expected strong DLA corresponding to the H i 21-cm absorption is absent (see bottom left panel in Fig 1). However, as also mentioned in Gupta et al. (2021a), we detect absorption coincidences at the expected wavelengths of Fe ii and Si ii (for the latter see bottom panels of Fig. 1). We also detect associated absorption coincident with C iv absorption lines at = 2.0994, 2.1027 and 2.1180. For = 2.1027, we also detect the N v doublets. For the above mentioned systemic redshift () based on the Gaussian fit to the C iv emission line these correspond to relative velocities in the range of 450 to km s-1, and the H i 21-cm absorption peak is redshifted by km s-1. The 1 uncertainty on corresponds to a velocity shift of about 200 km s-1. This implies that a significant portion of the gas detected in absorption is redshifted i.e., could be infalling with respect to the quasar. This is subject to the caveat that C iv emission line is known to underestimate the systemic redshift by several 100 km s-1(Richards et al., 2011; Pâris et al., 2012).
2.2 Radio Observations
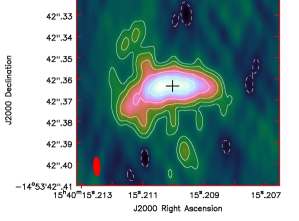
We observed M1540-1453 with the Very Long Baseline Array (VLBA) of the NRAO on 2021 June 9. A total bandwidth of 256 MHz centered at 1.53 MHz was used. At each of the 10 VLBA stations, eight 32 MHz data channel pairs were recorded using the ROACH Digital Backend and the polyphase filterbank (PFB) digital signal-processing algorithm, in right- and left-hand circular polarizations and sampled at two bits. The data were correlated with the VLBA DiFX correlator (Deller et al., 2011) with 1 s integration time. The observations employed nodding-style phase referencing using the nearby calibrator J1537-1527 with a cycle time of 3.67 min. The source 3C 345 was observed as a fringe-finder and bandpass calibrator. The total and on-source observing times were 2.0 and 1.3 h, respectively. The data editing, calibration and imaging were done using the Astronomical Image Processing System (AIPS; Greisen 2003). The final image made using Briggs weighting with a robust factor of 0 in the AIPS task IMAGR is shown in Fig. 2. The restoring beam is 9.0 mas mas with a position angle of . The total flux density measured with the VLBA is 75 mJy and the extent of the detected radio emission is 50 mas.
3 Results
3.1 Distorted radio morphology
M1540-1453 has been detected as a compact radio source in a number of surveys from 100 MHz to 3 GHz. It has flux densities of 81.40.7 mJy, 203.36.1 mJy, 59613 mJy and 1172.913.0 mJy at 3 GHz (Very Large Array Sky Survey (VLASS); Lacy et al., 2020), 1.4 GHz (NRAO VLA Sky Survey (NVSS); Condon et al., 1998), 420 MHz (upgraded Giant Metrewave Telescope (uGMRT); Gupta et al., 2021a) and 170-231 MHz (GaLactic and Extragalactic All-sky MWA Survey (GLEAM) wide; Hurley-Walker et al., 2017), respectively. Among these surveys, the VLASS provides the highest angular resolution. The Gaussian decomposition of the VLASS detected source implies a deconvolved size of (position angle = ). The spectral index between the VLASS and NVSS images is = 0.05. At lower frequencies (1.4 GHz), the GLEAM and uGMRT flux densities imply slight spectral flattening ( = 0.05). This may be an indication of a spectral turnover at much lower frequencies (100 MHz).
The radio source is resolved in our mas-scale resolution VLBA image at 1.53 GHz (Fig. 2). At this frequency, only 41% of the total flux density expected from the NVSS is recovered in the VLBA image. This implies that more diffuse emission, perhaps extending beyond 50 mas (425 pc), is associated with the radio source. The extent of the projected radio emission, based on VLASS measurements, could be as large as 10 kpc. It is now well established that at kpc scales the FRII jets are better collimated than FRI jets (e.g., Bridle & Perley, 1984). Both observations and hydrodynamic simulations suggest that radio jets in both cases are initiated with relativistic speeds, but the decceleration caused by the entrainment of material disrupts the jet and may turn it from a FRII to FRI type morphology (e.g., Parma et al., 1987; Bicknell, 1995).
In the case of M1540-1453, assuming the ‘+’ in Fig. 2 denotes the location of the radio core i.e., AGN, both the eastern and western jets are bright near the base and gradually fade into diffuse extended emission. No significant brightness asymmetry is observed on either side, but slight bends in the trajectory of jets at 4 mJy beam-1 (fifth contour in Fig. 2; 8 mas i.e., 70 pc from the core) are noticeable. These are reminiscent of the onset of dentist-drill effect beyond which the interaction with the ambient medium makes it harder for the jets to remain collimated and relativistic (Scheuer, 1974). Clearly, the radio jet has FRI morphology and is encountering substantial amount of gas at 70 pc from the AGN. The similarities in jet morphology on either sides of the putative radio core suggest that the ambient media on both sides have similar properties.
By definition, RLQs with highest radio powers are expected to be of FRII type (e.g., Ghisellini & Celotti, 2001). The FRI morphology of M1540-1453 is likely a direct consequence of the jet-ISM interaction. The transition from FRII to FRI morphology due to jet-ISM interaction at sub-kpc scales have been noticed observationally in one case i.e., 3C 84 (e.g., Kino et al., 2021) and in numerical simulations with flatter density gradients (Kaiser & Alexander, 1997; Wagner et al., 2012).
3.2 Presence of a ‘ghostly’ H i absorber
From the detection of strong H i 21-cm absorption through uGMRT (Gupta et al., 2021a) and the VLBA morphology presented here, the AGN is expected to be buried in a gas rich environment. In the top panel of Fig. 1, we plot the scaled and reddened SDSS QSO template on top of the SALT spectrum. It is evident from the figure that while the profiles of C iv and C iii] emission lines roughly follow the template, the emission line associated with M1540-1453 is unusually narrow. In the bottom left panel of Fig. 1, we zoom in on the emission and also plot the quasar spectrum modified by an H i absorber with properties based on the 21-cm absorber (i.e., log (H i) = cm-2 at ). Here, we have assumed = 100 K and = 1. Clearly, no such absorption is present along the optical sight line towards the AGN.
However, as previously mentioned, the presence of low-ionization gas toward the optical sight line is confirmed through three Fe ii absorption features, and Si ii and Si iii absorption lines detected at (see Fig. 1). This may indicate the presence of a ‘ghostly’ strong absorption associated with M1540-1453 (Fathivavsari et al., 2017). The key requirement for the presence of a ‘ghostly’ absorber is that the typical size of the absorbing cloud be smaller than the BLR but larger than the continuum emitting region at optical/UV wavelengths (Laloux & Petitjean, 2021). For M1540-1453, we use = erg s-1 and Eq. 2 of Kaspi et al. (2007) to estimate the BLR radius, = 0.026 pc. Thus, absorbing cloud towards the optical sight line ought to be smaller than pc (diameter). The detection of damped Ly absorption at is needed to confirm the ‘ghostly’ nature of this absorber.
4 M1540-1453 and the ambient medium
In general, the gas detected in H i 21-cm absorption against a radio source could come from cold atomic gas in a regularly rotating structure i.e., circumnuclear disc or from the host galaxy ISM (e.g., Carilli et al., 1998). In the case of M1540-1453, the diffuse and distorted morphology of the radio emission (extent 425 pc) seen in the 1.53 GHz VLBA image, the broad (=167 km s-1) albeit smooth H i 21-cm absorption profile and the lack of corresponding DLA in the optical spectrum imply the presence of numerous compact cold gas clouds forming a screen that covers the widespread radio emission and the AGN. With the systemic redshift adopted in this work, the velocities of almost all the absorbing gas would be consistent with the infall scenario. It can be seen from Fig. 10 of Gupta et al. (2021a) that even if the coincides with the peak of the H i 21-cm absorption there is a significant redshifted wing corresponding to infalling cold H i gas.
Using low-frequency flux density estimates from uGMRT and GLEAM, and the calibration of Willott et al. (1999), we estimate the kinetic jet power associated with M1540-1453, Pjet = (W Hz-1) erg s-1. This is comparable to the radiative power represented by the bolometric luminosity ( = erg s-1; Gupta et al., 2021b) of the AGN. Thus, both the kinetic (jet-mode) and radiative (quasar-mode) feedback can affect the ambient gas here. The radiative feedback alone can generate velocities of the order of -445 to +1350 km s-1 observed in the optical spectrum (e.g., Faucher-Giguère & Quataert, 2012).
Further, the total energy deposited by the radio AGN over its lifetime ( yrs) through the interaction with the dense gas amounts to erg. In numerical simulations, this is adequate to drive a spherical energy-driven bubble of gas mass with observed velocities (Sutherland & Bicknell, 2007). Following this phase the radio jet drives into the lower density ISM. The radiatively and kinetically accelerated gas clouds are expected to eventually fall back into the central regions over timescales of tens of Myr (e.g., Wada, 2012; Mukherjee et al., 2016). The signatures of infalling gas in the present data are consistent with the above described scenario. Future near infrared spectroscopy and multi-frequency parsec-scale imaging of the radio continuum will provide an accurate systemic redshift measurement and constrain the orientation of the radio source and extent of the H i halo, required to test this model for M1540-1453.
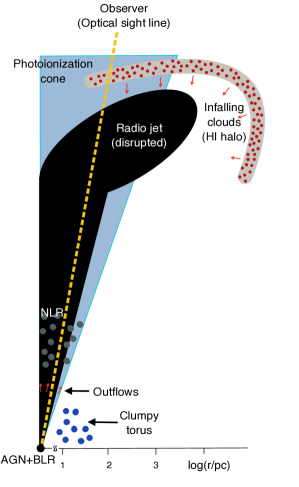
All the above considerations lead to a scenario summarized in Fig. 3. Radio jets are often observed to avoid extended circumnuclear discs but the jet-disc rotation axis may not be well aligned due to a variety of reasons. Instead, the jet-axes are often found to be distributed over a wide range of angles within the polar cap (e.g., Verdoes Kleijn & de Zeeuw, 2005; Ruffa et al., 2020). In the simplistic case of M1540-1453 presented here, it is assumed that initially the jet is launched along the axis of the inner accretion disc. However, at about 70 pc from the ‘core’ it gets misaligned due to interaction with the ambient medium. This misalignment and the diffuse nature of radio emission has helped in probing cold gas over a large region, well beyond the initial jet axis. Otherwise, this reservoir, and the presence of possible ‘ghostly’ H i absorber in the optical spectrum, would go unnoticed.
A similar scenario has been inferred for the well studied high-redshift radio galaxy (HzRG) B2 0902+34 at . The associated radio source, FRII-type in this case, of (40 kpc) extent has an orientation of to relative to the observer and is embedded in a huge halo (extent100 kpc; Lilly, 1988; Carilli, 1995). The detailed modelling of detected halo and H i 21-cm absorption in this case suggests that the radio AGN and the halo are embedded in an even larger infalling neutral halo of H i mass (Adams et al., 2009). Crucial to the infall scenario are the shape of profile, inclination of radio source, and redshifts of emission and H i 21-cm absorption. Despite the relatively large inclination for an HzRG, the central AGN in the case of B2 0902+34 is obscured suggesting that it is yet to blow out its environment. M1540-1453 shows no such obscuration implying that the AGN feedback has already cleared the obscuring material and blown an H i bubble, which depending on the accuracy of the systemic redshift, represents infalling material. It is therefore caught at the later stages of evolution. It may also be the case that B2 0902+34 is a protogiant elliptical galaxy in the early phases of evolution, and the collapsing structure represented by the H i shell in this case has an entirely different origin (Adams et al., 2009).
5 Concluding remarks
At low- (), FRI-type radio sources are typically associated with low-excitation radio galaxies (LERGs) exhibiting low accretion rates (0.01), low radio power ( W Hz-1) and hosted by red, massive early-type galaxies ( ) (Best & Heckman, 2012). M1540-1453, in comparison, is amongst the most powerful radio sources ( = 5.9 W Hz-1) and shows high-excitation optical spectra and efficiently accreting matter ( = 0.08). Indeed, the investigation of Best & Heckman (2012) shows that at = W Hz-1, LERGs may be as prominent as high-excitation radio galaxies (HERGs). M1540-1453 emphasizes jet-ISM interaction at sub-kpc scales as a pathway to produce FRI-type morphology, and may be more prevalent at high redshifts (), when these are still the assembly sites of giant galaxies.
Finally, we note H i 21-cm absorption detections in AGNs similar to M1540-1453 are rare (Gupta et al., 2021a). Further work is needed to understand the curious case of this AGN presented here. Does it represent a very short phase in the evolution of AGN, or simply a geometrical coincidence? The answers may lead to a better understanding of the sub-kpc scale environments through which FRI/FRII jets associated with powerful AGN are evolving at high-.
References
- Adams et al. (2009) Adams, J. J., Hill, G. J., & MacQueen, P. J. 2009, ApJ, 694, 314, doi: 10.1088/0004-637X/694/1/314
- Aditya et al. (2021) Aditya, J. N. H. S., Jorgenson, R., Joshi, V., et al. 2021, MNRAS, 500, 998, doi: 10.1093/mnras/staa3306
- Arrigoni Battaia et al. (2018) Arrigoni Battaia, F., Prochaska, J. X., Hennawi, J. F., et al. 2018, MNRAS, 473, 3907, doi: 10.1093/mnras/stx2465
- Best & Heckman (2012) Best, P. N., & Heckman, T. M. 2012, MNRAS, 421, 1569, doi: 10.1111/j.1365-2966.2012.20414.x
- Bicknell (1995) Bicknell, G. V. 1995, ApJS, 101, 29, doi: 10.1086/192232
- Borisova et al. (2016) Borisova, E., Cantalupo, S., Lilly, S. J., et al. 2016, ApJ, 831, 39, doi: 10.3847/0004-637X/831/1/39
- Bridle & Perley (1984) Bridle, A. H., & Perley, R. A. 1984, ARA&A, 22, 319, doi: 10.1146/annurev.aa.22.090184.001535
- Briggs et al. (1993) Briggs, F. H., Sorar, E., & Taramopoulos, A. 1993, ApJ, 415, L99, doi: 10.1086/187042
- Carilli (1995) Carilli, C. L. 1995, A&A, 298, 77
- Carilli et al. (1998) Carilli, C. L., Wrobel, J. M., & Ulvestad, J. S. 1998, AJ, 115, 928, doi: 10.1086/300253
- Celotti et al. (1997) Celotti, A., Padovani, P., & Ghisellini, G. 1997, MNRAS, 286, 415, doi: 10.1093/mnras/286.2.415
- Combes et al. (2014) Combes, F., García-Burillo, S., Casasola, V., et al. 2014, A&A, 565, A97, doi: 10.1051/0004-6361/201423433
- Condon et al. (1998) Condon, J. J., Cotton, W. D., Greisen, E. W., et al. 1998, AJ, 115, 1693, doi: 10.1086/300337
- Deller et al. (2011) Deller, A. T., Brisken, W. F., Phillips, C. J., et al. 2011, PASP, 123, 275, doi: 10.1086/658907
- Ellison et al. (2002) Ellison, S. L., Yan, L., Hook, I. M., et al. 2002, A&A, 383, 91, doi: 10.1051/0004-6361:20011738
- Fathivavsari et al. (2017) Fathivavsari, H., Petitjean, P., Zou, S., et al. 2017, MNRAS, 466, L58, doi: 10.1093/mnrasl/slw233
- Fathivavsari et al. (2018) Fathivavsari, H., Petitjean, P., Jamialahmadi, N., et al. 2018, MNRAS, 477, 5625, doi: 10.1093/mnras/sty1023
- Faucher-Giguère & Quataert (2012) Faucher-Giguère, C.-A., & Quataert, E. 2012, MNRAS, 425, 605, doi: 10.1111/j.1365-2966.2012.21512.x
- Finley et al. (2013) Finley, H., Petitjean, P., Pâris, I., et al. 2013, A&A, 558, A111, doi: 10.1051/0004-6361/201321745
- García-Burillo et al. (2019) García-Burillo, S., Combes, F., Ramos Almeida, C., et al. 2019, A&A, 632, A61, doi: 10.1051/0004-6361/201936606
- Ghisellini & Celotti (2001) Ghisellini, G., & Celotti, A. 2001, A&A, 379, L1, doi: 10.1051/0004-6361:20011338
- Greisen (2003) Greisen, E. W. 2003, AIPS, the VLA, and the VLBA, ed. A. Heck, Vol. 285, 109, doi: 10.1007/0-306-48080-8_7
- Gupta et al. (2017) Gupta, N., Srianand, R., Baan, W., et al. 2017, ArXiv e-prints. https://arxiv.org/abs/1708.07371
- Gupta et al. (2021a) Gupta, N., Srianand, R., Shukla, G., et al. 2021a, arXiv e-prints, arXiv:2103.09437. https://arxiv.org/abs/2103.09437
- Gupta et al. (2021b) Gupta, N., Shukla, G., Srianand, R., et al. 2021b, arXiv e-prints, arXiv:2107.09705. https://arxiv.org/abs/2107.09705
- Hurley-Walker et al. (2017) Hurley-Walker, N., Callingham, J. R., Hancock, P. J., et al. 2017, MNRAS, 464, 1146, doi: 10.1093/mnras/stw2337
- Kaiser & Alexander (1997) Kaiser, C. R., & Alexander, P. 1997, MNRAS, 286, 215, doi: 10.1093/mnras/286.1.215
- Kaspi et al. (2007) Kaspi, S., Brandt, W. N., Maoz, D., et al. 2007, ApJ, 659, 997, doi: 10.1086/512094
- Kino et al. (2021) Kino, M., Niinuma, K., Kawakatu, N., et al. 2021, ApJ, 920, L24, doi: 10.3847/2041-8213/ac24fa
- Krogager et al. (2018) Krogager, J. K., Gupta, N., Noterdaeme, P., et al. 2018, ApJS, 235, 10, doi: 10.3847/1538-4365/aaab51
- Lacy et al. (2020) Lacy, M., Baum, S. A., Chandler, C. J., et al. 2020, PASP, 132, 035001, doi: 10.1088/1538-3873/ab63eb
- Laloux & Petitjean (2021) Laloux, B., & Petitjean, P. 2021, MNRAS, 502, 3855, doi: 10.1093/mnras/stab173
- Lilly (1988) Lilly, S. J. 1988, ApJ, 333, 161, doi: 10.1086/166732
- Moore et al. (1999) Moore, C. B., Carilli, C. L., & Menten, K. M. 1999, ApJ, 510, L87, doi: 10.1086/311818
- Mukherjee et al. (2016) Mukherjee, D., Bicknell, G. V., Sutherland, R., & Wagner, A. 2016, MNRAS, 461, 967, doi: 10.1093/mnras/stw1368
- Noterdaeme et al. (2021a) Noterdaeme, P., Balashev, S., Combes, F., et al. 2021a, A&A, 651, A17, doi: 10.1051/0004-6361/202140745
- Noterdaeme et al. (2021b) Noterdaeme, P., Balashev, S., Krogager, J. K., et al. 2021b, A&A, 646, A108, doi: 10.1051/0004-6361/202038877
- Noterdaeme et al. (2019) —. 2019, A&A, 627, A32, doi: 10.1051/0004-6361/201935371
- Pâris et al. (2012) Pâris, I., Petitjean, P., Aubourg, É., et al. 2012, A&A, 548, A66, doi: 10.1051/0004-6361/201220142
- Parma et al. (1987) Parma, P., Fanti, C., Fanti, R., Morganti, R., & de Ruiter, H. R. 1987, A&A, 181, 244
- Planck Collaboration et al. (2020) Planck Collaboration, Aghanim, N., Akrami, Y., et al. 2020, A&A, 641, A6, doi: 10.1051/0004-6361/201833910
- Reynolds et al. (1996) Reynolds, C. S., Fabian, A. C., Celotti, A., & Rees, M. J. 1996, MNRAS, 283, 873, doi: 10.1093/mnras/283.3.873
- Richards et al. (2011) Richards, G. T., Kruczek, N. E., Gallagher, S. C., et al. 2011, AJ, 141, 167, doi: 10.1088/0004-6256/141/5/167
- Ruffa et al. (2020) Ruffa, I., Laing, R. A., Prandoni, I., et al. 2020, MNRAS, 499, 5719, doi: 10.1093/mnras/staa3166
- Scheuer (1974) Scheuer, P. A. G. 1974, MNRAS, 166, 513, doi: 10.1093/mnras/166.3.513
- Shukla et al. (2021) Shukla, G., Srianand, R., Gupta, N., et al. 2021, MNRAS, doi: 10.1093/mnras/stab3467
- Srianand et al. (2015) Srianand, R., Gupta, N., Momjian, E., & Vivek, M. 2015, MNRAS, 451, 917, doi: 10.1093/mnras/stv1004
- Storchi-Bergmann & Schnorr-Müller (2019) Storchi-Bergmann, T., & Schnorr-Müller, A. 2019, Nature Astronomy, 3, 48, doi: 10.1038/s41550-018-0611-0
- Sutherland & Bicknell (2007) Sutherland, R. S., & Bicknell, G. V. 2007, ApJS, 173, 37, doi: 10.1086/520640
- Verdoes Kleijn & de Zeeuw (2005) Verdoes Kleijn, G. A., & de Zeeuw, P. T. 2005, A&A, 435, 43, doi: 10.1051/0004-6361:20042271
- Wada (2012) Wada, K. 2012, ApJ, 758, 66, doi: 10.1088/0004-637X/758/1/66
- Wagner et al. (2012) Wagner, A. Y., Bicknell, G. V., & Umemura, M. 2012, ApJ, 757, 136, doi: 10.1088/0004-637X/757/2/136
- Willott et al. (1999) Willott, C. J., Rawlings, S., Blundell, K. M., & Lacy, M. 1999, MNRAS, 309, 1017, doi: 10.1046/j.1365-8711.1999.02907.x