20XX Vol. X No. XX, 000–000
22institutetext: Max-Planck Institut für Radioastronomie, Auf dem Hügel 69, 53121 Bonn, Germany; skomossa@mpifr.de
33institutetext: National Astronomical Observatories, Chinese Academy of Science, 20A Datun Road, Chaoyang District, Beijing 100012, China
44institutetext: Max-Planck Institute für Extraterrestrische Physik, Gießenbachstrasse 1, 85748 Garching, Germany
\vs\noReceived 2021 December 4; accepted 2022 Month Day
A new X-ray tidal disruption event candidate with fast variability
Abstract
During a close encounter between a star and a supermassive black hole, the star can get disrupted by the black hole’s tidal forces, resulting in a tidal disruption event (TDE). The accretion of the star’s material onto the black hole produces strong emission in different wavelength regimes. Here we report the discovery with ROSAT of an X-ray-selected transient source in an optically non-active galaxy. At the location RA: and Dec: a sudden rise in X-ray luminosity by a factor of within 8 days has been observed. Additionally, a very soft X-ray spectrum with a black-body temperature =0.1 keV and a peak luminosity of at least suggest a TDE interpretation, and the observed properties are very similar to previously identified soft X-ray (ROSAT) TDEs. An optical spectrum taken of the galaxy at the position of RXJ133157.6–324319.7 six years after the X-ray outburst does not show any emission lines as would be expected from a persistent active galactic nucleus (AGN). The redshift of the galaxy is determined to be 0.051 based on absorption lines. It is therefore likely a member of the galaxy cluster Abell 3560. The rise in X-ray luminosity happens within 8 days and thus appears to be fast for such an event. No X-ray emission was detected 170 days before and 165 days after the event, and none was detected 25 years later with the Neil Gehrels Swift Observatory. The change in X-ray luminosity is at least a factor of 40.
keywords:
galaxies: general — galaxies: nuclei — galaxies: individual (RXJ133157.6–324319.7) — X-rays: galaxies — black hole physics1 Introduction
Tidal disruption events (TDEs) represent the disruption of a star due to a close encounter with a supermassive black hole. Theoretical pioneering work by Rees (1990) predicted luminous flares of electromagnetic radiation from such events, lasting for weeks to months and then declining with a characteristic law. A fraction of the disrupted star’s matter is accreted onto the black hole (BH) while the rest is ejected. The accretion of the stellar material produces strong emission in different wavelength regimes. One of these is the X-ray regime which is a powerful tool for the detection of such events due to the huge peak brightness observed at these wavelengths. TDEs were first detected in the X-ray band with the ROSAT mission (Komossa & Bade 1999; Komossa & Greiner 1999; Grupe et al. 1999; Greiner et al. 2000; Komossa et al. 2004) and are characterized by large peak luminosities up to erg/s, super-soft X-ray spectra, high amplitudes of decline, and host galaxies which do not show AGN activity but are quiescent.
TDEs were then also identified at other wavebands including the radio, optical, UV and hard X-rays (review by Komossa 2015). Only a small fraction of them were detected at radio frequencies and launches powerful jets (e.g., Burrows et al. 2011; Bloom et al. 2011; Zauderer et al. 2011). X-ray TDEs show a wide range of host galaxy and SMBH masses between M⊙ (Komossa & Bade 1999; Komossa et al. 2004; Maksym et al. 2013; Donato et al. 2014; Lin et al. 2017, 2021), while optical and emission-line TDEs are preferentially detected in lower-mass hosts (Komossa et al. 2008; Wang et al. 2012; Wevers et al. 2017; Zhou et al. 2021).
In the X-ray band, several new TDEs were identified with Chandra and XMM-Newton with peak luminosities up to a few times 1044 erg/s and very soft X-ray spectra, located in quiescent host galaxies (e.g., Maksym et al. 2010; Esquej et al. 2008; Saxton et al. 2012b; Maksym et al. 2013; Donato et al. 2014; Lin et al. 2015, 2017; Li et al. 2020; Lin et al. 2021). Since TDEs are rare events, and their properties like light curve and spectral evolution can vary, identification of each single new event is of great interest.
A detailed analysis of TDEs is important because it enables the investigation of matter under strong gravitational influence including precession effects in the Kerr metric (e.g., Stone & Loeb 2012). Furthermore, TDEs are a possible means to find intermediate mass BHs (e.g., Wevers et al. 2017; Lin et al. 2017), supermassive BH binaries (Liu et al. 2014), and recoiling BHs (Komossa & Merritt 2008). Additionally, one can draw conclusions about the spin of the black hole depending on the light curve of a TDE and the rate at which they occur (Kesden 2012). Thus, their detailed study will greatly enhance our general understanding of BHs.
TDEs are best identified in non-active galaxies. Such galaxies lack the high-ionization narrow emission lines which are very characteristic for AGN. While AGN permanently harbor a (variable) accretion disk, in quiescent host galaxies such a disk is absent, and luminous, giant-amplitude X-ray flaring from the cores of quiescent galaxies can then be uniquely associated with TDEs (Rees 1988; Komossa & Bade 1999).
In this paper we present the identification and follow-up observations of a bright X-ray outburst. In Section 3 we describe the analysis of its X-ray spatial, spectral and timing properties, as well as optical follow-up spectroscopy and imaging. Finally, we discuss different outburst scenarios and conclude that the most likely mechanism to produce the event is a TDE (Sect. 4). When we report luminosities, these are based on a distance of 224 Mpc.
2 Observations
The transient source RXJ133157.6–324319.7 presented in this work was detected in observations with the Roentgen Satellite (ROSAT, Truemper 1982) of the galaxy cluster Abell 3560 performed in 1993 (Reiprich & Greiner 2001). For this observation, one of the Position Sensitive Proportional Counters (PSPC-B, Briel & Pfeffermann 1986) was used. A total of five observations over the course of 335 days covered this object. We determined the position of the outburst at RA: and Dec: by using the source detection implemented in the EXSAS software (Zimmermann et al. 1993).
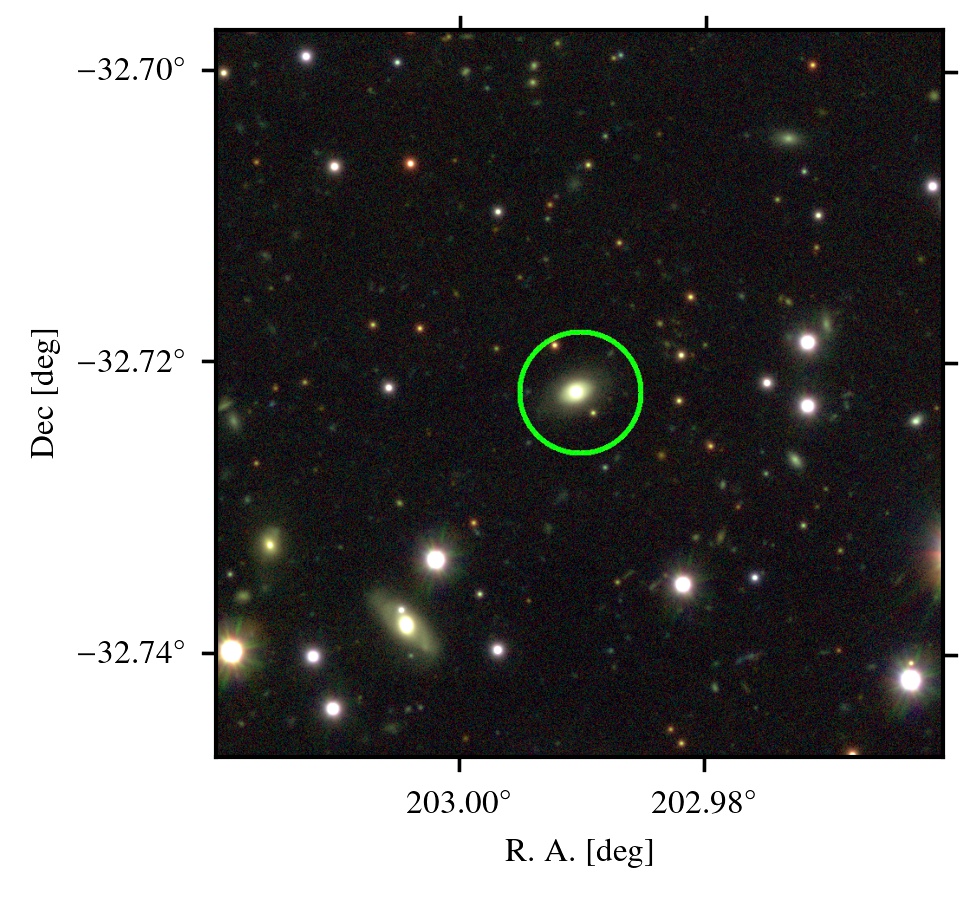
By comparing the position with an optical image on the DSS and an image later taken with the OmegaCAM at the VLT Survey Telescope (VST; Arnaboldi et al. 1998) in 2013, about 20 years after the outburst, one finds a galaxy to be the likely optical counterpart of the X-ray outburst. An image and spectrum of the galaxy was taken in 1999 (see Sect. 3.3). In Fig. 1 we overplot the X-ray error circle on the more recent galaxy image taken with OmegaCAM.
3 Data Analysis
3.1 X-ray spectrum
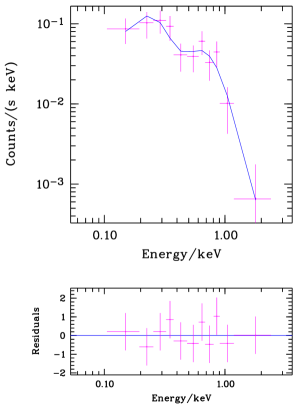
All ROSAT X-ray analysis was done with the EXSAS software (Zimmermann et al. 1993). A spectrum of the source was extracted for part 1 of observation 800284p, taken on 25-01-1993 (Fig. 2) which has the largest number of counts. After vignetting correction, we fit a simple power law model to the background-subtracted spectrum. However, this results in an unusually steep slope with photon index and is not discussed further. Next, a black body model was fit to the spectrum, as successfully applied to all previous soft ROSAT TDE spectra (e.g., Komossa & Bade 1999). Such a model fits the spectrum well. We find consistent with Galactic absorption (, HI4PI Collaboration et al. 2016), = 105 31 eV and =1.1. The inferred unabsorbed X-ray luminosity for this time interval is .
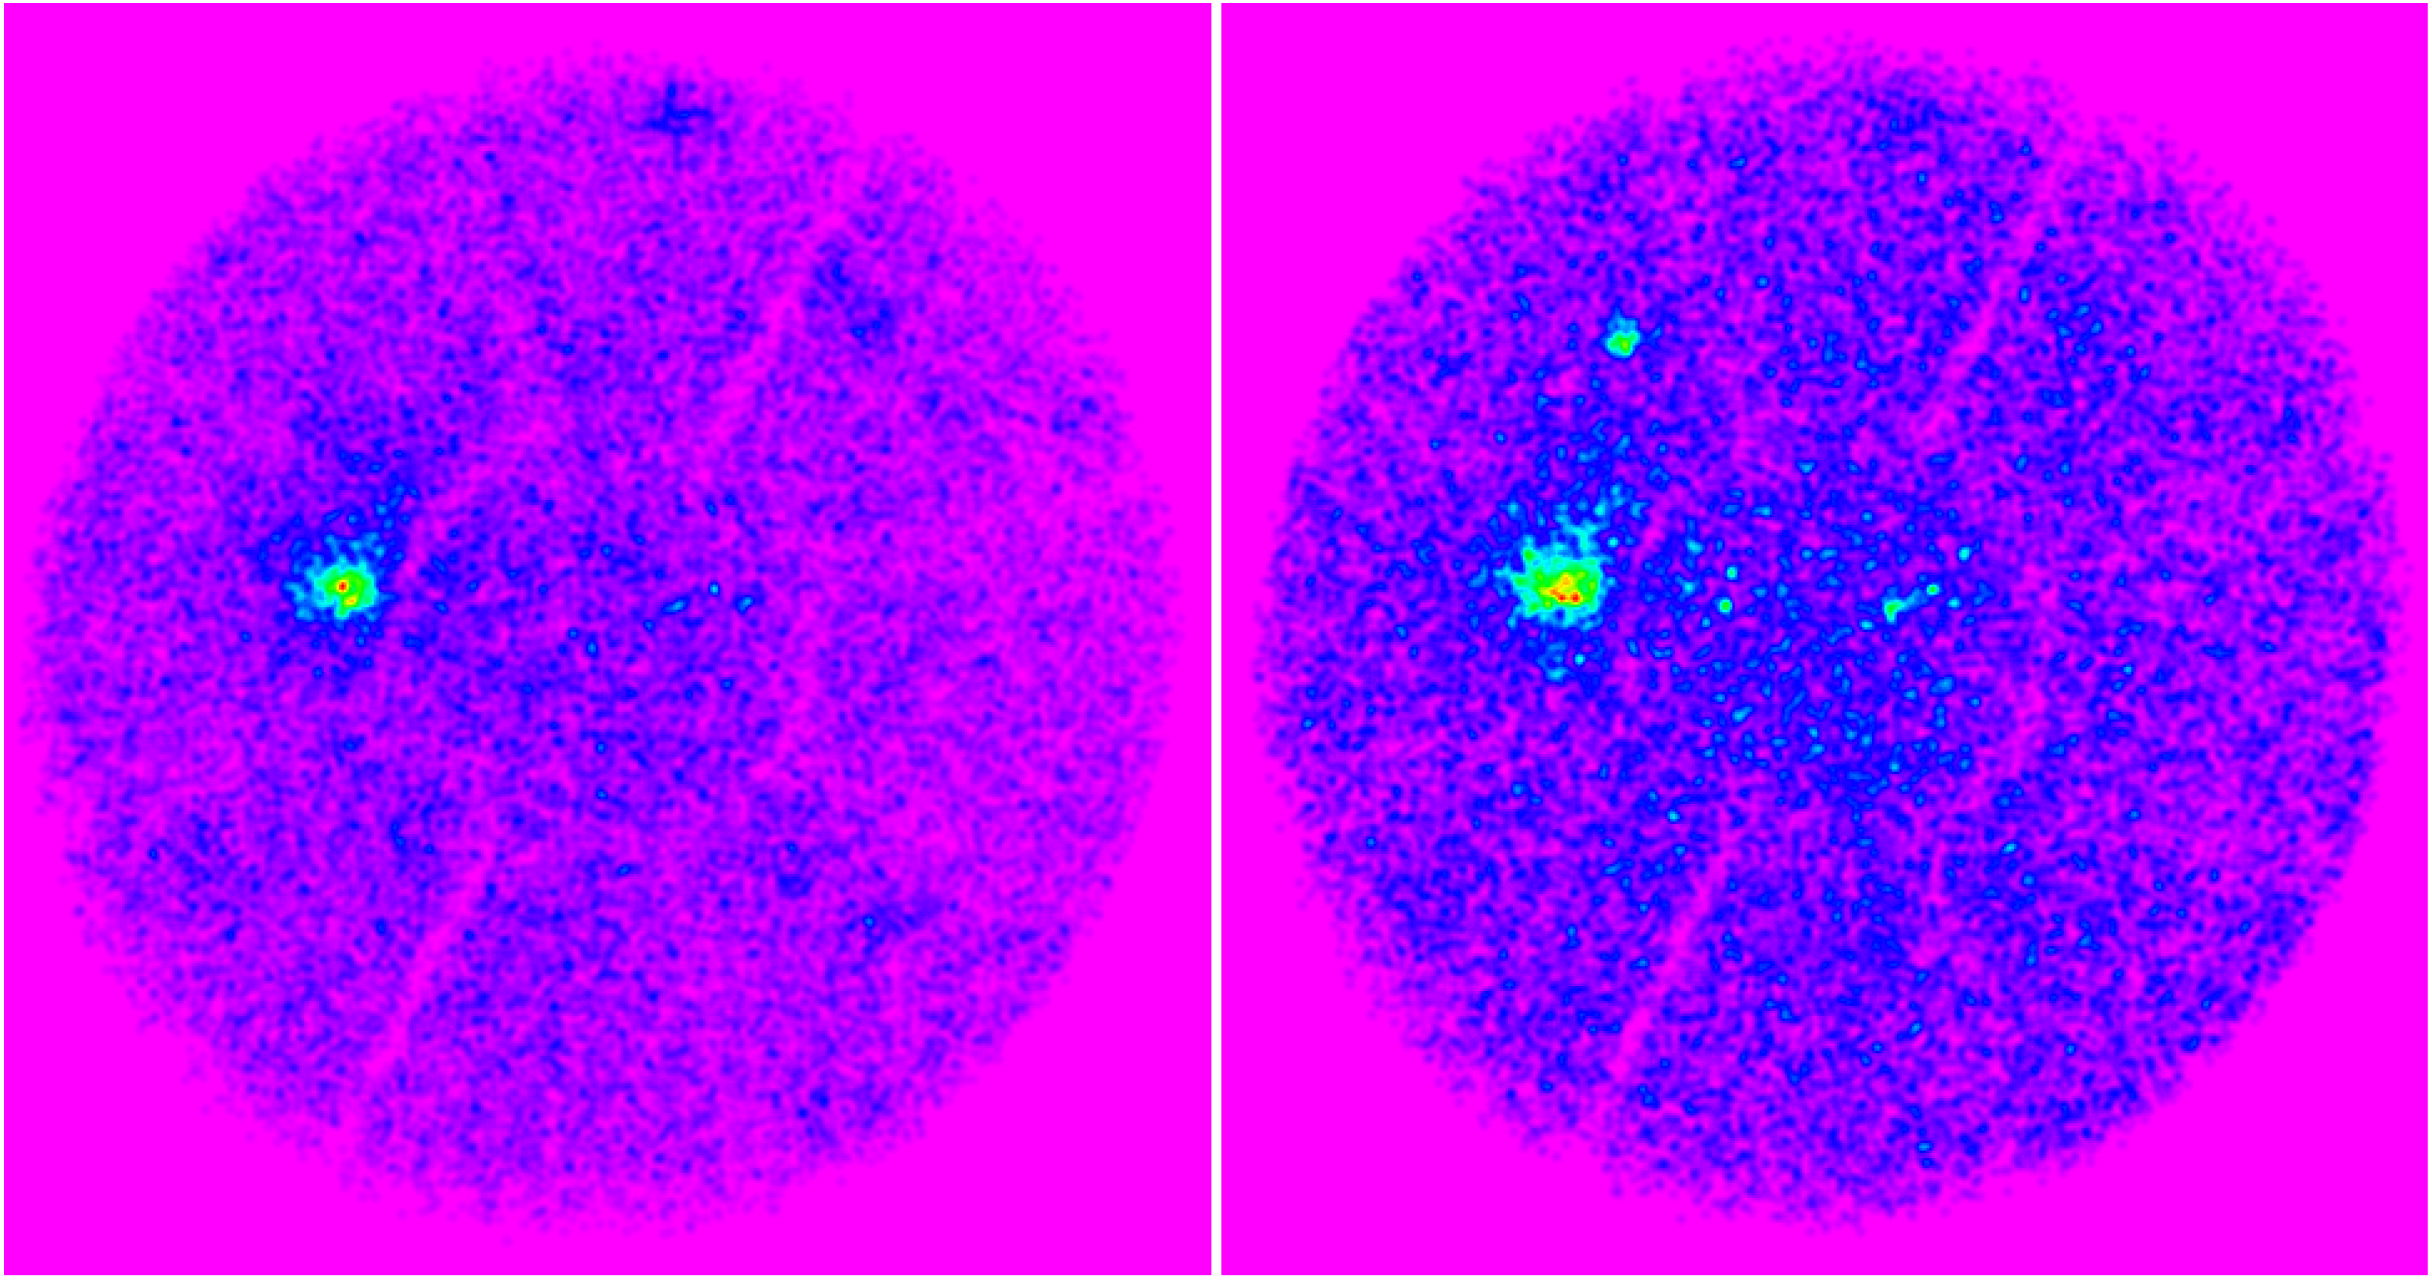
An X-ray image of the field of view including the cluster Abell 3560 with and without the TDE is displayed in Fig. 3.
3.2 Light curve
Based on further PSPC observations with fewer photons, but still enough to determine countrates or upper limits, (Obs. IDs 800381p, 800381p-1, 800284p, 800284p-1, and 800381p-2), the event light curve was constructed.
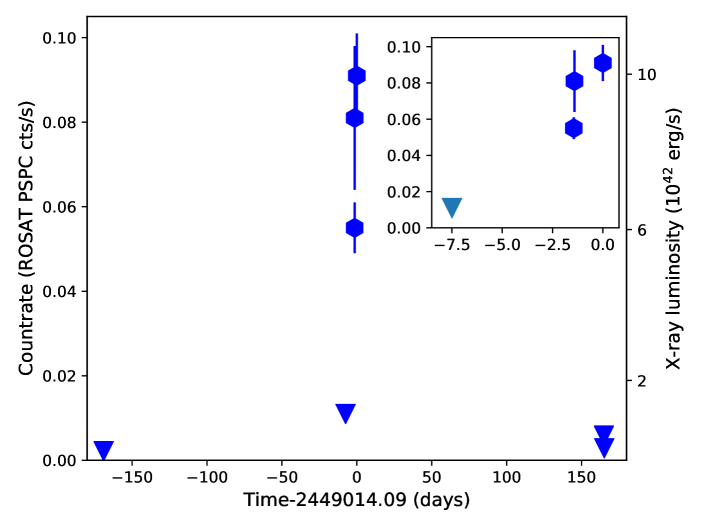
Count rates in the energy band (0.1–2.4) keV are measured in an area with a radius of around the source and corrected for dead time, exposure time, and vignetting effects. A background subtraction using an annulus in the radial range – with no sources is carried out. The exact choice of background location does not change the result significantly. The results are listed in Tab. LABEL:tab:data. In Fig. 4 the light curve is shown. The luminosities all assume the same spectrum (Section 3.1) and were derived using the redshift we measured form the optical spectrum (Sect. 3.3), and using a distance of 224 Mpc.
Comparing the countrate at maximum, 0.091 cts/s, to the upper limit 170 days before, cts/s, and 165 days after, cts/s, an increase and decrease by factors of 41 and 31, respectively, are implied, each with a uncertainty. Potentially even more interesting is the fast rise within 8 days of a factor of 8, based on the lower limit 0.011 cts/s.
| Observation ID | Mid-Time of Obs. | Exposure | Source Count Rate | Source Counts | |
|---|---|---|---|---|---|
| (JD) | (s) | (PSPC cts/s) | (cts) | erg/s | |
| 800381p | 2448845.0983 | 3612 | 2.2E-3 | – | 0.024 |
| 800381p-1 pt1 | 2449006.5937 | 1932 | 0.011 | – | 0.121 |
| 800284p pt1 | 2449012.6458 | 3559 | 0.0550.006 | 13115 | 0.600.07 |
| 800284p pt2 | 2449012.6805 | 541 | 0.0810.017 | 306 | 0.890.19 |
| 800381p-1 pt2 | 2449014.0906 | 1076 | 0.0910.010 | 809 | 1.000.11 |
| 800284p-1 | 2449179.0550 | 3060 | 5.9E-3 | – | 0.065 |
| 800381p-2 | 2449179.2655 | 5796 | 2.9E-3 | – | 0.032 |
Furthermore, we used the Neil Gehrels Swift Observatory (Swift hereafter; Gehrels et al. 2004) to search for late-time X-ray emission from RXJ133157.6–324319.7. We determined upper limits (2) from these three Swift XRT observations performed in April 2018 (Obs-IDs: 00010661001, 00010661002, and 00010661003). This resulted in limits consistent with those from the ROSAT PSPC pointed observations taken about 25 years earlier, again assuming the same spectrum (Tab. 2). Since the three upper limits determined with Swift are consistent with each other, we have also merged the three single observations to determine one deeper upper limit of cts/s. Limits from the ROSAT All-Sky Survey and XMM-Newton Slew Survey are also shown in the table.
| Mission | Date | UL | exposure | |
|---|---|---|---|---|
| (cts/s) | (s) | (1043 erg/s) | ||
| ROSAT Survey | 1991/01/04 | 0.027 | 289 | 0.297 |
| XMM slew | 2006/01/10 | 0.36 | 10 | 0.412 |
| XMM slew | 2015/02/03 | 0.50 | 7 | 0.572 |
| XMM slew | 2015/08/07 | 0.75 | 5 | 0.858 |
| Swift | 2018/04/18 | 0.0033 | 1123 | 0.101 |
| Swift | 2018/04/22 | 0.0020 | 1971 | 0.061 |
| Swift | 2018/04/26 | 0.0029 | 1998 | 0.088 |
3.3 Optical observations
A 300 s I band image, taken on January 26, 1999 with DFOSC at the 1.5m Danish telescope at ESO/La Silla using a 2052x2052 backside illuminated LORAL/LESSER chip shows an extended galaxy within the X-ray error circle, as well as a few further, much fainter star-like objects.
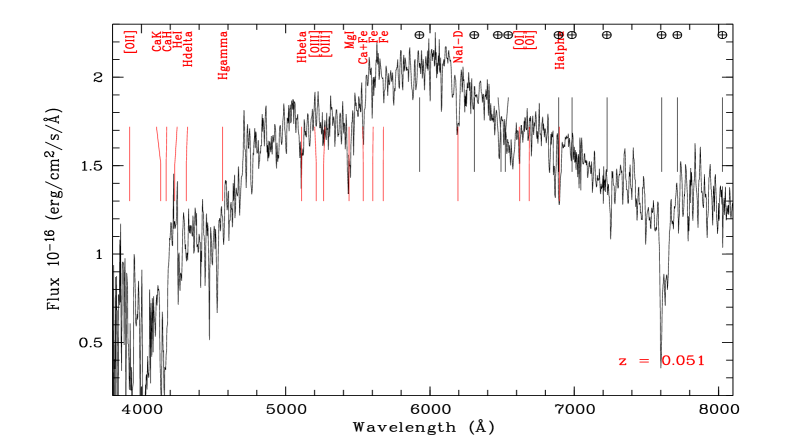
The bright central galaxy, with coordinates RA (2000) = and Dec (2000) = , was observed on January 26, 1999 with DFOSC using grism 4 with 300 grooves per mm, covering the 3000–9000 Å range at a dispersion of 220 Å/mm or 3.0 Å/pixel. The seeing was , giving a FWHM resolution of 11 Å. Two exposures of 1500 s and 1800 s were taken, respectively. Standard processing and optimal extraction were done using canonical MIDAS routines. The star GD 108 has been used for flux calibration. The averaged spectrum is shown in Fig. 5, together with some major absorption lines. We determine R 17.7 mag from the spectrum.
The optical spectrum is characterized by strong absorption lines of Na I 5175Å, Mg I 5890Å and H (note that H overlaps with the atmospheric B band), typical of an elliptical or early spiral type. Using the Mg I, Na I and H line we derive a redshift of , similar to the redshift of Abell 3560 (, Reiprich & Böhringer 2002). The deep Balmer lines and the strong drop of the flux beyond the Ca II H/K break argue against a classification as BL Lac object. No AGN-like forbidden emission lines, like [OIII]5007, are detected. These observations establish a quiescent, non-active host galaxy.
We also retrieved public OmegaCAM@VST data around the cluster Abell 3560 in the filters , , and . The data were obtained under programs 091.A-0050(F) for the -band, 094.A-0050(A), 092.A-0057(D) and 092.B-0623(D) for the -band and 089.A-0095(H) for the -band. All images were obtained under very good, sub-arcsecond and photometric observing conditions. The total exposure times are 3360 s (-band), 2368 s (-band) and 1000 s (-band). The data were processed with the THELI-pipeline (see Erben et al. 2005) and the processing methods are described in detail in Kuijken et al. (2015). Fig. 1 shows a 6 arcminute by 6 arcminute cutout around the outburst position of RA: and Dec: . The ROSAT error circle is displayed and corresponds to . At the position we identify a bright object which we visually identify as a regular elliptical galaxy, in agreement with the spectroscopic analysis, presumably a member of the Abell 3560 cluster given the coincident spectroscopic redshift determined above. The magnitudes of the galaxy are , and .
4 Discussion
4.1 Likelihood of TDE
The X-ray observations of a transient source fit the criteria of a tidal disruption event, as first predicted by theory and then observed in the X-ray regime, especially with ROSAT in the same energy band as discussed here (Rees 1988; Komossa & Bade 1999) A large change in brightness by at least a factor of 40 leading to a luminosity of at least in the 0.1–2.4 keV energy band is detected. The position of the outburst is coincident within the errors with the nucleus of a quiescent galaxy in the galaxy cluster Abell 3560. An expected soft X-ray spectrum can be confirmed with a black body temperature of = 105 31 eV. In Section 4.2 alternative outburst scenarios will be discussed and are found to be unlikely or ruled out.
This suggests the X-ray emission to originate from a TDE. The light curve of the event is not covered well. However, the event fulfills the expectations for an X-ray TDE because it shows a quiescent, non-active host galaxy which rules out AGN activity. Further, it shows no evidence of large scale jets, no reoccurring X-ray emission, but a rapid increase and then a large decrease. Also 25 years after the outburst we could only determine an X-ray upper limit with Swift consistent with the ROSAT upper limit half a year after the outburst.
4.2 Alternative Outburst Scenarios
4.2.1 AGN
A source that could potentially be mistaken for a TDE is an AGN. However, our optical spectrum clearly establishes a non-active, quiescent host galaxy, since the characteristic narrow emission-lines of AGN are undetected, and since the source is not a blazar either. Furthermore, as already mentioned above, all properties of the event show the characteristics of a TDE, consistent with the systems previously observed.
4.2.2 Supernova and X-ray Binary in the Quiescent Galaxy
A high fluctuation in luminosity like the one observed could potentially be explained by supernova explosions. However, the peak brightness is unusually high for a supernova. Their typical luminosities range from to and they very rarely reach up to (Dwarkadas & Gruszko 2012) which is still an order of magnitude lower than detected in this observation. A similar argument can be made to exclude X-ray binaries in the quiescent galaxy as counterpart of the X-ray outburst. While large fluctuations in X-ray emission on this time scale could arise from X-ray binaries, their X-ray luminosity is expected to be much lower than the highest luminosity observed here. A recent study of 110 X-ray outbursts in 36 low mass X-ray binaries performed by Yan & Yu (2015) show that the typical peak luminosities only range from . Additionally, black hole X-ray binaries are not expected to show such soft spectra. In the soft state power law indices from to are expected (Gilfanov 2010). Sazonov & Khabibullin (2017) find similar results for high mass X-ray binaries.
4.2.3 X-ray Binary in the Milky Way
The derived luminosity depends on the distance of the source and was determined under the assumption, that the source is located in the member of the galaxy cluster Abell 3560. However, if the X-ray outburst actually occurred much closer to us and it only is due to a coincidental projection effect that its position overlaps with the optical location of the galaxy in Abell 3560, the peak luminosity has been overestimated. Instead, if one assumes that the X-ray source originates from within the Milky Way (Galactic coordinates: and ), the luminosity is estimated by where is the derived flux and the distance to the source. Results by Coleiro & Chaty (2013) suggest that only few detected X-ray binaries exceed a distance of while many are found to be at a distance of about –. Then, the resulting (peak) luminosity is about ten orders of magnitude lower, .
This is quite low for a typical observed Milky Way X-ray binary but does not rule out this origin; also, the column density might be lower than what we assumed here, especially for a smaller distance. However, the very soft spectrum ( keV) makes an X-ray binary origin in our Galaxy unlikely unless their spectra soften significantly at these not very well studied, very low luminosities.
4.2.4 Gamma-ray Burst
Another alternative scenario to explain an X-ray outburst is a gamma-ray burst (GRB) afterglow. Comparing the time and position of the event with detected gamma-ray bursts listed in the Gamma-Ray Bursts Catalogue (GRBCAT) results in only one match in the vicinity of the X-ray detection at the time of the outburst: GRB 930118 (Kippen et al. 1998). It is the only event that occurred during a time interval from to and within a maximum distance of relative to the position of the transient. While the detection overlaps with the beginning of the rise of the X-ray detection, GRB 930118 occurs seven days prior the detected peak luminosity. It was detected by the Burst And Transient Source Experiment (BATSE) and its position was refined with the Imaging Compton Telescope (COMPTEL) to be at RA: and Dec: with an uncertainty of (Kippen et al. 1998). The two events are, therefore, separated by 15.7 degrees, making it impossible that the same event was the origin of both detections. Moreover, the soft spectrum is atypical for GRB afterglows, arguing against an afterglow interpretation from a burst not detected by any active GRB satellite mission.
4.3 Rise Time
A rise in brightness within 8 days was observed. While the majority of X-ray TDEs were only observed after their peak (or months before their peak), the case of NGC 5905 detected with ROSAT showed a rise by a factor of during a similar one week time interval (Bade et al. 1996; Komossa & Bade 1999). We discuss several scenarios for the fast variability.
Guillochon & Ramirez-Ruiz (2013) show in simulations that rise times are expected to range from 24 to 32 days, depending on the type of star. Lodato et al. (2009) show numerically that slightly faster rise times can be achieved, depending on the distribution of the matter in the star. The more homogeneously distributed the matter is, the faster the rise time. It is well possible that the rise we observed within those 8 days is not the total time of the rise, as other systems showed higher peak luminosities (Komossa 2015). However, it is also well possible, that we did not observe the actual rise itself, but rather saw fluctuation in X-ray luminosity during rise or decline. A few TDEs with large short-timescale fluctuations in luminosity have been observed, and the underlying mechanism may also be operating in the event presented here, as discussed below.
One possible explanation is high-amplitude fluctuations in the light curve (so we do not observe the actual rise time). Strong continuous fluctuations on very short time scales have previously been observed in jetted TDEs (e.g., Zauderer et al. 2011; Burrows et al. 2011; Saxton et al. 2012a) where for instance beaming could drive the observed rapid X-ray emission (see also (Wong et al. 2007)). Some of these fluctuations happen on time scales as short as . However, for the presented TDE, no matching radio emission has been found when checking the NASA/IPAC extragalactic database (NED) for the corresponding coordinates; although, there may not have been radio observations in the relevant time range.
A second possibility is that the TDE originated in a binary SMBH system. Under such circumstances, the second SMBH temporarily interrupts the accretion stream on the primary, leading to characteristic fast dips in TDE light curves, and then excess emission at the times the primary starts accreting again. This process has been identified in the light curve of SDSSJ1201+30 (Liu et al. 2014) and a similar mechanism could be at work in the system presented here. A better light curve coverage would have been needed to constrain this scenario further.
Another possibility is that the mass of the black hole is actually smaller than the typical mass of SMBHs in the center of galaxies. If instead of a mass of a black hole mass of was assumed, the X-ray outburst could be explained by the disruption of a main sequence star (based on Guillochon & Ramirez-Ruiz 2013). These kind of black holes could potentially be found in dwarf galaxies surrounding the detected galaxy (e.g., Reines et al. 2013). However, if the TDE originated in a dwarf galaxy with a SMBH mass as low as , the high observed peak luminosity would be unexplained, especially if we did not catch the event right at peak.
5 Conclusions
We present a new X-ray selected TDE candidate, RXJ133157.6–324319.7, exhibiting a fast variability time and high peak luminosity. The data show properties which are expected for a typical tidal disruption event, observed in the majority of the previously identified X-ray events:
-
1.
The occurrence of one outburst in the X-ray regime at the location of an optically quiet galaxy (). Additionally, no signs of reoccurring X-ray emission were found.
-
2.
The spectrum is very soft and is well described by a black body model of keV; a value very similar to other ROSAT soft X-ray TDEs. No excess absorption is required.
-
3.
The highest observed luminosity is erg/s.
-
4.
An increase in luminosity by a factor 8 is observed within 8 days. No X-ray emission is detected 165 d after the peak (implying a factor 40 decline), and none is detected with Swift in 2018.
These observed quantities fit the expectations for a TDE very well. Other outburst scenarios can be ruled out or seem to be unlikely:
-
1.
An AGN can be ruled out because of the quiescent host galaxy with no characteristic optical narrow emission lines detected at all.
-
2.
A supernova or X-ray binary in the quiescent galaxy as a source seems to be highly unlikely because of the high luminosity. The X-ray luminosities of these events are smaller than the one of the detected source by one to several orders of magnitude.
-
3.
It does not appear to be the afterglow of a gamma-ray burst, either. No burst has been detected nearby the determined position of the outburst in the relevant time interval. A neutron star-neutron star or neutron star-black hole merger with very weak gamma-ray emission but very strong X-ray emission also seems unlikely.
-
4.
We cannot entirely rule out an optically faint X-ray binary in our galaxy, projected by chance right onto the galaxy at . However, the soft spectrum, and missing recurrence of X-ray emission speak against this scenario.
A possible explanation for the factor of 8 rise within 8 days is a large fluctuation in brightness as has been found in a small number of other TDEs (so we do not see the actual rise time) as it could be produced, for instance, in a binary SMBH system. Alternatively, the mass of the accreting black hole could be significantly lower than for typical supermassive black holes.
Further observations with current X-ray telescopes would enable more accurate upper limits on, or a detection of, the baseline emission and, therefore, a better estimation of the total amplitude of variability and the spectrum and nature of the low-state emission, if any.
Acknowledgements.
We would like to thank Julia Hampel for carrying out her master thesis in Bonn, in collaboration with the co-authors. This work is based on an initial paper draft of hers which she could not quite complete due to her sudden, unexpected, and very saddening death. We would also like to thank Melanie Hampel for help with locating relevant files. Furthermore, we would like to acknowledge our referee for constructive comments. This work is based on data taken with the X-ray satellites ROSAT, XMM-Newton and Swift, and on data taken with the optical 1.5m Danish telescope and OmegaCAM. The ROSAT project was supported by the German Bundesministerium fur Bildung, Wissenschaft, Forschung und Technologie (BMBF/DARA) and the Max-Planck-Society. XMM-Newton is an ESA science mission with instruments and contributions directly funded by ESA Member States and NASA. This research has made use of the NASA/IPAC Extragalactic Database (NED) which is operated by the Jet Propulsion Laboratory, California Institute of Technology, under contract with the National Aeronautics and Space Administration.References
- Arnaboldi et al. (1998) Arnaboldi, M., Capaccioli, M., Mancini, D., et al. 1998, The Messenger, 93, 30
- Bade et al. (1996) Bade, N., Komossa, S., & Dahlem, M. 1996, A&A, 309, L35
- Bloom et al. (2011) Bloom, J. S., Giannios, D., Metzger, B. D., et al. 2011, Science, 333, 203
- Briel & Pfeffermann (1986) Briel, U. G., & Pfeffermann, E. 1986, Nuclear Instruments and Methods in Physics Research A, 242, 376
- Burrows et al. (2011) Burrows, D. N., Kennea, J. A., Ghisellini, G., et al. 2011, Nature, 476, 421
- Coleiro & Chaty (2013) Coleiro, A., & Chaty, S. 2013, ApJ, 764, 185
- Donato et al. (2014) Donato, D., Cenko, S. B., Covino, S., et al. 2014, ApJ, 781, 59
- Dwarkadas & Gruszko (2012) Dwarkadas, V. V., & Gruszko, J. 2012, MNRAS, 419, 1515
- Erben et al. (2005) Erben, T., Schirmer, M., Dietrich, J. P., et al. 2005, Astronomische Nachrichten, 326, 432
- Esquej et al. (2008) Esquej, P., Saxton, R. D., Komossa, S., et al. 2008, A&A, 489, 543
- Gehrels et al. (2004) Gehrels, N., Chincarini, G., Giommi, P., et al. 2004, ApJ, 611, 1005
- Gilfanov (2010) Gilfanov, M. 2010, in Lecture Notes in Physics, Berlin Springer Verlag, Vol. 794, Lecture Notes in Physics, Berlin Springer Verlag, ed. T. Belloni, 17
- Greiner et al. (2000) Greiner, J., Schwarz, R., Zharikov, S., & Orio, M. 2000, A&A, 362, L25
- Grupe et al. (1999) Grupe, D., Thomas, H. C., & Leighly, K. M. 1999, A&A, 350, L31
- Guillochon & Ramirez-Ruiz (2013) Guillochon, J., & Ramirez-Ruiz, E. 2013, ApJ, 767, 25
- HI4PI Collaboration et al. (2016) HI4PI Collaboration, Ben Bekhti, N., Flöer, L., et al. 2016, A&A, 594, A116
- Kesden (2012) Kesden, M. 2012, Phys. Rev. D, 86, 064026
- Kippen et al. (1998) Kippen, R. M., Ryan, J. M., Connors, A., et al. 1998, ApJ, 492, 246
- Komossa (2015) Komossa, S. 2015, Journal of High Energy Astrophysics, 7, 148
- Komossa & Bade (1999) Komossa, S., & Bade, N. 1999, A&A, 343, 775
- Komossa & Greiner (1999) Komossa, S., & Greiner, J. 1999, A&A, 349, L45
- Komossa et al. (2004) Komossa, S., Halpern, J., Schartel, N., et al. 2004, ApJ, 603, L17
- Komossa & Merritt (2008) Komossa, S., & Merritt, D. 2008, ApJ, 683, L21
- Komossa et al. (2008) Komossa, S., Zhou, H., Wang, T., et al. 2008, ApJ, 678, L13
- Kuijken et al. (2015) Kuijken, K., Heymans, C., Hildebrandt, H., et al. 2015, MNRAS, 454, 3500
- Li et al. (2020) Li, D., Saxton, R. D., Yuan, W., et al. 2020, ApJ, 891, 121
- Lin et al. (2015) Lin, D., Maksym, P. W., Irwin, J. A., et al. 2015, ApJ, 811, 43
- Lin et al. (2017) Lin, D., Guillochon, J., Komossa, S., et al. 2017, Nature Astronomy, 1, 0033
- Lin et al. (2021) Lin, D., Godet, O., Webb, N. A., et al. 2021, arXiv e-prints, arXiv:2112.11545
- Liu et al. (2014) Liu, F. K., Li, S., & Komossa, S. 2014, ApJ, 786, 103
- Lodato et al. (2009) Lodato, G., King, A. R., & Pringle, J. E. 2009, MNRAS, 392, 332
- Maksym et al. (2010) Maksym, W. P., Ulmer, M. P., & Eracleous, M. 2010, ApJ, 722, 1035
- Maksym et al. (2013) Maksym, W. P., Ulmer, M. P., Eracleous, M. C., Guennou, L., & Ho, L. C. 2013, MNRAS, 435, 1904
- Rees (1988) Rees, M. J. 1988, Nature, 333, 523
- Rees (1990) Rees, M. J. 1990, Science, 247, 817
- Reines et al. (2013) Reines, A. E., Greene, J. E., & Geha, M. 2013, The Astrophysical Journal, 775, 116
- Reiprich & Böhringer (2002) Reiprich, T. H., & Böhringer, H. 2002, ApJ, 567, 716
- Reiprich & Greiner (2001) Reiprich, T. H., & Greiner, J. 2001, in Black Holes in Binaries and Galactic Nuclei, ed. L. Kaper, E. P. J. V. D. Heuvel, & P. A. Woudt, 168
- Saxton et al. (2012a) Saxton, C. J., Soria, R., Wu, K., & Kuin, N. P. M. 2012a, MNRAS, 422, 1625
- Saxton et al. (2012b) Saxton, R. D., Read, A. M., Komossa, S., & Esquej, P. 2012b, in European Physical Journal Web of Conferences, Vol. 39, European Physical Journal Web of Conferences, 02002
- Sazonov & Khabibullin (2017) Sazonov, S., & Khabibullin, I. 2017, MNRAS, 468, 2249
- Stone & Loeb (2012) Stone, N., & Loeb, A. 2012, Physical Review Letters, 108, 061302
- Truemper (1982) Truemper, J. 1982, Advances in Space Research, 2, 241
- Wang et al. (2012) Wang, T.-G., Zhou, H.-Y., Komossa, S., et al. 2012, ApJ, 749, 115
- Wevers et al. (2017) Wevers, T., van Velzen, S., Jonker, P. G., et al. 2017, MNRAS, 471, 1694
- Wong et al. (2007) Wong, A. Y. L., Huang, Y. F., & Cheng, K. S. 2007, A&A, 472, 93
- Yan & Yu (2015) Yan, Z., & Yu, W. 2015, ApJ, 805, 87
- Zauderer et al. (2011) Zauderer, B. A., Berger, E., Soderberg, A. M., et al. 2011, Nature, 476, 425
- Zhou et al. (2021) Zhou, Z. Q., Liu, F. K., Komossa, S., et al. 2021, ApJ, 907, 77
- Zimmermann et al. (1993) Zimmermann, H. U., Belloni, T., Izzo, C., Kahabka, P., & Schwentker, O. 1993, EXSAS user’s guide. Extended Scientific Analysis System to evaluate data from the astronomical X-ray satellite ROSAT.