Extremely Buried Nucleus of IRAS 172080014 Observed at Sub-Millimeter and Near-Infrared Wavelengths
Abstract
The ultraluminous infrared galaxy IRAS 172080014 is a late-stage merger that hosts a buried active galactic nucleus (AGN). To investigate its nuclear structure, we performed high spatial resolution () Atacama Large Millimeter/submillimeter Array (ALMA) observations in Band 9 (450 µm or 660 GHz), along with near-infrared AKARI spectroscopy in 2.5–5.0 µm. The Band 9 dust continuum peaks at the AGN location, and toward this position CO(=6–5) and CS(=14–13) are detected in absorption. Comparison with non-local thermal equilibrium calculations indicates that, within the central beam (), there exists a concentrated component that is dense () and warm (200 K) and has a large column density (). The AKARI spectrum shows deep and broad CO ro-vibrational absorption at 4.67 µm. Its band profile is well reproduced with a similarly dense and large column but hotter (1000 K) gas. The region observed through absorption in the near-infrared is highly likely in the nuclear direction, as in the sub-millimeter, but with a narrower beam including a region closer to the nucleus. The central component is considered to possess a hot structure where vibrationally excited HCN emission originates. The most plausible heating source for the gas is X-rays from the AGN. The AKARI spectrum does not show other AGN signs in 2.5–4 µm, but this absence may be usual for AGNs buried in a hot mid-infrared core. Besides, based on our ALMA observations, we relate various nuclear structures of IRAS 172080014 that have been proposed in the literature.
1 Introduction
Active galactic nuclei (AGNs) are the central regions of galaxies that release radiative and kinetic energy, owing to mass accretion onto supermassive black holes (SMBHs). Despite their compactness compared to the host galaxies, the intense activity in AGNs affects star formation in the host galaxies by heating or expelling the interstellar medium via radiation, winds, and jets (see Fabian, 2012, for a review). The questions, concerning how SMBHs are fueled, how AGNs occur, and what the characteristics of their surrounding environment are, are important for understanding galaxy evolution.
It has been proposed that major galaxy mergers in the local universe play a significant role in triggering AGN activity, particularly in the case of powerful AGNs. Nearby AGNs are frequently observed in luminous () and ultraluminous () infrared (IR) galaxies ((U)LIRGs; Sanders & Mirabel, 1996). Most of these AGNs show signatures of past or ongoing interactions with other galaxies, such as double nuclei, tidal tails, bridges, and disturbed morphologies, in optical and near-IR images (e.g., Murphy et al., 1996; Duc et al., 1997; Scoville et al., 2000; Borne et al., 2000; Cui et al., 2001; Colina et al., 2001; Bushouse et al., 2002; Veilleux et al., 2002, 2006). Numerical simulations have shown that the gravitational torque generated during the mergers of disk galaxies funnels gas inward (Barnes & Hernquist, 1991, 1996) causing an intense starburst in nuclear regions (Mihos & Hernquist, 1996), leading to a rapid feeding of the SMBHs, until the AGN feedback expels the gas from inner regions (Di Matteo et al., 2005). These processes that take place during a galaxy merger are hierarchically modeled as a unified evolutionary scenario (Hopkins et al., 2006). This model has been simulated by including a vast range of merger properties in a cosmological framework, and has successfully reproduced the observed AGN luminosity functions, fractions, and clustering as a function of redshift and luminosity (Hopkins et al., 2008). Consistent with theoretical predictions, a concentration of material along the merger sequence has been confirmed by a decrease in the bulge radius observed in the -band (Haan et al., 2011) as well as a decrease in the size of the CO(1–0) emission (Yamashita et al., 2017). High dust temperatures (i.e., steep mid-IR slope) and deep silicate dust absorption at 9.7 µm in the late stages of a merger also imply a high mass concentration (Stierwalt et al., 2013). The fraction of Compton-thick (CT; ) AGNs in late-merger galaxies is higher than that in early-merger galaxies, peaking when the nuclei of merging galaxies are at a projected distance of 10 kpc (Ricci et al., 2017; Koss et al., 2018). In post-merger galaxies, the excess of X-ray selected AGNs over non-interacting control galaxies is poorly constrained because of heavy AGN obscuration. However, there is an excess of mid-IR AGNs in the redshift range , which is statistically significant (i.e., a factor of 17 excess in post-mergers compared to non-mergers; Secrest et al., 2020). A mid-IR AGN excess in mergers in the redshift range has also been confirmed by another study (Gao et al., 2020). This study further showed that the merger fraction in mid-IR AGNs is higher than that in non-AGNs, and that it increases with the stellar mass and AGN power. This suggests that mergers play a significant role in triggering AGNs, especially in the case of luminous AGNs (Gao et al., 2020).
The final stage of coalescence, during which the mass accretion rate of the SMBHs increases rapidly and the AGN feedback becomes more efficient, is a critical phase in the merger sequence. However, observing the site of coalescence is challenging because the nucleus is deeply buried in dusty gas during this stage. If the column density of the matter obscuring the nucleus is in the CT regime, then even the hard X-ray photons arising from the AGN can become nearly extinct. Moreover, the commonly observed millimeter (mm) and sub-millimeter (sub-mm) molecular lines may become optically thick and can undergo self-absorption (see e.g., Sakamoto et al., 2009; Rangwala et al., 2015; Scoville et al., 2017; Wheeler et al., 2020).
To overcome this difficulty, HCN, which is a standard dense gas tracer, has been observed in the vibrationally excited state (HCN-vib) over the last decade (Sakamoto et al., 2010; Imanishi & Nakanishi, 2013; Aalto et al., 2015a, b; Imanishi et al., 2016a, b; Martín et al., 2016; Falstad et al., 2019; Aalto et al., 2019). Aalto et al. (2015b) observed four (U)LIRGs that show intense activity in their compact nuclei. They also found that the and 3–2 lines of both HCN and HCO+ are severely self-absorbed; in contrast, the and 3–2 lines of HCN-vib are prominent and single-peaked. The authors interpreted these observations to be caused by a hot mid-IR core having a brightness temperature high enough to vibrationally pump up HCN molecules ( K) and a cooler gas envelope (extending up to tens of pc) surrounding the core, where the photons at the line centers of the ground-state HCN are absorbed. Falstad et al. (2019) found that at least some of the galaxies that exhibit bright HCN-vib emission have fast and collimated outflows (e.g., Arp 220; Barcos-Muñoz et al., 2018). Based on this, they proposed that the core from which the HCN-vib lines are emerging is passing through an intermediate stage before AGN feedback is fully developed. Unfortunately, there are only a few studies that can directly resolve the structure of such cores (Martín et al., 2016; Aalto et al., 2019). HCN-vib is indeed an excellent tracer of the nuclear region of CT AGNs because it is less susceptible to self-absorption. However, it has some disadvantages such as it is less abundant, and thus, relatively faint; moreover, its doublet and 1e is affected by blending with HCO+ and HCN , respectively, as observed by Martín et al. (2016). Notably, the velocity difference between HCN-vib and HCO+ is 400 , and that between HCN-vib and HCN is 40 , for all levels up to .
By contrast, we propose to study the structure of a deeply buried gas cocoon embedded in a late-stage merger by observing it in CO(=6–5).111Hereafter, we usually write this line simply as CO(6–5) for readability. We aim to observe the CO(6–5) absorption against the dust continuum emission along the line of sight toward the nucleus, and the CO(6–5) emission along the line of sight away from the nucleus. By inspecting the morphology of CO(6–5) and comparing its emission and absorption intensities with those of the underlying dust emission, we hope to infer the structure in the nuclear region of the merger. The abundance of CO is more than four orders of magnitude than that of HCN in the X-ray-dominated region (XDR) (Meijerink & Spaans, 2005), making it ideal for high-resolution observations. Owing to its high excitation level, CO(6–5) is suitable for probing the moderately warm and dense gas in the central region rather than the extended gas in the host galaxy. The upper and lower energy levels are K and K, respectively. The reason for detecting CO(6–5) in both absorption and emission is to obtain complementary information.
The target galaxy in our study is IRAS 172080014 (hereafter, referred to as IRAS 17208), which is one of the most luminous ULIRGs in the local universe (; Sanders et al., 2003). It is a late-stage merger (Haan et al., 2011) that has been suggested to harbor a CT AGN (González-Martín et al., 2009). IRAS 17208 exhibits bright HCN-vib emission (Aalto et al., 2015b), thus establishing itself as an ideal candidate to study the highly obscured interiors of mergers (see Section 2 for details). In this work, we present the high-angular-resolution ( pc) CO(6–5) data of IRAS 17208 obtained with the Atacama Large Millimeter/submillimeter Array (ALMA).
Another advantage of observing a CO pure rotational transition in absorption is that it can be compared with the CO ro-vibrational absorption in the near-IR region (, , band center 4.67 µm, line separations 0.01 µm). This band can probe the immediate vicinity of AGNs with an effectively high spatial resolution because the size of the background continuum source is compact, which is dominated by the dust sublimation region ( K). For instance, the interferometric observations of the nearby type-2 AGN NGC 1068 revealed a small sublimation radius of 0.24 pc (Gravity Collaboration et al., 2020). In addition to the spatial resolution, dozens of level transitions can be observed simultaneously in this band, unlike in the case of pure rotational transitions, making it easy to gauge the physical state of the gas.
The near-IR CO band has been detected in several obscured AGNs (Spoon et al., 2004, 2005; Shirahata et al., 2013; Baba et al., 2018; Onishi et al., 2021). Shirahata et al. (2013) observed the obscured AGN IRAS 085723915 NW with the 8.2-m Subaru telescope, and detected 18 blueshifted ( ) lines of different rotational levels that were spectroscopically resolved. The corresponding population diagram as a function of revealed that the absorption mainly originated from the gas in local thermal equilibrium (LTE) at a temperature of 270 K with a total molecular column density . The authors proposed that the high radial velocity, gas temperature, and column density observed are best explained by a molecular cloud moving near the AGN and heated by X-ray photons. Baba et al. (2018) analyzed the CO absorption bands detected in 10 nearby ULIRGs, which were observed with the space telescopes AKARI and Spitzer. Although the spectral resolution used in their study was not sufficient to resolve the rotational lines, they found high temperatures and column densities similar to those observed by Shirahata et al. (2013) based on band profile fitting.
Thus, previous observations of the near-IR CO absorption band suggest that it is useful for probing molecular gas near obscured AGNs. In this paper, in addition to the ALMA sub-mm mapping, we present the AKARI near-IR spectroscopic observations of IRAS 17208, and compare the data from these two telescopes to understand the structure of the nuclear region. The AKARI spectrum of IRAS 17208 has been previously published by Inami et al. (2018) as part of the spectral atlas of 145 galaxies. However, in this work, we performed data reduction with special care to increase the signal-to-noise ratio (S/N) of the observations. Improving the AKARI spectrum is also useful for discussing the nature of the nucleus in IRAS 17208 using the near-IR AGN/starburst diagnostics (Imanishi et al., 2008, 2010; Inami et al., 2018). Consequently, we also analyzed the 3.3 µm polycyclic aromatic hydrocarbon (PAH) emission, 3.1 µm H2O ice absorption, 3.4 µm aliphatic carbon absorption, and the near-IR continuum color.
In this paper, we discuss the structure of the deeply buried nucleus of IRAS 17208, based on observations with ALMA and AKARI. This paper is organized as follows. Section 2 summarizes the properties of IRAS 17208 reported in the literature. Section 3 describes the details of ALMA and AKARI observations and the data reduction performed. In Section 4, the data from the two observatories are compared with theoretical models to investigate the properties of gas, and the corresponding findings are discussed comprehensively in Section 5. Finally, our conclusions are summarized in Section 6.
2 IRAS 172080014
IRAS 17208 (or IRAS F172070014) is the most luminous ULIRG () in the southern sky among the galaxies in the IRAS Revised Bright Galaxy Sample (Sanders et al., 2003). Its redshift is (Saunders et al., 2000), corresponding to a luminosity distance of Mpc and an angular scale of pc.222A standard cosmology with , , and is adopted. Owing to its negative declination, high luminosity, and moderate redshift, IRAS 17208 is one of the most suitable ULIRGs for high-spatial-resolution ALMA observations.
The optical and near-IR images of IRAS 17208 show two long tidal tails toward the northwest and southeast, and a disturbed morphology in the central region (Melnick & Mirabel, 1990; Murphy et al., 1996; Duc et al., 1997; Scoville et al., 2000). Haan et al. (2011) and Stierwalt et al. (2013) classified this galaxy as a late-stage merger based on its optical and near-IR images, respectively. Medling et al. (2014) conducted adaptive-optics assisted near-IR integral field spectroscopy to reveal that the nuclei of the two progenitor galaxies are separated by 024 (or 200 pc in projection), which are contained in overlapping stellar disks (with radii 200 and 410 pc).
The activity of IRAS 17208 has been determined to be starburst-dominated based on its spectral properties in optical (from line ratios; Veilleux et al., 1995; Yuan et al., 2010), near-IR (from spectral slope, 3.3 µm PAH emission, and 3.4 µm dust absorption; Risaliti et al., 2006), mid-IR (from 7.7 µm PAH emission or 5–8 µm spectral shape; Lutz et al., 1999; Nardini et al., 2009, 2010), hard X-ray (from luminosity, spectral index, and/or 6.4 keV Fe K line; Franceschini et al., 2003; Iwasawa et al., 2011), and radio (from far-IR-to-radio ratio; Momjian et al., 2003). However, numerous studies have claimed that the explanation is more complicated. Duc et al. (1997) created three diagnostic diagrams of optical line ratios, and classified the galaxy as a low-ionization nuclear emission-line region (LINER) based on one diagram and as a starburst based on the other two. Arribas & Colina (2003) found from optical integral field spectroscopy that the optical nucleus is not coincident with the dynamically determined true nucleus, owing to dust extinction; consequently, this changes the classification of the true nucleus from H II to a LINER. Stierwalt et al. (2013) and Inami et al. (2018) classified the galaxy to be a composite of starburst and AGN activity based on the equivalent width of the 6.2 µm PAH emission and a combination of the equivalent width of the 3.3 µm PAH emission and near-IR color, respectively. González-Martín et al. (2009) analyzed the X-ray data from both Chandra and XMM-Newton, and concluded that IRAS 17208 is a CT AGN candidate based on the spectral index, flux ratio of hard X-ray to [O III], and equivalent width of Fe K. This classification is in contrast with that of Franceschini et al. (2003) and Iwasawa et al. (2011) cited above, who used data from only one of the two aforementioned observatories. Imanishi et al. (2006b) found that the HCN(1–0) to HCO+(1–0) ratio in the central 3″ is in between the typical values observed in AGN- and starburst-dominated galaxies.
The contribution of a possibly hidden AGN in IRAS 17208 to the bolometric luminosity has been evaluated by various studies. González-Martín et al. (2009) estimated the intrinsic hard X-ray luminosity to be , which results in an AGN fraction of . However, this estimate could have a large systematic uncertainty owing to the Compton-thickness correction. From IR diagnostics, much higher AGN fractions have been derived in the range of (Veilleux et al., 2009, 2013; Rupke & Veilleux, 2013; Gowardhan et al., 2018). By modeling the observed HCN-vib line, Aalto et al. (2015b) calculated the AGN luminosity to be (). This value is supported by García-Burillo et al. (2015) as a viable driver of a molecular outflow observed in the nucleus of IRAS 17208. From mid-IR observations, comparably high AGN fractions have been obtained using spectral decomposition techniques: 31% in 5–15 µm (Alonso-Herrero et al., 2016) and 17% in 4–20 µm (Leja et al., 2018). Given these findings, it is highly likely that IRAS 17208 possesses a heavily obscured AGN that has a significant contribution to the bolometric luminosity of the galaxy.
The considerable amount of nuclear material in IRAS 17208 has been evidenced not only by the heavy visual extinction and X-ray obscuration of the central region, but also by the self-absorption of sub-mm lines. Aalto et al. (2015b) observed the IRAS 17208 nucleus with ALMA at a resolution of 04, and detected deeply self-absorbed HCN(4–3) and HCO+(4–3) lines. We expect that the CO(6–5) line can be detected in absorption if observed at an angular resolution that is an order of magnitude higher.333The critical density of CO(6–5) is (Yang et al., 2010), and those of HCN(4–3) and HCO+(4–3) are and , respectively (Izumi et al., 2016).
Note that the AKARI spectrum of IRAS 17208 presented by Inami et al. (2018) was noisy, as it was damaged by hot pixels. Consequently, the presence of CO ro-vibrational absorption was unclear in the spectrum. However, the ULIRG UGC 5101, which shows HCN-vib emission similar to IRAS 17208 (Falstad et al., 2019), exhibits deep CO absorption (Baba et al., 2018). Therefore, we expect to detect significant CO absorption in IRAS 17208 as well, if data reduction is performed carefully.
3 Observations and Results
3.1 ALMA
3.1.1 Observations and Data Reduction
The nucleus of IRAS 17208 was observed with ALMA Band 9 on 2017 Aug 9 as part of our Cycle 4 program (2016.1.01223.S; PI: S. Baba). In total, 45 antennas were used, and the projected baselines spanned from 19.6 m to 3.36 km. The maximum recoverable scale (MRS) was 046,444Evaluated by the ALMA Cycle 4 approved formula: , where is the wavelength and is the fifth percentile baseline length (199 m). and the half power beam width of the primary beam was 9″. Of the four spectral windows (each 1.875 GHz wide), one was centered on the CO(=6–5) line, another was adjusted to include CS(=14–13), which might be serendipitously detected, and the rest were used to image the continuum emission. The total on-source time was 26.7 min. The bandpass, phase, and flux calibrators were J15172422, J17430350, and J17510939, respectively. The accuracy of the absolute flux calibration for Band 9 is expected to be at the 20% level according to the ALMA Cycle 4 Proposer’s Guide.
The data reduction and subsequent analysis were conducted with CASA version 4.7.2 (McMullin et al., 2007). The bandpass, phase, and absolute flux were calibrated by executing the scripts provided by ALMA along with the raw data. Channels with too high system temperatures due to the presence of atmospheric lines were flagged by the script and excluded from further analysis. One example of these atmospheric lines is at a sky frequency of 658.035 GHz. We found that several channels adjacent to the ones flagged at this frequency also had fairly high system temperatures, and hence we manually added flags to them using the flagdata task in CASA.
The continuum flux level was determined from the line-free region (observed frequency 658.2–661.7 GHz) and subtracted from the visibility using the uvcontsub task assuming a constant for the fit. Continuum-subtracted and unsubtracted image cubes were reconstructed from all the spectral windows by applying the tclean task. Briggs weighting with a robustness parameter of 0.5 was adopted. The pixel scale was set to 5 mas. To improve the S/N, the original spectral channels were binned into a common optical velocity width of 29.35 . The resulting rms noise of the data cube was 4.0 mJy . The full width at half maximum (FWHM) of the obtained synthesized beam was or .
3.1.2 Spectra
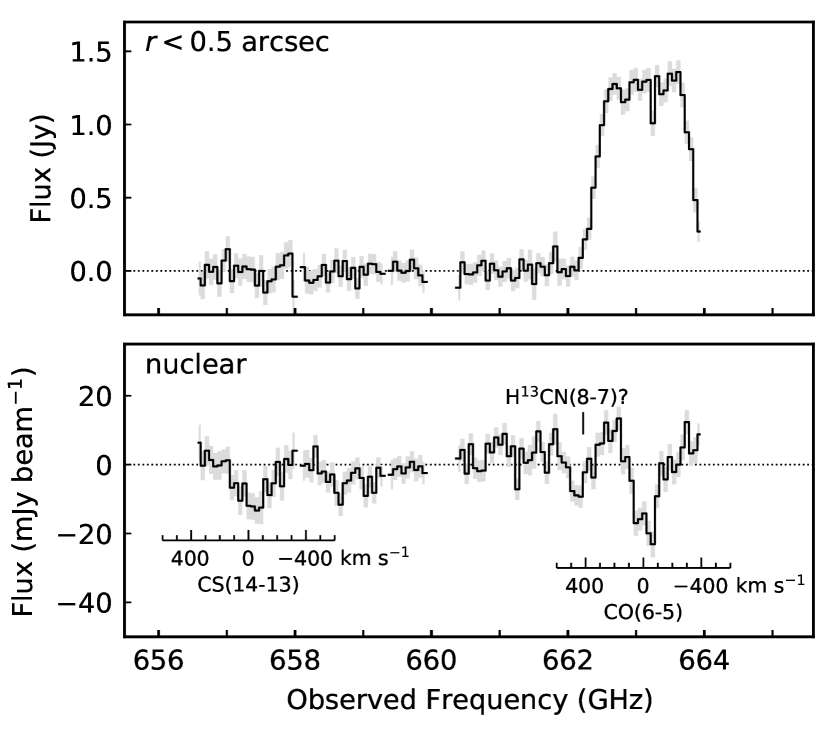
Band 9 line spectra of different spatial scales were created from the cleaned data cube. The upper panel of Figure 1 shows a spectrum spatially integrated within 05 from the nucleus (continuum peak, Section 3.1.3). The CO(6–5) emission is clearly observed. Unfortunately, however, its most blueshifted ( relative to the systemic velocity ; García-Burillo et al. 2015555Note that the beam size of the observation by García-Burillo et al. (2015) was 05, so the adopted here is a composite of the two nuclei of IRAS 17208.) part did not fit into a single spectral window and was missed. Other emission lines are not detected with this angular size.
The lower panel of the same figure presents a beam-sized spectrum extracted at the nucleus. It is clearly shown that CO(6–5) is detected as continuum absorption as expected. The absorption depth relative to the continuum level reaches mJy , and the FWHM is 200 . In addition, CS(14–13) is detected in absorption as well. These two lines could be slightly blueshifted ( ) with respect to (Section 5.4). Another absorption line at GHz could be H13CN(8–7), but we do not investigate it further in this paper because the identification is somewhat questionable.
3.1.3 Dust Continuum
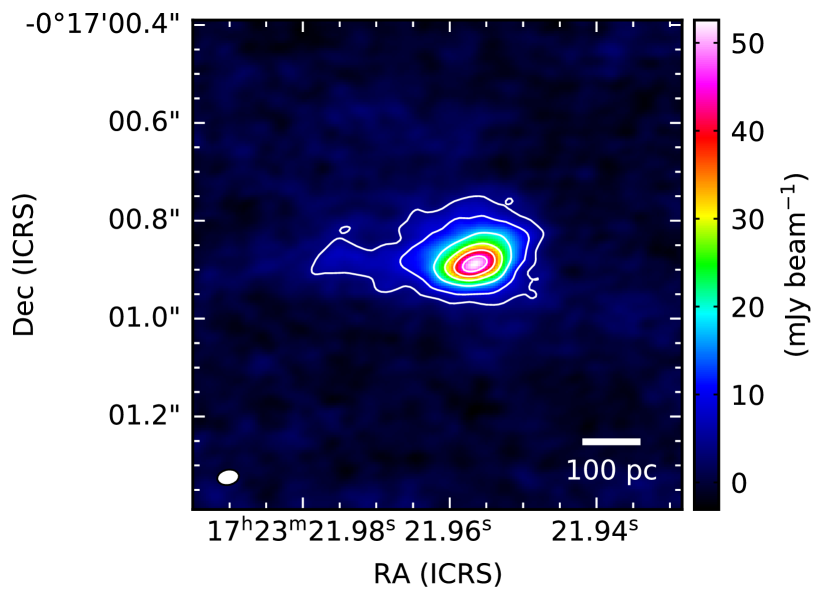
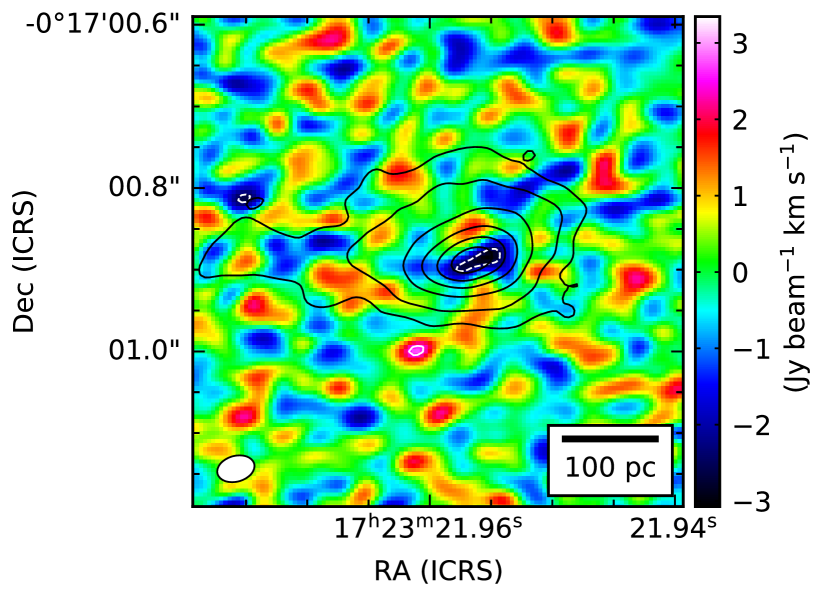
The image of the continuum emission at was obtained by averaging the line-free region of the continuum-unsubtracted data cube using the immoments task with moments=-1. Figure 2 shows the result. At this wavelength, the contribution of a radio jet, even if it exists, is minor. Therefore, we attribute the continuum entirely to the thermal emission from dust. The peak intensity of the continuum is 52.6 mJy , which corresponds to a brightness temperature of 106 K.666Brightness temperatures are expressed with the Rayleigh–Jeans approximation. The peak position is , which is close to the nuclear dynamical center determined by the kinematics of CO(2–1) observed with PdBI777Plateau de Bure interferometer. (05 resolution; García-Burillo et al., 2015). A faint elongation is observed to the east of the continuum map. Of the two stellar disks revealed by Medling et al. (2014), the western disk is brighter than the eastern one. We consider that our continuum peak and elongation correspond to the western and eastern disks, respectively. García-Burillo et al. (2015) suggest that the molecular outflow they observed is launched from the western nuclei and that an obscured AGN is a convincing driving agent for it. Thus, we regard our dust continuum peak as the location of the AGN hereafter. The flux density encompassed within the central 05 radius region is Jy. The error includes the systematic uncertainty in the flux calibration and is dominated by it. Meanwhile, the total flux density of IRAS 17208 at 436 µm can be estimated to be 1.29 Jy from a logarithmic interpolation between Herschel SPIRE photometric fluxes at 350 and 500 µm obtained with a much larger aperture size of 30″ (Pearson et al., 2016). This indicates that 50% of the galactic dust emission at this wavelength is concentrated in the nuclear region.
3.1.4 CO(=6–5)
The obtained line data cube of CO (6–5) is shown as channel maps in Appendix A (Figure 15). From that cube, an integrated intensity (moment 0) map was created by applying the ia.moment task. The used velocity range was 390 to 640 relative to . The result is presented in Figure 3 with the contours of the continuum map overlaid for comparison. A minor fraction of the CO flux in the most blueshifted end was not observed as shown in the upper panel of Figure 1. This is because the change in line-of-sight velocity due to rotation was too large for one spectral window. Assuming that the emission profile is symmetric, the missed fraction is estimated to be less than 2%. The brightest area in the map is shaped like the letter “C”, and the gap in it corresponds to the missed part (see also below for the velocity map). The integrated line flux within the central 05 radius region is Jy (i.e., W ). The error includes the systematic uncertainty in the flux calibration and is dominated by it. Our CO(6–5) flux accounts for 6213% of the total flux measured with the Herschel SPIRE spectrometer (Pearson et al., 2016), and this percentage is comparable with the recovered fraction of the continuum flux.
Figure 3 confirms that the CO(6–5) line is observed as absorption at the nucleus. It is only at the nucleus that CO (6–5) is detected as absorption in multiple consecutive velocity channels (Appendix A). We interpret that the bright dust emission from the AGN is being absorbed by the foreground gas in the surrounding obscuring structure. Given the high excitation level and wide FWHM (200 , Figure 1), this absorption does not seem to originate from cold molecular clouds in the host galaxy. Rose et al. (2020) reported CO(1–0) and CO(2–1) absorption against the bright AGN of Hydra A, resulting from at least 12 individual clouds, but their line widths were of the order of 4 only. Our result is noteworthy because, to the best of our knowledge, there is only one other example where a high- CO line has been detected in such broad and deep continuum absorption: in a recent high-resolution (70 pc) observation of Arp 220, which is a heavily obscured late-stage merger similar to IRAS 17208, CO(6–5) was detected as continuum absorption in consecutive velocity channels of a total range of 150 toward the two nuclei of the galaxy (Sakamoto et al., 2021). At the nucleus of the radio galaxy NGC 1052, Kameno et al. (2020) observed CO(3–2) and (2–1) in absorption. However, these lines are at much lower excitation levels, and their equivalent widths are 0.26 times smaller than those observed in our work. In Section 4.1, we attempt to reproduce the intensities of the CO(6–5) emission and absorption we observed in IRAS 17208 with the help of numerical simulations.
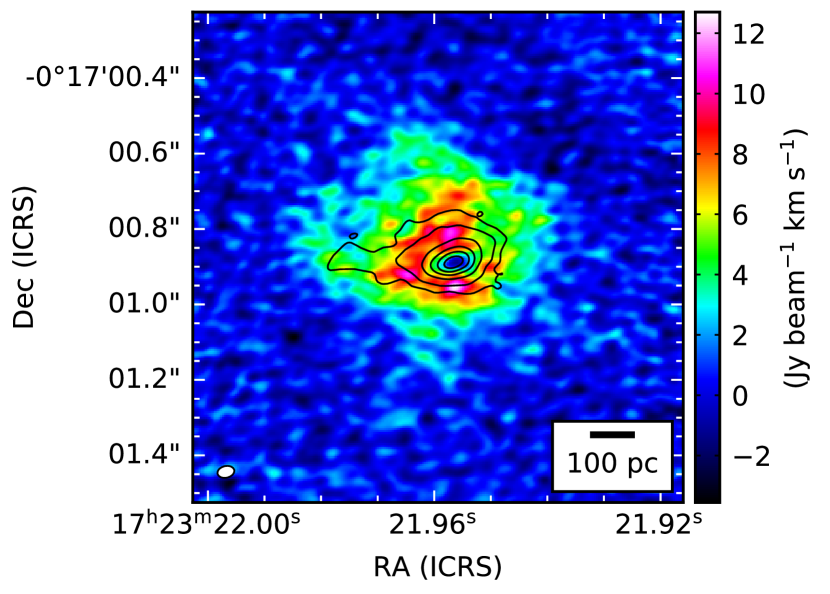
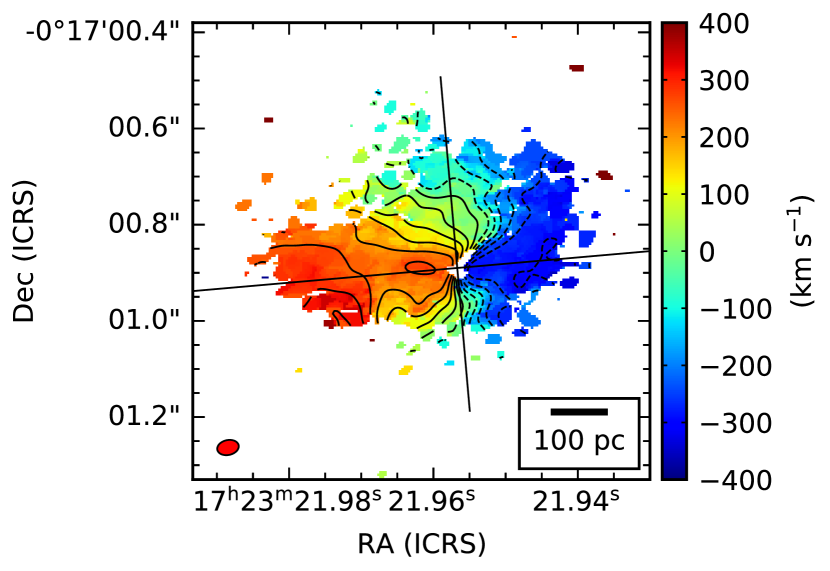
Figure 4 shows the CO(6–5) intensity-weighted mean velocity (moment 1) map. The overall velocity gradient is along the east–west direction, with a position angle of . This is roughly consistent with the CO(2–1) kinematic axis () observed by García-Burillo et al. (2015). The immediate vicinity of the nucleus, where the CO(6–5) line is in absorption, is masked because a 5- clipping was applied. The large-scale velocity gradient determined from the most red/blueshifted regions is at , probably reflecting the combination of the two overlapping nuclear disks (Section 5.4). The corresponding PV diagrams are presented in Appendix B.
3.1.5 CS(=14–13)
As shown in the lower panel of Figure 1, CS(14–13) is detected in absorption in the beam-sized nuclear spectrum. Figure 5 shows the intensity (moment 0) map of CS(14–13). This map confirms that the line was detected in absorption at the nucleus. The significance is relative to the rms noise of the blank sky signals. Given the coincidence between the peak positions of the line and continuum, we regard this absorption to be a real detection. We attempted to estimate the beam-deconvolved size of the absorption region by fitting a two-dimensional Gaussian using the imfit task, but it was found to be consistent with a point source and no lower limit on the size was obtained. We confirmed based on channel maps that, in the region away from the nucleus, CS(14–13) was not detected either in emission or in absorption. These results are referred to in the comparison with models in Section 4.1.
3.2 AKARI
3.2.1 Observations and Data Reduction
IRAS 17208 was observed twice with the AKARI Infrared Camera (IRC) in the post-cryogenic phase of the satellite. The observation IDs were 3370001.1 and 3370001.2, respectively, and the observation dates were 2009 Mar 10 and 11, respectively. In both the observations, the galaxy was acquired within the aperture named Np, and its light of wavelength 2.5–5.0 µm was dispersed with a germanium grism, resulting in a spectral resolution of 160 at the band center of the CO ro-vibrational transitions. Owing to the slitless spectroscopy used, the spatial resolution was limited by the size of the point spread function (PSF; ).
From each observation, a two-dimensional (2D) spectral image was extracted with the IRC spectroscopic Toolkit version 20181203 in the standard manner, that is, using the irc_specred command (Ohyama et al., 2007; Baba et al., 2016, 2019).
The extraction width to generate a one-dimensional (1D) spectrum was set to five pixels (73) to match the PSF size.
Several percent of the pixels in the extraction region turned out to be hot pixels.
However, this is common for observations during the post-cryogenic phase (Onaka et al., 2010).
We corrected for the flux missed by the hot pixels based on the assumption that the spatial profile within the extraction aperture is independent of wavelength.
First, the 2D image was integrated along the dispersion axis to obtain the spatial profile.
Next, at each wavelength, the missed flux was estimated from the flux properly measured at the valid pixels, the ratio expected from the profile, and the positions of the hot and valid pixels.
The uncertainty in this correction was estimated using a bootstrap method,888We generated the spatial profile times by randomly resampling the 2D image with replacement, and then, evaluated the standard deviation of the resulting correction factors. and then, propagated to the uncertainty in the flux density.
Each 1D spectrum was extracted using the plot_spec_with_image command.
To cover the CO absorption more widely, we turned on the no_wl_limit option, and recorded the flux density at wavelengths outside the nominal range (2.5–5.0 µm).
At wavelengths longer than 5.0 µm, because they are one octave beyond the shorter end of the spectrum, the first-order spectrum overlaps with the second-order spectrum.
To correct for this contamination, we turned on the NG_2nd_cal option, which decomposed and removed the contribution from the second-order spectrum as per the methods described by Baba et al. (2016, 2019).
The wavelength-dependent backgrounds were subtracted using the bg_sub option.
Based on the output of the plot_spec_with_image command, every four data points were binned by discarding the points of poor significance () to improve the overall S/N.
Finally, the two binned spectra, which were generated from the two observations, were averaged.
The final spectrum is shown in Figure 6a, where the absolute flux values are scaled as described in the next subsection.
The CO ro-vibrartional absorption band is clearly detected at 4.67 µm, and seen to have a substantial depth. The intrinsic lines associated with different rotational levels are not resolved because of insufficient spectral resolution, and the band is observed as a double branched profile that represents and . The peak-to-peak separation between the two branches is also significantly wide. Note that, at 4.65 and 4.69 µm, the H I Pf and 0–0 lines may be superposed on the spectrum. The spectrum also exhibits several emission (Br at 4.05 µm, Br at 2.62 µm, and PAH at 3.3 µm) and absorption features (CO2 gas or ice at 4.26 µm and H2O ice at 3.1 µm).
3.2.2 Continuum Normalization
The CO band is observed at the longer wavelength end of the AKARI spectrum. Therefore, to robustly determine a continuum level, we used a spectrum obtained with Spitzer/IRS similarly to Baba et al. (2018). A calibrated low-resolution spectrum with a wavelength range longer than 5.2 µm was obtained from the Combined Atlas of Sources with Spitzer IRS Spectra (CASSIS; Lebouteiller et al., 2011).999The Combined Atlas of Sources with Spitzer IRS Spectra (CASSIS) is a product of the IRS instrument team supported by NASA and JPL. CASSIS is supported by the “Programme National de Physique Stellaire” (PNPS) of CNRS/INSU co-funded by CEA and CNES and through the “Programme National Physique et Chimie du Milieu Interstellaire” (PCMI) of CNRS/INSU with INC/INP co-funded by CEA and CNES. The spectral segments obtained with the SL and LL slits (shorter and longer than 14 µm, respectively) were stitched together by scaling them appropriately, such that they smoothly connected with each other. To mitigate the difference between the aperture sizes of AKARI and Spitzer, the AKARI spectrum was rescaled to match the WISE and flux densities, and the Spitzer spectrum was rescaled to match the WISE and flux densities. The results of profile-fit photometry from the AllWISE catalog were used; the PSF size of WISE (; Wright et al., 2010) is larger than the nucleus. The final merged spectrum is shown in Figure 6a.
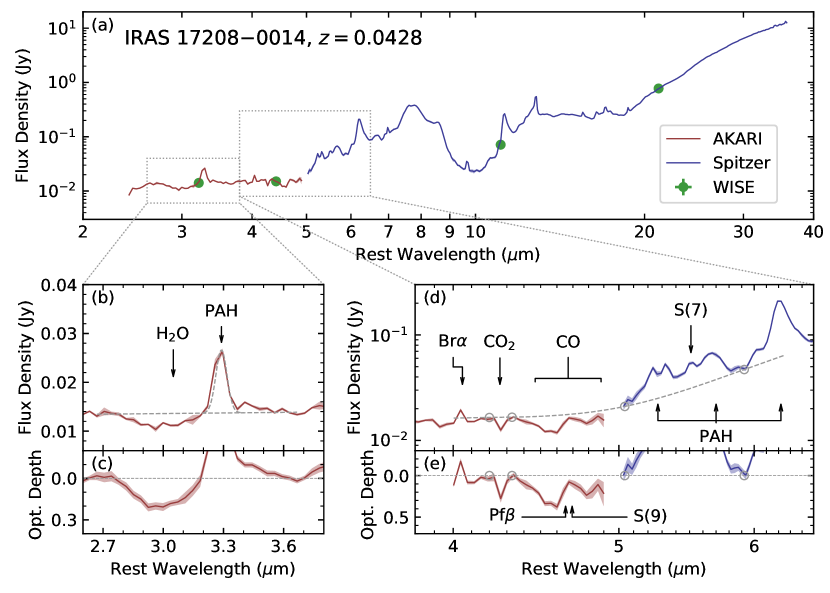
We defined the continuum level as a cubic spline curve that passes through four pivots: two about the CO2 absorption at 4.26 µm one before the PAH emission at 5.27 µm and the last after the PAH emission at 5.70 µm (Smith et al., 2007). The adopted pivots and continuum are shown in Figure 6d, and the resulting normalized spectrum is presented in Figure 6e. We observe that the optical depth of the CO ro-vibrational band reaches 0.36 after being blurred with the AKARI resolution. We analyze this spectrum in more detail in Section 4.2.
3.2.3 Other Spectral Features
In addition to the CO band, we measured five more quantities to evaluate the AGN/starburst diagnostics proposed by Imanishi et al. (2008, 2010) and Inami et al. (2018). These are: (1) the equivalent width of the 3.3 µm PAH emission (); (2) the optical depth of 3.1 µm H2O ice (); (3) the optical depth of 3.4 µm aliphatic carbon absorption (); (4) the continuum color between 2.8 and 4.3 µm represented by the flux ratio (); and (5) that represented by the power-law slope (; ).
The strength of the PAH emission was measured in the same manner as Inami et al. (2018), i.e., by fitting a Gaussian and linear baseline to the spectrum (see Figure 6b). Note that, at this wavelength range, the spectral shape is complex, as they include the 3.4 µm PAH sub-feature, H2O absorption, and aliphatic carbon absorption, which were carefully analyzed by Doi et al. (2019). In this work, we did not analyze these features in detail, but instead, employed a simpler approach to maintain consistency with Inami et al. (2018). The wavelength ranges used for fitting the linear baseline were 2.65–2.75 µm and 3.55–3.70 µm, which correspond to the short wavelength tail of the H2O absorption and the long wavelength tail of the PAH sub-feature and aliphatic carbon absorption, respectively (Doi et al., 2019). The Gaussian was fitted in the range of 3.2–3.4 µm, thus avoiding the PAH sub-feature. Finally, we obtained , which gives a higher S/N than Inami et al. (2018) owing to our rigorous data reduction. We estimated and based on the same baseline by smoothing the optical depth spectrum with a 0.03-µm boxcar kernel (see Figure 6c), which yielded and . The ratio was calculated to be ; based on the assumption of a power-law continuum, the slope was estimated to be . We use these results in Section 5.3 for further analysis.
4 Comparison with Theoretical Models
In this section, we compare the observational results from ALMA and AKARI with the theoretical models to estimate the properties of the gas observed in the sub-mm and near-IR wavelengths.
4.1 ALMA
To constrain the properties of the gas observed with ALMA, we compared the observed brightness of CO(=6–5) with non-LTE radiative transfer simulations using the RADEX code (van der Tak et al., 2007). RADEX solves statistical equilibrium problems, and determines optical depths based on the escape probability approximation, assuming a homogeneous one-phase medium of a certain geometry. We first discuss the region detected in emission, followed by that detected in absorption. We also compare the absorption depth of CS(=14–13) with that of CO(=6–5).
4.1.1 Emission
The brightest part of the CO(6–5) emission lies approximately between 005–010 (40–80 pc) from the nucleus (Figure 3). The integrated intensity within the annulus is on average 7.7 Jy , with a standard deviation of 24% to it. The FWHM of the line is typically 300 and yields a mean brightness temperature of K. We compared this value with that obtained from our RADEX simulations.
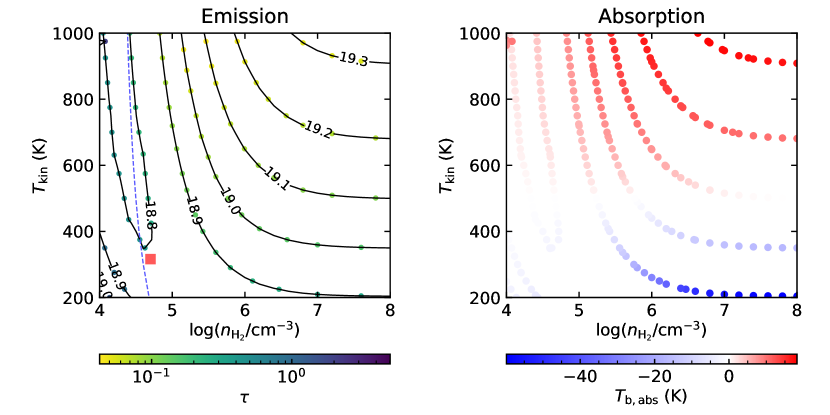
We assumed a homogeneous gas cloud with number density , kinetic temperature , and column density , and calculated the brightness by varying these three parameters. Given the high fraction of our ALMA flux compared to the Herschel flux (60%, Section 3.1.4), the gas detected with the former is expected to have similar properties to the gas observed with the latter. Hence, we decided the parameter space for the RADEX calculation by referring to a result from Herschel. Kamenetzky et al. (2014) modeled the CO spectral line energy distribution (SLED) acquired with ground-based single-dish telescopes (for , 2, 3) and Herschel (for and higher) using RADEX, and found that the CO(6–5) flux is dominated by a warm component that has and .101010Throughout this paper, the logarithms of number density, temperature, and column density are given in units of , K, and , respectively. In this study, we expect that the gas interferometrically detected with ALMA is likely to be denser and warmer than the warm component detected by Kamenetzky et al. (2014). Therefore, we varied in the range of and in the range of 200–1000 K, and searched for the value of required to attain the observed . We assumed a static slab geometry, used the cosmic microwave background as the source of background radiation ( K), and fixed the FWHM of the line at 300 . For our grid calculations, we used pyradex, which is a Python wrapper for RADEX.
The left panel of Figure 7 presents the results of our emission simulations. It indicates that at least is required to achieve K. This lower limit is found near the critical density (; Yang et al., 2010), which is conducive to both radiative and collisional excitations, and corresponds to an efficiently populated upper level. Collisional transitions become dominant as increases. The CO population moves to levels higher than , owing to a much higher than the corresponding energy level ( K). The brightness for a given thus decreases; that is, a higher is needed to attain the same brightness. In the high- limit, the CO population is no longer density-dependent, and the contours become horizontal. Thus, the figure suggests that does not exceed 19.3, even when a very high kinetic temperature, K, is assumed. Hence, is constrained by 0.5 dex. Assuming an abundance ratio of , this corresponds to , suggesting the existence of a considerable amount of gas in the circumnuclear region. Hereafter, we use as a fiducial value, unless otherwise noted. At lower than , which is also lower than the density obtained by Kamenetzky et al. (2014), collisional excitation is ineffective. The excitation temperature between levels and 5 is much lower than the kinetic temperature, and the source function is weak. Thus, a high optical depth is required. Unfortunately, we cannot further constrain the parameters because, currently, there are no available observations of other excitation levels at a comparable or better angular resolution.
4.1.2 Absorption
The nuclear ( pc) spectrum at the dust peak (Figure 1, lower panel) shows that the CO (6–5) absorption has a peak of 18 mJy (corresponding to 36 K) and a FWHM of 200 . First, we examined whether this observed absorption strength can be consistently explained by the parameters obtained from the emission calculations.
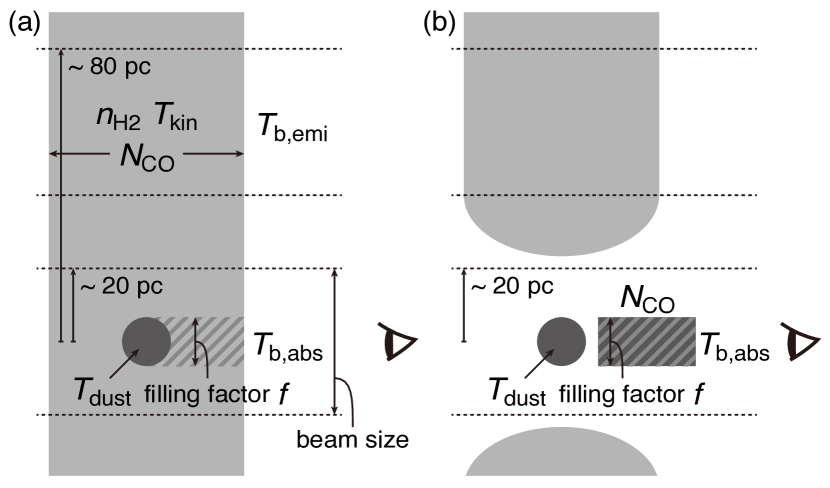
Figure 8(a) illustrates the geometry assumed here (Case (a)). A dust continuum source with temperature is buried in the gas cloud of , , and obtained in the previous subsection. Since the velocity map (Figure 4) showed a rotation pattern, we assumed that the cloud is an inclined disk. The size of the continuum source is considered to be smaller than the observation beam (30 pc). This is because is now thought to be higher than 320 K suggested from Herschel (Kamenetzky et al., 2014), and if were equal to the observed brightness temperature (106 K), the gas would not be observed in absorption. Therefore, it is expected that the intrinsic is higher and that the continuum brightness is diluted from due to the beam filling factor of the source being smaller than unity. Even without the Herschel results, the detection of CS(14–13) in absorption toward the nucleus supports this prediction. To explain the CS absorption depth while keeping the CS-to-CO abundance ratio in a reasonable range (see below), the level of CS must be occupied with a high percentage. The level energy of CS at is 214 K, and the gas should be as warm as or warmer than this temperature. In order for the line to be absorbed, there must be a hotter background source behind it. From the 2D Gaussian fitting to the CS absorption region, it was determined to be a point source (Section 3.1.5). This also supports . Since no upper limit on the size was obtained from the fitting, we did not assume a specific value for (and hence ) in the following comparisons.
We calculated the CO absorption brightness using RADEX from each set of parameters obtained from the emission (Figure 7, left panel). The temperature of the background radiation, , was set to 500 K as an initial guess. In this case, the beam filling factor should be 0.2 based on the ratio to the continuum peak brightness (106 K). In addition, the column density was multiplied by 0.5 to account only for the part in front of the continuum source, and the velocity FWHM was changed to 200 as measured in the nuclear spectrum (Figure 1, lower panel).
The obtained , corresponding to each point in the left panel of Figure 7, is shown using a color scale in the right panel of the same figure. Note that the effect of the beam filling factor is not included here. Note also that the CO (6–5) becomes an absorption line when K. The minimum value of ( K) is obtained in the collision-dominated region. This value is deeper than the observation. In practice, however, the absolute value of that can be observed should be smaller, owing to the effect of . If only a simple dilution is assumed, then needs to be multiplied by to yield 12 K. If the contribution of the emission in the region offset from the continuum source is included, then is averaged with weighted by to yield 26 K. None of these temperatures match the observed absorption depth. This is true even if a different is used.
The above discussion on the intensities of emission and absorption is based on the assumption of K suggested from Herschel (Kamenetzky et al., 2014) and the implication of the CS(14–13) detection. If based solely on our observations of CO(6–-5), the parameters K (), K, , and can explain the observed and simultaneously. However, if we adopt K (Herschel SLED warm component) or K (CS energy level), then there is no possible solution.
These results demonstrate that the Case (a) is too simplified to explain the observed emission and absorption features. One natural interpretation is that the gas in the central beam ( pc) is more concentrated than in the annular region (–80 pc).
Next, we attempted to constrain the column density in the central region by comparing only the nuclear absorption with the RADEX calculation, without considering the consistency with the CO(6–5) emission in the off-nuclear region. Figure 8(b) shows the geometry assumed here (Case (b)). We first assumed that only a gas cloud of approximately the same size as the continuum source is in the beam. We also considered that the absorption of CO(6–5) and CS(14–13) occur in this same cloud. Based on the critical density111111Calculated in the optically thin limit at 200 K using and quoted from LAMDA (Schöier et al., 2005). and lower level energy of CS(14–13), the number density and kinetic temperature of the gas were fixed at and K, respectively. The solid blue line in Figure 9 shows the absorption intensity calculated as a function of the column density . The temperature of the background source is set to K, and beam dilution () is also taken into account. Under this condition, the observed intensity of K is reached at . Here, since the compensation for the absorption due to emission from gas not in front of the continuum source is ignored, this column density gives a lower limit.
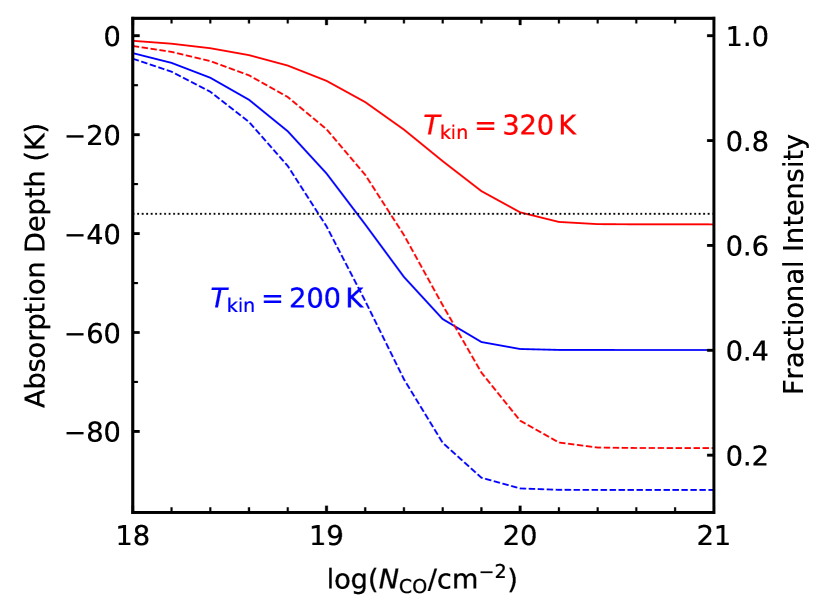
This lower limit hardly depends on the assumed because it is more than two orders of magnitude higher than the critical density of CO(6–5). When is increased (e.g., 320 K suggested by Kamenetzky et al. 2014), the CO level (83 K) becomes less populated, so a larger column density is required (Figure 9, red solid line). On the other hand, when the temperature of the background light source is higher, the absorption becomes deeper efficiently, and the required column density becomes smaller (dashed lines). If is raised to the dust sublimation temperature of 1500 K, for K and 320 K, and 19.3, respectively.
In summary, from the spectrum toward the nucleus, the column density of the dense gas can be constrained to be . Since the constraint in the off-nucleus region is –19.3, it is not proved by these alone that the nuclear component is in excess in terms of column density. However, if we make the assumption that at the center is higher than outside, then for K, does not exceed 19.0 in the off-nuclear region (Figure 7, left), while it is higher than 19.3 in the center. This results in an excess of 0.3 dex, which is larger than the scatter of the off-nuclear emission intensities (24%). Unfortunately, it is difficult at present to more tightly constrain the column density in front of the sub-mm continuum source. Further observations in other bands and/or higher resolution are essential to determine the gas temperature and the intrinsic background brightness.
The constrained toward the nucleus can be converted to the hydrogen column density of . The implication of this lower limit is discussed in Section 5.1.
In terms of CS(14–13), the depth of absorption in the nuclear spectrum is 12 mJy (24 K). From this, we estimated the column density of CS as in Figure 9 for CO. As a result, and 16.8 were obtained for and 320 K, respectively, at sufficiently high number densities. These column densities are 2.5 orders of magnitude smaller than those obtained for CO. In other words, the depths of absorption of CO and CS can be explained by the abundance ratio of . This abundance is not in conflict with that predicted for high-density XDR or high-density and low-radiation-field photodissociation region (PDR). In the latter case, however, the obtained column density cannot be reproduced (see Section 5.1).
In the SLED analysis of IRAS 17208 by Kamenetzky et al. (2014), the cool component has , , . Owing to its large column density, this component would be admittedly able to explain the depth of CO(6–5) if it were distributed in front of the background source. However, it is too tenuous and cold to explain the depth of CS(14–13), whose critical density and energy level are much higher than those of CO(6–5). We found that if this absorption were to be reproduced by the cool component, an abnormally high abundance would be required. Conversely, if CS(14–13) is originated from warm gas, then the absorption of CO, which is more abundant, should also arise from the same gas. Therefore, we attribute the CO(6–5) and CS(14–13) absorption entirely to the warm gas.
4.2 AKARI
In this subsection, we quantify the properties of the gas responsible for the near-IR CO ro-vibrational absorption. The band profile observed with AKARI is fitted with a gas model, which we discuss in detail here.
4.2.1 Subtraction of Pf and
The H I Pf and 0–0 emission lines may be overlapping in the CO band. Thus, we first estimated and then subtracted the fluxes of these lines from the CO band spectrum (Figure 6e). The Pf and emission lines are considered to originate from star-forming regions outside the AGN: H II and photodissociation regions, respectively. The flux of Pf was converted from that of Br at 4.05 µm, based on the assumption of Case B of Baker & Menzel (1938). The Br flux was measured to be W , and the Pf/Br ratio in Case B is 0.20 for and K (Storey & Hummer, 1995). The Pf flux was thus calculated to be W . The flux of was extrapolated from the fluxes of at 9.66 µm and at 5.51 µm assuming level populations according to LTE. The and fluxes were measured to be W and W , respectively, yielding an excitation temperature of K. From these fluxes and temperature, the flux was derived to be W . During the subtraction of the line fluxes, the Gaussian profiles of the width limited by the spectral resolution were assumed, which were then binned as in the observed spectrum. The change in the flux density owing to this subtraction is at most 6%.
4.2.2 Comparison with an LTE Gas Model
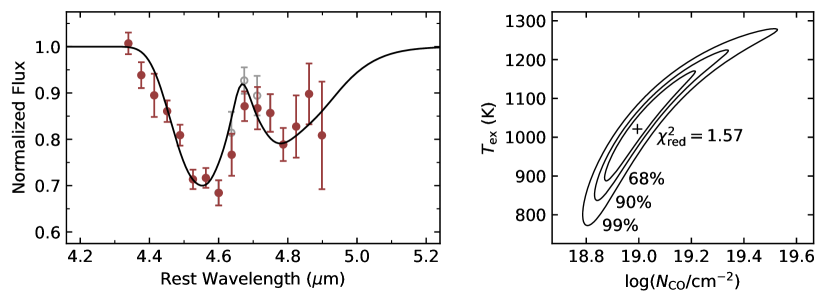
We analyzed the CO absorption observed with AKARI by fitting it with the plane parallel LTE gas model developed by Cami (2002), following the way of Baba et al. (2018). In Baba et al. (2018), a one-temperature homogeneous CO gas was assumed, and it was fitted with three free parameters: total column density , excitation temperature , and velocity turbulence . Here, is equivalent to the kinetic temperature . The S/N of the spectrum in the present study was not sufficient to constrain all three parameters. Thus, we fixed to be the width of the CO(6–5) absorption line detected in the ALMA observations. With this , the modeled spectrum was intrinsically spiky with the different rotational lines clearly separated, but during the fitting, the spectrum was blurred by the resolution of IRC. We adopted 1500 K blackbody radiation as the background continuum to represent the thermal emission from the dust sublimation layer around the nucleus, as in Baba et al. (2018). Note that this background temperature is higher than that adopted for the comparison of the RADEX calculations with the ALMA data (see Section 4.1.2). This is owing to the difference in the wavelength regimes in the two cases, as the near-IR continuum source should be smaller and hotter than the sub-mm source. Here, the area covering fraction of the absorber to the continuum source was assumed to be unity. We performed non-linear least-squares minimization based on the Levenberg–Marquardt algorithm, using the IDL package MPFIT (Markwardt, 2009).
The minimum chi-square value was obtained at and K, with a reduced chi-square of . The best-fitted gas model is shown in Figure 10 along with the two-parameter confidence regions. The observed absorption spectrum is fitted fairly well by the single-component gas model. There is a degeneracy between the two parameters. This is because, as the gas temperature approaches the background temperature, the emission from the gas becomes more significant. Thus, a higher column density is required to absorb the continuum significantly, to compensate for the gas emission and maintain the apparent absorption depth. Despite this degeneracy, it is suggested that the CO gas has . We discuss the origin of this column density in Section 5.1 by comparing it with the ALMA results.
5 Discussion
5.1 Gas Distribution
The comparison between our ALMA observations and RADEX simulations shows that the observed emission and absorption intensities cannot be reproduced simultaneously by a simple uniform gas cloud. One of the primary explanations for the observations is that, within the central beam (30 pc), there is a concentrated gas distribution that contributes to the absorption more than that expected from the brightness of the immediate surrounding region. The column density toward the nucleus has an excess relative to the surroundings under the assumption of a higher kinetic temperature at the center.
It is natural to consider that a dense obscuring structure distinct from the circumnuclear medium exists in the central 10 pc scale region. Aalto et al. (2015b) argued that, based on the bright HCN-vib(4–3) emission in IRAS 17208, there is a small core ( pc) that is opaque in the mid-IR having a 14 µm brightness temperature high enough to excite HCN molecules vibrationally. In the prototypical Seyfert 2 galaxy NGC 1068, an AGN torus has been imaged in spatially resolved observations, with a size of 5 pc in HCN and HCO+ lines (Imanishi et al., 2018, 2020) and 30 pc in CO lines (García-Burillo et al., 2019). Thus, it is quite possible that a compact absorber is buried within the beam size of our observations.
The molecular gas column density toward the nucleus obtained in the sub-mm region, , is a lower limit and does not contradict to that required from the Compton thickness of the AGN (). In addition, the latter includes neutral gas in the dust-free regions (Merloni et al., 2014; Davies et al., 2015; Ruffa et al., 2018; Ichikawa et al., 2019; Kawakatu et al., 2020; Tanimoto et al., 2020). Ruffa et al. (2018) studied the obscured ULIRG IRAS F001837111, and found that the molecular column density derived from CO(1–0) is 12% of the cold gas column density estimated from the X-ray spectral fitting. Based on a comparison between the fractions of Seyfert 2 galaxies and X-ray absorbed AGNs in the Swift-BAT AGN survey, Davies et al. (2015) argued that a neutral gas region begins to form inside the dust sublimation layer when the X-ray luminosity at 14–195 keV () exceeds . Following the relation (Winter et al., 2012), this threshold luminosity corresponds to an AGN bolometric luminosity of . The AGN luminosity of IRAS 17208 was suggested by García-Burillo et al. (2015) to be , which lies in the high-luminosity regime according to Davies et al. (2015). Therefore, a significant fraction of the X-ray absorbing column may be in the neutral phase, although IRAS 17208 is not a typical Seyfert galaxy, and it is not much evident whether its obscurer has the same structure. To summarize, the gas observed in the CO(6–5) absorption is probably not dominant in the total obscuring column density toward the AGN.
The abundance of CO is also a major uncertainty. Wada et al. (2016, 2018) performed numerical simulations of the non-equilibrium chemistry in the XDR around AGNs, by considering the Seyfert 2 Circinus galaxy as an example. Their model indicated that, at high column densities (), the abundance ratio [CO]/[] has a large point-to-point scatter in the range of –. If a lower abundance is adopted, the obtained by by our ALMA observation alone is sufficient to make the AGN CT without including neutral gas. It has been observationally shown that CO dissociates immediately around an AGN, as seen in both the Circinus galaxy (Izumi et al., 2018) and NGC 7469 (Izumi et al., 2020), based on the observed high [C I]/CO ratios.
The comparison of our AKARI spectrum and gas models shows that the observed CO ro-vibrational absorption band can be well represented by the LTE condition with a high column density () and a high temperature (). Unlike the CO(6–5) line, this band contains multiple rotational levels. Hence, the column density and temperature can be simultaneously obtained. The obtained is a lower limit because the area covering fraction of the absorber could be smaller than unity, and the 5 µm continuum flux could contain not only the AGN contribution but also the star-formation contribution. Although the gas number density is not directly obtained from the model fitting, to establish LTE up to ,121212The corresponding lines, and , appear at 4.46 and 4.97 µm, respectively. which corresponds to the observed width of the band, it must be higher than the critical density for these levels (; Yang et al., 2010).
We summarize the gas properties near the nucleus estimated from the absorption in the sub-mm and near-IR regions in Table 1. Both the sub-mm and near-IR observations suggest similar column and volume densities, but the temperature is higher in the near-IR. We interpret this result to mean that the region observed in the near-IR is in the nuclear direction, as in the sub-mm, but with a narrower pencil beam than in the sub-mm, containing a hotter region closer to the nucleus. Figure 11 explains this interpretation. The near-IR continuum should be dominated by a hotter and more compact region than in the sub-mm case. Reflecting the difference in the temperature and size of the background sources, the near-IR absorption probes deeper into the hotter regions than the sub-mm one. Here, given that the near-IR light reaches the outside, the concentrated component is considered to be porous or have gaps. This interpretation is consistent with the fact that the ratio of column density to number density in Table 1 is much smaller than the spatial scale we are considering. Since the line of sight to the near-IR source also crosses the outer region, it may be more accurate to include multiple temperature components in the fitting of the CO ro-vibrational absorption spectrum. However, doing it with the current AKARI data is difficult due to insufficient wavelength resolution (). Such studies will be possible with the James Webb Space Telescope (JWST).
| sub-mm | near-IR | |
|---|---|---|
| column density | ||
| Temperature | K | K |
| Density |
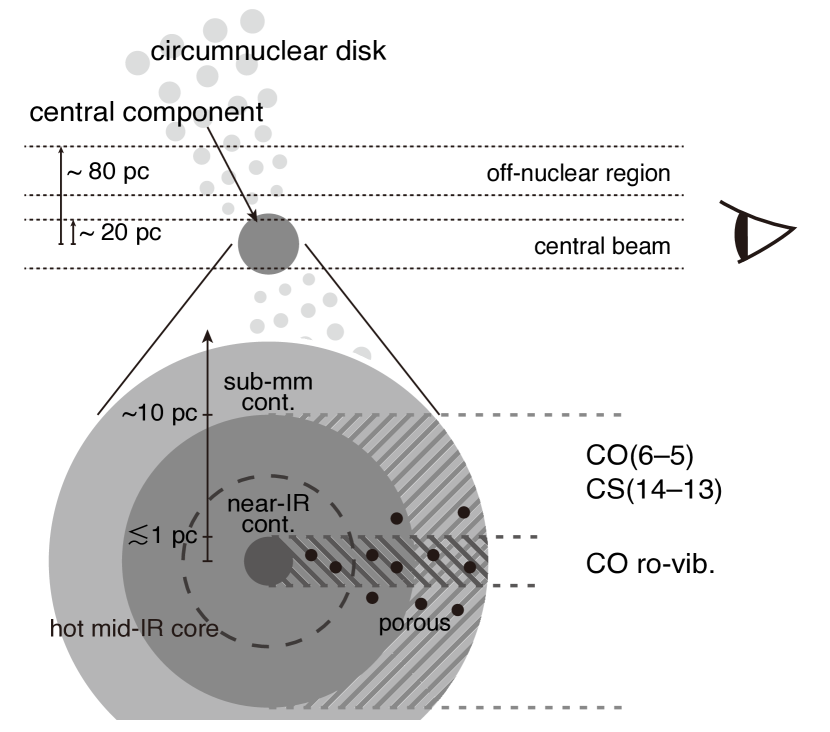
The central component, where the sub-mm CO(6–5) and CS(14–13) absorption and near-IR CO ro-vibrational absorption occur, may correspond to the hot mid-IR core that is responsible for HCN-vib emission. The representative scale of the hot mid-IR core is expected to be between the sizes of the sub-mm and near-IR continuum sources according to the order of the wavelengths. On the other hand, the gas observed in the off-nuclear region in the CO(6–5) emission shows a rotational velocity pattern and corresponds to a circumnuclear disk (hundreds pc radius). Here, the ratio of the column density to the number density, shown in the left panel of Figure 7, yields a physical thickness of 1 pc, which is considerably shorter than the orbital radius. This implies that the disk is highly clumpy.
The indicated column density is large and the temperature is high, from both the sub-mm and near-IR observations. The heating source that can most naturally explain such warm gas with a large column density is X-ray photons (i.e., XDRs), which have a high penetrating power compared to UV photons (PDRs) or shock waves, as discussed by Baba et al. (2018). If UV photons or shock waves were the heating source, then the gas temperature would decrease to K before reaching . If the gas were smoothly distributed, then at most points the column density to the nearest OB star would be smaller than that to the AGN, so the stellar contribution to the heating could be large. However, the gas is now considered to consist of clumps with large column densities. In such a highly clumpy gas, heating by stars outside the clumps is unlikely to be effective. Gas heating by cosmic rays works effectively only at moderate densities (; Meijerink et al., 2006). In the SLED analysis of Kamenetzky et al. (2014), similar high temperatures ( K) with even larger column densities () were found for the warm component in the starburst nuclei of NGC 253 and M83. However, the number densities in these galaxies are in the order of and more than three orders of magnitude lower than the dense gas we observed through absorption. Thus, UV photons plus cosmic rays from supernovae seem to be unlikely as a heating source. From the high probability of X-ray heating, the absorption region is expected to be located in the XDR around the AGN. Meijerink & Spaans (2005) has constructed models of chemistry in XDR. The abundance ratio found in Section 4.1.2 is consistent with the predictions of their high-density cases. Note that Meijerink & Spaans (2005) has modeled the chemistry of PDRs as well, and the abundance can also be explained by their high-density and low-radiation-field PDR. In this case, however, again, the large column densities we obtained are not reproducible.
At the end of Section 4.1.2, we argue that the sub-mm absorption in the nuclear spectrum is not due to the cool component suggested from the SLED (Kamenetzky et al., 2014) and that such cold gas is not distributed in front of the dust continuum source. On the other hand, 05-beam observations by García-Burillo et al. (2015) show that CO(2–1), which should be dominated by cold gas, has a strong peak at the center. This fact is seemingly inconsistent with the above idea. However, the FWHM of the CO(2–1) peak is 1″ (800 pc), which is 10 times larger than the range we are discussing. It is likely that CO(2–1) is intrinsically distributed non-uniformly within the peak and is not much present at the position of the dust source.
5.2 AGN contribution fraction
The contribution fraction of the AGN in IRAS 17208 is controversial, as mentioned in Section 2. González-Martín et al. (2009) identified IRAS 17208 as a CT AGN candidate based on X-ray observations, but their estimate of the hard X-ray luminosity after obscuration correction accounts for only of the bolometric luminosity. On the other hand, García-Burillo et al. (2015) proposed based on the observation of the molecular outflow. As for the contribution at mid-IR wavelengths, has been reported from spectral diagnostics (Alonso-Herrero et al., 2016; Leja et al., 2018). Note that the stellar contribution to the luminosity is thought to arise from the circum-nuclear scale (100 pc, Section 5.4).
The near-IR CO absorption we observed is thought to be imprinted in the AGN-origin background. The normalized spectrum (Figure 10) shows that the depth of the absorption is up to 30%. If the star-forming component of the continuum is more than 70%, the absorption will not reach this depth even if it is saturated. Therefore, we propose an AGN fraction at 4–5 µm of . This reasonably large contribution is not straightforwardly in agreement with the estimate from X-rays, but we speculate that this may be because the X-ray luminosity is not accurately estimated due to the large uncertainties in the obscuration correction. In addition to this, the AGN fraction at 4–5 µm can be much higher than the AGN bolometric fraction because AGN-heated hot dust emission becomes very bright at these wavelengths. Risaliti et al. (2010) argued that the ratio of 4 µm to the total luminosity is 100 times higher in AGNs than in starbursts and that, if AGN is present, it dominates the 4-µm emission in most cases, even when its contribution to the bolometric luminosity is tiny. Thus, although the AGN bolometric fraction may be low in IRAS 17208, we can reasonably assume that the CO rotational vibrational absorption occurs against the AGN component.
5.3 Properties of the Hot Core
As explained in Section 2, IRAS 17208 is a late-stage merger whose nuclear activity is not well understood. Some studies have classified this galaxy to be starburst-dominated, while others, particularly IR studies, have claimed a significant contribution from a deeply buried AGN. To resolve this issue, we compared the indicators obtained from the AKARI spectrum (see Section 3.2.3) with the diagnostics from other studies. The 3.3 µm PAH emission is excited by UV photons, and thus, is an indicator of the star-formation activity. If thermal emission from hot dust heated by the AGN dominates the near-IR continuum, then the PAH emission is diluted, which decreases the and turns the color red. If the AGN is buried in dust, then its contribution is more suppressed compared to that of the foreground star-forming regions, in which case the is not much affected. However, in this case, the color remains red, and because the energy source is more centrally concentrated than dust, the ice and dust absorption features become deeper than what can be achieved with a mixed dust and source geometry (Imanishi & Maloney, 2003; Imanishi et al., 2006a). Based on this logic, , , , and the continuum color have been used as indicators of an (obscured) AGN.
Inami et al. (2018) analyzed the AKARI spectra of local (U)LIRGs, and proposed a classification scheme that uses and : for starbursts; and for AGNs; and and for composites. The authors found and for IRAS 17208, and thus, classified the galaxy to be a composite source. However, the AKARI spectrum they used was noisy, suffering from hot pixels. In this study, we carefully reduced the AKARI data to correct for the hot pixels (see Section 3.2.1), and obtained and . With these updated values, IRAS 17208 falls on the boundary between the starburst- and AGN-dominated domains.
The criterion proposed by Imanishi et al. (2008, 2010) on , which is indicative of a luminous AGN, is stricter than that proposed by Inami et al. (2018), namely, . Therefore, IRAS 17208 fails to satisfy the criterion of Imanishi et al. (2008, 2010). The authors also suggested that , , and can be used as a signature of an obscured AGN. However, none of these criteria are satisfied, as in this work, we measured , , and .
Thus, the near-IR parameters measured in this work, , , , and (or ), do not provide a clear sign of an (obscured) AGN, in contrast to the moderate AGN fractions suggested in the mid-IR (Section 5.2). We interpret the lack of AGN signatures as a result of AGN emission being severely attenuated at 2.5–4 µm due to a large amount of dusty gas and being overwhelmed by the stellar contribution. Ichikawa et al. (2014) performed spectral decomposition for nearby IR galaxies by using AKARI spectra. For the obscured AGNs with in their sample (namely, IRAS 104944424, IRAS 170285817, MCG 08-23-097, and Zw 453.062),131313We exclude IRAS F073532903 because of its large uncertainty in . the AGN fraction at 2.5–4 µm is in the range of .141414We calculated and from the fluxes and temperatures of the stellar, H II, and dust blackbody components, along with the flux of the 3.3 µm emission. Therefore, it is implied that of IRAS 17208 would be smaller than these galaxies (5%). Note that this does not contradict the fraction at 4–5 µm we determined from the CO band (, Section 5.2). This is because rapidly increases at longer wavelengths owing to the steepness of the extinction curve and the AGN-heated dust emission. In fact, the AGN fraction of the obscured AGNs in Ichikawa et al. (2014) in the 4–5 µm range is as high as . From the AGN fractions in the two ranges and the corresponding observed fluxes of the continuum (Figure 6), the slope of the AGN spectral energy distribution (SED) in IRAS 17208 can be roughly estimated to be around these wavelengths, where . In the SED models of González-Alfonso & Sakamoto (2019), calculated for an AGN buried in a spherically distributed medium that represents a hot mid-IR core, the slope at 4 µm is as steep as with a column density of , which is consistent with the column obtained from our observations.
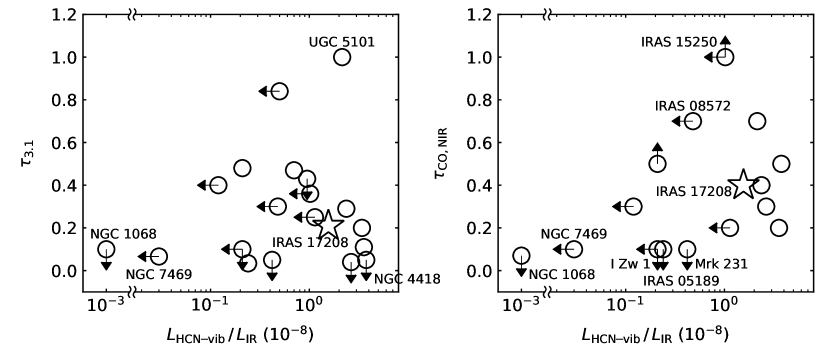
Low and high may be common characteristics of heavily obscured galactic nuclei that exhibit bright HCN-vib emission. We compare the HCN-vib line luminosity () in the literature (Falstad et al. 2019 and references therein; Imanishi et al. 2020), with these two optical depths. The collected values are tabulated in Table 2, and displayed in Figure 12. Note that the HCN-vib sample is inhomogeneous probably not without selection bias and that the presence of AGN is not definite in some galaxies. It can be seen that, when normalized by is brighter than , which is the threshold as a CON adopted in Falstad et al. (2019),151515Note that a revised criterion for CON using HCN-vib surface brightness has been proposed by Falstad et al. (2021). We use a convenient method here. is lower than 0.3 except for UGC 5101, and always exceeds 0.2. Alternatively, when normalized by is fainter, some galaxies have higher and/or insignificant . These results imply that, in extreme cases, the signatures of an obscured AGN are rarely observed in 2.5–4 µm, even if it exists (e.g., the Seyfert 2 galaxy NGC 4418). These results also strengthen the interpretation that the near-IR CO ro-vibrational absorption takes place in the hot mid-IR core, which is responsible for the HCN-vib emission and CO(6–5) absorption observed in this study.
Interestingly, is high in HCN-vib bright galaxies but shows diverse values in faint galaxies, even in obscured ones, as indicated by non-detections in archetypical type-2 AGNs (NGC 1068 and IRAS 051892524) and detections in LINER-like obscured AGNs (IRAS 085723915 and IRAS 152503609). This may be due to a geometrical effect of the obscuring structure, which is illustrated in Figure 13. First, in HCN-vib luminous systems, the obscuring medium probably covers almost all the solid angles such that the mid-IR radiation field, which is responsible for the HCN pumping, is enhanced by the “greenhouse effect” (González-Alfonso & Sakamoto, 2019). Because the covering factor is extemely close to unity, the CO absorption would be detected regardless of the direction of the line of sight (left panel of Figure 13). Second, if HCN-vib is weak in obscured AGNs, the obscuring medium is likely far from spherical. For example, disturbed or toroidal morphologies could appear before the hot core is completely formed or after it is disrupted by the onset of AGN winds. The small covering factor decreases the occurrence rate of the CO absorption (right panel of Figure 13). The presence/absence of CO absorption is perhaps related to the extent to which the nuclear obscuring structure is anisotropic or disturbed.
Again, we consider that the deep and broad CO ro-vibrational absorption probes the gas in the XDR around the AGN. This is because high along with high can be best explained by X-ray heating. In addition, an area covering fraction close to unity is indicative of an absorbing medium lying just in front of the background continuum source, rather than being distributed randomly and away from the source. Note that IRAS 17208 is a late-stage merger that has an outflow that is probably AGN-driven (García-Burillo et al., 2015). Thus, it may be possible to trace the state of a critical phase in the merger evolutionary scenario with the CO band, where the SMBH rapidly grows and the AGN feedback becomes effective. To investigate the motion of the CO gas, we first have to determine the blueshift with respect to the systemic velocity. Consequently, it is important to resolve the different lines with a resolution of . This type of observations will be possible with JWST.
| Object | Ref. | |||||||
|---|---|---|---|---|---|---|---|---|
| () | ||||||||
| IRAS 172080014 | 0\@alignment@align.0428 | 1.56aaScaled down from the data of the line by a factor of 2.5, as in Falstad et al. (2019) | 0\@alignment@align.21 | 0.4 | 1,1\@alignment@align | |||
| NGC 4418 | 0\@alignment@align.0071 | 3.77 | ¡0\@alignment@align.05 | 0.5 | 2,8\@alignment@align | |||
| Zw 049.057 (CGCG 049-057) | 0\@alignment@align.0130 | 3.57 | 0\@alignment@align.11 | 0.2 | 2,8\@alignment@align | |||
| IRAS 122240624 | 0\@alignment@align.0264 | 3.41aaScaled down from the data of the line by a factor of 2.5, as in Falstad et al. (2019) | 0\@alignment@align.20 | ddNoisy spectrum to measure . | 2,6\@alignment@align | |||
| IC 860 | 0\@alignment@align.0130 | 2.65 | ¡0\@alignment@align.04 | 0.3 | 2,6\@alignment@align | |||
| Arp 220 W | 0\@alignment@align.0181 | 2.37 | 0\@alignment@align.29bbMultiple nuclei are not resolved by AKARI. | 0.4bbMultiple nuclei are not resolved by AKARI. | 2,8\@alignment@align | |||
| Arp 220 E | \@alignment@align | 0.51 | \@alignment@align | \@alignment@align | ||||
| UGC 5101 | 0\@alignment@align.0394 | 2.15 | 1\@alignment@align.0 | 0.7 | 3,7\@alignment@align | |||
| IRAS 224911808 E | 0\@alignment@align.0778 | 0.95 | ¡0\@alignment@align.43bbMultiple nuclei are not resolved by AKARI. | eeCO is not covered by AKARI because of extremely high . | 2,6\@alignment@align | |||
| IRAS 121120305 NE | 0\@alignment@align.0733 | 0.70 | 0\@alignment@align.47bbMultiple nuclei are not resolved by AKARI. | eeCO is not covered by AKARI because of extremely high . | 2,6\@alignment@align | |||
| Mrk 231 (UGC 8058) | 0\@alignment@align.0422 | 0.42 | ¡0\@alignment@align.05 | ¡0.1ccEstimated by us from the spectrum presented in the reference. | 2,6\@alignment@align | |||
| IRAS 051892524 | 0\@alignment@align.0428 | 0.24aaScaled down from the data of the line by a factor of 2.5, as in Falstad et al. (2019) | 0\@alignment@align.034 | ¡0.1ccEstimated by us from the spectrum presented in the reference. | 4,7\@alignment@align | |||
| IRAS 205514250 (ESO 286-IG19) | 0\@alignment@align.0430 | 0.21 | 0\@alignment@align.48 | ¿0.5 | 2,8\@alignment@align | |||
| Mrk 273 | 0\@alignment@align.0378 | ¡1.14 | 0\@alignment@align.25 | 0.2 | 2,7\@alignment@align | |||
| IRAS 152503609 | 0\@alignment@align.0552 | ¡1.02 | 0\@alignment@align.36 | ¿1.0 | 2,8\@alignment@align | |||
| IRAS 204141651 | 0\@alignment@align.0871 | ¡0.50 | 0\@alignment@align.84 | eeCO is not covered by AKARI because of extremely high . | 2,8\@alignment@align | |||
| IRAS 085723915 NW | 0\@alignment@align.0584 | ¡0.48 | 0\@alignment@align.3 | 0.7 | 3,7\@alignment@align | |||
| I Zw 1 (PG 0050124) | 0\@alignment@align.0610 | ¡0.21 | ¡0\@alignment@align.1ccEstimated by us from the spectrum presented in the reference. | ¡0.1 | 5,9\@alignment@align | |||
| IRAS 131205453 | 0\@alignment@align.0308 | ¡0.12aaScaled down from the data of the line by a factor of 2.5, as in Falstad et al. (2019) | 0\@alignment@align.4ccEstimated by us from the spectrum presented in the reference. | 0.3ccEstimated by us from the spectrum presented in the reference. | 6,6\@alignment@align | |||
| NGC 7469 | 0\@alignment@align.0164 | ¡0.03 | 0\@alignment@align.066 | 0.1ccEstimated by us from the spectrum presented in the reference. | 2,6\@alignment@align | |||
| NGC 1068 | 0\@alignment@align.0038 | 0.001 | ¡0\@alignment@align.1ccEstimated by us from the spectrum presented in the reference. | ¡0.07 | 10,10\@alignment@align | |||
Note. — Column 1: object name. Names used in the references are also listed. Column 2: redshift. Column 3: ratio of the line luminosity of the HCN-vib line to the total IR luminosity listed in Falstad et al. (2019), except for NGC 1068, where the value is taken from Imanishi et al. (2020). If only the line is available, then is scaled down by a factor of 2.5, as in Falstad et al. (2019). Column 4: optical depth of the 3.1 µm H2O ice absorption. Column 5: optical depth of the 4.67 µm CO absorption when observed with AKARI/IRC (, except for NGC 1068, which was observed with ISO/SWS (). Column 6: references for Columns 4 and 5. (1) This work; (2) Yamada et al. (2013); (3) Imanishi et al. (2008); (4) Doi et al. (2019); (5) Kim et al. (2015); (6) Inami et al. (2018); (7) Baba et al. (2018); (8) Imanishi et al. (2010); (9) IRC point source spectral catalogue; (10) Lutz et al. (2004).

5.4 Comparison with Nuclear Structures in the Literature
Our observations provide a clear picture of the distribution of the dust and gas in the central 100 pc of IRAS 17208. We use it as a positional reference for comparison with various nuclear structures reported in the literature: stellar disks, outflows, and starburst regions. The positions of these structures are shown in Figure 14.
Medling et al. (2014) revealed two overlapping nuclear disks with a projected separation of 200 pc from near-IR integral field spectroscopy performed with OSIRIS161616The OH-Suppressing Infra-Red Imaging Spectrograph. on the W. M. Keck II telescope. The angular resolution of their observations was similar to that of our ALMA observation. The western disk is brighter and smaller than the eastern disk in both the continuum and Br fluxes. Aalto et al. (2015b) interpreted that the HCN-vib emission is primarily associated with the W nucleus. Unfortunately, we cannot directly compare the dust peak position of our observation with the disk positions observed by Medling et al. (2014), because the OSIRIS data do not provide absolute coordinates. Thus, we attribute our dust peak to the W nucleus, and the faint elongated emission to the E disk.
The kinematic major axes of the W and E disks measured by Medling et al. (2014) are oriented at and , respectively. In both the disks, the western side is the approaching side. The direction of the large-scale gradient of our CO(6–5) velocity map (see Figure 4) is approximately . This probably reflects the velocity field of the entire system comprising the two disks. Unfortunately, it is currently difficult to reliably decouple the kinematics of the two disks.
U et al. (2019) also analyzed the Keck/OSIRIS integral-field spectroscopic data and calculated the star formation rate for each point from the Br flux after correcting for dust effects. They found that the region with a high surface star formation rate is located southwest of the W nucleus. The size of the region is several hundred parsecs. The stellar contribution to the bolometric luminosity of IRAS 17208 is thought to originate from this region.
The existence of an outflow is of particular interest. In the ionized phase, a broad outflowing component that has velocities up to 300 was found from the H line (Arribas et al., 2014). In addition, neutral gas outflows blueshifted by up to 650 were identified from Na I D absorption lines (Rupke & Veilleux, 2013). Moving to the molecular phase, in the observations by Medling et al. (2014) and Medling et al. (2015), the 2.12 µm line flux shows a morphology that is different from that of the continuum or the Br emission. It extends south from the system to approximately 400 pc with a /Br ratio as high as 4–8. Medling et al. (2015) attributed this to strong shocks at the base of a starburst-driven wind, which is launched from either of the two nuclei at about 400 . An outflow that appears to be AGN-driven has also been found, by García-Burillo et al. (2015) from their CO(2–1) observations. They measured the outflow direction as and tentatively identified the W nucleus as the source of the outflow because the direction and the disk axis are almost perpendicular. We also propose that the outflow is launched from the W disk, because our high spatial resolution observations show that the AGN is almost certainly buried in the W disk. The outflow component found in CO(2–1) has two knots located at 160 kpc in the southwest and northeast, and blue- and red-shifted by 500 , respectively. The CO(6–5) and CS(14–13) lines in our beam-sized ( pc) nuclear spectrum (Figure 1, lower panel) appear to be slightly blueshift by about from . Unfortunately, this small shift is not very reliable due to the uncertainty in the difference between , which was determined with a 05 beam not separating the two nuclei (García-Burillo et al., 2015), and the actual systemic velocity of the W nucleus. If the blueshift is real, it might be associated with the known outflows although the spatial and velocity scales are quite different. At this time, their detailed relation is unknown including if it exists.
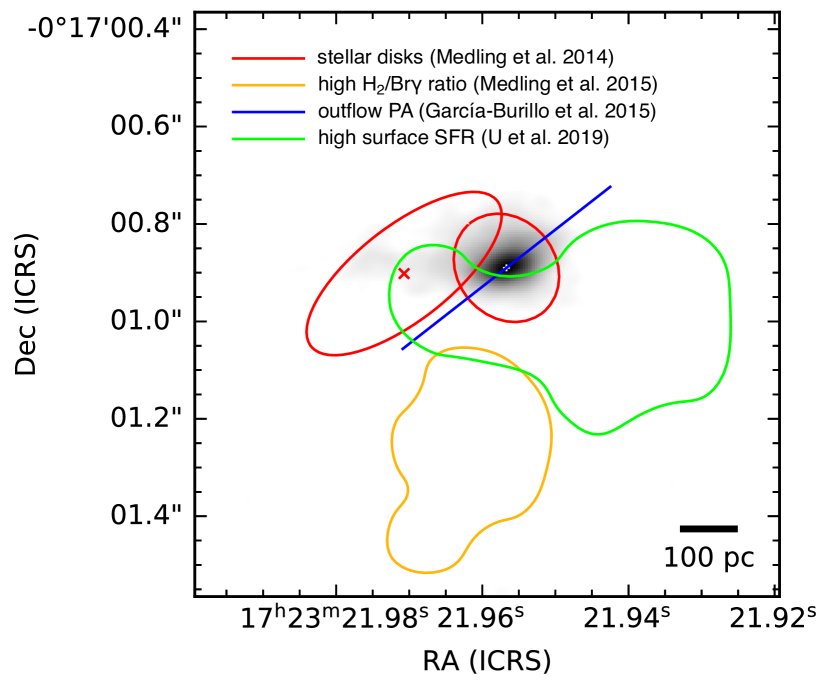
6 Summary
In this paper, we have presented the results of high-spatial-resolution () ALMA observations of CO(=6–5), the 436 µm continuum, and serendipitously detected CS(=14–13) of a late-stage merger IRAS 17208, as well as AKARI spectroscopic observations in the 2.5–5.0 µmwavelength range.
The dust continuum peak has a high brightness temperature of 106 K and coincides with the dynamical center reported previously in the literature, which can be regarded as the location of the CT AGN in IRAS 17208. At this position, the CO(6–5) and CS(14–13) lines are detected in absorption. In the surrounding region, CO emission is observed with a rotating pattern, but CS emission is not detected.
By comparing the observed intensity of CO(6–5) emission with non-LTE simulations performed with RADEX, the gas column density in the circumnuclear region (–80 pc) is estimated to be . However, the gas parameters obtained in this region cannot simultaneously explain the intensity of CO absorption in the central beam ( pc). The gas at the center is indicated to be dense () and warm ( K) by the detection of CS(14–13), and its column density is constrained to from RADEX calculations. Under the assumption that the gas temperature is highest at the center, the central column density has an excess of 0.3 dex over the circumnuclear region, indicating that there is a concentrated structure around the nucleus. The map of CS(14–13) reinforces this picture. Our results are consistent with the presence of a hot mid-IR core predicted from the bright HCN-vib emission observed at an angular resolution one order of magnitude larger than in our work (Aalto et al., 2015b).
The AKARI spectrum obtained after careful correction for hot-pixel effects has revealed deep and broad CO ro-vibrational absorption at 4.67 µm. Its band profile is well represented by an LTE gas model with and . The fact that LTE is established over a wide wavelength range (i.e., up to high levels) suggests a high gas density ().
The properties of the gas observed through absorption in the sub-mm and near-IR are similar, but the temperature is higher in the latter. This may mean that the regions probed in the two wavelength ranges are roughly coincident, but that in the near-IR, the hot region close to the nucleus is also included, because the effective background source should be hotter and smaller than in the sub-mm.
The most plausible heating source for the observed dense and warm gas of a large column density is X-rays. The absorption region is considered to be located within the XDR formed around the AGN. The abundance ratio of found from the sub-mm absorption intensities is also consistent with the chemistry in dense XDRs. The AGN power is evaluated from our observations to have a contribution of more than 30% at 4–5 µm, based on the depth of the CO band.
Despite the suggested presence of an AGN, the , , , and continuum color measured from the AKARI spectrum are not indicative of an (obscured) AGN. This is probably because the AGN is severely attenuated at 2.5–4 µm and overwhelmed by the starburst contribution. From a comparison of archival and values, it is found that high indicative of an obscured AGN is rarely observed in HCN-vib bright galaxies, even where the presence of AGN has been confirmed by other means. This result implies that the lack of AGN signatures at 2.5–4 µm is usual for AGNs in hot mid-IR cores.
It is also found that high optical depth of CO ro-vibrational absorption () is more frequently observed in HCN-vib bright galaxies than in faint ones, supporting the interpretation that the CO absorption is occurring in the hot mid-IR core. Also, is found to be diverse in HCN-vib faint galaxies, even those hosting obscured AGNs. This can be interpreted as a geometrical effect of an obscuring structure that does not cover the entire solid angle.
Based on the morphology of the dust continuum emission, we conclude that the dust peak, and thus the CT AGN, belongs to the western one of the two nuclear disks revealed by Medling et al. (2014). The sub-mm CO(6–5) and CS(14–13) absorption lines appear to show a slight blueshift ( ), and it might be a sign of an outflow if real, although the relation to known outflows is unclear.
Appendix A Channel Maps
Figure A shows velocity channel maps of CO(6–5). The line emission (red contours) shows a rotating pattern. The line absorption (blue contours) is detected continuously over multiple channels only at the dust continuum peak (black plus sign).
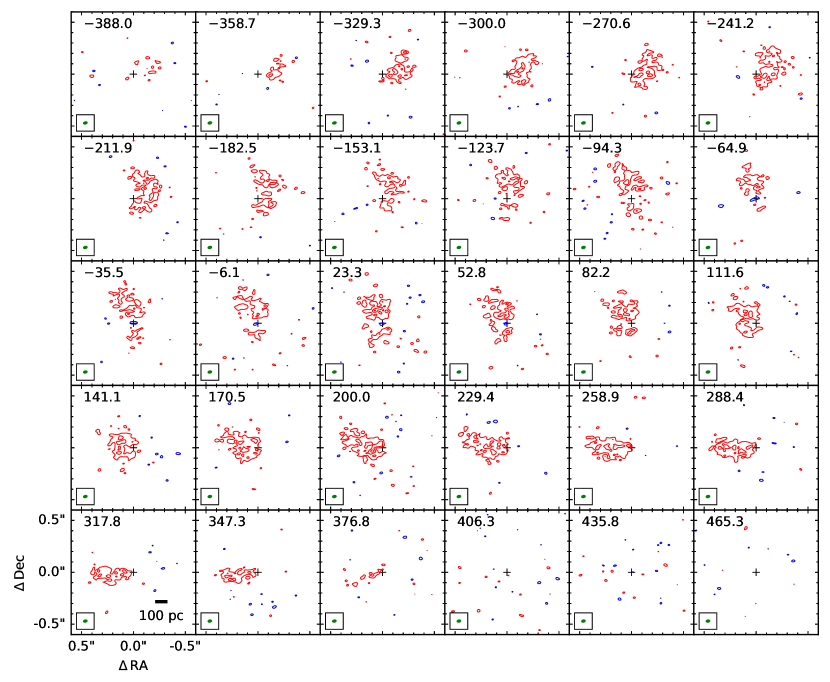
Appendix B Position-Velocity Diagrams
In Figure 16, we present the PV diagrams of CO(6–5) created along the major axis () at the nuclear position and two off-nuclear positions shifted by 005 to the north and south. At each position, the CO data cube was averaged with a width of 0045 to increase the S/N. We observe rotation patterns in all three PV diagrams. Moreover, CO(6–5) is clearly seen in absorption at the nucleus. The presence of the bright spots at and relative to the systemic velocity (12824 ) is similar to those observed in the PV diagram of CO(2–1) presented by García-Burillo et al. (2015). The pattern, in which the intensity is suppressed at the systemic velocity, resembles that in the PV diagrams of HCN(4–3) and HCO+(4–3) presented by Aalto et al. (2015b). Note that the position angles of the PV diagrams in these two works differ slightly from that in our work, namely, by and , respectively.
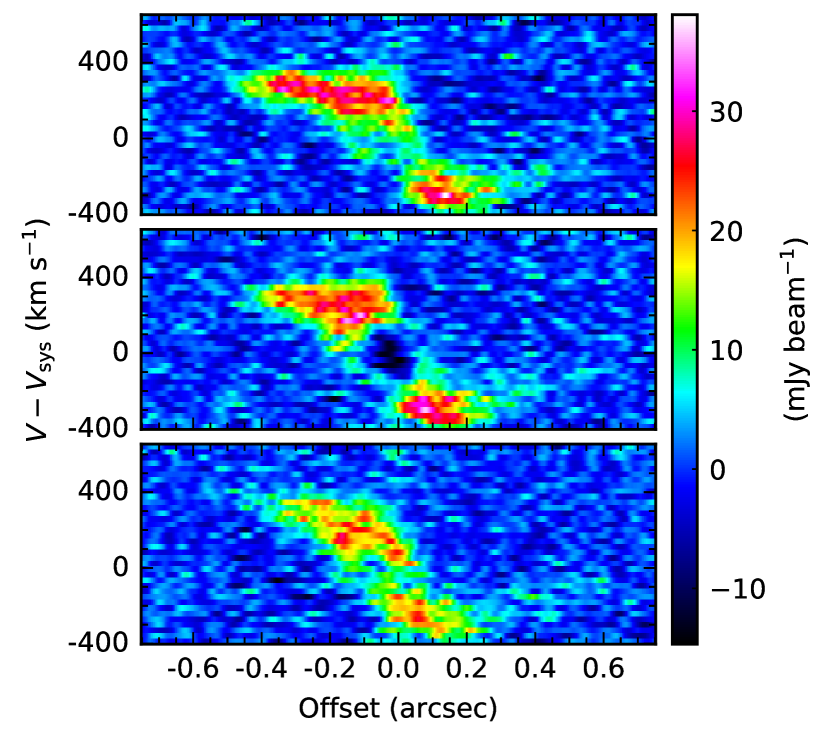
References
- Aalto et al. (2015a) Aalto, S., Garcia-Burillo, S., Muller, S., et al. 2015a, A&A, 574, A85, doi: 10.1051/0004-6361/201423987
- Aalto et al. (2015b) Aalto, S., Martín, S., Costagliola, F., et al. 2015b, A&A, 584, A42, doi: 10.1051/0004-6361/201526410
- Aalto et al. (2019) Aalto, S., Muller, S., König, S., et al. 2019, A&A, 627, A147, doi: 10.1051/0004-6361/201935480
- Alonso-Herrero et al. (2016) Alonso-Herrero, A., Poulton, R., Roche, P. F., et al. 2016, MNRAS, 463, 2405, doi: 10.1093/mnras/stw2031
- Arribas & Colina (2003) Arribas, S., & Colina, L. 2003, ApJ, 591, 791, doi: 10.1086/375417
- Arribas et al. (2014) Arribas, S., Colina, L., Bellocchi, E., Maiolino, R., & Villar-Martín, M. 2014, A&A, 568, A14, doi: 10.1051/0004-6361/201323324
- Astropy Collaboration et al. (2013) Astropy Collaboration, Robitaille, T. P., Tollerud, E. J., et al. 2013, A&A, 558, A33, doi: 10.1051/0004-6361/201322068
- Astropy Collaboration et al. (2018) Astropy Collaboration, Price-Whelan, A. M., Sipőcz, B. M., et al. 2018, AJ, 156, 123, doi: 10.3847/1538-3881/aabc4f
- Baba et al. (2018) Baba, S., Nakagawa, T., Isobe, N., & Shirahata, M. 2018, ApJ, 852, 83, doi: 10.3847/1538-4357/aa9f25
- Baba et al. (2019) Baba, S., Nakagawa, T., Usui, F., Yamagishi, M., & Onaka, T. 2019, PASJ, 71, 2, doi: 10.1093/pasj/psy131
- Baba et al. (2016) Baba, S., Nakagawa, T., Shirahata, M., et al. 2016, PASJ, 68, 27, doi: 10.1093/pasj/psw013
- Baker & Menzel (1938) Baker, J. G., & Menzel, D. H. 1938, ApJ, 88, 52, doi: 10.1086/143959
- Barcos-Muñoz et al. (2018) Barcos-Muñoz, L., Aalto, S., Thompson, T. A., et al. 2018, ApJ, 853, L28, doi: 10.3847/2041-8213/aaa28d
- Barnes & Hernquist (1996) Barnes, J. E., & Hernquist, L. 1996, ApJ, 471, 115, doi: 10.1086/177957
- Barnes & Hernquist (1991) Barnes, J. E., & Hernquist, L. E. 1991, ApJ, 370, L65, doi: 10.1086/185978
- Borne et al. (2000) Borne, K. D., Bushouse, H., Lucas, R. A., & Colina, L. 2000, ApJ, 529, L77, doi: 10.1086/312461
- Bushouse et al. (2002) Bushouse, H. A., Borne, K. D., Colina, L., et al. 2002, ApJS, 138, 1, doi: 10.1086/324019
- Cami (2002) Cami, J. 2002, PhD thesis, University of Amsterdam
- Colina et al. (2001) Colina, L., Borne, K., Bushouse, H., et al. 2001, ApJ, 563, 546, doi: 10.1086/323945
- Cui et al. (2001) Cui, J., Xia, X. Y., Deng, Z. G., Mao, S., & Zou, Z. L. 2001, AJ, 122, 63, doi: 10.1086/321127
- Davies et al. (2015) Davies, R. I., Burtscher, L., Rosario, D., et al. 2015, ApJ, 806, 127, doi: 10.1088/0004-637X/806/1/127
- Di Matteo et al. (2005) Di Matteo, T., Springel, V., & Hernquist, L. 2005, Nature, 433, 604, doi: 10.1038/nature03335
- Doi et al. (2019) Doi, R., Nakagawa, T., Isobe, N., et al. 2019, PASJ, 71, 26, doi: 10.1093/pasj/psz019
- Duc et al. (1997) Duc, P. A., Mirabel, I. F., & Maza, J. 1997, A&AS, 124, 533, doi: 10.1051/aas:1997205
- Fabian (2012) Fabian, A. C. 2012, ARA&A, 50, 455, doi: 10.1146/annurev-astro-081811-125521
- Falstad et al. (2019) Falstad, N., Hallqvist, F., Aalto, S., et al. 2019, A&A, 623, A29, doi: 10.1051/0004-6361/201834586
- Falstad et al. (2021) Falstad, N., Aalto, S., König, S., et al. 2021, A&A, 649, A105, doi: 10.1051/0004-6361/202039291
- Franceschini et al. (2003) Franceschini, A., Braito, V., Persic, M., et al. 2003, MNRAS, 343, 1181, doi: 10.1046/j.1365-8711.2003.06744.x
- Gao et al. (2020) Gao, F., Wang, L., Pearson, W. J., et al. 2020, A&A, 637, A94, doi: 10.1051/0004-6361/201937178
- García-Burillo et al. (2015) García-Burillo, S., Combes, F., Usero, A., et al. 2015, A&A, 580, A35, doi: 10.1051/0004-6361/201526133
- García-Burillo et al. (2019) García-Burillo, S., Combes, F., Ramos Almeida, C., et al. 2019, A&A, 632, A61, doi: 10.1051/0004-6361/201936606
- González-Alfonso & Sakamoto (2019) González-Alfonso, E., & Sakamoto, K. 2019, ApJ, 882, 153, doi: 10.3847/1538-4357/ab3a32
- González-Martín et al. (2009) González-Martín, O., Masegosa, J., Márquez, I., & Guainazzi, M. 2009, ApJ, 704, 1570, doi: 10.1088/0004-637X/704/2/1570
- Gowardhan et al. (2018) Gowardhan, A., Spoon, H., Riechers, D. A., et al. 2018, ApJ, 859, 35, doi: 10.3847/1538-4357/aabccc
- Gravity Collaboration et al. (2020) Gravity Collaboration, Pfuhl, O., Davies, R., et al. 2020, A&A, 634, A1, doi: 10.1051/0004-6361/201936255
- Haan et al. (2011) Haan, S., Surace, J. A., Armus, L., et al. 2011, AJ, 141, 100, doi: 10.1088/0004-6256/141/3/100
- Harris et al. (2020) Harris, C. R., Millman, K. J., van der Walt, S. J., et al. 2020, Nature, 585, 357, doi: 10.1038/s41586-020-2649-2
- Hopkins et al. (2006) Hopkins, P. F., Hernquist, L., Cox, T. J., et al. 2006, ApJS, 163, 1, doi: 10.1086/499298
- Hopkins et al. (2008) Hopkins, P. F., Hernquist, L., Cox, T. J., & Kereš, D. 2008, ApJS, 175, 356, doi: 10.1086/524362
- Hunter (2007) Hunter, J. D. 2007, Computing in Science and Engineering, 9, 90, doi: 10.1109/MCSE.2007.55
- Ichikawa et al. (2014) Ichikawa, K., Imanishi, M., Ueda, Y., et al. 2014, ApJ, 794, 139, doi: 10.1088/0004-637X/794/2/139
- Ichikawa et al. (2019) Ichikawa, K., Ricci, C., Ueda, Y., et al. 2019, ApJ, 870, 31, doi: 10.3847/1538-4357/aaef8f
- Imanishi et al. (2006a) Imanishi, M., Dudley, C. C., & Maloney, P. R. 2006a, ApJ, 637, 114, doi: 10.1086/498391
- Imanishi & Maloney (2003) Imanishi, M., & Maloney, P. R. 2003, ApJ, 588, 165, doi: 10.1086/368354
- Imanishi et al. (2008) Imanishi, M., Nakagawa, T., Ohyama, Y., et al. 2008, PASJ, 60, S489, doi: 10.1093/pasj/60.sp2.S489
- Imanishi et al. (2010) Imanishi, M., Nakagawa, T., Shirahata, M., Ohyama, Y., & Onaka, T. 2010, ApJ, 721, 1233, doi: 10.1088/0004-637X/721/2/1233
- Imanishi & Nakanishi (2013) Imanishi, M., & Nakanishi, K. 2013, AJ, 146, 91, doi: 10.1088/0004-6256/146/4/91
- Imanishi et al. (2016a) Imanishi, M., Nakanishi, K., & Izumi, T. 2016a, ApJ, 825, 44, doi: 10.3847/0004-637X/825/1/44
- Imanishi et al. (2016b) —. 2016b, AJ, 152, 218, doi: 10.3847/0004-6256/152/6/218
- Imanishi et al. (2018) Imanishi, M., Nakanishi, K., Izumi, T., & Wada, K. 2018, ApJ, 853, L25, doi: 10.3847/2041-8213/aaa8df
- Imanishi et al. (2006b) Imanishi, M., Nakanishi, K., & Kohno, K. 2006b, AJ, 131, 2888, doi: 10.1086/503527
- Imanishi et al. (2020) Imanishi, M., Nguyen, D. D., Wada, K., et al. 2020, ApJ, 902, 99, doi: 10.3847/1538-4357/abaf50
- Inami et al. (2018) Inami, H., Armus, L., Matsuhara, H., et al. 2018, A&A, 617, A130, doi: 10.1051/0004-6361/201833053
- Iwasawa et al. (2011) Iwasawa, K., Sanders, D. B., Teng, S. H., et al. 2011, A&A, 529, A106, doi: 10.1051/0004-6361/201015264
- Izumi et al. (2018) Izumi, T., Wada, K., Fukushige, R., Hamamura, S., & Kohno, K. 2018, ApJ, 867, 48, doi: 10.3847/1538-4357/aae20b
- Izumi et al. (2016) Izumi, T., Kohno, K., Aalto, S., et al. 2016, ApJ, 818, 42, doi: 10.3847/0004-637X/818/1/42
- Izumi et al. (2020) Izumi, T., Nguyen, D. D., Imanishi, M., et al. 2020, ApJ, 898, 75, doi: 10.3847/1538-4357/ab9cb1
- Kamenetzky et al. (2014) Kamenetzky, J., Rangwala, N., Glenn, J., Maloney, P. R., & Conley, A. 2014, ApJ, 795, 174, doi: 10.1088/0004-637X/795/2/174
- Kameno et al. (2020) Kameno, S., Sawada-Satoh, S., Impellizzeri, C. M. V., et al. 2020, ApJ, 895, 73, doi: 10.3847/1538-4357/ab8bd6
- Kawakatu et al. (2020) Kawakatu, N., Wada, K., & Ichikawa, K. 2020, ApJ, 889, 84, doi: 10.3847/1538-4357/ab5f60
- Kim et al. (2015) Kim, D., Im, M., Kim, J. H., et al. 2015, ApJS, 216, 17, doi: 10.1088/0067-0049/216/1/17
- Kluyver et al. (2016) Kluyver, T., Ragan-Kelley, B., Pérez, F., et al. 2016, in Positioning and Power in Academic Publishing: Players, Agents and Agendas, ed. L. Loizides & B. Schmidt (IOP Press), 87–90, doi: 10.3233/978-1-61499-649-1-87
- Koss et al. (2018) Koss, M. J., Blecha, L., Bernhard, P., et al. 2018, Nature, 563, 214, doi: 10.1038/s41586-018-0652-7
- Lebouteiller et al. (2011) Lebouteiller, V., Barry, D. J., Spoon, H. W. W., et al. 2011, ApJS, 196, 8, doi: 10.1088/0067-0049/196/1/8
- Leja et al. (2018) Leja, J., Johnson, B. D., Conroy, C., & van Dokkum, P. 2018, ApJ, 854, 62, doi: 10.3847/1538-4357/aaa8db
- Lutz et al. (2004) Lutz, D., Sturm, E., Genzel, R., Spoon, H. W. W., & Stacey, G. J. 2004, A&A, 426, L5, doi: 10.1051/0004-6361:200400072
- Lutz et al. (1999) Lutz, D., Veilleux, S., & Genzel, R. 1999, ApJ, 517, L13, doi: 10.1086/312014
- Markwardt (2009) Markwardt, C. B. 2009, Astronomical Society of the Pacific Conference Series, Vol. 411, Non-linear Least-squares Fitting in IDL with MPFIT, ed. D. A. Bohlender, D. Durand, & P. Dowler (Astronomical Society of the Pacific), 251
- Martín et al. (2016) Martín, S., Aalto, S., Sakamoto, K., et al. 2016, A&A, 590, A25, doi: 10.1051/0004-6361/201528064
- McKinney (2010) McKinney, W. 2010, in Proc. 9th Python in Science Conf., ed. S. van der Walt & J. Millman, Vol. 445, 51–56
- McMullin et al. (2007) McMullin, J. P., Waters, B., Schiebel, D., Young, W., & Golap, K. 2007, in Astronomical Society of the Pacific Conference Series, Vol. 376, Astronomical Data Analysis Software and Systems XVI, ed. R. A. Shaw, F. Hill, & D. J. Bell, 127
- Medling et al. (2014) Medling, A. M., U, V., Guedes, J., et al. 2014, ApJ, 784, 70, doi: 10.1088/0004-637X/784/1/70
- Medling et al. (2015) Medling, A. M., U, V., Rich, J. A., et al. 2015, MNRAS, 448, 2301, doi: 10.1093/mnras/stv081
- Meijerink & Spaans (2005) Meijerink, R., & Spaans, M. 2005, A&A, 436, 397, doi: 10.1051/0004-6361:20042398
- Meijerink et al. (2006) Meijerink, R., Spaans, M., & Israel, F. P. 2006, ApJ, 650, L103, doi: 10.1086/508938
- Melnick & Mirabel (1990) Melnick, J., & Mirabel, I. F. 1990, A&A, 231, L19
- Merloni et al. (2014) Merloni, A., Bongiorno, A., Brusa, M., et al. 2014, MNRAS, 437, 3550, doi: 10.1093/mnras/stt2149
- Mihos & Hernquist (1996) Mihos, J. C., & Hernquist, L. 1996, ApJ, 464, 641, doi: 10.1086/177353
- Momjian et al. (2003) Momjian, E., Romney, J. D., Carilli, C. L., Troland, T. H., & Taylor, G. B. 2003, ApJ, 587, 160, doi: 10.1086/367722
- Murphy et al. (1996) Murphy, T. W., J., Armus, L., Matthews, K., et al. 1996, AJ, 111, 1025, doi: 10.1086/117849
- Nardini et al. (2009) Nardini, E., Risaliti, G., Salvati, M., et al. 2009, MNRAS, 399, 1373, doi: 10.1111/j.1365-2966.2009.15357.x
- Nardini et al. (2010) Nardini, E., Risaliti, G., Watabe, Y., Salvati, M., & Sani, E. 2010, MNRAS, 405, 2505, doi: 10.1111/j.1365-2966.2010.16618.x
- Ohyama et al. (2007) Ohyama, Y., Onaka, T., Matsuhara, H., et al. 2007, PASJ, 59, S411, doi: 10.1093/pasj/59.sp2.S411
- Onaka et al. (2010) Onaka, T., Matsuhara, H., Wada, T., et al. 2010, in Society of Photo-Optical Instrumentation Engineers (SPIE) Conference Series, Vol. 7731, Space Telescopes and Instrumentation 2010: Optical, Infrared, and Millimeter Wave, ed. J. Oschmann, Jacobus M., M. C. Clampin, & H. A. MacEwen, 77310M, doi: 10.1117/12.856568
- Onishi et al. (2021) Onishi, S., Nakagawa, T., Baba, S., et al. 2021, ApJ, 921, 141, doi: 10.3847/1538-4357/ac1c6d
- Pearson et al. (2016) Pearson, C., Rigopoulou, D., Hurley, P., et al. 2016, ApJS, 227, 9, doi: 10.3847/0067-0049/227/1/9
- Perez & Granger (2007) Perez, F., & Granger, B. E. 2007, Computing in Science and Engineering, 9, 21, doi: 10.1109/MCSE.2007.53
- Rangwala et al. (2015) Rangwala, N., Maloney, P. R., Wilson, C. D., et al. 2015, ApJ, 806, 17, doi: 10.1088/0004-637X/806/1/17
- Ricci et al. (2017) Ricci, C., Bauer, F. E., Treister, E., et al. 2017, MNRAS, 468, 1273, doi: 10.1093/mnras/stx173
- Risaliti et al. (2010) Risaliti, G., Imanishi, M., & Sani, E. 2010, MNRAS, 401, 197, doi: 10.1111/j.1365-2966.2009.15622.x
- Risaliti et al. (2006) Risaliti, G., Maiolino, R., Marconi, A., et al. 2006, MNRAS, 365, 303, doi: 10.1111/j.1365-2966.2005.09715.x
- Robitaille (2019) Robitaille, T. 2019, APLpy v2.0: The Astronomical Plotting Library in Python, 2.0, Zenodo, doi: 10.5281/zenodo.2567476
- Robitaille & Bressert (2012) Robitaille, T., & Bressert, E. 2012, APLpy: Astronomical Plotting Library in Python. http://ascl.net/1208.017
- Rose et al. (2020) Rose, T., Edge, A. C., Combes, F., et al. 2020, MNRAS, 496, 364, doi: 10.1093/mnras/staa1474
- Ruffa et al. (2018) Ruffa, I., Vignali, C., Mignano, A., Paladino, R., & Iwasawa, K. 2018, A&A, 616, A127, doi: 10.1051/0004-6361/201732268
- Rupke & Veilleux (2013) Rupke, D. S. N., & Veilleux, S. 2013, ApJ, 768, 75, doi: 10.1088/0004-637X/768/1/75
- Sakamoto et al. (2010) Sakamoto, K., Aalto, S., Evans, A. S., Wiedner, M. C., & Wilner, D. J. 2010, ApJ, 725, L228, doi: 10.1088/2041-8205/725/2/L228
- Sakamoto et al. (2021) Sakamoto, K., Martín, S., Wilner, D. J., et al. 2021, ApJ, 923, 240, doi: 10.3847/1538-4357/ac29bf
- Sakamoto et al. (2009) Sakamoto, K., Aalto, S., Wilner, D. J., et al. 2009, ApJ, 700, L104, doi: 10.1088/0004-637X/700/2/L104
- Sanders et al. (2003) Sanders, D. B., Mazzarella, J. M., Kim, D. C., Surace, J. A., & Soifer, B. T. 2003, AJ, 126, 1607, doi: 10.1086/376841
- Sanders & Mirabel (1996) Sanders, D. B., & Mirabel, I. F. 1996, ARA&A, 34, 749, doi: 10.1146/annurev.astro.34.1.749
- Saunders et al. (2000) Saunders, W., Sutherland, W. J., Maddox, S. J., et al. 2000, MNRAS, 317, 55, doi: 10.1046/j.1365-8711.2000.03528.x
- Schöier et al. (2005) Schöier, F. L., van der Tak, F. F. S., van Dishoeck, E. F., & Black, J. H. 2005, A&A, 432, 369, doi: 10.1051/0004-6361:20041729
- Scoville et al. (2017) Scoville, N., Murchikova, L., Walter, F., et al. 2017, ApJ, 836, 66, doi: 10.3847/1538-4357/836/1/66
- Scoville et al. (2000) Scoville, N. Z., Evans, A. S., Thompson, R., et al. 2000, AJ, 119, 991, doi: 10.1086/301248
- Secrest et al. (2020) Secrest, N. J., Ellison, S. L., Satyapal, S., & Blecha, L. 2020, MNRAS, 499, 2380, doi: 10.1093/mnras/staa1692
- Shirahata et al. (2013) Shirahata, M., Nakagawa, T., Usuda, T., et al. 2013, PASJ, 65, 5, doi: 10.1093/pasj/65.1.5
- Smith et al. (2007) Smith, J. D. T., Draine, B. T., Dale, D. A., et al. 2007, ApJ, 656, 770, doi: 10.1086/510549
- Spoon et al. (2005) Spoon, H. W. W., Keane, J. V., Cami, J., et al. 2005, in IAU Symposium, Vol. 231, Astrochemistry: Recent Successes and Current Challenges, ed. D. C. Lis, G. A. Blake, & E. Herbst, 281–290, doi: 10.1017/S1743921306007277
- Spoon et al. (2004) Spoon, H. W. W., Armus, L., Cami, J., et al. 2004, ApJS, 154, 184, doi: 10.1086/422813
- Stierwalt et al. (2013) Stierwalt, S., Armus, L., Surace, J. A., et al. 2013, ApJS, 206, 1, doi: 10.1088/0067-0049/206/1/1
- Storey & Hummer (1995) Storey, P. J., & Hummer, D. G. 1995, MNRAS, 272, 41, doi: 10.1093/mnras/272.1.41
- Tanimoto et al. (2020) Tanimoto, A., Ueda, Y., Odaka, H., et al. 2020, ApJ, 897, 2, doi: 10.3847/1538-4357/ab96bc
- U et al. (2019) U, V., Medling, A. M., Inami, H., et al. 2019, ApJ, 871, 166, doi: 10.3847/1538-4357/aaf1c2
- van der Tak et al. (2007) van der Tak, F. F. S., Black, J. H., Schöier, F. L., Jansen, D. J., & van Dishoeck, E. F. 2007, A&A, 468, 627, doi: 10.1051/0004-6361:20066820
- Veilleux et al. (2002) Veilleux, S., Kim, D. C., & Sanders, D. B. 2002, ApJS, 143, 315, doi: 10.1086/343844
- Veilleux et al. (1995) Veilleux, S., Kim, D. C., Sanders, D. B., Mazzarella, J. M., & Soifer, B. T. 1995, ApJS, 98, 171, doi: 10.1086/192158
- Veilleux et al. (2006) Veilleux, S., Kim, D. C., Peng, C. Y., et al. 2006, ApJ, 643, 707, doi: 10.1086/503188
- Veilleux et al. (2009) Veilleux, S., Rupke, D. S. N., Kim, D. C., et al. 2009, ApJS, 182, 628, doi: 10.1088/0067-0049/182/2/628
- Veilleux et al. (2013) Veilleux, S., Meléndez, M., Sturm, E., et al. 2013, ApJ, 776, 27, doi: 10.1088/0004-637X/776/1/27
- Virtanen et al. (2020) Virtanen, P., Gommers, R., Oliphant, T. E., et al. 2020, Nature Methods, 17, 261, doi: 10.1038/s41592-019-0686-2
- Wada et al. (2018) Wada, K., Fukushige, R., Izumi, T., & Tomisaka, K. 2018, ApJ, 852, 88, doi: 10.3847/1538-4357/aa9e53
- Wada et al. (2016) Wada, K., Schartmann, M., & Meijerink, R. 2016, ApJ, 828, L19, doi: 10.3847/2041-8205/828/2/L19
- Wheeler et al. (2020) Wheeler, J., Glenn, J., Rangwala, N., & Fyhrie, A. 2020, ApJ, 896, 43, doi: 10.3847/1538-4357/ab8f32
- Winter et al. (2012) Winter, L. M., Veilleux, S., McKernan, B., & Kallman, T. R. 2012, ApJ, 745, 107, doi: 10.1088/0004-637X/745/2/107
- Wright et al. (2010) Wright, E. L., Eisenhardt, P. R. M., Mainzer, A. K., et al. 2010, AJ, 140, 1868, doi: 10.1088/0004-6256/140/6/1868
- Yamada et al. (2013) Yamada, R., Oyabu, S., Kaneda, H., et al. 2013, PASJ, 65, 103, doi: 10.1093/pasj/65.5.103
- Yamashita et al. (2017) Yamashita, T., Komugi, S., Matsuhara, H., et al. 2017, ApJ, 844, 96, doi: 10.3847/1538-4357/aa7af1
- Yang et al. (2010) Yang, B., Stancil, P. C., Balakrishnan, N., & Forrey, R. C. 2010, ApJ, 718, 1062, doi: 10.1088/0004-637X/718/2/1062
- Yuan et al. (2010) Yuan, T. T., Kewley, L. J., & Sanders, D. B. 2010, ApJ, 709, 884, doi: 10.1088/0004-637X/709/2/884