A Parkes “Murriyang” Search for Pulsars and Fast Transients in the Large Magellanic Cloud
Abstract
We report on the latest results of a Parkes multibeam survey for pulsars and dispersed radio bursts in the Large Magellanic Cloud (LMC). We conducted both periodicity and single-pulse searches at a much larger range of trial dispersion measures (DMs) than previously searched. We detected 229 single pulses with signal-to-noise ratio ( that were classified by the deep learning network FETCH as being real (with % likelihood), of which 9 were from the known giant-pulse-emitting pulsar PSR B054069. Two possibly repeating sources were detected with DMs suggesting that they lie within the LMC, but these require confirmation. Only 3 of the 220 unknown pulses had S/N greater than 8, and the DM distribution for these detected pulses follows an exponential falloff with increasing DM and does not show any excess of signals at DM values expected for the LMC. These features suggest that the detected pulses are not likely to be real, although they are visually compelling. We also report the discovery of a new pulsar (PSR J055667) in our periodicity search. This pulsar has a spin period of 791 ms, a DM of 71 cm-3 pc, an estimated 1400 MHz flux density of mJy, and shows no evidence of binary motion. Future observations may be able to confirm whether any of the weak but promising candidates in our single pulse and periodicity searches, including our two possible repeaters, are real or not.
1 Introduction
Of the more than 3000 pulsars listed in the ATNF pulsar catalog (Manchester et al., 2005),111http://www.atnf.csiro.au/research/pulsar/psrcat the vast majority (%) reside in our Galaxy or its globular clusters. The remainder lies in the Magellanic clouds (MCs) – Large and Small Magellanic Clouds (LMC and SMC) – the nearest satellite galaxies to our own. There are scientifically motivated reasons for finding and studying pulsars in the LMC. The discovery of a significant number of radio pulsars in the LMC would provide information about the pulsar population differences between the LMC (an irregular galaxy) and Milky Way (a spiral galaxy) as well as star formation and environmental differences (e.g., metallicity). The LMC has a lower stellar metallicity than the Milky Way (e.g., Hill et al. 1995), but the star formation rate in the LMC is estimated to be two orders of magnitude higher than that of the Milky Way per unit mass, which yields a comparable total star formation rate when normalized for galaxy mass (Grimm et al., 2003). Thus, stars in the LMC are clustered despite the comparable star formation rate, which can lead to a higher stellar encounter rate and more massive stars in the LMC than the Milky Way. This is likely to result in the much larger pulsar production rate in the LMC than what the Galactic model would predict.
Pulsar surveys of the LMC may also discover new members of different neutron star (NS) populations. Example source classes include young pulsars, rotating radio transients (RRATs – rotation powered pulsars that have sporadic bursting emission; McLaughlin et al. 2006), fast radio bursts (FRBs – millisecond-duration energetic pulses that have large DMs; Lorimer et al. 2007), and millisecond pulsars (MSPs – old NSs that have been spun up to millisecond periods through a recycling process in binary systems). The LMC is a fertile target for finding young NSs, given the large number of supernova remnants per unit mass relative to our Galaxy (Badenes et al., 2010). This suggests that young NSs manifesting as radio pulsars should be present at a greater rate than in the Galaxy. In fact, two young, rapidly spinning rotation-powered pulsars are known in the LMC: PSR B054069 (Seward et al., 1984; Manchester et al., 1993) and PSR J05376910 (Marshall et al., 1998), both of which are X-ray emitters.
The large number of high-mass X-ray binaries (HMXBs) present in the LMC per unit mass relative to the Galaxy (Liu et al., 2005) suggests that there ought to be a higher rate of occurrence of both MSPs and binary systems with unevolved companions (e.g., PSR J00457319 in the SMC, which orbits a massive, unevolved B star; Kaspi et al. 1994). Finding and studying binary pulsars with non-degenerate companions may help determine the effect of low metallicity on stellar winds from such companions. These winds can be probed by measuring dispersion measure (DM) and rotation measure variations and depolarization effects induced by the magnetized stellar wind over the course of the orbit (cf. Melatos et al. 1995 and Johnston et al. 1996 for the PSR B125963 system). White dwarfs (WDs) should also have a lower metallicity in the LMC, and WD pulsar companions may have different properties owing to this. One question that could be answered with a complete sample of binary radio pulsar systems in the LMC (both MSPs and partially recycled pulsars with unevolved companions) is whether the actual number of such systems is consistent with predicted numbers. Binary pulsars are also fossil records of previous binary interactions, and the companion winds and magnetospheres can be studied through the effects of pulsar radiation on them (e.g., Kaspi et al. 1996; Archibald et al. 2009; Lyutikov & Thompson 2005).
In addition to pulsars, our survey probes the LMC for fast transients (including giant radio pulses from pulsars) and holds the possibility for serendipitous discoveries (including FRBs). Since only a few members of the underlying RRAT population are visible at any given time owing to their extremely small duty cycles, the number of RRATs present in the Galaxy implied by statistical arguments is large (McLaughlin et al., 2006). There are currently two known pulsars in the LMC observed to emit giant radio pulses (defined as pulses with flux densities greater than 10 times the mean flux density of the pulsar): PSR B054069 (Johnston & Romani, 2003; Geyer et al., 2021) and PSR J05296652 (Crawford et al., 2013). The discovery of more giant pulse emitting pulsars, RRATs, or FRBs in the LMC could play an important role in understanding the populations of these transient sources, which are largely unexplored in the LMC.
To date, no radio MSPs have been discovered in the LMC or anywhere else outside of our Galaxy. MSPs are among the most interesting pulsars to study scientifically, in part because they are generally very stable rotators and are useful “clocks” for high-precision timing applications such as the search for gravitational waves (Arzoumanian et al., 2020) and tests of gravity (Kramer et al., 2021). The discovery of stable MSPs in the LMC may impact the search for nanohertz-scale frequency gravitational waves using pulsar timing arrays (PTAs) (Burke-Spolaor 2015). For example, as shown by Lee et al. (2008), the sensitivity of pulsar timing arrays (PTAs) to longitudinal modes of gravitational waves (which are not predicted by general relativity) is directly proportional to the most distant pulsar in the array. Having several baselines with distances of kpc, the distance to the LMC (Pietrzyński et al., 2013), compared to the rest of a pulsar array at Galactic distances could allow such modes to be detected, assuming sufficient pulsar timing accuracy could be achieved.
Pulsar surveys of the MCs also probe the high end of the pulsar luminosity function. The well-known distance to the LMC provides more accurate luminosity estimates for pulsars discovered there compared to the Milky Way, where pulsar distances can be much more uncertain. Global differences between the luminous pulsar population in the LMC and the Galactic pulsar population may provide insights into the pulsar emission mechanism, such as whether certain emission features might cause radio pulsars to be very luminous.
In this paper we present the results of a continuation of a survey for pulsars and transients in the LMC using the Parkes “Murriyang” 64-m radio telescope. Ridley et al. (2013) completed the first 27% of the planned survey area as defined by the previously most complete pulsar LMC survey conducted with Parkes (Manchester et al. 2006). The results reported here bring our survey coverage to 40%. We present the results of a new periodicity search of all of the acquired data to date as well as a new single pulse search these data. The paper is organized as follows. In section 2 we describe previous pulsar searches of the LMC, and in section 3, we introduce the details of our new survey. In section 4, we describe the data processing. In section 5, we present our results and discussions. Finally, in section 6, we draw our conclusions.
2 Overview of the Survey
The first Parkes observations of the LMC with the 13-beam multibeam receiver (Staveley-Smith et al. 1996) were conducted in 2000 and 2001222This survey also included observations of the SMC., and 136 separate pointings (totaling 1768 beams) covering the LMC were observed (see Fig. 1 of Manchester et al. 2006). Ridley et al. (2013) also subsequently reprocessed the archival data from these observations of the LMC and discovered five pulsars.
Our Parkes multibeam survey of the LMC began in 2009, in which a new high-resolution backend, the Berkeley–Parkes–Swinburne data recorder (BPSR) was used (Keith et al. 2010). The survey plan was to cover the same pattern of 136 interleaved multibeam pointings as in the prior Manchester et al. (2006) survey but with better time and frequency channel resolution. This survey used a center frequency of 1382 MHz and a total bandwidth of 400 MHz split into 1024 channels. The receiver was not sensitive to the top 60 MHz of this band, giving an effective bandwidth of 340 MHz. Similar to the previous multibeam survey of Manchester et al. (2006), which used 8400 s integrations, each pointing was observed for 8600 s, giving a slightly better overall sensitivity from the larger integration time and larger effective bandwidth used (340 MHz vs 288 MHz). A more significant improvement was the increase in sensitivity to fast-spinning pulsars from the shorter sampling time (64 s vs 1 ms) and the narrower frequency channel widths (0.4 MHz vs 3 MHz) used. Fig. 2 of Ridley et al. (2013) shows the sensitivity curves for these two surveys for comparison. Our survey is much more sensitive to millisecond pulsars (MSPs), none of which have yet been discovered in the MCs.
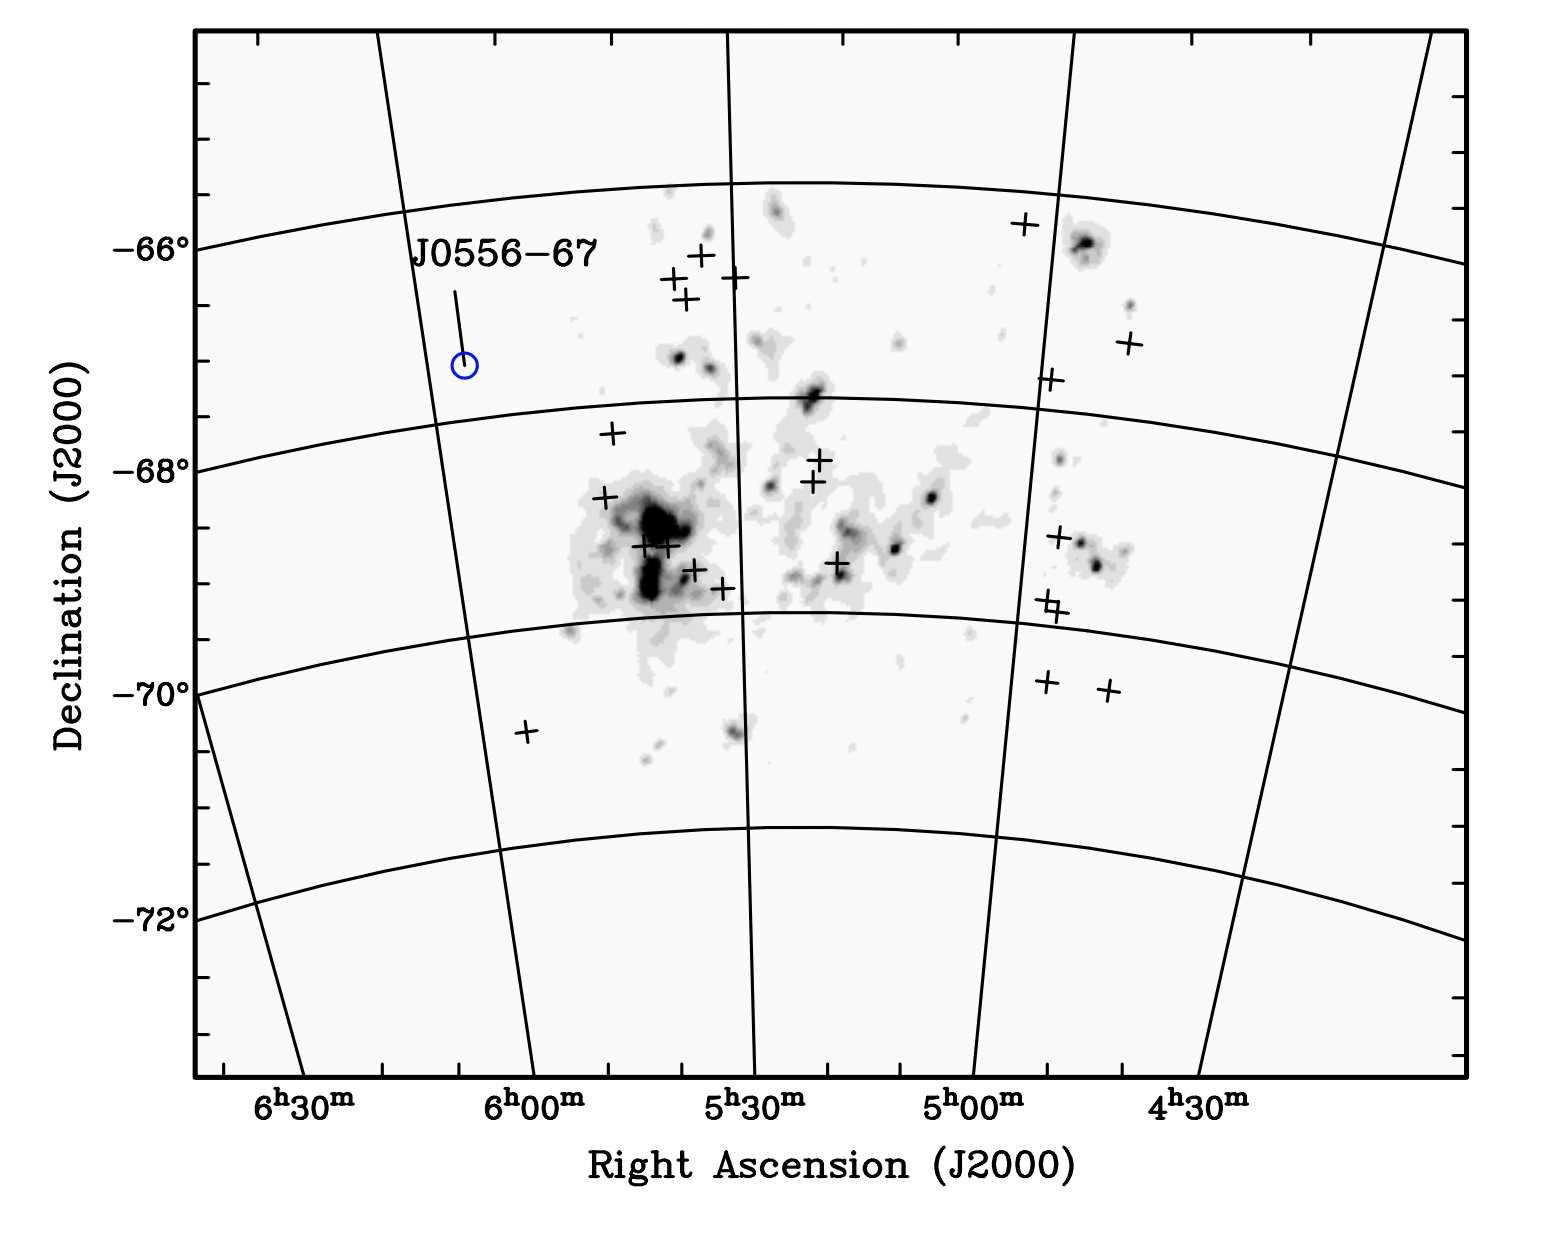
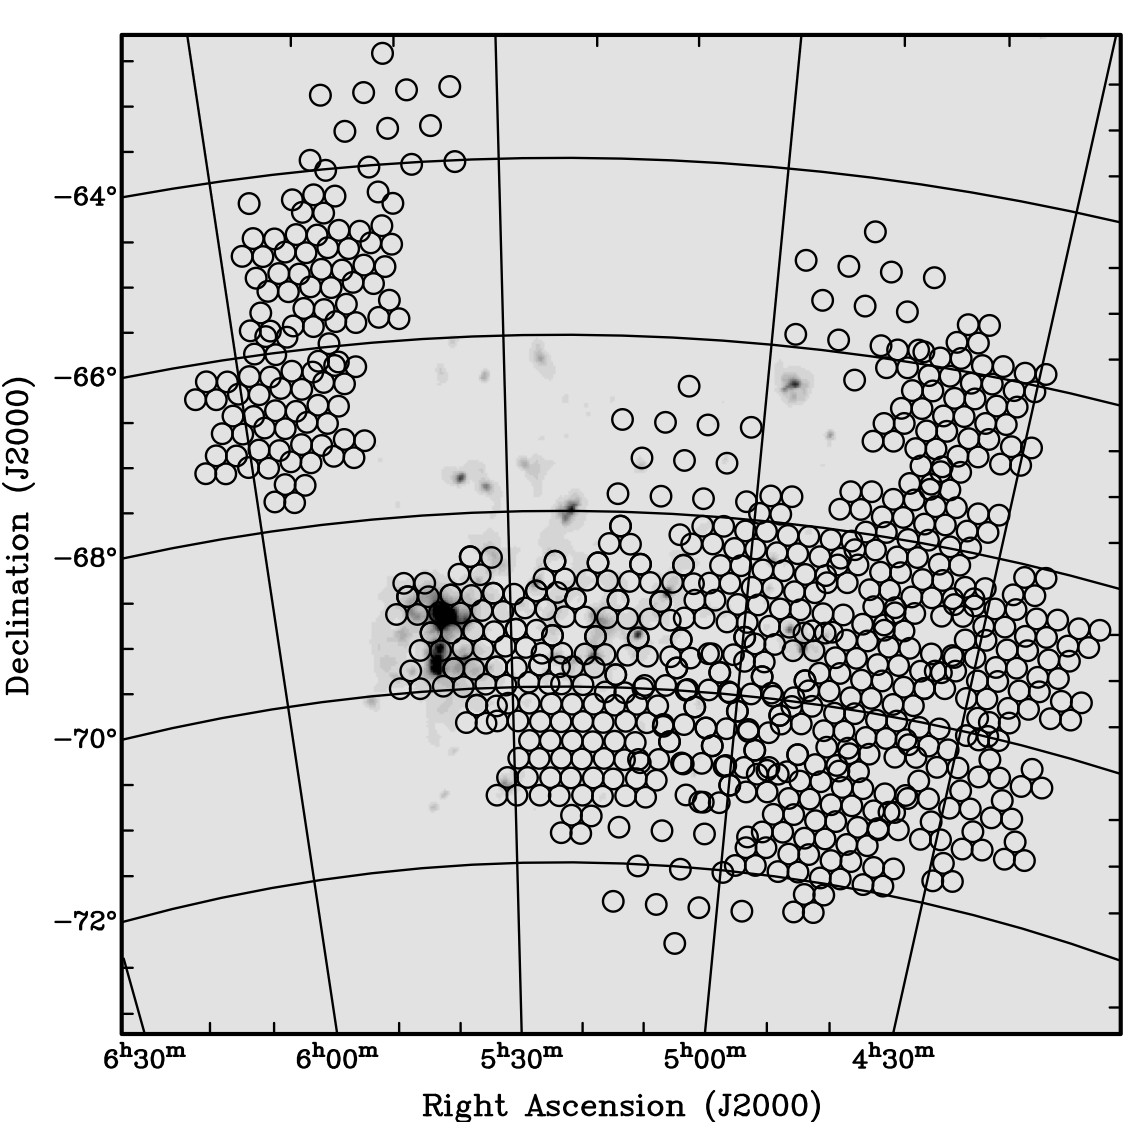
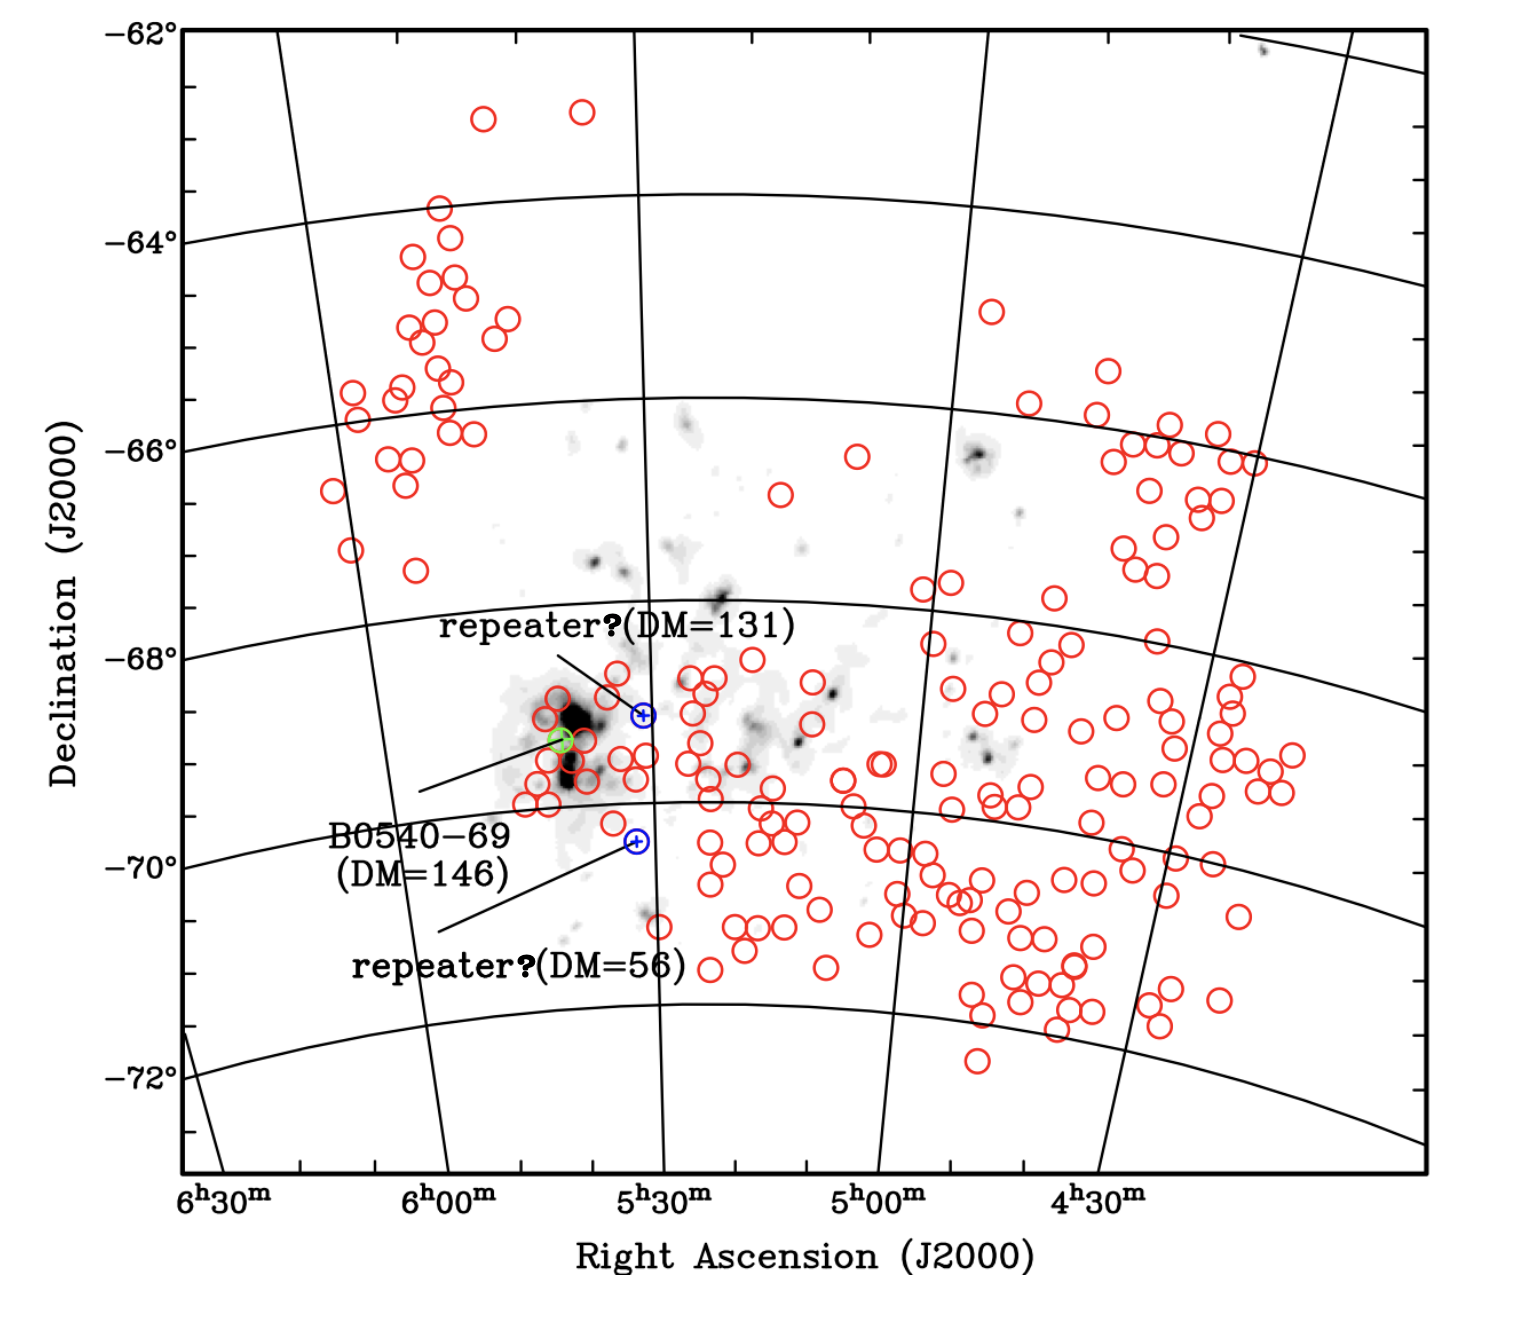
Ridley et al. (2013) discovered three new pulsars in the LMC within the initial 27.2% of the survey that had been observed as of 2010 (37 unique pointings, plus 3 repeat pointings, corresponding to 520 beams, of which 481 were unique beam positions). This brought the total number of known rotation powered pulsars in the LMC to 23 (see, e.g., Johnston et al. 2022 for a summary). Fig. 1 shows the locations of these pulsars in the LMC. Subsequent survey data were taken in 2017, which covered an additional 12.5% of the total survey area, (17 pointings, corresponding to 221 additional beams). We report on these newer data in this work. Thus, to date 39.7% of the planned LMC survey pointings have been observed and processed (54 unique pointings out of 136 total planned pointings). Fig. 2 shows this survey coverage of the LMC.
3 Data Processing
We searched for periodic signals with several processing passes through all of the survey data collected to date using different DM search ranges and acceleration trials (the latter to account for binary motion). The several passes were done so that we could conduct independent searches with two different software packages and also explore different regions of parameters space in each search. In the first processing pass, we used sigproc333http://sigproc.sourceforge.net (Lorimer 2011), a widely-used package for pulsar data analysis (see also Cordes & McLaughlin 2003 and Rane et al. 2016, for example). We searched for signals out to a maximum DM of 800 cm-3 pc with an effective sampling time of 128 s (pairs of time samples were combined, reducing the time resolution by factor of 2). No acceleration search was performed in this processing pass. The second pass with sigproc searched DMs between 70 and 300 cm-3 pc, a range expected for most LMC pulsars given the DM distribution of the pulsars discovered to date. Only the first 1/8 of each integration was searched, which reduced the raw sensitivity by about a factor of 3. In this pass, we again combined pairs of samples to give a 128 s effective time resolution, and we conducted an acceleration search with acceleration trials in the range of m s-2. The reduced data length and limited range in DM and acceleration we searched in this pass were needed in order to make the processing tractable. Finally, for the third pass, we used the presto444https://www.cv.nrao.edu/~sransom/presto search and analysis package (Ransom 2001; Ransom et al. 2002; Ransom 2011). The data were first inspected for radio-frequency-interference (RFI) using the rfifind package, and corrupted channels and time samples were masked (this typically amounted a few percent or less of each observation, with the worst case being 13%). The time samples were combined into pairs (as above), giving an effective sampling time of 128 s. The data were then dedispersed at 5404 DM trials (with variable spacing) in the DM range 0 to 3000 cm-3 pc. Each dedispersed time series was Fourier transformed, and the power spectrum was harmonically summed with up to 8 harmonics. Candidate signals were then dedispersed and folded with DMs and periods near the candidate values to look for clear pulsar signals. In this search no acceleration trials were performed.
Crawford et al. (2016) conducted a single pulse search of the 40 pointings from the LMC survey taken as of 2010 (which includes 3 repeat pointings).555Note that this set of 40 pointings (520 beams) processed for single pulses is quoted as being 20% of the survey by Crawford et al. (2016). However, this total set of pointings in the percentage calculation includes the full set of 209 LMC and SMC pointigs covered by Manchester et al. (2006), not just the 136 LMC pointings, and also includes the three repeat pointings. Including only the 37 unique pointings as a fraction of the 136 LMC survey pointings gives 27.2%, which is the same fraction of the LMC observed and processed by Ridley et al. (2013). This was done with sigproc, and the data were searched out to a DM of 5000 cm-3 pc. No new signals were found in this analysis. However, sigproc is not optimized for single-pulse detection (Keane & Petroff, 2015; Zhang et al., 2019), and weaker pulses may have been missed in this processing (Keane et al., 2019). We therefore reprocessed these earlier data and the new data taken in 2017 with a new pipeline based on the heimdall666https://sourceforge.net/projects/heimdall-astro single-pulse search code (Barsdell, 2012) in which the candidates are passed through the deep-learning filters developed as part of the fetch777https://github.com/devanshkv/fetch (Agarwal et al., 2020) package.
Our single-pulse data processing was divided into two phases. First, we used heimdall to search transient signals at DMs between 50 and 10000 cm-3 pc. In the direction of LMC, the maximum Galactic DM contribution is predicted to be cm-3 pc in both the NE2001 (Cordes & Lazio 2002) and YMW16 models (Yao et al. 2017). Hence, the minimum DM in our single pulse search was chosen to be 50 cm-3 pc in order to avoid Galactic sources as well as to minimize any RFI effects, which are generally stronger at smaller DMs. heimdall produced single pulse candidates for each DM trial using boxcar matched filter widths up to 512 samples in each de-dispersed time series (corresponding to a maximum width of 33 ms with our 64 s sampling), and we retained candidates with a S/N of at least 7. These candidates were then passed to fetch, a neural network classifier developed for the classification of single pulse candidates to distinguish between RFI and astrophysical signals. RFI can produce a large number of candidates that have similar characteristics to astrophysical signals. fetch assigned a probability to each detected candidate of being a real, astrophysical signal, and we selected candidates for consideration which had a fetch-assigned probability of at least 90%. As a further check, each of these selected candidates was also individually inspected visually to ensure that there were no obvious RFI signals that were incorrectly classified by fetch as real.
4 Results and Discussion
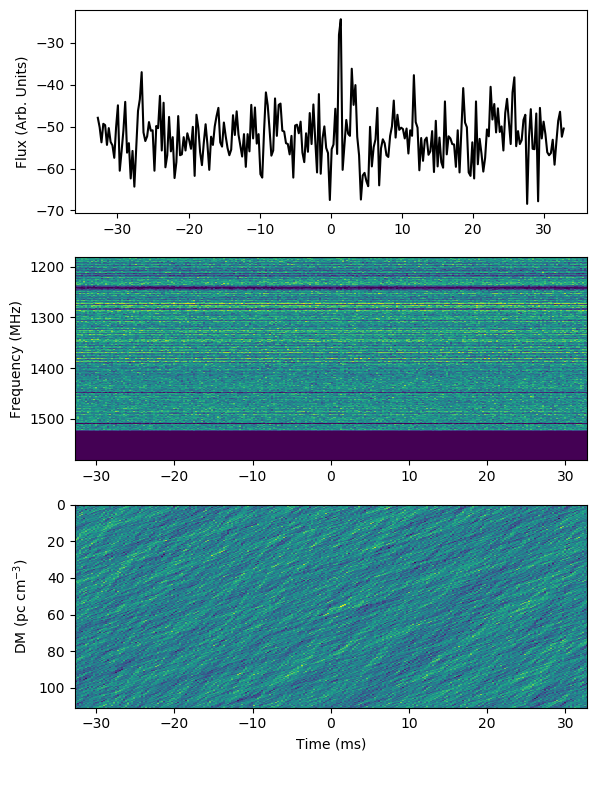
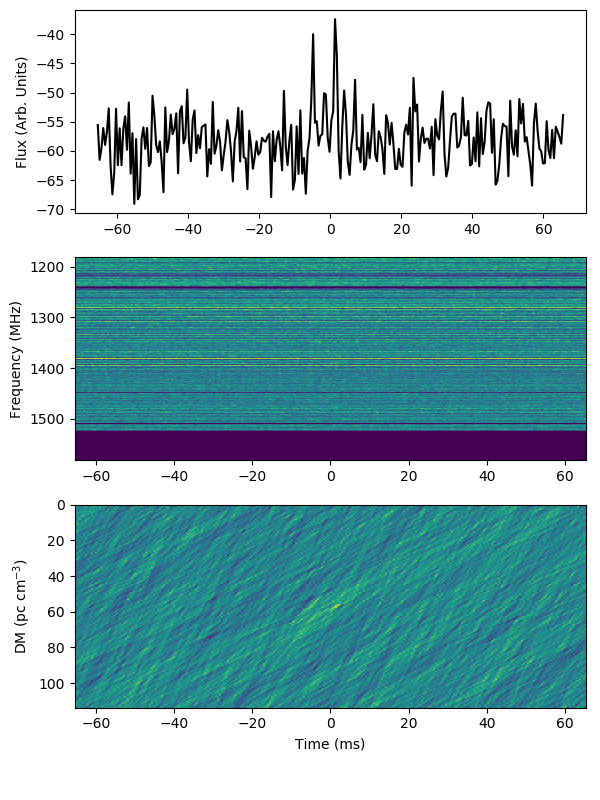
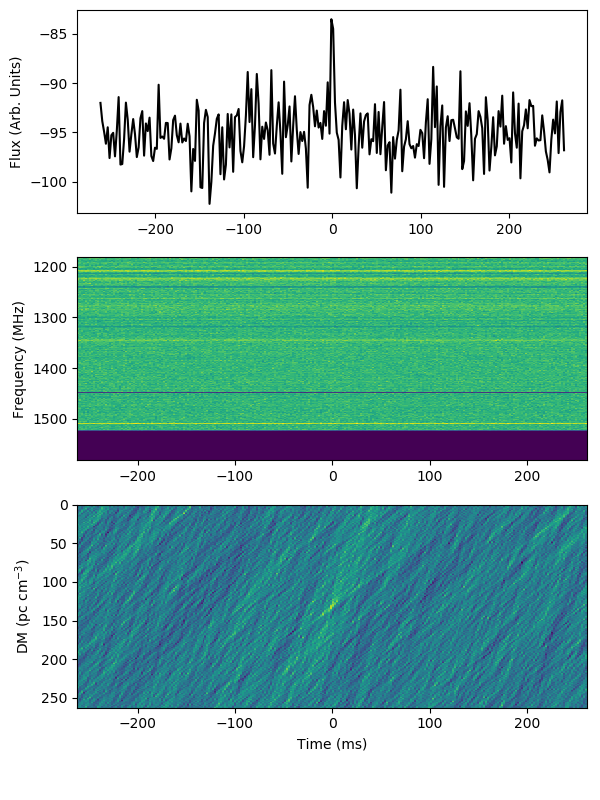
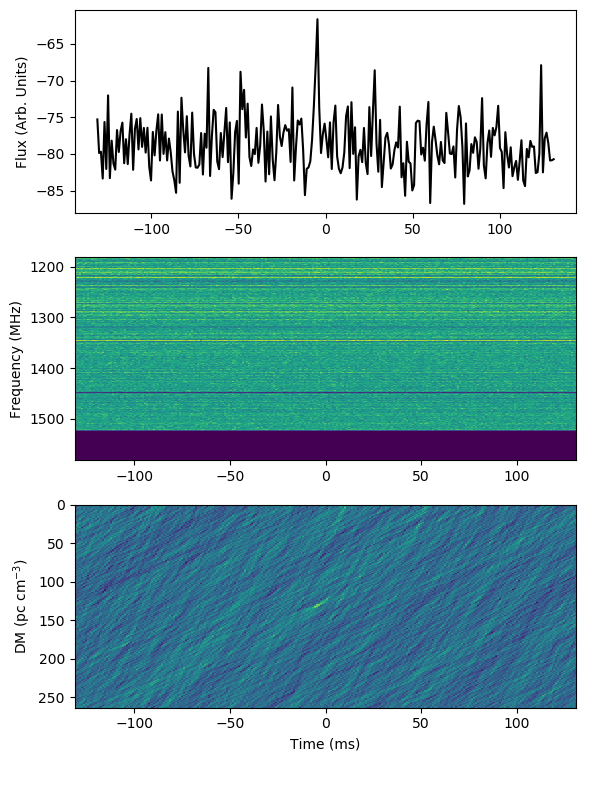
We detected a total of 229 single-pulse candidates in 187 survey beams that met our selection criteria. The number of candidates produced by HEIMDALL for the observed survey beams is . This is much greater than the number of FETCH candidates which passed our criteria with a probability of 0.9, which is 229, including 9 pulses from B0549-69. Thus, the classifier is useful in reducing this huge number of candidates. Two of these beams had two detected signals each which occurred at the same DM (56 and 131 cm-3 pc, respectively), suggesting that they could be repeating sources (see Figs. 3 and 4). Both of the DMs of these possible repeaters are consistent with the DM range seen for other pulsars in the LMC (see Table 2 of Ridley et al. 2013), indicating that if they are real, then they are originating from the LMC and not the foreground. We searched these two beams for accelerated pulsars using PRESTO periodicity searches at these specific DMs, but we detected no signals.
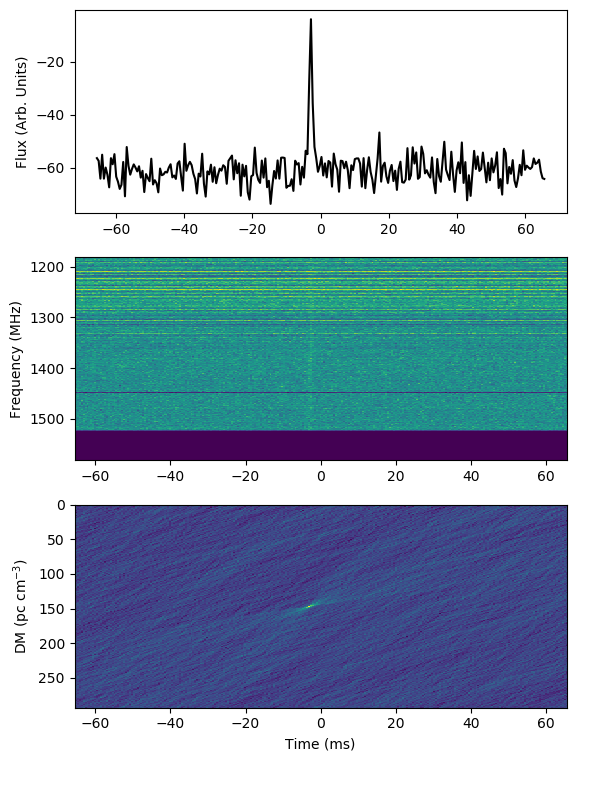
We also clearly detected 9 pulses from the known giant pulse emitting pulsar PSR B054069 (Johnston & Romani, 2003). These were among the strongest detections in our sample and were clearly identified by fetch as being real with high probabilities. Fig. 5 shows the strongest of these 9 detections. Of the 10 total single-pulse candidates with S/N 7 from B0549-69 found by HEIMDALL, 9 were identified by FETCH with probability 0.9, which is our threshold for consideration as real. The remaining pulse had a probability of 0.8. FETCH was able to reliably identify almost all of the pulses above S/N of 7. No survey beams were coincident with PSR J05296652, the other LMC pulsar known to be detectable in single pulses (Crawford et al., 2013) (Fig. 2). The properties of the pulses from these two possible repeating sources and the pulses detected from PSR B054069 are listed in Table 1.
There were 220 unidentified pulses that remained after excluding the 9 pulses detected from PSR B054069. Yang et al. (2021) reported 81 new FRB candidates discovered by reprocessing archival data from the Parkes multibeam survey. None of their candidates are spatially coincident with the LMC, which could have provided possible confirmations of some of our candidates through repeat detections.
Fig. 6 shows a map of the 187 beams where at least one single-pulse candidate was identified by fetch with at least a 90% probability of being real. Note that this represents more than 25% of the total number of beams in the survey observed and processed to date. The green and blue circles in Fig. 6 indicate the positions of PSR B0540–69 and the two possible repeater candidates, respectively. Like PSR B0540–69, the possible repeater candidates also reside in the 30 Doradus star forming region.
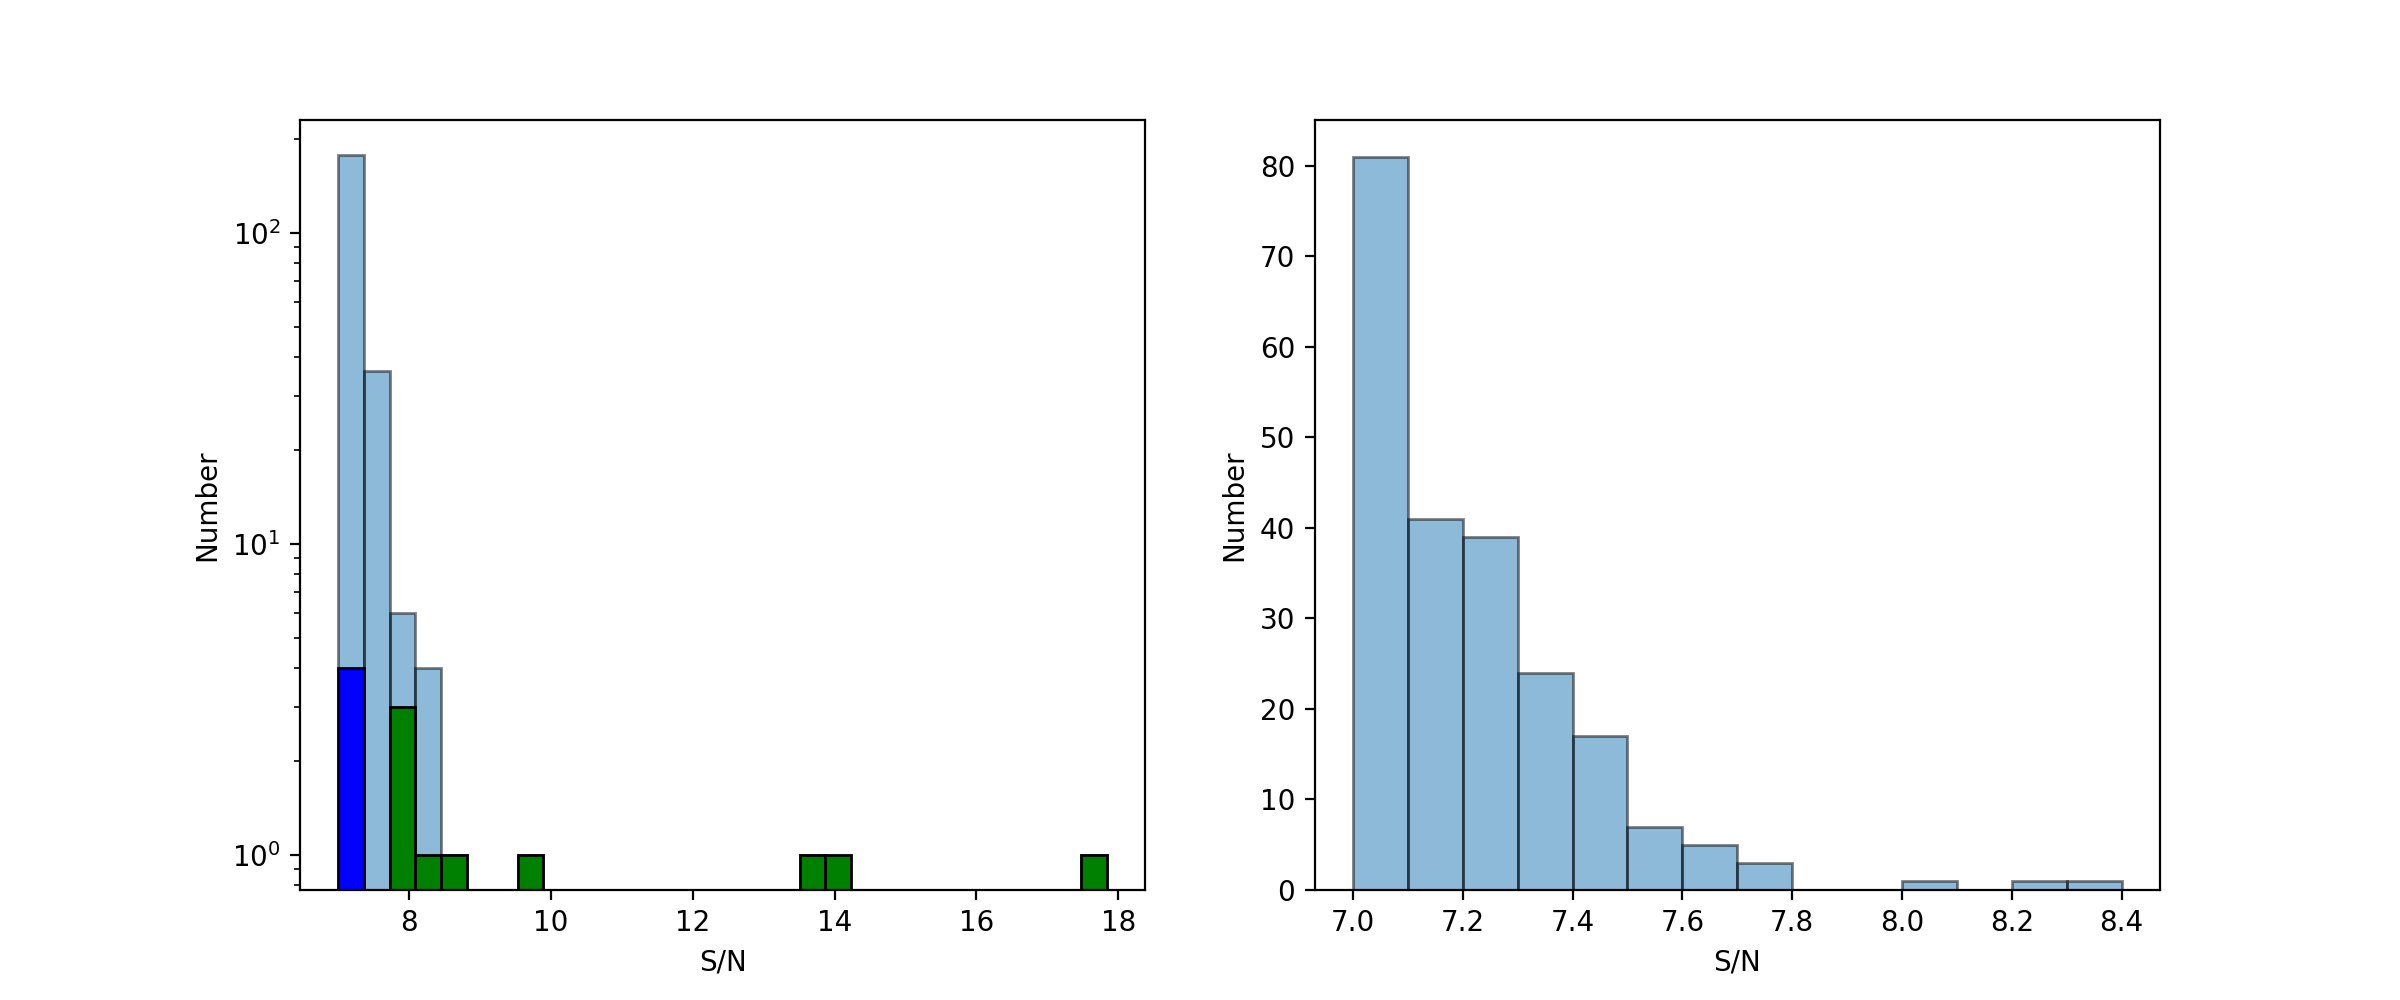
A histogram of the S/N distribution of all 229 detected pulses is shown in Fig. 7 (left). The candidates from the possible repeaters (dark blue bars) and from PSR B054069 (green bars) are included. Excluding the 9 known pulses from PSR B054069 leaves all but 3 of the 220 remaining candidates (98.6%) with a S/N below 8, including the two possible repeating sources. This is illustrated further in Fig. 7 (right). The cutoff found in the histogram above about 7.8 indicates that there are no strong detections other than giant pulses from PSR B0540–69. This calls into question whether many of these weaker pulses are in fact astrophysical in origin, despite their promising morphologies.
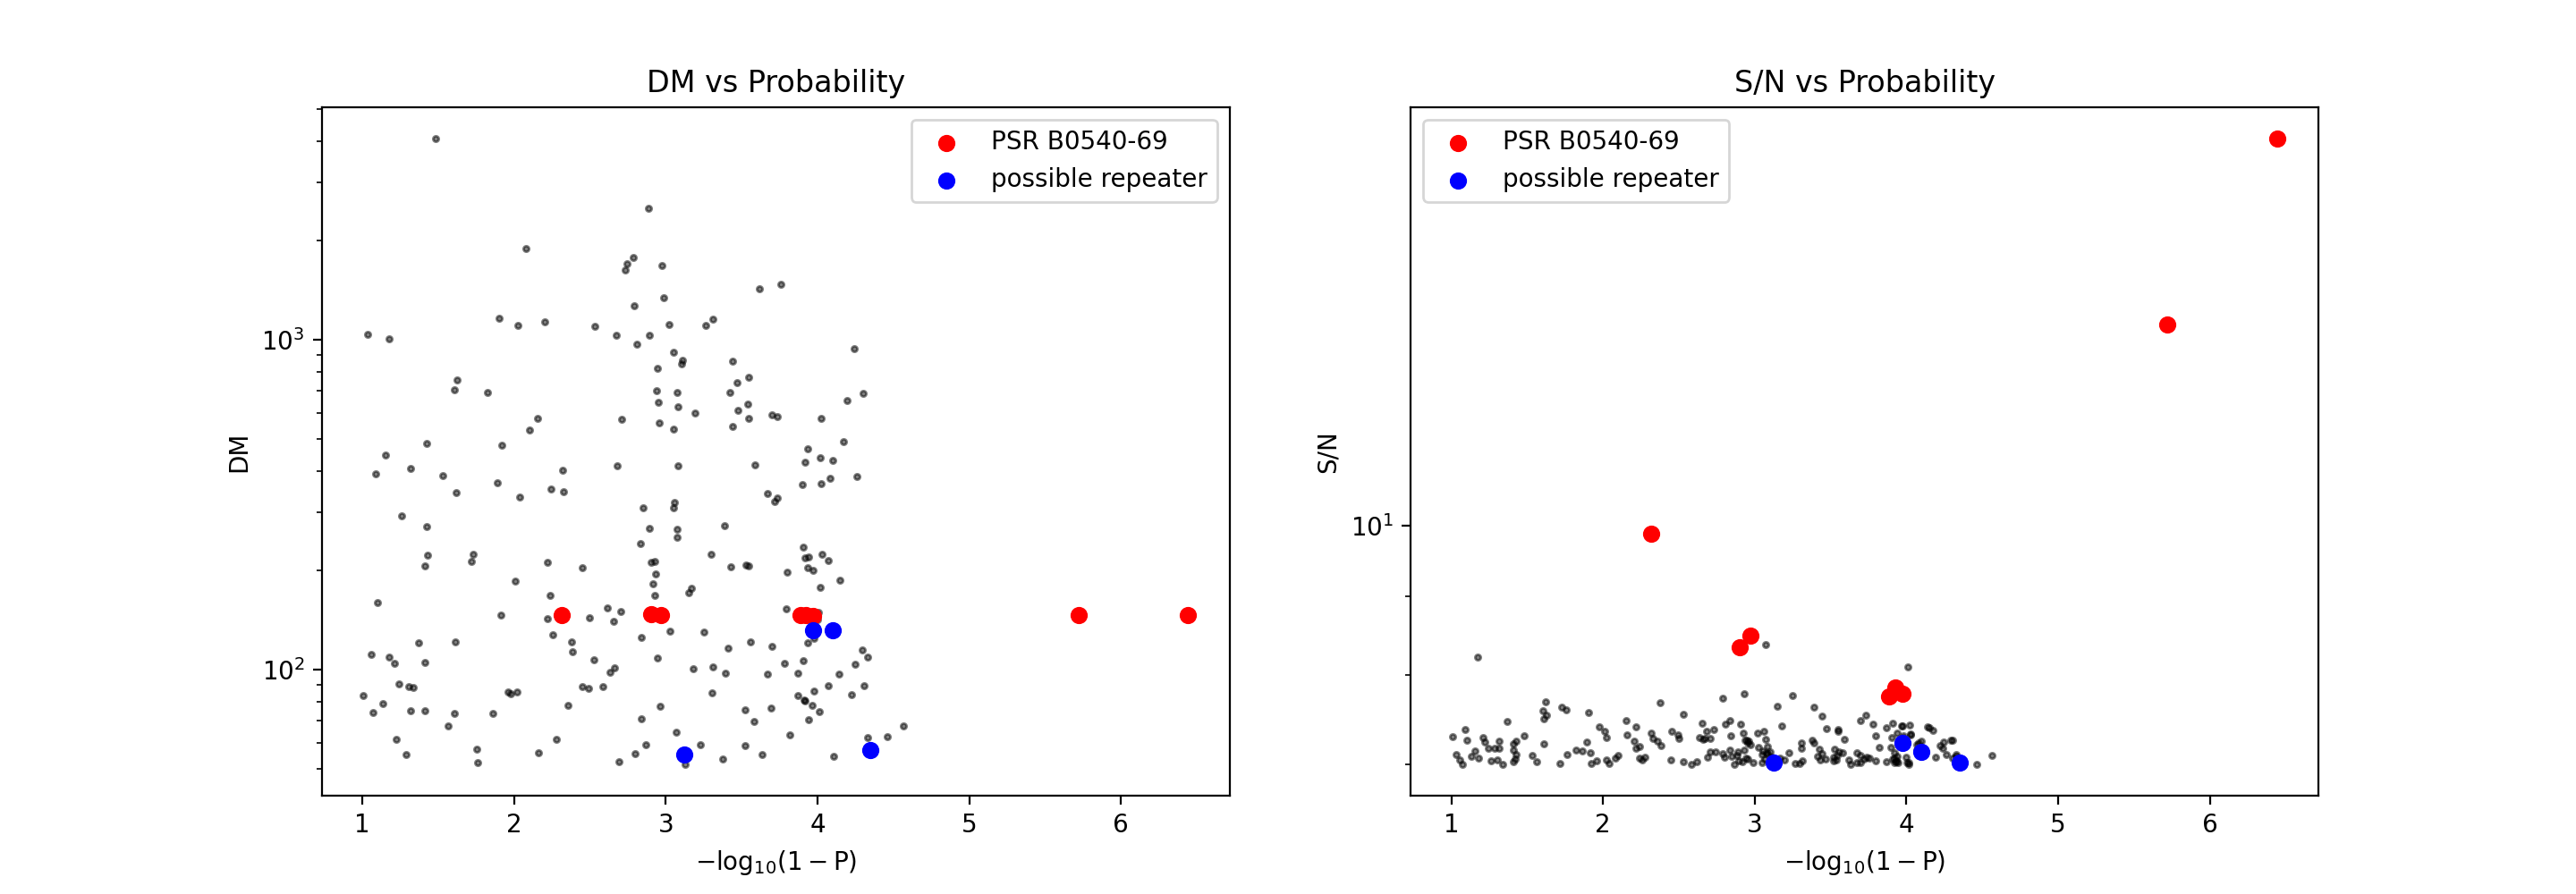
Fig. 8 shows DM and the fetch-assigned probability of being real (left) and S/N and probability (right). In these plots, the probability is restated in terms of its logarithm, , in order to show the range more clearly. Five of the eight signals from PSR B054069 and 3 of the 4 signals from the possible repeaters have slightly higher probabilities than bulk of the detections (). However, the signals from PSR B054069 in Fig. 8 (right) show that a higher S/N for a real signal does not necessarily lead to a higher fetch probability. The candidates are generally distributed uniformly as a function of the log of the probability, which indicates that there is no clear relationship between DM or S/N and the logarithm of the probability. Most of candidates identified by fetch as having a high probability of being real were nevertheless weak (S/N ). A visual check of these candidates suggests that they appear real, and fetch also clearly identified the 9 giant pulses from PSR B054069 as being real (i.e., with probability exceeding 99% in all cases; see Table 1), thus confirming the ability of fetch to accurately identify real pulses.
However, in a survey conducted with Arecibo, Perera et al. (2022) searched for single-pulse candidates with heimdall and fetch over negative DM values in order to assess whether spurious, non-astrophysical candidates could be produced which mimicked real candidates. We conducted a similar single-pulse search with negative DM values ranging between 10000 and 50 cm-3 pc for one our survey pointings, corresponding to 13 beam positions. This processing resulted in a large number of weak, artificial candidates being detected, which exceeded the number of candidates produced in the positive DM search. As in the case of Perera et al. (2022), this suggests that many (if not all) of these low S/N candidates we detected in our search are actually likely to be artificial, non-astrophysical signals.
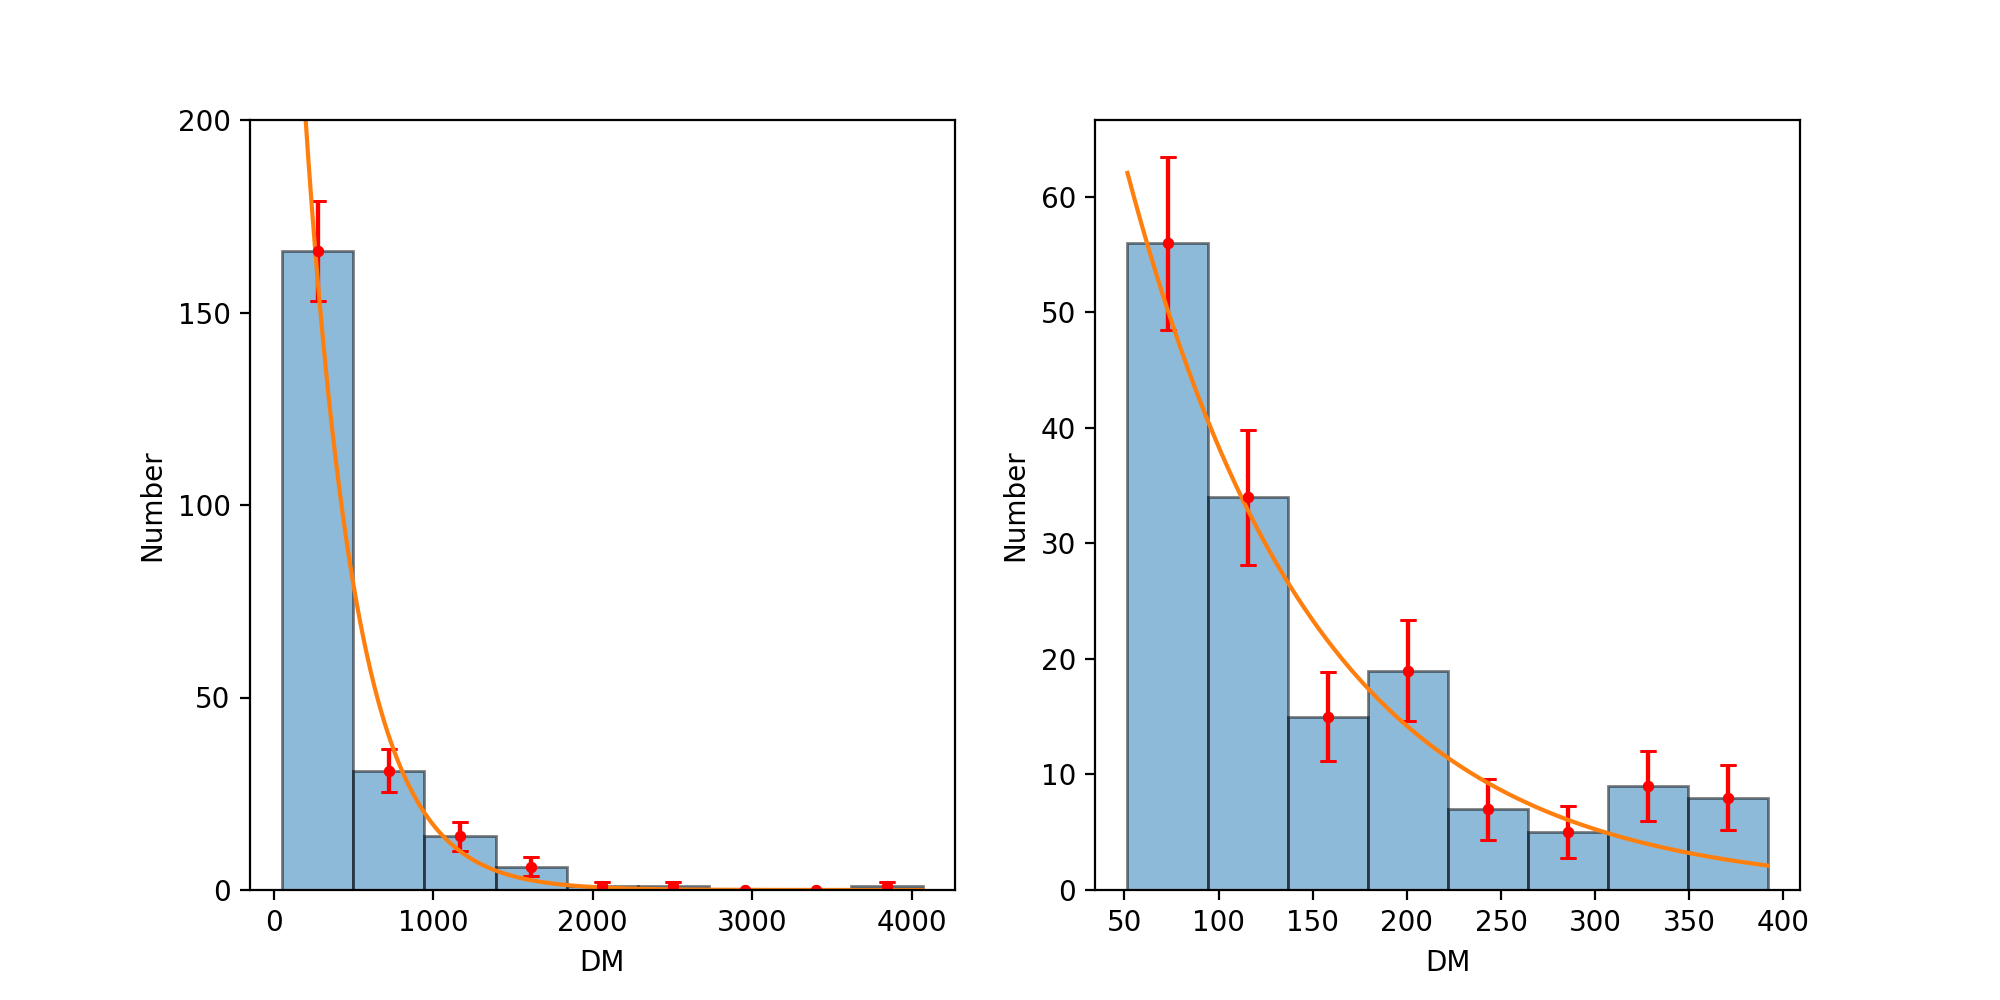
Histograms showing the DM distribution for the candidates identified by FETCH are shown in Fig. 9, with the panel on the right showing only a subset of signals with DMs between 50 and 400 cm-3 pc. This is the DM range expected for pulsars in the LMC given the currently known LMC pulsar population (the largest DM of a known LMC pulsar is 273 cm-3 pc; Ridley et al. 2013). The error bars were computed as the square root of the number of pulses in each bin, and the number of bins was determined according to the Sturges criterion, , where is the number of pulse events detected. Pulses from PSR B054069 were excluded from these histograms. The DMs of about half of the candidates we detected are larger than the highest DM in the known LMC pulsar population (273 cm-3 pc), and some single pulse candidates we identified had DM cm-3 pc, which is well above this range. If these signals are real, this suggests that they either come from the most distant objects in the LMC, or, more likely, that they are not real. Both DM distributions (the full sample and the subset) follow an exponential falloff as a function of DM (Fig. 9), , though not with the same fit parameters in each case. Table 2 shows the best-fit parameters with uncertainties. Integrating this best fit exponential falloff in the histogram for the subset of signals between 50 and 400 cm-3 pc gives an expected number of pulses above DM 1000 cm-3 pc of about 0.3 (i.e., less than 1). Our observed sample of 22 detections above this range is clearly not consistent with this expected number and supports the interpretation that these signals are not real. In Fig. 9 (right), the sample shows no clear excess of signals in the likely range of DM values for the LMC (i.e., 50 to 400 cm-3 pc). This also suggests that most of these signals are not likely to be real.
We estimated the probability of detecting two single pulses by chance in the same beam at the same DM with FETCH probability 0.9. The fitting equation and its parameters in the DM range of 50 - 400 pc cm-3 (see Table 2) give us the expected number of candidates per beam, which are 0.084 and 0.040 for DMs of 56 and 131 pc cm-3, respectively. From the Poisson distribution, the probabilities of finding chance repeat signals at these DMs are 0.32 and 0.08, respectively. Thus, these repeat events are not likely to occur by chance.
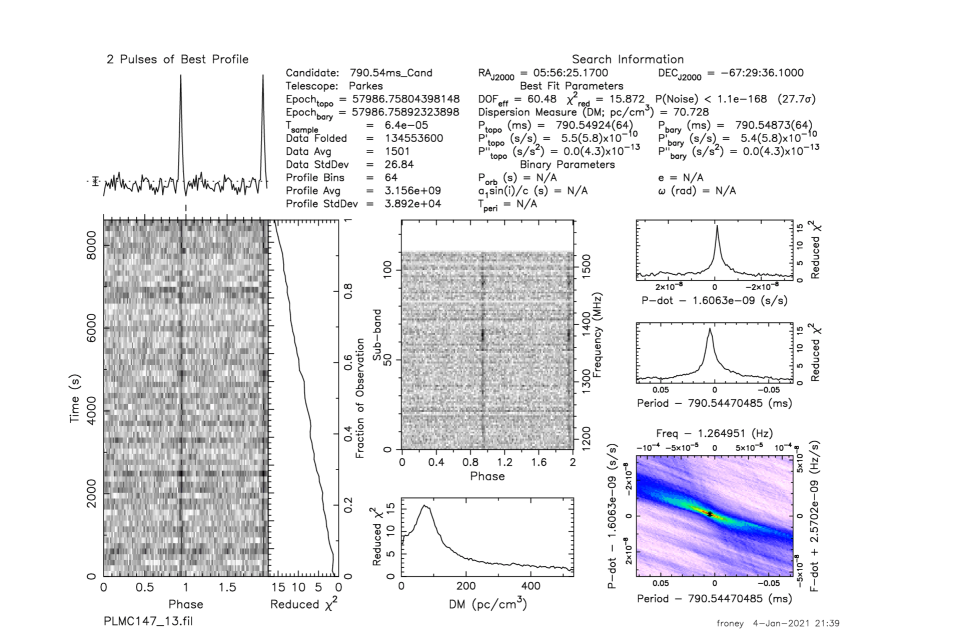
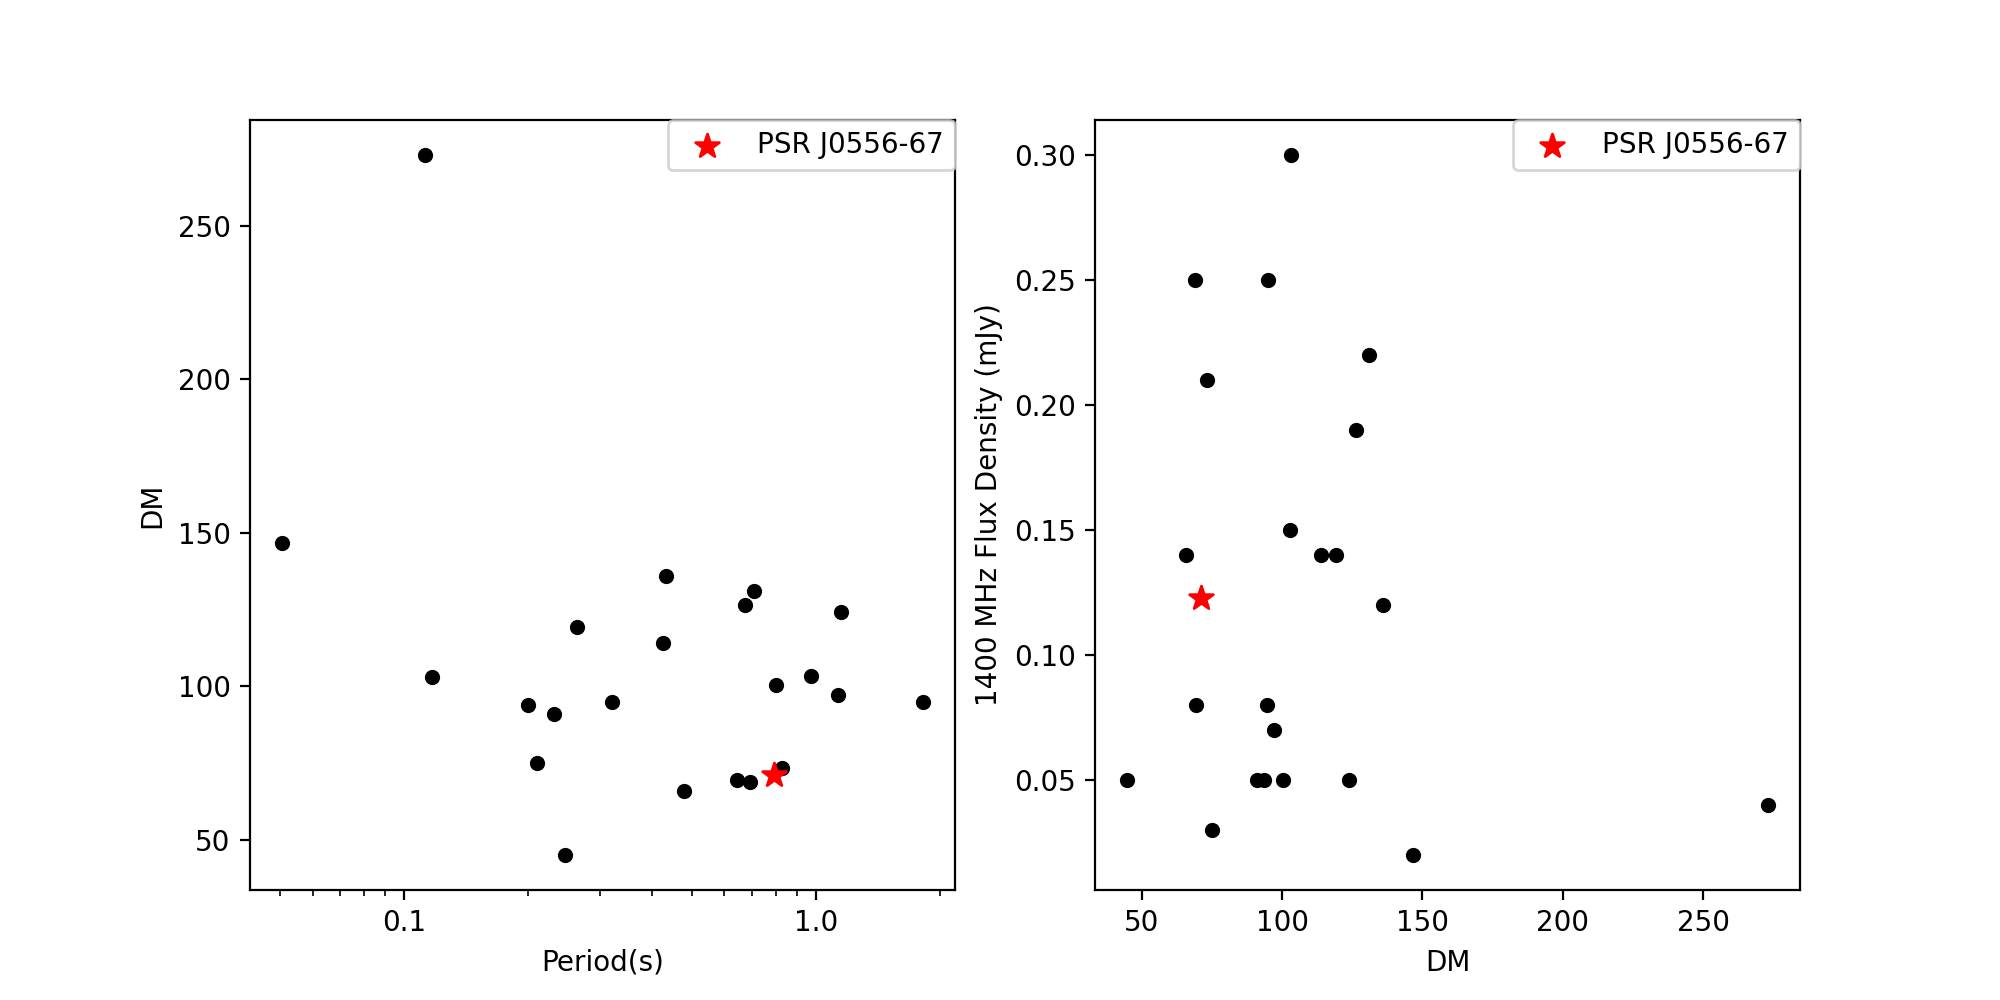
In our periodicity search, we have discovered a new pulsar in the LMC, PSR J055667 (Fig. 10; see also Fig. 1 for its position) in both the SIGPROC and PRESTO pipelines. This 791 ms period pulsar was found in survey data acquired after the publication of Ridley et al. (2013). Its DM of 71 cm-3 pc lies within the range of other pulsars discovered in the LMC. In the discovery observation, there is no significant measured period derivative (and hence no clear evidence of a binary motion), which is consistent with expectations for a canonical long-period pulsar. The position determination of PSR J055667 is accurate to about 7 arcmin from the nominal discovery position, corresponding to the radius of the Parkes discovery beam. We estimate a 1400 MHz flux density for the pulsar of mJy (Fig. 11) using Eq. 2 in Ridley et al. (2013), but we do not yet have timing information for this pulsar. No other new pulsars were found in our search, though we did find a number of weak periodicity candidates that could be confirmed in future observations.
5 Conclusions
We report on a survey of the LMC for pulsars and fast transients using the Parkes multibeam receiver with high time and frequency resolution that was initiated by Ridley et al. (2013). To date we have observed and processed 40% of the total planned LMC survey area defined by the Manchester et al. (2006) survey coverage. We have conducted both new periodicity and single-pulse searches of all of the data acquired to date. We detected 229 single-pulse candidates above a S/N of 7 having a fetch-assigned probability of being real exceeding 90%. Of these, 9 pulses were from the known giant radio pulse emitting pulsar PSR B054069 (see Table 1), and 220 were from unidentified sources. Two possibly repeating single-pulse sources were detected at DMs of 56 and 131 cm-3 pc (see Table 1), which is in the range expected for the LMC. However, a single-pulse search of negative DM values indicates that realistic, low S/N ( 8) candidates can be artificially produced. We conclude that the majority of our detected candidates are not likely to be real. The two possible repeating sources are also not definitively real, and future observations of these targets will be essential to claim real detections.
From an exponential fit to the DM histogram of single pulses detected with DMs between 50 and 400 cm-3 pc (a likely range for pulsars in the LMC), we would expect to find less than one instance of a signal above a DM of 1000 cm-3 pc (see Fig. 9). This is significantly smaller than the 22 candidates detected above DM = 1000 cm-3 pc and also suggests that those signals are likely not real. These high-DM signals appear no different qualitatively than the many lower-DM signals we found, which lends additional support to the conclusion that all or most of our detected signals are artificial despite their promising morphology.
In our periodicity search, we discovered one new pulsar in the LMC, PSR J055667, which has a spin period of 791 ms and a DM of 71 cm-3 pc. We estimate its flux density to be mJy. Its DM is consistent with the population of known LMC pulsars, and brings the total number of rotation-powered pulsars in the LMC (including the X-ray pulsar PSR J05376910) to 24. No timing information is yet available for this pulsar. We have discovered no new MSPs in our survey, and to date no MSPs have been discovered outside of our Galaxy.
To complete the remaining 60% of the survey area, we would require an additional 200 hr of observing time with the multibeam system at Parkes. This is unlikely to occur given that the MeerKAT telescope is slated to survey the LMC with better sensitivity than Parkes. However, future targeted survey observations of the 30 Doradus region of the LMC, where both PSRs B054069 and J05376910 reside (as well as our two possibly repeating single pulse sources), may be productive given the apparently high concentration of young pulsars there. Future observations with Parkes with its more sensitive ultra-wide-bandwith low-frequency receiver (spanning frequencies between 700 MHz and 4 GHz) (Hobbs et al. 2020) or observations from the Transients and Pulsars with MeerKAT (TRAPUM) project888http://www.trapum.org (Stappers & Kramer 2016; Bailes et al. 2020) may be able to confirm some of our weak periodicity candidates or single-pulse candidates we detected.
| Name | Beam RA (J2000) | Beam Dec (J2000) | DM | S/N | fetch Probability |
| (hh:mm:ss) | (dd:mm:ss) | (cm-3 pc) | |||
| Repeater? | 05:20:30.0 | 71:14:09.4 | 55.4 | 7.02 | 0.9992490 |
| 56.9 | 7.02 | 0.9999553 | |||
| Repeater? | 05:30:57.8 | 69:08:04.0 | 131.8 | 7.13 | 0.9999205 |
| 131.4 | 7.23 | 0.9998933 | |||
| PSR B054069 | 05:40:20.7 | 69:20:15.0 | 146.4 | 7.75 | 0.9998703 |
| 145.5 | 7.78 | 0.9998932 | |||
| 146.4 | 7.86 | 0.9998814 | |||
| 146.9 | 8.34 | 0.9987482 | |||
| 146.4 | 8.49 | 0.9989248 | |||
| 146.4 | 9.88 | 0.9951752 | |||
| 146.4 | 13.51 | 0.9999981 | |||
| 146.0 | 13.884 | 1 | |||
| 146.4 | 17.84 | 0.9999996 |
| DM Range | ||
|---|---|---|
| DM cm-3 pc (full DM range) | ||
| DM cm-3 pc (LMC expected only) |
References
- Agarwal et al. (2020) Agarwal, D., Aggarwal, K., Burke-Spolaor, S., Lorimer, D. R., & Garver-Daniels, N. 2020, MNRAS, 497, 1661, doi: 10.1093/mnras/staa1856
- Archibald et al. (2009) Archibald, A. M., Stairs, I. H., Ransom, S. M., et al. 2009, Science, 324, 1411, doi: 10.1126/science.1172740
- Arzoumanian et al. (2020) Arzoumanian, Z., Baker, P. T., Blumer, H., et al. 2020, ApJ, 905, L34, doi: 10.3847/2041-8213/abd401
- Badenes et al. (2010) Badenes, C., Maoz, D., & Draine, B. T. 2010, MNRAS, 407, 1301, doi: 10.1111/j.1365-2966.2010.17023.x
- Bailes et al. (2020) Bailes, M., Jameson, A., Abbate, F., et al. 2020, PASA, 37, e028, doi: 10.1017/pasa.2020.19
- Barsdell (2012) Barsdell, B. R. 2012, PhD thesis, Swinburne University of Technology
- Burke-Spolaor (2015) Burke-Spolaor, S. 2015, arXiv e-prints, arXiv:1511.07869. https://arxiv.org/abs/1511.07869
- Cordes & Lazio (2002) Cordes, J. M., & Lazio, T. J. W. 2002, arXiv e-prints, astro. https://arxiv.org/abs/astro-ph/0207156
- Cordes & McLaughlin (2003) Cordes, J. M., & McLaughlin, M. A. 2003, ApJ, 596, 1142, doi: 10.1086/378231
- Crawford et al. (2013) Crawford, F., Altemose, D., Li, H., & Lorimer, D. R. 2013, ApJ, 762, 97, doi: 10.1088/0004-637X/762/2/97
- Crawford et al. (2016) Crawford, F., Rane, A., Tran, L., et al. 2016, MNRAS, 460, 3370, doi: 10.1093/mnras/stw1233
- Geyer et al. (2021) Geyer, M., Serylak, M., Abbate, F., et al. 2021, arXiv e-prints, arXiv:2105.09096. https://arxiv.org/abs/2105.09096
- Gooch (1996) Gooch, R. 1996, in Astronomical Society of the Pacific Conference Series, Vol. 101, Astronomical Data Analysis Software and Systems V, ed. G. H. Jacoby & J. Barnes, 80
- Grimm et al. (2003) Grimm, H. J., Gilfanov, M., & Sunyaev, R. 2003, MNRAS, 339, 793, doi: 10.1046/j.1365-8711.2003.06224.x
- Hill et al. (1995) Hill, V., Andrievsky, S., & Spite, M. 1995, A&A, 293, 347
- Hobbs et al. (2020) Hobbs, G., Manchester, R. N., Dunning, A., et al. 2020, PASA, 37, e012, doi: 10.1017/pasa.2020.2
- Johnston et al. (1996) Johnston, S., Manchester, R. N., Lyne, A. G., et al. 1996, MNRAS, 279, 1026, doi: 10.1093/mnras/279.3.1026
- Johnston & Romani (2003) Johnston, S., & Romani, R. W. 2003, ApJ, 590, L95, doi: 10.1086/376826
- Johnston et al. (2022) Johnston, S., Parthasarathy, A., Main, R. A., et al. 2022, MNRAS, 509, 5209, doi: 10.1093/mnras/stab3360
- Kaspi et al. (1994) Kaspi, V. M., Johnston, S., Bell, J. F., et al. 1994, ApJ, 423, L43, doi: 10.1086/187231
- Kaspi et al. (1996) Kaspi, V. M., Tauris, T. M., & Manchester, R. N. 1996, ApJ, 459, 717, doi: 10.1086/176936
- Keane et al. (2019) Keane, E. F., Lorimer, D. R., & Crawford, F. 2019, Research Notes of the American Astronomical Society, 3, 41, doi: 10.3847/2515-5172/ab0a04
- Keane & Petroff (2015) Keane, E. F., & Petroff, E. 2015, MNRAS, 447, 2852, doi: 10.1093/mnras/stu2650
- Keith et al. (2010) Keith, M. J., Jameson, A., van Straten, W., et al. 2010, MNRAS, 409, 619, doi: 10.1111/j.1365-2966.2010.17325.x
- Kramer et al. (2021) Kramer, M., Stairs, I. H., Manchester, R. N., et al. 2021, Physical Review X, 11, 041050, doi: 10.1103/PhysRevX.11.041050
- Lee et al. (2008) Lee, K. J., Jenet, F. A., & Price, R. H. 2008, ApJ, 685, 1304, doi: 10.1086/591080
- Liu et al. (2005) Liu, Q. Z., van Paradijs, J., & van den Heuvel, E. P. J. 2005, A&A, 442, 1135, doi: 10.1051/0004-6361:20053718
- Lorimer (2011) Lorimer, D. R. 2011, SIGPROC: Pulsar Signal Processing Programs. http://ascl.net/1107.016
- Lorimer et al. (2007) Lorimer, D. R., Bailes, M., McLaughlin, M. A., Narkevic, D. J., & Crawford, F. 2007, Science, 318, 777, doi: 10.1126/science.1147532
- Lyutikov & Thompson (2005) Lyutikov, M., & Thompson, C. 2005, ApJ, 634, 1223, doi: 10.1086/432252
- Manchester et al. (2006) Manchester, R. N., Fan, G., Lyne, A. G., Kaspi, V. M., & Crawford, F. 2006, ApJ, 649, 235, doi: 10.1086/505461
- Manchester et al. (2005) Manchester, R. N., Hobbs, G. B., Teoh, A., & Hobbs, M. 2005, AJ, 129, 1993, doi: 10.1086/428488
- Manchester et al. (1993) Manchester, R. N., Mar, D. P., Lyne, A. G., Kaspi, V. M., & Johnston, S. 1993, ApJ, 403, L29, doi: 10.1086/186714
- Marshall et al. (1998) Marshall, F. E., Gotthelf, E. V., Zhang, W., Middleditch, J., & Wang, Q. D. 1998, ApJ, 499, L179, doi: 10.1086/311381
- McLaughlin et al. (2006) McLaughlin, M. A., Lyne, A. G., Lorimer, D. R., et al. 2006, Nature, 439, 817, doi: 10.1038/nature04440
- Melatos et al. (1995) Melatos, A., Johnston, S., & Melrose, D. B. 1995, MNRAS, 275, 381, doi: 10.1093/mnras/275.2.381
- Miville-Deschênes & Lagache (2005) Miville-Deschênes, M.-A., & Lagache, G. 2005, ApJS, 157, 302, doi: 10.1086/427938
- Perera et al. (2022) Perera, B. B. P., Smith, A. J., Vaddi, S., et al. 2022, MNRAS, 509, 1929, doi: 10.1093/mnras/stab3153
- Pietrzyński et al. (2013) Pietrzyński, G., Graczyk, D., Gieren, W., et al. 2013, Nature, 495, 76, doi: 10.1038/nature11878
- Rane et al. (2016) Rane, A., Lorimer, D. R., Bates, S. D., et al. 2016, MNRAS, 455, 2207, doi: 10.1093/mnras/stv2404
- Ransom (2011) Ransom, S. 2011, PRESTO: PulsaR Exploration and Search TOolkit. http://ascl.net/1107.017
- Ransom (2001) Ransom, S. M. 2001, PhD thesis, Harvard University
- Ransom et al. (2002) Ransom, S. M., Eikenberry, S. S., & Middleditch, J. 2002, AJ, 124, 1788, doi: 10.1086/342285
- Ridley et al. (2013) Ridley, J. P., Crawford, F., Lorimer, D. R., et al. 2013, MNRAS, 433, 138, doi: 10.1093/mnras/stt709
- Seward et al. (1984) Seward, F. D., Harnden, F. R., J., & Helfand, D. J. 1984, ApJ, 287, L19, doi: 10.1086/184388
- Stappers & Kramer (2016) Stappers, B., & Kramer, M. 2016, in MeerKAT Science: On the Pathway to the SKA, 9
- Staveley-Smith et al. (1996) Staveley-Smith, L., Wilson, W. E., Bird, T. S., et al. 1996, PASA, 13, 243
- Yang et al. (2021) Yang, X., Zhang, S. B., Wang, J. S., et al. 2021, MNRAS, 507, 3238, doi: 10.1093/mnras/stab2275
- Yao et al. (2017) Yao, J. M., Manchester, R. N., & Wang, N. 2017, ApJ, 835, 29, doi: 10.3847/1538-4357/835/1/29
- Zhang et al. (2019) Zhang, S. B., Hobbs, G., Dai, S., et al. 2019, MNRAS, 484, L147, doi: 10.1093/mnrasl/slz023