Validating First-Principles Phonon Lifetimes via Inelastic Neutron Scattering
Abstract
Phonon lifetimes are a key component of quasiparticle theories of transport, yet first-principles lifetimes are rarely directly compared to inelastic neutron scattering (INS) results. Existing comparisons show discrepancies even at temperatures where perturbation theory is expected to be reliable. In this work, we demonstrate that the reciprocal space voxel (-voxel), which is the finite region in reciprocal space required in INS data analysis, must be explicitly accounted for within theory in order to draw a meaningful comparison. We demonstrate accurate predictions of peak widths of the scattering function when accounting for the -voxel in CaF2 and ThO2. Passing this test implies high fidelity of the phonon interactions and the approximations used to compute the Green’s function, serving as critical benchmark of theory, and indicating that other material properties should be accurately predicted; which we demonstrate for thermal conductivity.
Notice of Copyright This manuscript has been authored by UT-Battelle, LLC under Contract No. DE-AC05-00OR22725 with the U.S. Department of Energy. The United States Government retains and the publisher, by accepting the article for publication, acknowledges that the United States Government retains a non-exclusive, paid-up, irrevocable, world-wide license to publish or reproduce the published form of this manuscript, or allow others to do so, for United States Government purposes. The Department of Energy will provide public access to these results of federally sponsored research in accordance with the DOE Public Access Plan (http://energy.gov/downloads/doe-public-access-plan).
When computing anharmonic vibrational properties from first-principles, various approximations are employed, making it challenging to assess the integrity of any single observable as compared to experiment (e.g. thermal conductivity). Comparing a -space resolved observable (e.g. the scattering function) inherently provides a large number of comparisons, offering a very stringent test. While verification of the harmonic vibrational first-principles Hamiltonian is a standard practice, the same cannot be said for the anharmonic vibrational Hamiltonian and subsequent approximations which are used to compute observalbes. Anharmonic terms result in finite phonon lifetimes yielding finite widths of the peaks in the scattering function. A direct comparison of peak width between theory and INS is rare, and existing studies reveal anomalous discrepancies. A recent study on Si notes the large discrepancy between theory and experiment, leading the authors to only compare the relative change as a function of temperature[1]. A study on Al at high temperatures finds that perturbation theory does not reliably predict the experimental peak width, and their first-principles molecular dynamics simulations often differ from experiment by a factor of two[2].
Here we show that a proper comparison between the theoretical and experimental scattering function requires an explicit accounting for the finite region probed in reciprocal space, which is referred to as the -voxel. Due to the flux-limited nature of INS, there is a minimum region of -space which can be sampled while maintaining sufficient statistics, and therefore there is a minimum -voxel size below which INS cannot probe. Depending on the measurement type, the -voxel shape is either set by the instrument configuration (for triple-axis) or defined post measurement in the analysis of large volumes of data (for time-of-flight). This work will focus on the latter since the large data volumes allow for a more comprehensive assessment across many zones and with varying -voxels. While there is no formal standard for choosing a -voxel, it is typical to choose the -voxel size and shape based on the shape of the phonon dispersion surface; selecting a smaller dimension along directions with steeper dispersion and larger dimensions along directions with flatter dispersion.
In the present work, we demonstrate the critical role of the -voxel using two fluorite structured materials, ThO2 and CaF2, showing excellent agreement between peakwidths within a -voxel obtained from INS and computed from perturbation theory based on the first-principles phonons and cubic phonon interactions. Successful agreement validates both the anhmarmonic Hamiltonian and the level of theory being used to evaluate the scattering function. Given our successful peakwidth predictions, it is expected that thermal conductivity predicted using the same anhmarmonic Hamiltonian and the Boltzmann transport equation should faithfully describe experimental measurements in some temperature regime, which is demonstrated for CaF2 and ThO2.
Time-of-flight INS measurements were performed using the ARCS[3] and HYSPEC[4] instruments at the Spallation Neutron Source. Thermal conductivity measurements were made on single crystal ThO2 using spatial domain thermoreflectance (SDTR) via the methods described in [5]. First-principles calculations were performed using density functional theory (DFT) with the strongly constrained and appropriately normed (SCAN) functional[6], and phonons and cubic phonon interactions were computed using the lone and bundled irreducible derivative approaches[7, 8]. Detailed information about experimental and computational methods are included in supplemental material [8].
In order to compute the phonon linewidths and the one-phonon scattering function , the single-particle phonon Green’s function can be approximately evaluated using the phonons and cubic phonon interactions within leading order perturbation theory[9, 10] (see Eq. 2 in [8]). The scattering function is evaluated precisely at , but in INS experiments a finite -voxel must be chosen to provide sufficient counting statistics. This -voxel can be accounted for theoretically by integrating over the -voxel, resulting in
| (1) |
where is the reciprocal space volume of the -voxel. For clarity, we refer to as the -point scattering function and as the -voxel scattering function.
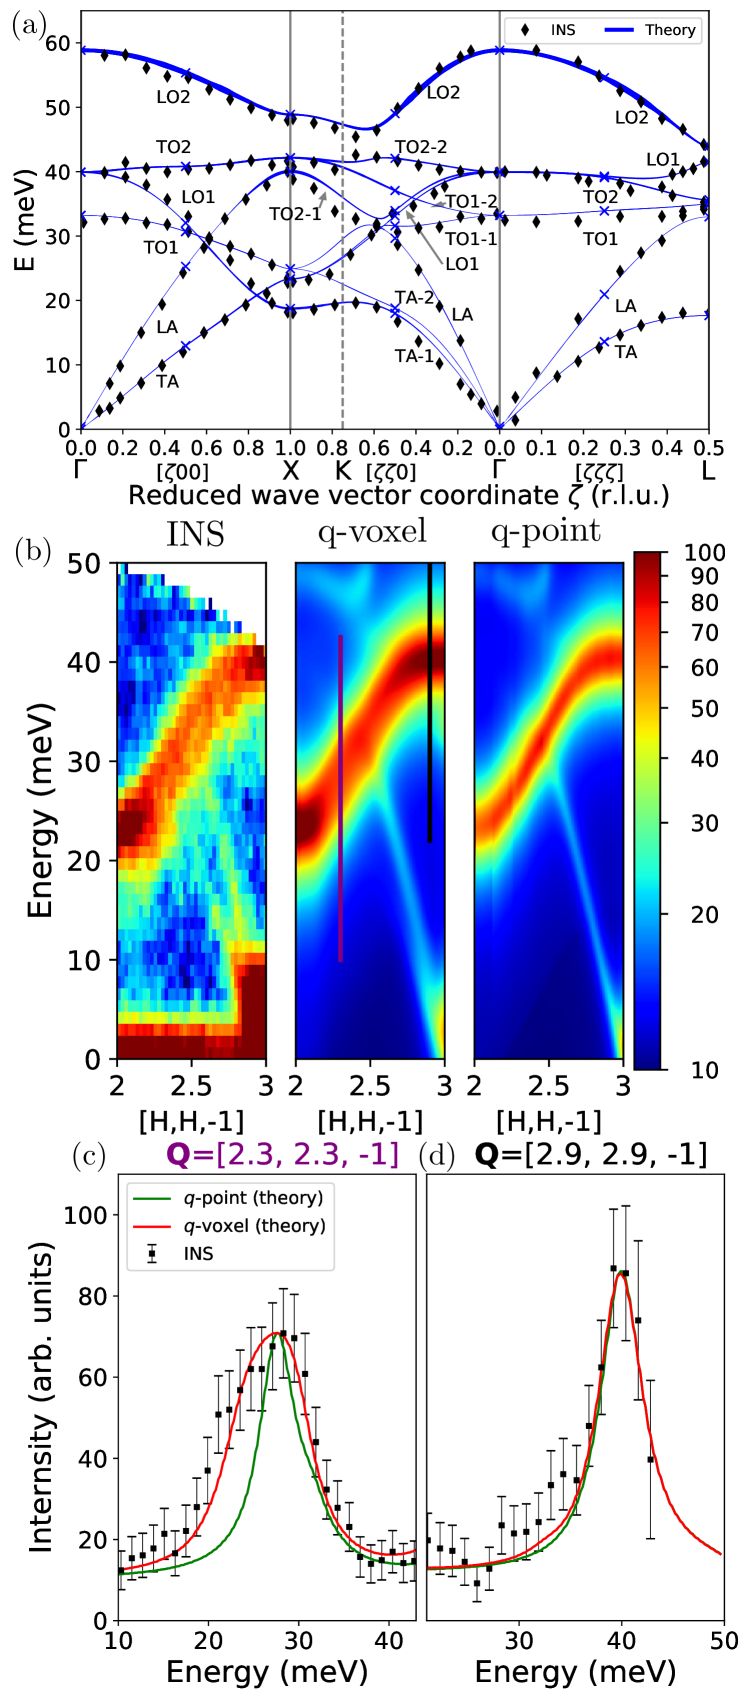
We now proceed to evaluate the -point and -voxel scattering function in CaF2 and ThO2, and compare them to INS measurements. Given that CaF2 and ThO2 are band insulators, standard implementations of DFT are expected to perform well in terms of describing the ground state properties. As anticipated, the computed phonon spectrum is in good agreement with the scattering function peak positions obtained from INS at ambient temperature for both CaF2 (see Fig. 1, panel ) and ThO2 (see Fig. S2 in [8]). While the peak locations agree well, it is interesting to directly compare the respective scattering functions via contour plots along a path through -space (see Fig.1, panel ). For a direct comparison, the INS instrumental energy resolution is accounted for in the theoretical result[3]. We find that the theoretical and INS -voxel scattering functions are in reasonable agreement, while they have nontrivial differences with the -point scattering function in certain regions. The theoretical -voxel scattering function even recovers subtle features of the INS, such as the presence of the TA1 band (see panel for naming convention), which is forbidden in the -point scattering function for the path shown. In order to illustrate potential differences between the -point and -voxel scattering function, both large and small, we present the scattering function at two points as a function of energy around the LO1 band, which scatters strongly (see Fig.1, panels and ). As shown, the which is closer to the zone center (panel ) only shows negligible differences between the -point and -voxel scattering functions, while the other (panel ) shows good agreement between the theoretical and experimental -voxel scattering function, but a substantial difference with the -point scattering function; and this difference may be attributed to the large slope in the latter case. The preceding examples already illustrate that one can only meaningfully compare theory and experiment if -voxel quantities are being employed.
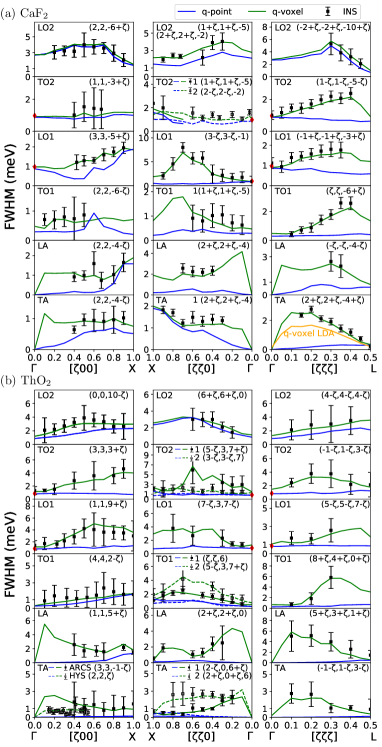
Having illustrated that accounting for the -voxel scattering function can be critical to describing experiments, we now proceed to comprehensively quantify the differences across the Brillouin zone for both CaF2 and ThO2. In Fig.2, we compare the full width at half maximum (FWHM) of each peak obtained from the INS -voxel scattering function, the theoretical -voxel scattering function, and the theoretical -point scattering function (see [8] for and voxel sizes). Following standard INS conventions, the energy resolution is removed from the INS scattering function peak width[3, 13]. The INS and theoretical -voxel FWHM results are in favorable agreement across all modes and -paths, while there is substantial difference with the FWHM obtained from the theoretical -point scattering function in most cases. The acoustic modes, which are highly relevant for thermal conductivity, show a strong difference between -voxel and -point FWHM values. We also compare our theoretical results at the point to the Raman measurements of the T2g widths in CaF2 [11] and ThO2 [12], indicated with a red diamond, demonstrating good agreement with the -point result; which is to be expected. In summary, we have shown that it is critical to employ the -voxel in order to validate a first-principles theory using INS.
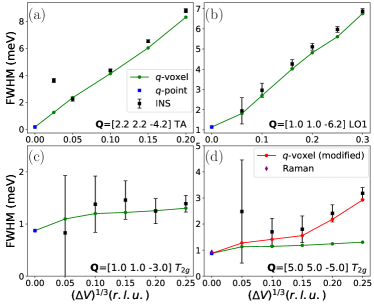
In the preceding analysis, we demonstrated that theory and experiment are in good agreement when using the same -voxel, and that the results can be substantially different from the -point results. Now we explore the effect of voxel size in the case of a cubic voxel, and examine the possibility of extrapolating the -voxel results to zero voxel size in order to recover the -point results, which would allow INS experiments to independently obtain -point peakwidths. The -voxel size used in INS data analysis is a compromise between having good counting statistics (larger volume) and minimizing contamination from neighboring regions in reciprocal space (smaller volume). The effects of the -voxel size on the experimental FWHM of CaF2 is shown in Fig.3 for three different modes: the TA mode at [2.2, 2.2, -4.2], the LO1 mode at mode at [1.0, 1.0, 6.2], and the T2g mode (i.e. LO1+TO2) at [1.0, 1.0, -3.0] and [5.0, 5.0, -5.0]. With the exception of the T2g mode at [5.0, 5.0, -5.0] (i.e. Fig.3, panel ), the theoretical results are in good agreement with experiment for a sufficiently large voxel size; and the exception can be attributed to the overlap of the T2g peak with the TO1 peak, which corrupts the fitting process for the experimental data which must account for the energy resolution of the instrument. To make a direct comparison, we convolve the theoretical results with the energy resolution, and then perform the identical fitting process used for the experimental results where the energy resolution is removed (see red line in Fig.3, panel ). This modified theoretical result now agrees well with experiment for large -voxel sizes, and recovers the usual theoretical -voxel results at small -voxel sizes. Our analysis resolves a previous anomoly in the literature, explaining why the INS peak width of the T2g mode was found to be more than twice that of Raman measurements[14]. Nonetheless, the simplest solution to this problem is to choose a more favorable zone, as shown in Fig.3, panel . In all the preceding examples, we see that sufficiently small voxel sizes lead to poor results for the experimental case given the poor counting statistics, as expected. Furthermore, it appears that there is sufficient uncertainty within the experimental measurements which would preclude the possibility of extrapolating to zero voxel size to obtain the peakwidth purely from experiment. The effects on non-cubic voxels are explored in Supplementary Material[8] (see Section VII).
We have demonstrated that the -voxel peakwidths from theory and experiment are in good agreement at room temperature. This agreement serves as a verification of the quality of our cubic phonon interactions, in addition to the level of perturbation theory used to construct the scattering function. The former is an indirect assessment of the quality of the approximation to the exchange-correlation energy used within DFT, and it should be emphasized that the SCAN functional is critical to such good agreement; whereas the local density approximation [20] (LDA) produces substantial deviations (see Fig. 3, panel , orange line, and [8], Section VIII). We can now predict other quantities, such as thermal conductivity, and anticipate robust results. The thermal conductivity can be computed by solving the linearized Boltzmann transport equation (LBTE) [21, 22, 23]. Within the relaxation time approximation (RTA), the LBTE solution is obtained as an explicit function of the phonon spectrum and the phonon linewidths. The RTA is sometimes an excellent approximation to the LBTE solution, and previous work has demonstrated that this is the case in CaF2 [24]; and we reach the same conclusion in both CaF2 and ThO2. Therefore, we expect our predicted thermal conductivity to be very robust, and we evaluate both CaF2 and ThO2.
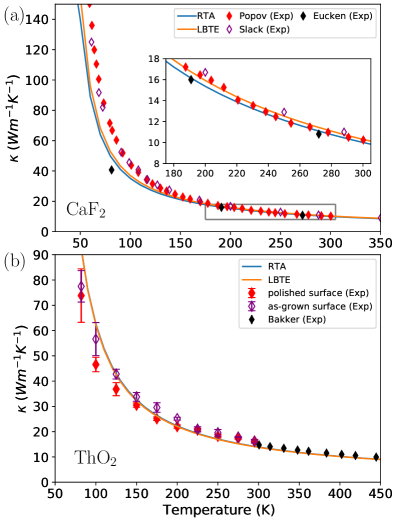
In the case of CaF2 (Fig.4, panel ), our predictions are in good agreement with all available experimental data [16, 15, 17] in the temperature range of 200 K to 300 K. At low temperatures, the results of both Slack[15] and Popov et al. [17] are somewhat higher than our predictions, though the single measurement at by Eucken[16] is below our result. In the case of ThO2 (Fig.4, panel ), our predicted thermal conductivity is in good agreement with the data of Bakker et al. [19], which extends from 300 K to 450 K, and reasonable comparison is found with our measurements from 82 K to 295 K. The higher conductivity predicted at low temperatures as compared with our experiments is likely due to small, native impurity concentrations resulting from the hydrothermal growth process. Our laser based measurements show nontrivial variability at low temperatures based on the surface condition of the sample, and there is a small difference with the data of Bakker et al. near room temperature. It is difficult to assess which experimental results are more reliable. Comparison with previous first-principles calculations is provided in Supplementary Material for both CaF2 and ThO2 [8].
In summary, we have shown that the -voxel of the INS measured scattering function must be accounted for when comparing to theoretical predictions, elucidating why INS peak widths had not been well matched to predictions until now. Given that the -voxel can be straightforwardly implemented within theory, INS is thus elevated to a refined judge of all ingredients of a quasiparticle theory of phonons, whether ab-initio or empirical. The -voxel should be carefully considered in the design of future INS instruments, with the possible goal of allowing INS to independently extrapolate to the -point limit.
acknowledgement
INS measurements by M.S.B., H. M., and M.E.M., first-principles calculations by E.X., L.F., and C.A.M., crystal growth by J.M.M., and thermal conductivity measurements by C.A.D., A.K., and D.H. were supported by the Center for Thermal Energy Transport under Irradiation, an Energy Frontier Research Center funded by the U.S. Department of Energy (DOE), Office of Science, United States, Office of Basic Energy Sciences. Neutron scattering data acquisition and provision of CaF2 by RPH was supported by the DOE Office of Science, Basic Energy Science, Materials Science and Engineering Division. Portions of this research used resources at the Spallation Neutron Source, a U.S. DOE Office of Science User Facility operated by the Oak Ridge National Laboratory. This research used resources of the National Energy Research Scientific Computing Center, a DOE Office of Science User Facility supported by the Office of Science of the U.S. Department of Energy under Contract No. DE-AC02-05CH11231. The formulation and encoding of linewidths via irreducible derivatives by L.F. and C.A.M. was supported by the grant DE-SC0016507 funded by the U.S. Department of Energy, Office of Science.
*E.X., H.M. and M.S.B. contributed equally to this work.
References
- Kim et al. [2020] D. S. Kim, O. Hellman, N. Shulumba, C. N. Saunders, J. Y. Lin, H. L. Smith, J. Herriman, J. L. Niedziela, D. L. Abernathy, C. W. Li, et al., Physical Review B 102, 174311 (2020).
- Glensk et al. [2019] A. Glensk, B. Grabowski, T. Hickel, J. Neugebauer, J. Neuhaus, K. Hradil, W. Petry, and M. Leitner, Physical review letters 123, 235501 (2019).
- Abernathy et al. [2012] D. L. Abernathy, M. B. Stone, M. Loguillo, M. Lucas, O. Delaire, X. Tang, J. Lin, and B. Fultz, Review of Scientific Instruments 83, 015114 (2012).
- Shapiro et al. [2006] S. Shapiro, I. Zaliznyak, L. Passell, V. Ghosh, W. Leonhardt, and M. Hagen, Physica B: Condensed Matter 385, 1107 (2006).
- Dennett et al. [2021] C. A. Dennett, W. R. Deskins, M. Khafizov, Z. Hua, A. Khanolkar, K. Bawane, L. Fu, J. M. Mann, C. A. Marianetti, L. He, D. H. Hurley, and A. El-Azab, Acta Mater. 213, 116934 (2021).
- Sun et al. [2015] J. Sun, A. Ruzsinszky, and J. Perdew, Phys. Rev. Lett. 115, 036402 (2015).
- Fu et al. [2019] L. Fu, M. Kornbluth, Z. Cheng, and C. A. Marianetti, Phys. Rev. B 100, 014303 (2019).
- [8] See Supplemental Material at [URL will be inserted by publisher] for details of sample prepatation, INS information, and details of DFT calculations. Refs. [25, 26, 27, 28, 29, 30, 31, 32, 33, 34, 35, 36, 37, 38, 39, 40, 41, 42, 43, 20, 44, 45, 46] are cited.
- Kokkedee [1962] J. J. Kokkedee, Physica 28, 374 (1962).
- Maradudin and Fein [1962] A. Maradudin and A. Fein, Physical Review 128, 2589 (1962).
- Elliott et al. [1978] R. J. Elliott, W. Hayes, W. G. Kleppmann, A. J. Rushworth, and J. F. Ryan, Proceedings of the Royal Society of London. A. Mathematical and Physical Sciences 360, 317 (1978).
- Rao et al. [2014] R. Rao, R. Bhagat, N. P. Salke, and A. Kumar, Appl Spectrosc 68, 44 (2014).
- Bruce et al. [2000] S. D. Bruce, J. Higinbotham, I. Marshall, and P. H. Beswick, Journal of Magnetic Resonance 142, 57 (2000).
- Schmalzl et al. [2003] K. Schmalzl, D. Strauch, and H. Schober, Physical Review B 68, 144301 (2003).
- Slack [1961] G. A. Slack, Phys. Rev. 122, 1451 (1961).
- Eucken [1911] A. Eucken, Annalen der Physik 339, 185 (1911).
- Popov et al. [2014] P. A. Popov, P. P. Fedorov, and V. V. Osiko, Dokl. Phys. 59, 199 (2014).
- [18] The experimental data of Popov et. al[17] was digitized incorrectly by Qi et. al[24].
- [19] K. Bakker and E. H. P. Cordfunke, , 12.
- Perdew and Zunger [1981] J. P. Perdew and A. Zunger, Phys. Rev. B 23, 5048 (1981).
- Broido et al. [2005] D. A. Broido, A. Ward, and N. Mingo, Phys. Rev. B 72, 014308 (2005).
- Broido et al. [2012] D. A. Broido, L. Lindsay, and A. Ward, Phys. Rev. B 86, 115203 (2012).
- Chaput [2013] L. Chaput, Phys. Rev. Lett. 110, 265506 (2013).
- Qi et al. [2016] Y.-Y. Qi, T. Zhang, Y. Cheng, X.-R. Chen, D.-Q. Wei, and L.-C. Cai, Journal of Applied Physics 119, 095103 (2016).
- Azuah et al. [2009] R. T. Azuah, L. R. Kneller, Y. Qiu, P. L. W. Tregenna-Piggott, C. M. Brown, J. R. D. Copley, and R. M. Dimeo, J Res Natl Inst Stand Technol 114, 341 (2009).
- Bader et al. [2003] R. Bader, M. Brehm, R. Ebner, H. Heller, L. Palm, and F. Wagner, High Performance Computing in Science and Engineering, Munich 2002, edited by S. Wagner, A. Bode, W. Hanke, and F. Durst (Springer, Berlin, Heidelberg, 2003).
- Blöchl et al. [1994] P. E. Blöchl, O. Jepsen, and O. K. Andersen, Phys. Rev. B 49, 16223 (1994).
- Bryan et al. [2020] M. S. Bryan, L. Fu, K. Rickert, D. Turner, T. A. Prusnick, J. M. Mann, D. L. Abernathy, C. A. Marianetti, and M. E. Manley, Communications Physics 3, 1 (2020).
- Dennett et al. [2020] C. A. Dennett, Z. Hua, A. Khanolkar, T. Yao, P. K. Morgan, T. A. Prusnick, N. Poudel, A. French, K. Gofryk, L. He, L. Shao, M. Khafizov, D. B. Turner, J. M. Mann, and D. H. Hurley, APL Mater. 8, 111103 (2020).
- Gonze and Lee [1997] X. Gonze and C. Lee, Phys. Rev. B 55, 10355 (1997).
- Gonze et al. [1994] X. Gonze, J.-C. Charlier, D. Allan, and M. Teter, Phys. Rev. B 50, 13035 (1994).
- Hazen and Finger [1981] R. M. Hazen and L. W. Finger, Journal of Applied Crystallography 14, 234 (1981).
- Hurley et al. [2015] D. H. Hurley, R. S. Schley, M. Khafizov, and B. L. Wendt, Rev. Sci. Instrum. 86, 123901 (2015).
- Kresse and Hafner [1993] G. Kresse and J. Hafner, Phys. Rev. B 47, 558 (1993).
- Kresse and Hafner [1994] G. Kresse and J. Hafner, Phys. Rev. B 49, 14251 (1994).
- Kresse and Furthmuller [1996a] G. Kresse and J. Furthmuller, Phys. Rev. B 54, 11169 (1996a).
- Kresse and Furthmuller [1996b] G. Kresse and J. Furthmuller, Computational Materials Science 6, 15 (1996b).
- Kresse and Joubert [1999] G. Kresse and D. Joubert, Phys. Rev. B 59, 1758 (1999).
- Lin et al. [2019] J. Y. Lin, A. Banerjee, F. Islam, M. D. Le, and D. L. Abernathy, Physica B: Condensed Matter 562, 26 (2019).
- Maillet et al. [2000] D. Maillet, S. André, J. C. Batsale, A. Degiovanni, and C. Moyne, Thermal quadrupoles: solving the heat equation through integral transforms (John Wiley & Sons, LTD., 2000).
- Mann et al. [2010] M. Mann, D. Thompson, K. Serivalsatit, T. M. Tritt, J. Ballato, and J. Kolis, Crystal growth & design 10, 2146 (2010).
- Momin et al. [1991] A. C. Momin, E. B. Mirza, and M. D. Mathews, Journal of Nuclear Materials 185, 308 (1991).
- Nakamura and Machida [2019] H. Nakamura and M. Machida, Journal of Nuclear Materials 519, 45 (2019).
- Schumann and Neumann [1984] B. Schumann and H. Neumann, Crystal Research and Technology 19, K13 (1984).
- Shirane et al. [2002] G. Shirane, S. M. Shapiro, and J. M. Tranquada, Neutron Scattering with a Triple-Axis Spectrometer: Basic Techniques (Cambridge University Press, Cambridge, 2002).
- Squires [2012] G. L. Squires, Introduction to the Theory of Thermal Neutron Scattering, 3rd ed. (Cambridge University Press, 2012).