The Winning Solution to the iFLYTEK Challenge 2021 Cultivated Land Extraction from High-Resolution Remote Sensing Image
Abstract
Extracting cultivated land accurately from high-resolution remote images is a basic task for precision agriculture. This report introduces our solution to the iFLYTEK challenge 2021 cultivated land extraction from high-resolution remote sensing image. The challenge requires segmenting cultivated land objects in very high-resolution multispectral remote sensing images. We established a highly effective and efficient pipeline to solve this problem. We first divided the original images into small tiles and separately performed instance segmentation on each tile. We explored several instance segmentation algorithms that work well on natural images and developed a set of effective methods that are applicable to remote sensing images. Then we merged the prediction results of all small tiles into seamless, continuous segmentation results through our proposed overlap-tile fusion strategy. We achieved the first place among 486 teams in the challenge.
Index Terms:
High resolution remote sensing image, instance segmentation, cultivated land segmentation.I Introduction
The application of digital agricultural services usually needs to accurately count the location and area of farmland owned by farmers. This information lays the foundation for farmland scientific management and agricultural credit loan later. Automatic extraction of field boundaries from satellite imagery can reduce the reliance on manual input of farmland information, which is time-consuming[1]. To advance the research on this task, iFLYTEK and ChangGuang Satellite jointly held the challenge of extracting cultivated land from high-resolution remote sensing images. (http://challenge.xfyun.cn/topic/info?type=plot-extraction-2021)
Some works have explored the application of deep learning models on high-resolution remote sensing images. Many works[1, 2, 3, 4, 5] are inspired by the U-net[6] and they focused on the semantic segmentation task. However, semantic segmentation models do not necessarily yield separated cultivated land, and additional postprocessing is required to define regions with closed contours and obtain individual instances[5]. While end-to-end instance segmentation models can extract individual instances in one go, they have not been widely tested[5]. Potlapally et al.[7] and Zhang et al.[8] developed models based on Mask R-CNN for segmentation of arctic ice-wedges and cultivated land, respectively. However, the particularity of remote sensing images makes the accuracy of algorithms less than satisfactory, requiring the application of more powerful algorithms and feature extractors to improve the segmentation performance.
In this report, we validated the applicability of various instance segmentation algorithms in the task of cultivated land segmentation on remote sensing images. Although the current instance segmentation methods perform well on natural images, they are rarely applicable to remote sensing images. Objects appear at arbitrary locations in remote sensing images with uneven distribution. There are usually no clear boundaries between objects. we had explored a set of effective solutions from different aspects, including data preprocessing, model pre-training, segmentation algorithm, and results postprocessing. Then, we successfully built a highly effective and efficient pipeline to solve this problem.
Among the whole segmentation pipeline, a very critical part is results postprocessing, i.e. merging predicted results from all small tiles. We must cut a high-resolution image into many tiles as the limited GPU memory to perform instance segmentation. Combining results from multiple overlapping tiles into seamless, continuous segmentation results is rarely mentioned, but it is vital in practical engineering. Olaf et al.[6] took the average value of predictions inside the overlap area as the final semantic segmentation results, but this way is not applicable to instance segmentation. François et al.[5] only retained the detection result with the lowest instance uncertainty in the overlapping area between tiles, but we observed that many incomplete instances with high uncertainty values were kept. Instead of using instance uncertainty as a criterion, we heuristically divided each tile into the ignore area and target area, and only kept the detection results inside the target area. We further utilize matrix operation to shorten the total time of strategy significantly.
We explored an efficient pipeline and a more superior overlap-tile fusion strategy, achieving an score of 58.1 on the test set. We scored 63.38 points at the evaluation metrics of the iFLYTEK challenge and ranked the first place among 486 teams. Code and dataset are available at:
II Materials and Methods
II-A JiLin-1 image dataset
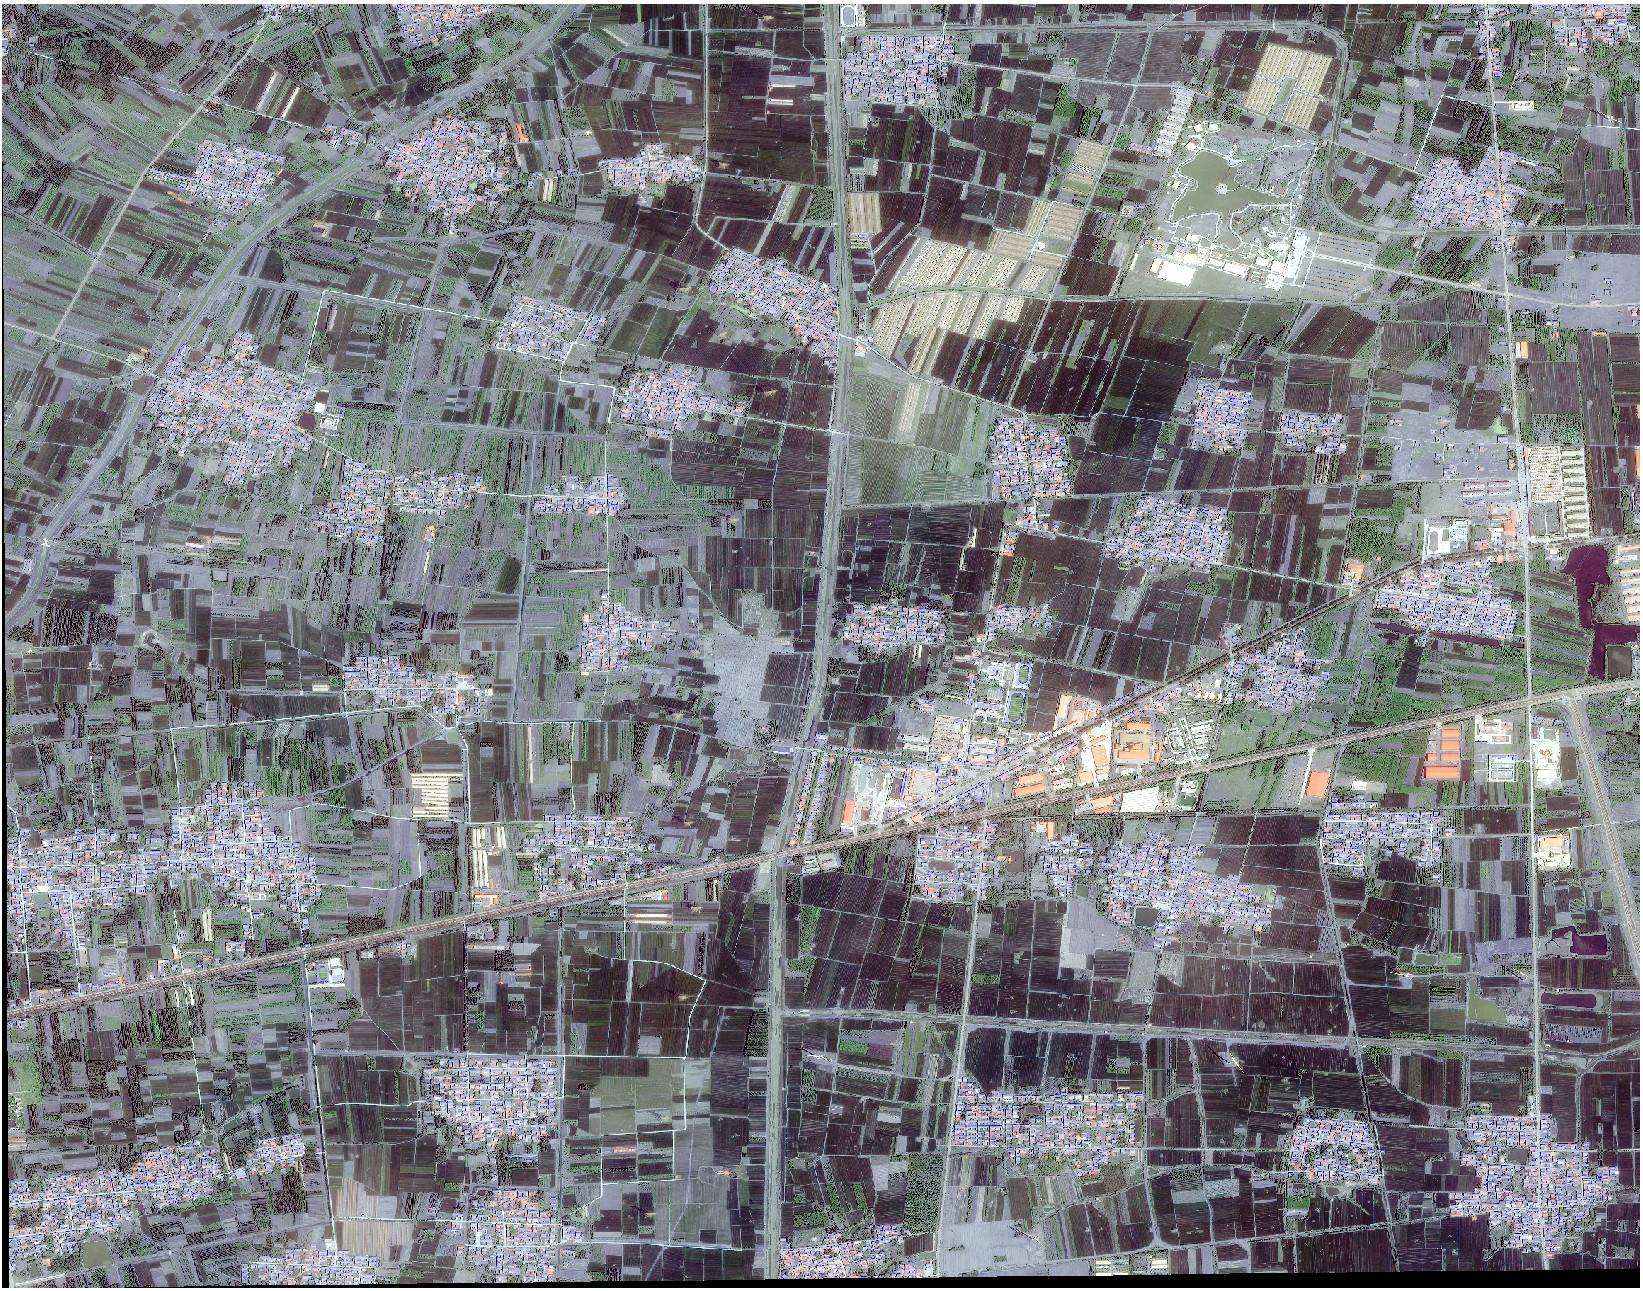
The JiLin-1 image dataset was used in the 2021 iFLYTEK challenge of cultivated land extraction from high-resolution remote sensing images (Fig.1.). Each image has four bands: blue, green, red, and near-infrared. The spatial resolution of the JiLin-1 multispectral images is 0.75-1.1 M. However, their sizes are not fixed, and the pixels are between 5000-18000. The competition was divided into three rounds. Fifteen raw data was provided as the test set in the preliminary, and 18 raw data was provided in the second round. However, only 16 high-resolution images were supplied as training set in the preliminary.
II-B Evaluation Criterion
Calculation formula of preliminary and semi-final tests results is:
where, is the AP for instance segmentation at , and is the average value of for semantic segmentation over areas of cultivated land and background. But we only regarded it as an instance segmentation task, ignoring the impact of semantic segmentation indicators . More accurate instance segmentation results also correspond to more accurate semantic segmentation results.
In the final, the competition organizers would calculate the overall score of the algorithm, and the calculation formula is:
where, is the efficiency score of the algorithm, is the evaluation score of the code, and is the evaluation score of the technical documentation. Since both and had a high proportion, we tried to balance the performance and the running time of the whole pipeline. The competition organizers scored and , and no specific rules had been announced.
II-C Designs about the Whole Pipeline
Our algorithm used the Hybrid Task Cascade(HTC)[9] model with a backbone of ResNeXt-101-64x4d[10] and Deformable ConvNets v2 (DCN)[11]. We used the model pre-trained for 20 epochs on the COCO dataset[12] for weight initialization, which was better than using the pre-trained model on ImageNet[13]. Finally, the results of the algorithm output were post-processed by the overlap-tile fusion strategy. Soft-NMS[14] was used to improve the final performance. We also tried Content-Aware ReAssembly of FEatures (CARAFE)[15], DetectoRS[16], PA-FPN[17] to enhance the backbone of the model, but they did not work well. The multi-scales test did not achieve positive results. Random cropping and InstaBoost[18] for data augmentation also were useless. This may result from the fact that remote sensing images had simpler characteristics than the complicated scenarios and objects in COCO, and most of the cultivated land was densely distributed.
II-D Overlap-Tile Fusion Strategy
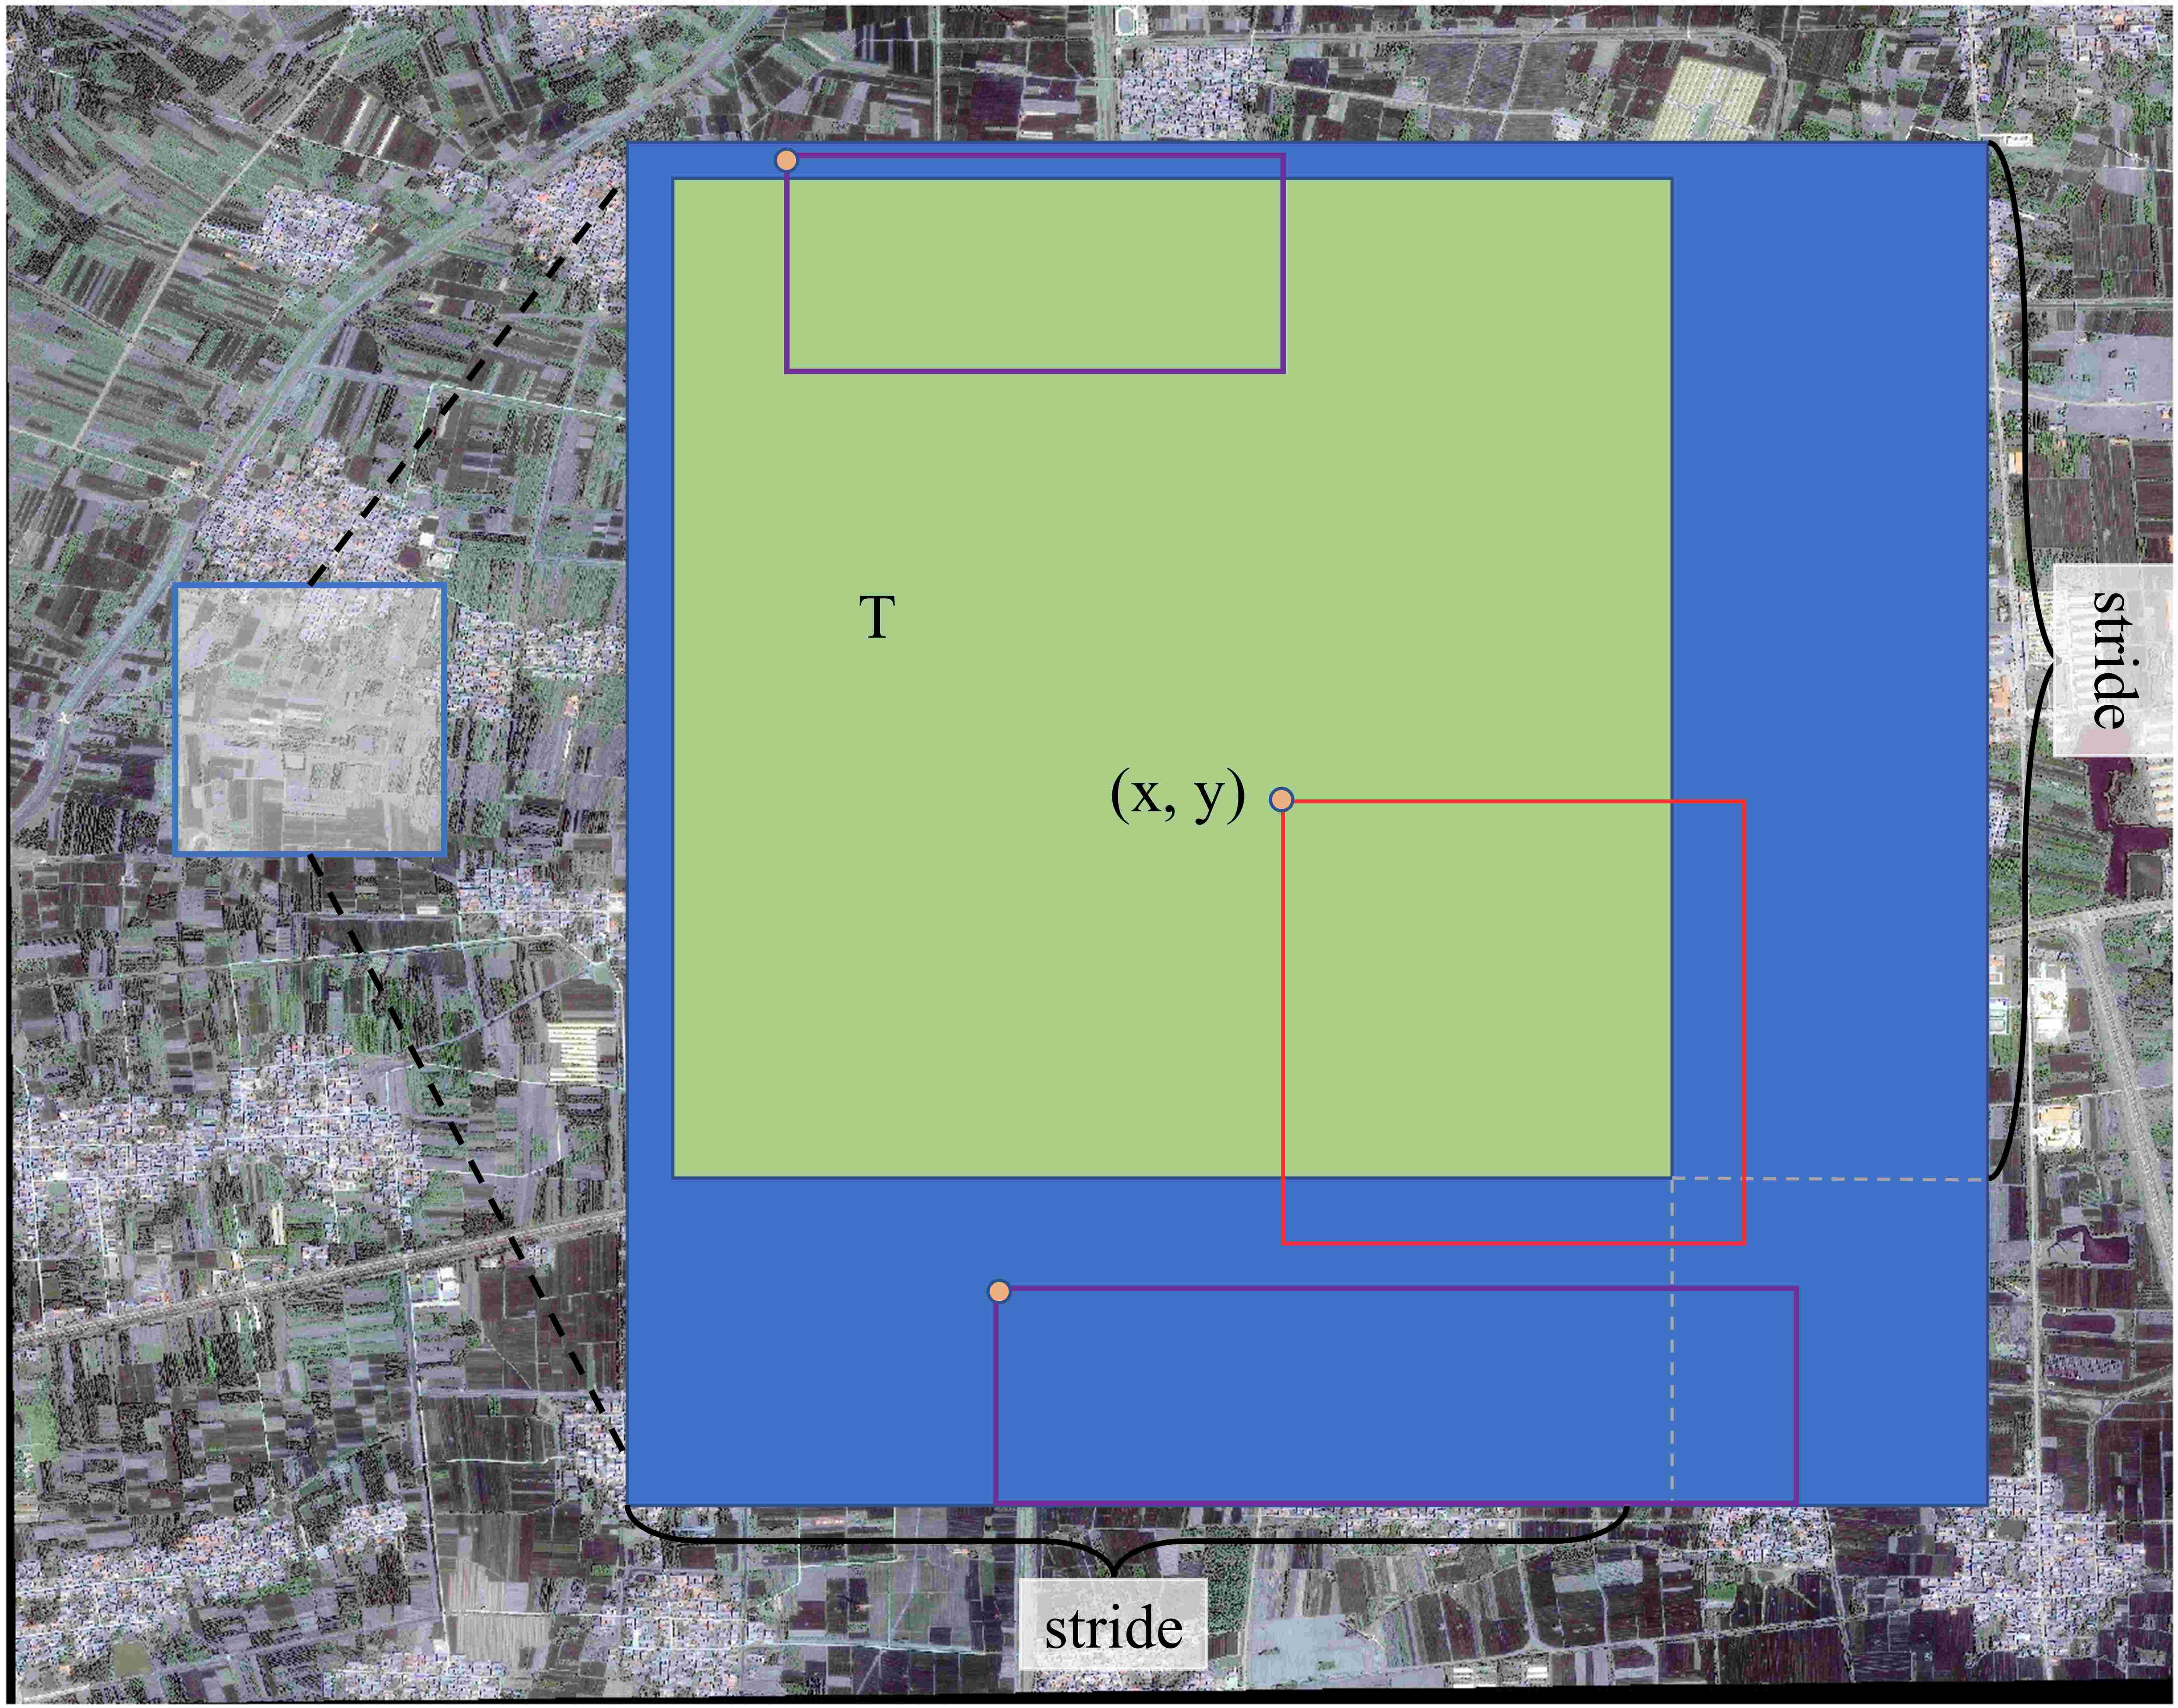
We used a sliding window of size 1536×1536, with a moving stride size of 1280, to cut out many tiles of pixels from the original images from top to bottom and left to right. We used heuristic rules to automatically divide each tile into target area T and ignore area (Fig.2.). The left edge and the upper edge of the ignore area were 2 pixels away from the tile border respectively. If and only if coordinates (x, y) of the upper left corner of the detection boxes fell within the target area, detection results were retained. When a tile was on the border of the original image, the ignore area that lay on edge in the same direction of the tile was merged into the target area. The position coordinates of tiles had been collected when making the dataset.
We achieved 5.8 points improvements over direct outputs. We also used matrix operation to shorten the total inference time significantly. In fact, the matrix merging operation takes almost no time.
III Experiments
We trained our model on eight 2080Ti GPUs. Our code was developed based on the mmdetection[19] codebase. Unless otherwise specified, all parameters followed their default settings.
III-A Data Preprocessing
We used the sliding window to divide the 16 raw data of the original training set into tiles of pixels from top to bottom and left to right. The window size was 512×512, the stride of window movement was also 512. Then, we divided these tiles into a training set and a validation set with a ratio of 5:1. The training and the validation set include 3115 tiles and 629 tiles, respectively. The size of tiles on the lower and left edges of raw data is smaller than 512.
To obtain the seamless segmentation results for the test set, we used the same sliding window method to create a new test set. The window size was 1536×1536, and the step of window movement was 1280. It would help us apply our overlap-tile fusion strategy.
The processed training set contains a large number of images without cultivated land. We let these images participate in the training process, which could slightly improve the performance of our model.
We also found that the natural images of R, G and B bands achieved better performance than the combination of NIR, G and B bands. The combination of NIR, G and B bands, is commonly used in remote sensing to enhance the vegetation characteristics of the surface.
III-B Model-Related Experiments
III-B1 Model
We did ablation experiments on different models. Table I shows the effect comparison between the HTC and the classic Mask R-CNN[20], and both models use ResNet-50 as backbone. The results shows that HTC is a more powerful detection model, as it effectively improves the information flow, not only across stages but also between tasks. We took the better HTC model as our baseline.
| Model | ||
|---|---|---|
| Mask R-CNN | 41.9 | 68.6 |
| HTC | 45.2 | 70.6 |
III-B2 Techniques for Enhancing Backbone
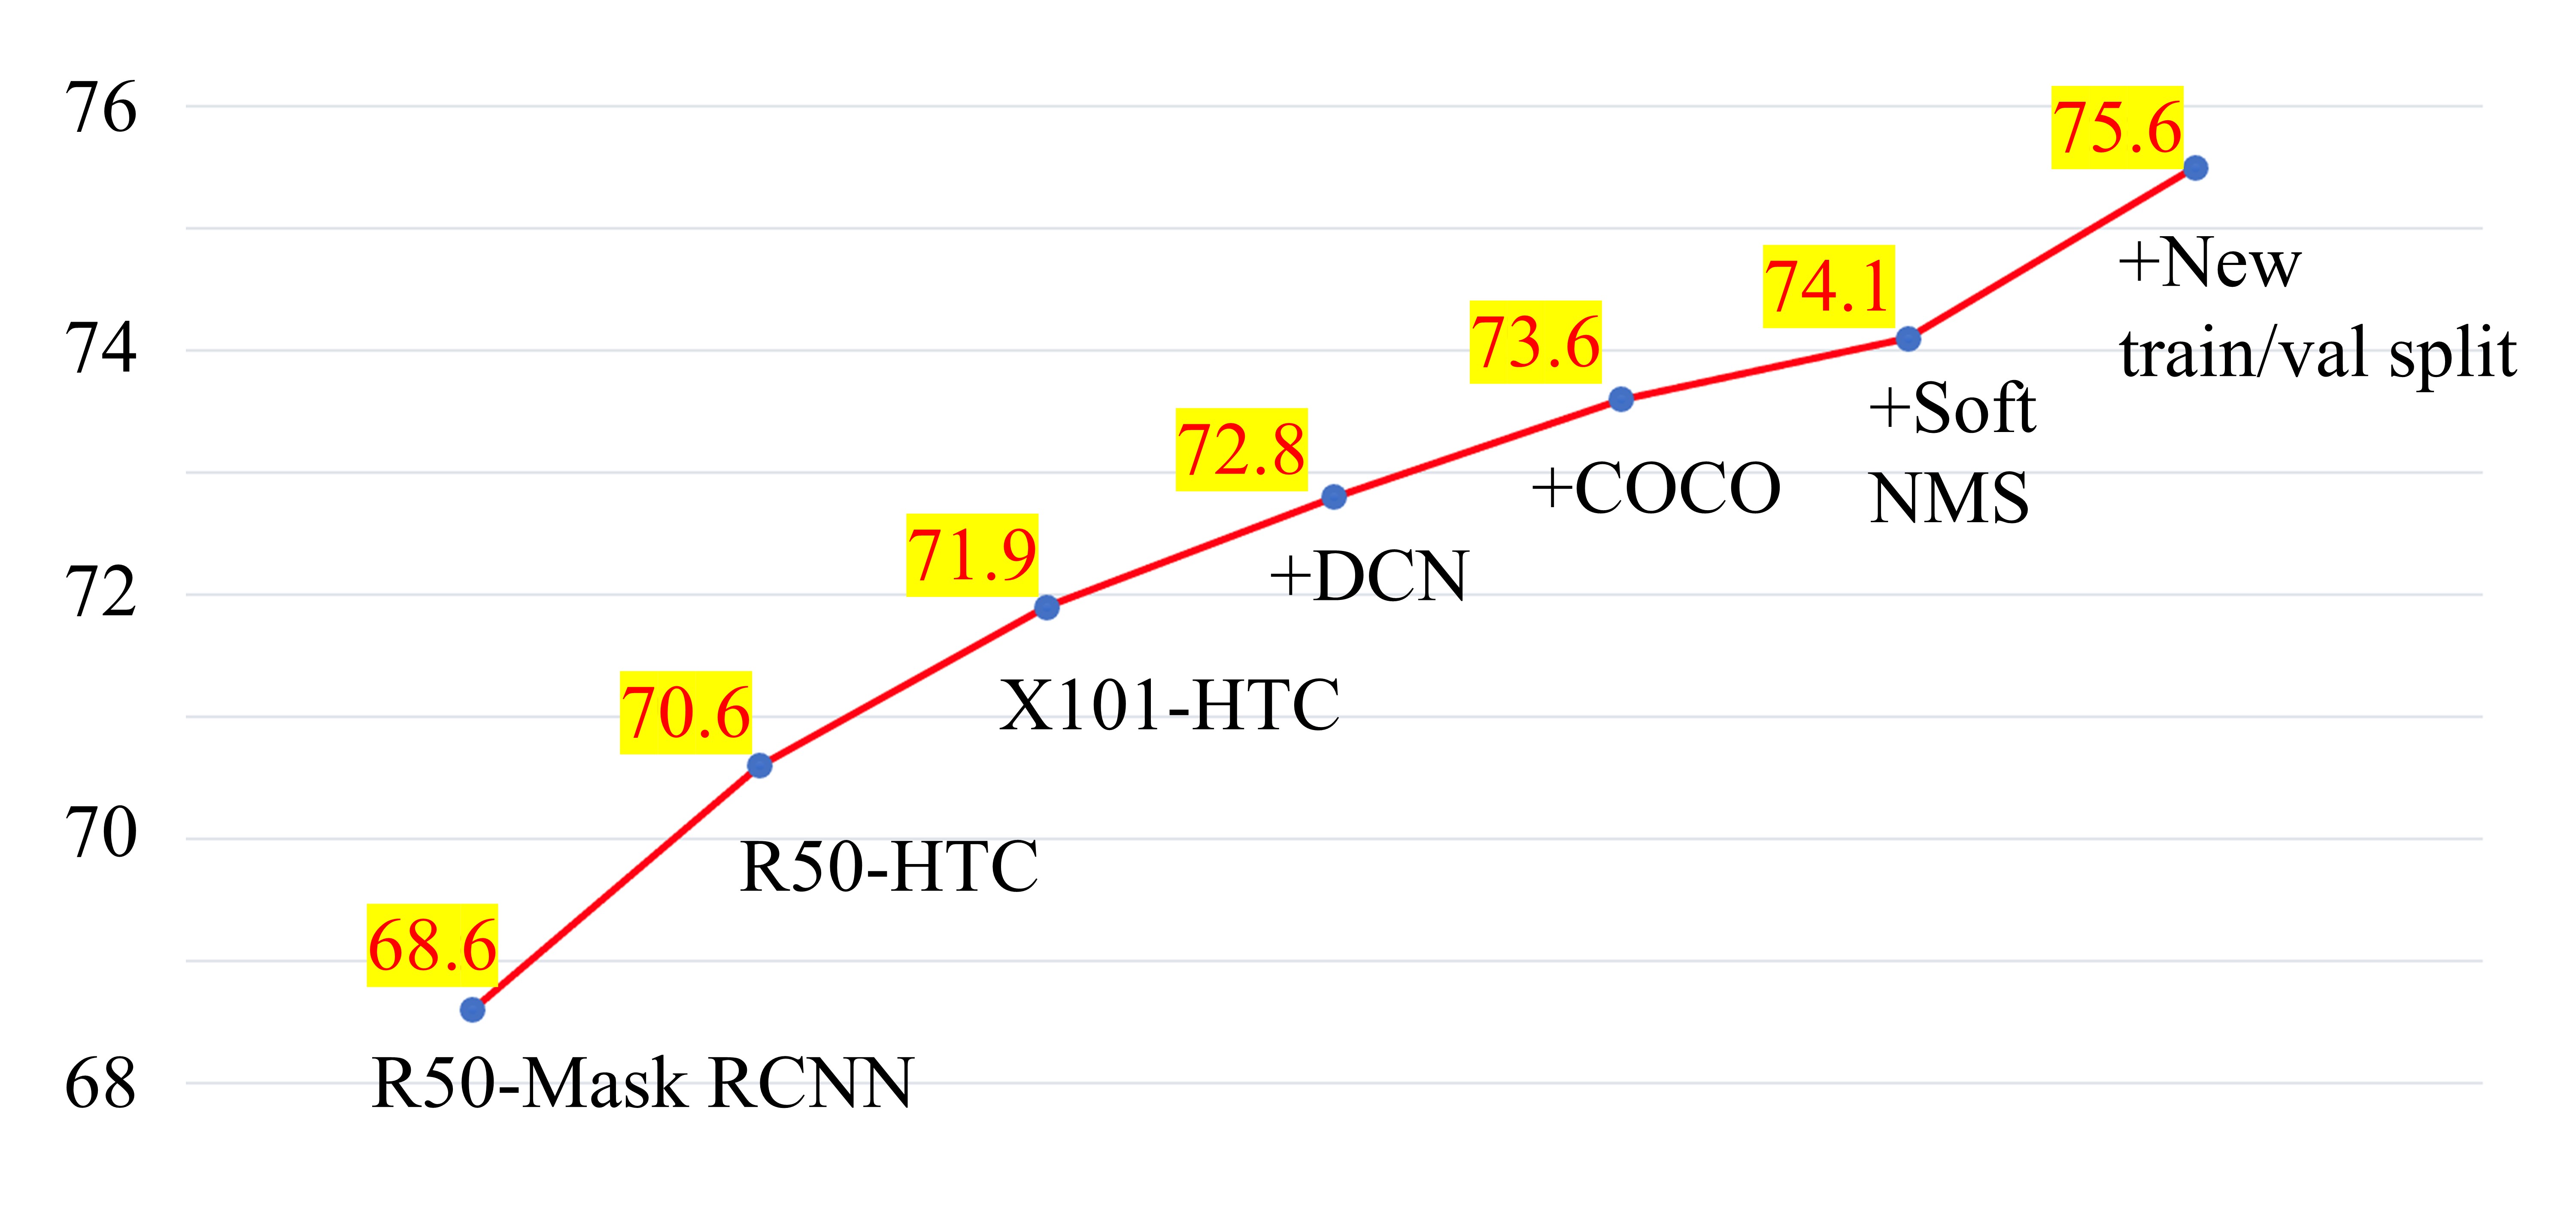
We first did ablation experiments on different backbones. Table II shows the impact of different backbones on the performance of Mask R-CNN. We chose the best ResNeXt-101 as the base backbone. We noticed that the HTC model needed longer time to converge, so we also conducted ablation experiments on the training time. The results are shown in Table III. The evaluation metric for instance segmentation in the competition was the , and the of the HTC model had converged within 12 epochs. Then, to further improve the performance of the model, we studied some techniques that have been proved to be effective in general object detection to improve the backbone of the model (Fig.3.). Techniques such as DCN significantly enhanced the performance. CARAFE, DetectoRS, PA-FPN had no significant changes or adverse effects, although they performed well on the COCO dataset. It shows the particularity of the remote sensing image dataset, perhaps because it has simpler characteristics than the complicated scenarios and objects in COCO. In the following experiments, we finally used ResNeXt-101-64x4d+DCN as backbone. In the final experiment, we observed that the natural image composed of R, G and B might show the cultivated land objects more clearly than the combination of NIR, R and G. Therefore, a new data format was used here, so the AP was increased by 1.5%. Except for replacing the band combination, all other settings were the same as the original dataset.
| Backbones | ||
|---|---|---|
| ResNet-50[21] | 40.0 | 65.9 |
| ResNet-101 | 41.1 | 67.1 |
| ResNeXt-101 | 41.4 | 67.8 |
| ResNeSt-101[22] | 37.3 | 62.2 |
| Backbones | Epochs | ||
|---|---|---|---|
| X101-64x4d | 12 | 46.7 | 71.9 |
| X101-64x4d | 20 | 47.3 | 72.1 |
| X101-64x4d | 24 | 47.2 | 72.0 |
| X101-64x4d | 36 | 46.7 | 71.4 |
III-B3 Model Pre-training
Using pre-trained models can reduce the time for model convergence and usually achieve better results. HTC with ResNeXt-101-64x4d+DCN backbone trained for 12 epochs was chosen as our baseline for ablation studies. Using the COCO pre-trained model can achieve better performance on remote sensing images than the ImageNet pre-trained model. The results are shown in Table IV.
| Pre-trained models | ||
|---|---|---|
| ImageNet | 47.5 | 72.8 |
| COCO | 49.6 | 73.6 |
III-C Overlap-tile Fusion Strategy
As described in Sect.II.D, We proposed that the robust overlap-tile fusion strategy should meet the following rules (Fig.2.): 1) The tiles we got should be as large as possible to ensure that each cultivated land object would appear entirely in at least one of the tiles. 2) If and only if coordinates (x, y) of the upper left corner of the detection boxes fell within the target area, detection results were retained. 3) When a tile was on the border of the original images, the ignore area that on edge in the same direction of the tile was merged into the target area.
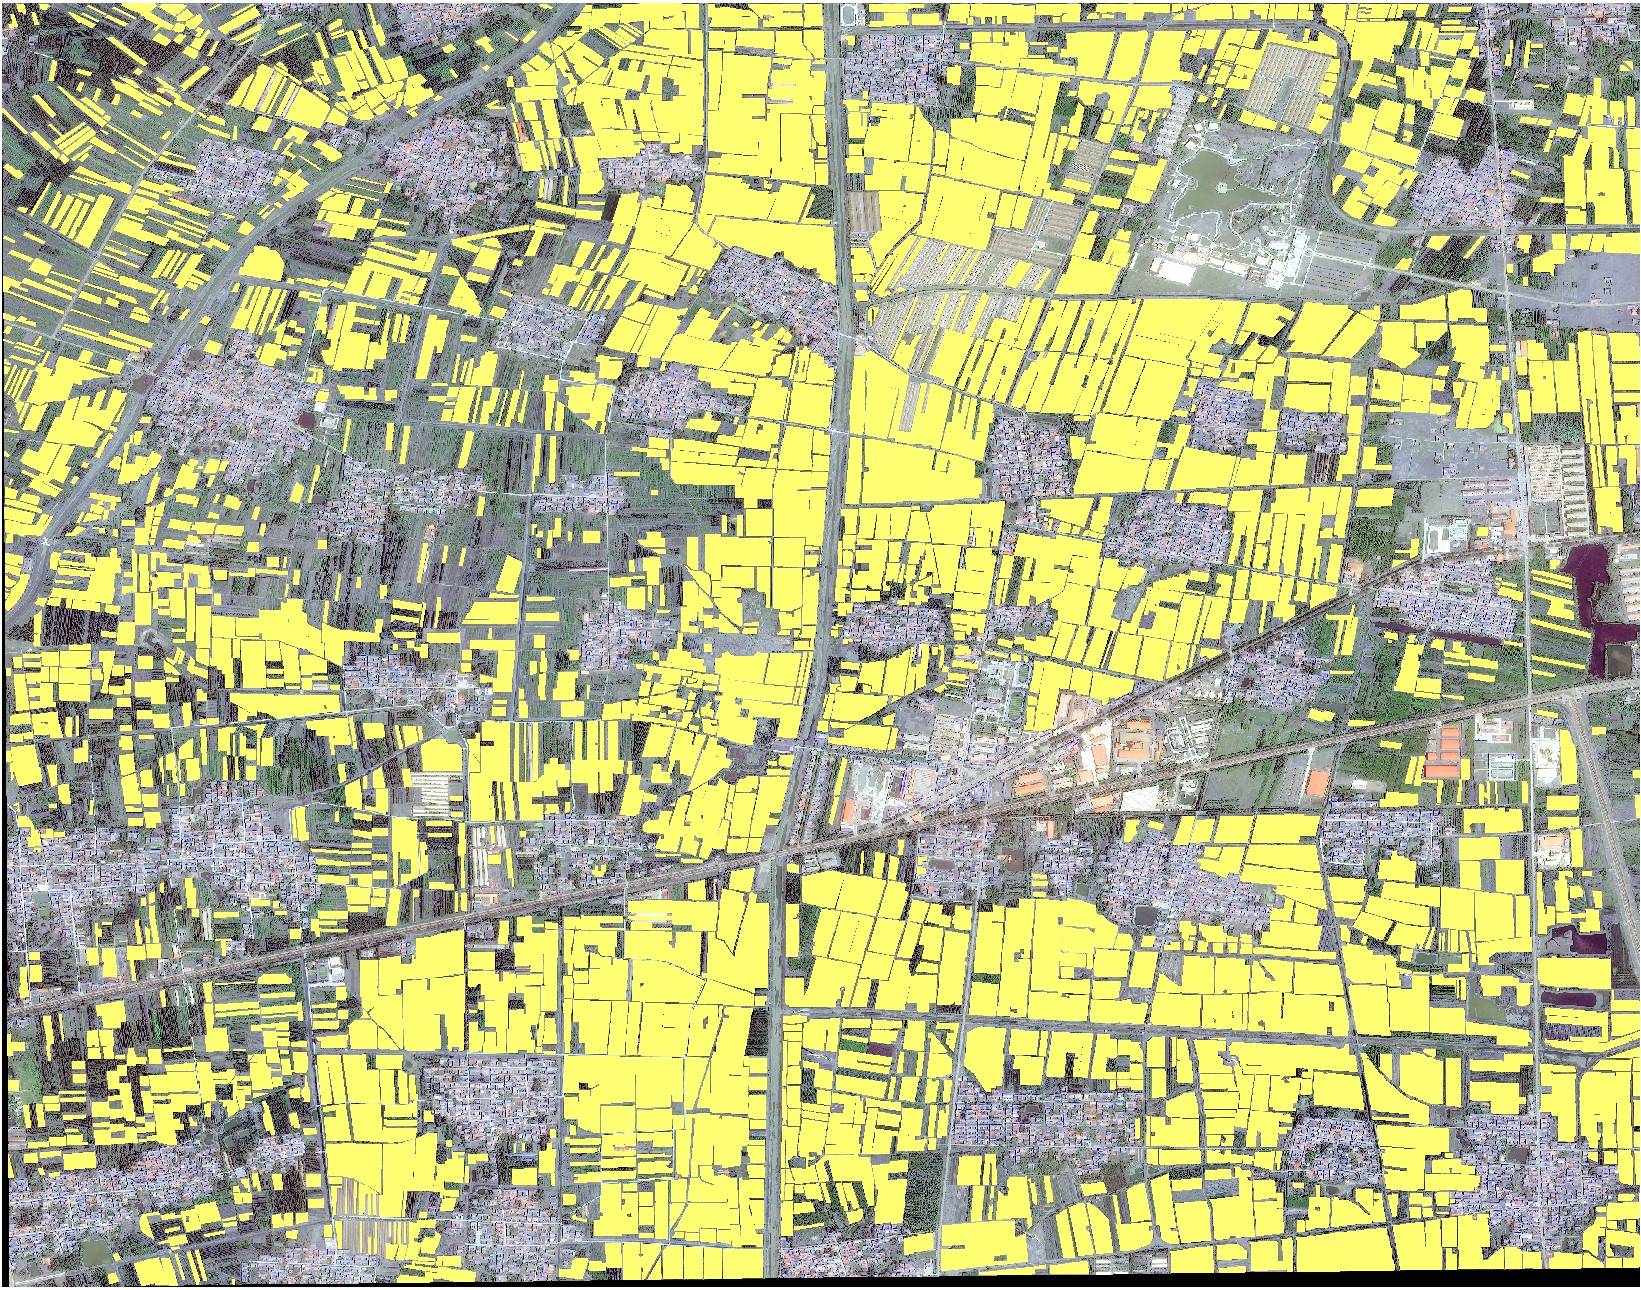
In order to merge the mask results with less performance loss, the stride should be smaller, such as 256, but this would increase the test time. Considering that, the size of the test set we generated was 1536, and the moving stride size was 1280. The proportion of large objects in the dataset was low, so our approach lost slightly. One of the mask predictions output by the overlap-tile fusion strategy is shown in Figure 4.
III-D FINAL RESULTS
The whole process of growth can be seen intuitively in Figure 3. Including splitting raw data, model processing, and fusing prediction results, and the entire test process of 18 raw data only took 24 minutes on eight 2080Ti GPUs. If we adjusted the image scale for model training and sacrificed the value of Score1 slightly, the efficiency of the model would be significantly improved. Results were shown in Table V. The Score1 of the top five teams in the competition are shown in Figure 5. We are the first team. The results in Figure 5 are not expressed as percentages.
| Training scales | Time/min | Score1 | |
|---|---|---|---|
| 600 | 15 | 55.7 | 62.88 |
| 800 | 24 | 58.1 | 63.38 |
IV CONCLUSION
In this work, we successfully built a highly effective and efficient pipeline for cultivated land extraction in high-resolution remote sensing images. We found that the commonly used technologies that work well on the COCO dataset do not perform well on remote sensing images. For large images that GPU cannot deal with, we provided a more detailed overlap-tile fusion strategy to generate seamless and continuous segmentation results. On the dataset of this competition, Score1 of our pipeline reached 63.38, while the total duration was only 24 minutes. We ranked the first place among 486 teams. We hope that our work can promote the application of digital agriculture in rural areas.
Acknowledgement
This work was supported by the National Natural Science Foundation of China (Nos. U19B2034 and 62061136001) and THU-Bosch JCML center.
References
- [1] F. Waldner and F. Diakogiannis, “Extracting field boundaries from satellite imagery with a convolutional neural network to enable smart farming at scale,” in EGU General Assembly Conference Abstracts, 2020, p. 102.
- [2] Z. Li, Q. Xin, Y. Sun, and M. Cao, “A deep learning-based framework for automated extraction of building footprint polygons from very high-resolution aerial imagery,” Remote Sensing, vol. 13, no. 18, p. 3630, 2021.
- [3] C. Persello, V. Tolpekin, J. Bergado, and R. de By, “Delineation of agricultural fields in smallholder farms from satellite images using fully convolutional networks and combinatorial grouping,” Remote Sensing of Environment, vol. 231, p. 111253, 2019.
- [4] X. Zheng and T. Chen, “High spatial resolution remote sensing image segmentation based on the multiclassification model and the binary classification model,” Neural Computing and Applications, pp. 1–8, 2021.
- [5] F. Waldner, F. I. Diakogiannis, K. Batchelor, M. Ciccotosto-Camp, E. Cooper-Williams, C. Herrmann, G. Mata, and A. Toovey, “Detect, consolidate, delineate: Scalable mapping of field boundaries using satellite images,” Remote Sensing, vol. 13, no. 11, p. 2197, 2021.
- [6] O. Ronneberger, P. Fischer, and T. Brox, “U-net: Convolutional networks for biomedical image segmentation,” in International Conference on Medical Image Computing and Computer-assisted Intervention. Springer, 2015, pp. 234–241.
- [7] A. Potlapally, P. S. R. Chowdary, S. R. Shekhar, N. Mishra, C. S. V. D. Madhuri, and A. Prasad, “Instance segmentation in remote sensing imagery using deep convolutional neural networks,” in 2019 International Conference on Contemporary Computing and Informatics (IC3I). IEEE, 2019, pp. 117–120.
- [8] W. Zhang, C. Witharana, A. K. Liljedahl, and M. Kanevskiy, “Deep convolutional neural networks for automated characterization of arctic ice-wedge polygons in very high spatial resolution aerial imagery,” Remote Sensing, vol. 10, no. 9, p. 1487, 2018.
- [9] K. Chen, J. Pang, J. Wang, Y. Xiong, X. Li, S. Sun, W. Feng, Z. Liu, J. Shi, W. Ouyang et al., “Hybrid task cascade for instance segmentation,” in Proceedings of the IEEE/CVF Conference on Computer Vision and Pattern Recognition, 2019, pp. 4974–4983.
- [10] S. Xie, R. Girshick, P. Dollár, Z. Tu, and K. He, “Aggregated residual transformations for deep neural networks,” in Proceedings of the IEEE Conference on Computer Vision and Pattern Recognition, 2017, pp. 1492–1500.
- [11] X. Zhu, H. Hu, S. Lin, and J. Dai, “Deformable convnets v2: More deformable, better results,” in Proceedings of the IEEE/CVF Conference on Computer Vision and Pattern Recognition, 2019, pp. 9308–9316.
- [12] T.-Y. Lin, M. Maire, S. Belongie, J. Hays, P. Perona, D. Ramanan, P. Dollár, and C. L. Zitnick, “Microsoft coco: Common objects in context,” in European Conference on Computer Vision. Springer, 2014, pp. 740–755.
- [13] J. Deng, W. Dong, R. Socher, L.-J. Li, K. Li, and L. Fei-Fei, “Imagenet: A large-scale hierarchical image database,” in 2009 IEEE Conference on Computer Vision and Pattern Recognition. IEEE, 2009, pp. 248–255.
- [14] N. Bodla, B. Singh, R. Chellappa, and L. S. Davis, “Soft-nms–improving object detection with one line of code,” in Proceedings of the IEEE International Conference on Computer Vision, 2017, pp. 5561–5569.
- [15] J. Wang, K. Chen, R. Xu, Z. Liu, C. C. Loy, and D. Lin, “Carafe: Content-aware reassembly of features,” in Proceedings of the IEEE/CVF International Conference on Computer Vision, 2019, pp. 3007–3016.
- [16] S. Qiao, L.-C. Chen, and A. Yuille, “Detectors: Detecting objects with recursive feature pyramid and switchable atrous convolution,” in Proceedings of the IEEE/CVF Conference on Computer Vision and Pattern Recognition, 2021, pp. 10 213–10 224.
- [17] S. Liu, L. Qi, H. Qin, J. Shi, and J. Jia, “Path aggregation network for instance segmentation,” in Proceedings of the IEEE Conference on Computer Vision and Pattern Recognition, 2018, pp. 8759–8768.
- [18] H.-S. Fang, J. Sun, R. Wang, M. Gou, Y.-L. Li, and C. Lu, “Instaboost: Boosting instance segmentation via probability map guided copy-pasting,” in Proceedings of the IEEE/CVF International Conference on Computer Vision, 2019, pp. 682–691.
- [19] K. Chen, J. Wang, J. Pang, Y. Cao, Y. Xiong, X. Li, S. Sun, W. Feng, Z. Liu, J. Xu et al., “Mmdetection: Open mmlab detection toolbox and benchmark,” arXiv preprint arXiv:1906.07155, 2019.
- [20] K. He, G. Gkioxari, P. Dollár, and R. Girshick, “Mask r-cnn,” in Proceedings of the IEEE International Conference on Computer Vision, 2017, pp. 2961–2969.
- [21] K. He, X. Zhang, S. Ren, and J. Sun, “Deep residual learning for image recognition,” in Proceedings of the IEEE Conference on Computer Vision and Pattern Recognition, 2016, pp. 770–778.
- [22] H. Zhang, C. Wu, Z. Zhang, Y. Zhu, H. Lin, Z. Zhang, Y. Sun, T. He, J. Mueller, R. Manmatha et al., “Resnest: Split-attention networks,” arXiv preprint arXiv:2004.08955, 2020.