KuaiRec: A Fully-observed Dataset and Insights for Evaluating Recommender Systems
Abstract.
The progress of recommender systems is hampered mainly by evaluation as it requires real-time interactions between humans and systems, which is too laborious and expensive. This issue is usually approached by utilizing the interaction history to conduct offline evaluation. However, existing datasets of user-item interactions are partially observed, leaving it unclear how and to what extent the missing interactions will influence the evaluation. To answer this question, we collect a fully-observed dataset from Kuaishou’s online environment, where almost all users have been exposed to all items. To the best of our knowledge, this is the first real-world fully-observed data with millions of user-item interactions.
With this unique dataset, we conduct a preliminary analysis of how the two factors — data density and exposure bias — affect the evaluation results of multi-round conversational recommendation. Our main discoveries are that the performance ranking of different methods varies with the two factors, and this effect can only be alleviated in certain cases by estimating missing interactions for user simulation. This demonstrates the necessity of the fully-observed dataset. We release the dataset and the pipeline implementation for evaluation at https://kuairec.com.
1. Introduction
Recommender systems (RSs) are designed to estimate users’ preferences on items. A thorny problem in recommendation is how to faithfully evaluate the model, i.e., to tell whether a model can predict the user preference correctly. The most straightforward solution is to conduct the A/B test, which resorts to the online environment to see if real users are satisfied with the recommendations made by the model. However, this is time- and money-consuming and entails the risk of failure (Li et al., 2015; Jagerman et al., 2019). Therefore, it is necessary to evaluate on the offline observed data.
However, the observed data in almost all recommendation datasets is highly sparse, i.e., only a few values are known in the user-item interaction matrix. This imposes great difficulties on evaluation. Specifically, the massive amount of missing values cannot be simply treated as either negative samples or missing-not-at-random (MNAR) data (Little and Rubin, 2019). It means that the sparsely-observed data is not randomly sampled from the whole user-item matrix, which results in the exposure bias permeating through the data generation process in recommendation. The exposure bias can be further divided according to the cause. For example, popularity bias occurs when the model is prone to exposing the popular items (Abdollahpouri and Mansoury, 2020); And positivity bias (or selection bias) is introduced because users have the propensity to select more often the items they like (Pradel et al., 2012; Huang et al., 2020). With these unknown values and pervasive biases in the recommendation data, the results of the offline evaluation are hard to be persuasive, which creates the widely-recognized challenge for evaluating recommender systems (Marlin and Zemel, 2009; De Myttenaere et al., 2014).
To remedy the inherent defect of the data, some researchers present recommendation datasets containing randomly sampled data. For example, both the Yahoo! (Marlin and Zemel, 2009) and Coat (Schnabel et al., 2016) datasets contain a set of missing-complete-at-random (MCAR) data that can be used for unbiased evaluation. However, the MCAR data of these datasets is still too sparse, which can bring a high variance to the evaluation results (Saito et al., 2021).
1.1. A Fully-observed Dataset
In this paper, we try to fundamentally address this issue by introducing KuaiRec, a fully-observed dataset collected from the social video-sharing mobile App, Kuaishou111https://www.kuaishou.com/cn. The term “fully-observed” means there are almost no missing values in the user-item matrix, i.e., each user has viewed each video and left feedback. This fully-observed dataset, dubbed the small matrix for convenience, can be used for faithful evaluation. And for the training purpose, we further collect a larger dataset, dubbed the big matrix, which contains additional interactions for the users and items in the small matrix. Figure 1 gives an illustration of the small matrix and big matrix that make up the KuaiRec dataset. Note that all user-item interactions in the small matrix are excluded from the big matrix to separate the training and evaluation data. Table 1 lists the statistics of KuaiRec. Besides the user-item interaction, we further collect the side information of users and items. On the user side, we collected fields representing users’ personal features, which includes encrypted one-hot vectors describing users’ demographic information (such as age, gender, and city) as well as their personal behaviors. We also collect the social relationship among these users. On the item side, we list each item’s tags, i.e., a set of categories such as {Gaming, Sports}. Furthermore, we collect fields to enhance the detailed information of items, which includes fields describing the statistics of each item within each day from July, 5th, 2020 to September 5th, 2020. For example, how many users click, like, or add a video to their favorite list each day.
To the best of our knowledge, KuaiRec is the first dataset generated from real-world recommendation logs with all users’ preferences on items known, and its scale (millions of user-item interactions) is much larger than the existing MCAR datasets. This can make the evaluation in offline data as effective as the online A/B test since there is no need to handle the missing values, which can benefit many research directions such as:
- •
- •
-
•
Conversational recommender system (CRS), which is a kind of interactive recommender system that further utilizes the abundant features of items (e.g., tags, natural language) to efficiently and flexibly identify user preferences (Gao et al., 2021; Lei et al., 2020b; Li et al., 2021; Lei et al., 2021).
| #users | #Items | #Interactions | Density | |
|---|---|---|---|---|
| Small matrix | 1,411 | 3,327 | 4,676,570 | 99.6% |
| Big matrix | 7,176 | 10,728 | 12,530,806 | 16.3% |
| User feature: |
|
||||
|---|---|---|---|---|---|
| Item feature: |
|
||||
| Social network: |
|
1.2. Insights in Evaluating Recommendations
To demonstrate the efficacy and advantage of KuaiRec, we leverage it to conduct the evaluation of the multi-round conversational recommendation (Lei et al., 2020a; Deng et al., 2021; Xu et al., 2021), a simplified setting in CRSs, which has caught the eyes of the research community recently due to its great potential (Gao et al., 2021). Existing solutions for the evaluation of CRSs usually use the user simulation techniques based on the sparse partially-observed data. However, the trustworthiness of such approaches remains unknown (Gao et al., 2021; Zhang and Balog, 2020). With KuaiRec, we can explore the research question that cannot be answered in existing studies: Is partially-observed data as trustworthy as the fully-observed data w.r.t. the evaluation of CRSs?
As the first attempt to explore the question, we examine two essential factors in partially-observed data: data density and exposure bias. The data density means the ratio of the items exposed to the users, i.e., the proportion of observed values in the user-item matrix. For the exposure bias, we explore three exposure strategies, namely uniformly random exposure (which is unbiased), positivity-oriented exposure (making exposed user-item interactions contain more historically positive samples to simulate the positivity bias (Abdollahpouri and Mansoury, 2020)), and popularity-oriented exposure (making the exposure lean towards the popular samples to simulate the popularity bias (Pradel et al., 2012; Huang et al., 2020)). We can examine the effect of the two factors by sampling part of the user-item interactions from the small matrix as the test set to conduct evaluations. The experimental results on KuaiRec provide three insights: 1) Exposure biases caused by the exposure strategy greatly affect the performances and rankings of different models in evaluation. 2) Even under the uniformly random exposure strategy (i.e., without exposure biases), different data densities can still result in inconsistent results. 3) The remedy that conducts matrix completion on the missing values can only partially alleviate the problem. These insights entail the significance of our fully-observed dataset.
We summarize our contributions as follows:
-
•
We are the first to present a real-world fully-observed dataset (density: almost 100%) in recommendation. It contains millions of dense interactions and rich side information.
-
•
With this unique dataset, we design experiments to illustrate how data density and exposure bias affect the evaluation of recommendations. We further study the effect of estimating the missing values, i.e., matrix completion, on the evaluation results.
We release this dataset as well as the scripts for loading and analyzing its statistics at https://kuairec.com. We also release the pipeline implement for evaluating conversational recommendation at https://github.com/xiwenchao/fully_observed_demo, with the hope to illustrate the advantage of this dataset and support further discussions along with related research topics.
2. Related Work
In this section, we briefly review the datasets and problems in offline evaluation of recommender systems. Then, we introduce conversational recommender systems.
2.1. Offline Evaluation in Recommendation
Online A/B tests have become ubiquitous in tech companies for the purpose of assessing the performances of models and rolling out the improved recommender system (Gilotte et al., 2018). However, it usually consumes much time and money and thus is impractical for academic researchers to conduct the evaluation online.
Therefore, researchers usually resort to offline computing indicators in offline data, e.g., Precision, Recall, NDCG (Järvelin and Kekäläinen, 2000), and MAP (Baeza-Yates et al., 1999). However, such evaluations suffer from strong assumptions, such as independence between items and user feedback can be translated into a supervised task (Gilotte et al., 2018; Marlin et al., 2007). This is inconsistent with the nature of the recommender system, which should be treated as a sequential decision problem (Zhou et al., 2020a; Xin et al., 2020; Wang et al., 2021; Saito et al., 2021).
To address this problem, researchers propose two branches of solutions based on the offline data: 1) off-policy evaluation (OPE), which aims to estimate the performance of the target policy using data generated by a different policy (Swaminathan and Joachims, 2015; Lefortier et al., 2016); 2) user simulation, whose core idea lies in filling the missing values before the evaluation (Zhang and Balog, 2020; Ie et al., 2019). However, while the former solution suffers from the high variance issue (Saito et al., 2021), the latter will inevitably introduce estimation error. The primary cause of the problems is that the offline data is too sparse. In this way, fully-observed data is entailed for exploring how much the sparsity affects the results of the evaluation.
Up to now, far too little attention has been paid to collecting such a dataset. We briefly introduce classic existing high-quality datasets that contain unbiased randomly-sampled data used for offline evaluation in recommendation.
-
•
Yahoo! (Marlin and Zemel, 2009). It contains the conventional missing-not-at-random (MNAR) data that contains approximately 300,000 user-supplied ratings from 15,400 users on 1,000 items in total. It also contains a set of missing-complete-at-random (MCAR) data by asking 5,400 users to give ratings on 10 items that are randomly selected from 1,000 items.
-
•
Coat (Schnabel et al., 2016). It collects the ratings of 290 users on 24 self-selected items and 16 randomly-selected items from total 300 items.
-
•
Open Bandit Dataset (Saito et al., 2021). It contains interactions collected from two logged bandit policies: a Bernoulli Thompson Sampling policy and a uniform (random) policy. There are approximately 26 million interactions collected on users’ clicks on 80 items.
However, these datasets are still highly sparse, e.g., Yahoo! has only 54,000 randomly-selected interactions out of user-item pairs (i.e., density: ). So far, there is no dataset containing dense interaction data, not to mention the fully-observed data, to conduct the faithful evaluation in recommendation.
2.2. Conversational Recommendation
Recommender systems are powerful tools to help users reach their desirable items from a massive amount of items. However, the traditional static recommendation systems have limitations regarding capturing precious real-time user preferences (Zhang et al., 2021; Wang et al., 2020) and interpreting user motivation (Ma et al., 2019; Gao et al., 2019; Yu et al., 2019). Therefore, researchers overcome these problems by developing models that work in an online manner, i.e., interactive recommendation systems, such as the multi-armed bandit (MAB) (Zhao et al., 2013; Christakopoulou et al., 2016; Wang et al., 2018; Li et al., 2021) and deep reinforcement learning (DRL) based models (Zhao et al., 2018; Chen et al., 2019a; Xian et al., 2019; Zheng et al., 2018; Gao et al., 2022).
However, most interactive recommendation methods aim to collect user feedback on all recommended items, which suffer from low efficiency as there are too many of them. Critiquing-based methods, as an early form of conversational recommender systems, ask user questions about attributes to narrow down the item candidate space (Chen and Pu, 2012; Luo et al., 2020b, a). However, there is still a limitation: the models keep alternating asking and recommending, which should be avoided as the recommendation should only be made when the confidence is high. Recently, the emergence of CRSs has solved the problem. Compared with previous methods, a CRS model has an additional user interface that allows for more flexible forms of interaction, e.g., in the form of tags (Christakopoulou et al., 2016, 2018), template utterances (Lei et al., 2020a; Lei et al., 2020b; Li et al., 2021; Deng et al., 2021; Zhang et al., 2022), or free natural language (Ren et al., 2020; Li et al., 2018; Chen et al., 2019b; Zhou et al., 2020b; Liu et al., 2020b; Zhou et al., 2020c; Li et al., 2022; Ren et al., 2022; Liu et al., 2021; Zhou et al., 2022). More importantly, a CRS model has a conversation strategy module that controls the core logic of the multi-turn interaction (Lei et al., 2020a; Lei et al., 2020b; Li et al., 2021; Zhang et al., 2020; Xu et al., 2021; Liu et al., 2020b; Lewis et al., 2017). Since our goal is to illustrate the necessity of the proposed fully-observed dataset in the offline evaluation, we focus on the multi-turn conversational recommendation which pays attention to the core interaction logic without the need to process the raw natural language.
Nonetheless, there are still a lot of challenges in CRSs needed to be addressed (Gao et al., 2021). One of the main challenges is the evaluation of CRSs. To achieve that, researchers have to build user simulators to evaluate CRSs before serving online users (Figure 2). However, they are typically learned on the sparsely-observed data which usually contains various biases. (Gao et al., 2021; Huang et al., 2020) point out that the evaluation of CRSs by these biased user simulators might not be trustworthy. Thereby, the fully-observed dataset proposed in this work can serve as a necessary testbed for evaluating CRSs.
3. Data Collection
In this section, we introduce the data collection process and show the representativeness of the collected data.
3.1. The KuaiRec Dataset
We collect the data from Kuaishou App, a famous short-video platform with billions of users. On this platform, users can watch a variety of short-form videos from genres such as dance, entertainment, and fitness/sports. The videos are organized by recommending streaming where each time the user can see only one video. The user can swipe up or down to skip to the last or next videos at any time without having to wait for the end of the video. In this paper, we sometimes refer to videos as items for ease of understanding.
3.1.1. Collecting Fully-observed Data (i.e., The Small Matrix)
All the users and videos in our dataset, as well as their interaction records, are collected in the period from July, 5th, 2020 to September 5th, 2020 on Kuiashou App. Over this period, we first collect a set of videos that are excluded from all advertisements (i.e., sponsored items), junk videos, and spammers. Then we further select a subset of users and videos from them, aiming to enable as many selected videos as possible to have been watched by the selected users (i.e., high density). For the missing values, i.e., the rest videos that the user did not watch, we manipulate the online recommendation rule to insert these videos into the recommendation streaming to make sure all of them have been shown to these users and received feedback. It takes days for this exposure process.
Finally, there are users and videos that compose a matrix where each element represents a user’s feedback on a video. The density of this matrix is instead of because some users have explicitly blocked the videos from certain authors. We refer to this fully-observed matrix as the small matrix. We admit that the high density can inevitably bring in the popularity bias (Abdollahpouri and Mansoury, 2020), however, it can still serve as a trustworthy testbed to evaluate and compare different recommendation models.
3.1.2. The Big Matrix: Peripheral Data of the Small Matrix
The fully-observed dataset can be used for the trustworthy evaluation of CRSs. However, we need additional data for the training of CRSs (Sun and Zhang, 2018; Lei et al., 2020a; Lei et al., 2020b). Hence, we collect a partially-observed data that contains the interactions of more users and videos. We refer to this larger data as the big matrix. It contains users and videos that include all the users and videos in the small matrix. Note that all user-item interactions in the small matrix are excluded from the big matrix to separate the training and evaluation data.
3.1.3. Defining the Positive Interactions
Our collected raw data contains various user feedback on each watched video such as comments, likes, the total time spent on the video, etc. Without losing generality, we binarize each user-video pair into either positive or negative samples accordingly to the watch time. Specifically, we define a user-video pair as a positive sample if the user’s cumulative watching time of this video is greater than twice the duration of this video, i.e., the user has watched this video completely at least twice. This is deemed as a strong indicator of the users’ preference for the videos suggested by the data analysis team of Kuaishou. The process is illustrated in Figure 3. We did not use the raw “Like” signal left by users because it is too sparse.
3.1.4. Side Information Collection
We collect the rich features for the users and videos in the big matrix as shown in Table 1. On the user side, we collected fields representing users’ personal features, which includes encrypted one-hot vectors. Besides, people’s minds can be affected by their friends. Therefore, we collect the social network of the users in the big matrix to benefit the social recommendation (Yu et al., 2018, 2019).
On the item side, we collect fields to enhance the detailed information of items, which includes fields describing the statistics of each item within each day from July, 5th, 2020 to September 5th, 2020. For example, how many users click, like, or add a video to their favorite lists each day. Especially, we collect genres (i.e., tags) of videos. These tags are manually defined and annotated by the internal annotation team of Kuaishou. Each video is related to at least one and at most four tags. These tags, such as fitness/sports and recipes, are very useful in the question asking and candidate reduction in conversational recommendation models. Armed with these features, researchers can study more comprehensive topics using this dataset.
3.2. Hypothesis Testing of Representativeness
Now, we show that the users and videos in the collected fully-observed small matrix are representative of all users and videos in the whole Kuaishou platform. Specifically, we first select six key features (see Table 2) for users and videos, respectively. These features are thought to be the most representative to describe the properties of the users/videos by the data analysis team of Kuaishou. Then, we conduct the discrete two-sample Kolmogorov–Smirnov (KS) tests (Marsaglia et al., 2003) to verify whether the users (or videos) in the small matrix have the same distribution, w.r.t. the six features, as all users (or videos) in the one-month data of Kuaishou.
Our null hypothesis is that the two distributions have no significant difference w.r.t. each feature, i.e., samples from the two data are drawn from the same distribution. We conduct the tests under a rejection level and report the corresponding p-values in Table 2.
It’s clear to see that the p-values of all KS tests on each feature are above the rejection level of . It means that we cannot reject the null hypothesis, i.e., users and videos in the fully-observed data are sufficiently representative to reflect the general properties of the users and videos on the whole Kuaishou platform.
| Feature | Feat1 | Feat2 | Feat3 | Feat4 | Feat5 | Feat6 |
|---|---|---|---|---|---|---|
| User | 92.89% | 88.27% | 6.03% | 53.44% | 19.00% | 6.56% |
| Video | 88.27% | 97.62% | 99.96% | 31.97% | 79.74% | 99.96% |
4. Environment Setting for CRS
To better illustrate how to utilize the proposed dataset in evaluating recommendations, we focus on the Multi-round Conversational Recommendation (MCR) scenario (Lei et al., 2020a). We will start with the introduction of MCR as well as how the user simulator is built. Then we introduce how we synthesize the biased partially-observed data to explore its effect on the evaluation.
4.1. Multi-round Conversational Setting
The MCR setting is thought to be the most straightforward and realistic conversational recommendation setting in research so far and has been widely employed in many CRSs (Lei et al., 2020b; Lei et al., 2020a; Xu et al., 2021; Zhang et al., 2018; Li et al., 2021).
MCR is a typical form-based (Jannach et al., 2021) setting, which means users interact with the system in pre-defined manners instead of dynamically generated natural languages. Thereby we can focus on the core interaction logic rather than language understanding. In MCR, a multi-round interaction process between a CRS model and a user (usually a simulated one) is called one conversation (a.k.a. one conversation session). The system can choose to either ask a question or recommend items to the user at each conversation turn. If the current turn is to recommend, the CRS model recommends top- items and expects a response as “Yes” or “No”. Otherwise, the CRS model asks a question about attributes such as “Would you like videos with the fitness/sport tag?” Then the system will receive binary feedback from the user as “Yes” or “No”. If the response from the user about querying attributes or items is negative, the system removes the corresponding videos from the candidate pool. If the user gives positive feedback to the asked attribute, the agent removes all items that do not contain the preferred attribute from the candidate pool. The conversation will continue until the user accepts the recommended items. To best satisfy the users, the objective of CRSs in the MCR setting is to make successful recommendations with the fewest conversation turns.
As discussed in Section 2.2, researchers built user simulators to automate the evaluation of CRSs. To simulate a user, the simulator needs to give feedback on the items or attributes based on the user preferences estimated from the existing observed data (Lei et al., 2020b; Lei et al., 2020a; Li et al., 2021; Zhang et al., 2018, 2020). However, it remains unknown how sparsity and biases in the partially-observed data affect the evaluation.
4.2. Synthesizing Partially-observed Data
Although we can conduct a trustworthy evaluation using the fully-observed data, we want to find out how partially-observed data affect the evaluation. For example, how does the density of the partial data affect the evaluation? And, how do the biases introduced by exposure strategies in the partial-observed data affect the performances and rankings of different models? Therefore, we employ three types of widely used exposure strategies to generate partially-exposed data in the small matrix to synthesize the partially-observed data for evaluation.
4.2.1. Uniformly Random Exposure
Uniformly random is an ideal way to get the data without exposure biases. The collected data is treated to be a reasonable substitute for fully-observed data. We uniformly sample the elements in the small matrix without replacement for times, with the density setting to accordingly. The sampled missing at random (MAR) data are used in our experiments to explore how the data density affects the evaluation of CRSs.
4.2.2. Positivity-oriented Exposure
In reality, the partially-observed data is usually biased towards the items that users like, which can be explained for two reasons. First, users tend to choose the items they like to consume or rate, a.k.a., selection bias (Marlin et al., 2007). Second, the recommendation result can be dominated by the highly-confident items provided by the model (Liu et al., 2020a). Therefore, we employ positivity-oriented exposure to simulate such biased partially-observed data. Specifically, for each user in the small matrix, we sample without replacement a certain number of items with respect to the positivity distribution calculated on the big matrix, e.g., if item A is liked by users and item B is liked by users in the big matrix, the exposure probability of A should be three times of B. Similarly, with varying the density in , we get sampled missing not at random (MNAR) datasets containing the positivity bias.
4.2.3. Popularity-oriented Exposure
The recommendation model can also bias toward the popular items. Therefore, it is common for the partially-observed data to contain popularity bias (Abdollahpouri and Mansoury, 2020). To satisfy the long-tail distribution requirement222Real-world recommendation data always satisfies a long-tail distribution (Park and Tuzhilin, 2008; Yin et al., 2012), we employ Zipf’s law (Newman, 2005) to decide the probability of each item to be exposed. Specifically, for each user in the small matrix, we set the probability of exposing the -th popular item as , where , (the number of items in the small matrix) in our paper. This order of items is set as the order of popularity of items (the number of occurrences) in the big matrix. This leads the data to follow the long-tail distribution, while the original order of the popularity for items is preserved. Again, we derive the sampled MNAR datasets containing popularity bias with the data density equal to .
5. Experiments
In this section, we conduct intensive experiments on the evaluation of CRSs on the KuaiRec dataset.
5.1. Experimental Setting
5.1.1. Research Questions
we will organize our experiments and analyze the results based on the two questions:
RQ1: How does the partially-exposed data (with and without biases) affect the evaluation of CRSs?
RQ2: Can we improve the evaluation on the partially-exposed data by estimating the missing values (i.e., matrix completion)?
5.1.2. Evaluation Setting
We conduct experiments on the MCR setting, which has been introduced in Section 4.1 in detail. We follow the configurations in EAR (Lei et al., 2020a). Typically, we set the maximum round of each conversation to 15, since users always have limited patience. And the length of the recommendation list in each round is set to 10. To explore the helpfulness of estimating the missing values, we compare the evaluation results of CRSs on different partially observed data before and after matrix completion.
5.1.3. User Simulation
As discussed in Section 2.2, we need a user simulator to interact with the CRS. In our experiments, we simulate users from the partially-exposed matrix created on the small matrix.
It is worth mentioning that most existing studies (Sun and Zhang, 2018; Lei et al., 2020a; Lei et al., 2020b) used the single-target ground truth (STG) setting to evaluate CRSs. In the STG setting, the target of each conversation is to recommend one ground-truth item. If the recommended top- items contain the ground-truth item, the user simulator accepts the recommendation and ends the conversation successfully. When the CRS model asks a question, the user simulator gives positive feedback only if the asked attribute belongs to the ground-truth item.
However, in real practice, users tend to have multiple preferences and diverse interests (Aziz, 2020; Lytras et al., 2021). For example, in the video recommendation streaming, the user may like and accept more than one video recommended by the system. In this case, many videos liked by the user will be mistakenly treated as negative samples under the STG setting. Therefore, we pay more attention to the multi-target ground truth (MTG) setting where users have multiple ground-truth items in a session. Specifically, the user simulator accepts the recommendation only if one of the ground-truth items is in the recommended top- items. When the CRS model asks a question, the user simulator gives positive feedback if at least one of the ground-truth items contains the queried attribute.
In the evaluation, the number of conversations equals the number of positive user-item pairs in the test set, i.e., we will conduct one conversation for each positive sample in both the STG and MTG settings. The difference is that in the MTG setting we will remove the accepted item from the ground-truth set after a successful recommendation for each simulated user.
5.1.4. Metrics
Following (Lei et al., 2020b; Lei et al., 2020a; Sun and Zhang, 2018), we use two metrics to assess the performance of CRS models in the multi-round conversation. The first is the Average Turns (AT) of all conversations. It is expected to be as small as possible because the model should make successful recommendations with the fewest rounds. Another metric is Success Rate (SR@): the proportion of the conversations ended before (or at) round in all the conversations.
5.1.5. Baselines
We select four representative CRS as baselines. All of them have a recommendation model to measure the similarity between users and items, as well as a conversation strategy to decide whether to ask attributes or make recommendations. We use the factorization machine (FM) model (Rendle, 2010) as the recommendation engine in all four methods for ease of comparison.
-
•
Max Entropy (Sun and Zhang, 2018). When asking questions, it always chooses an attribute with the maximum entropy within the current candidate item set.
-
•
Abs Greedy (Christakopoulou et al., 2016). It focuses on recommending items in every round without asking any questions and keeps updating the model by treating the rejected items as negative examples.
-
•
CRM (Sun and Zhang, 2018). It records user preference in a belief tracker and uses reinforcement learning (RL) to find the optimal policy.
-
•
EAR (Lei et al., 2020a) A classic CRS model that contains a strategy module based on the RL model similar to CRM, except it considers a more sophisticated state in RL.
Since all the above models contain relatively complex components, i.e., the FM model, we further add four heuristic methods, each of which only contains a naive conversation strategy.
-
•
Random. It randomly selects items from the candidate set to recommend in every turn without asking any questions.
-
•
Popularity-oriented Recommender (PopRec). Recommending the top popular items in the candidate sets at every turn without asking any questions.
-
•
Positivity-oriented Recommender (PosRec). Similar to PopRec, except it recommends the most positive items in the rest of the item candidates. The most positive items are the items loved by as many users as possible in big matrix.
-
•
Attribute-asking Recommender (AttrAskRec). It alternates asking attributes and recommending items. When asking a question, it asks about the most popular attribute; when recommending, it randomly recommends 10 items.
5.2. Exploring the Effects of Partially-Exposed Data in CRS Evaluation
We use the sampled partially-exposed data to explore how the density and exposure strategy affect the evaluation of CRSs. Specifically, we repeat the evaluation times and report the average AT and average SR@ over all conversations. The partially-exposed data are generated from the small matrix following the rules in Section 4.2. It should be noted that all CRS methods are already trained on the big matrix before the evaluation.
Instead of paying attention to the absolute performance of the eight methods, we focus on how the rankings (i.e., the relative order) of these CRSs change w.r.t. various densities and exposure strategies. We start with the STG setting and then make the counterpart experiments in the MTG setting with the same configurations.
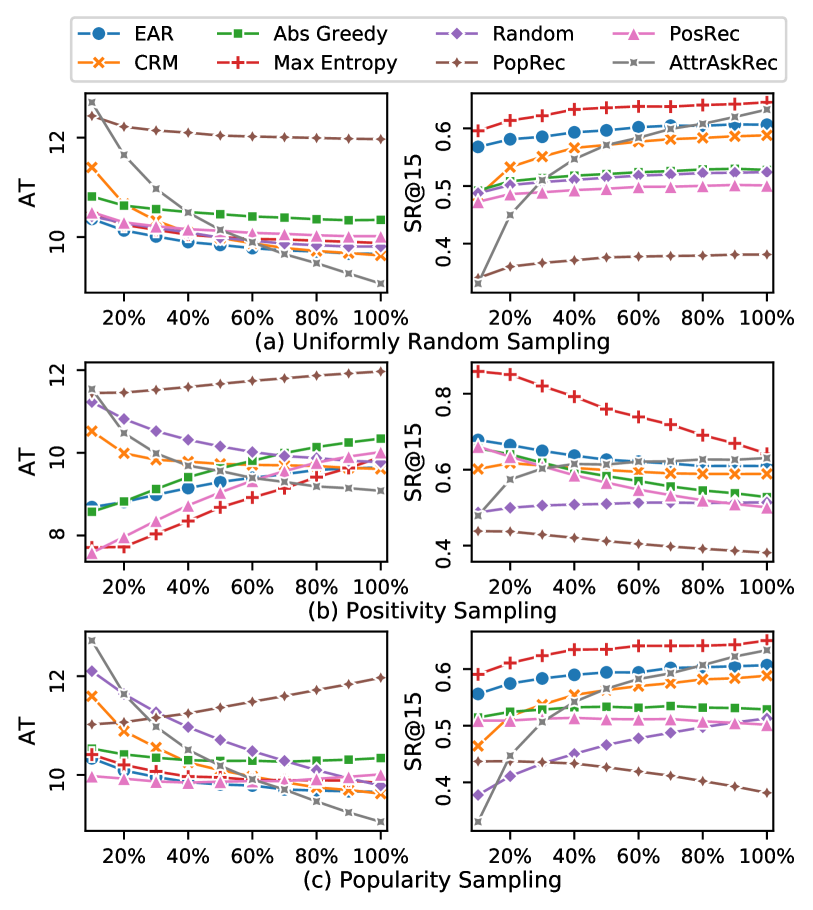
5.2.1. Analyzing the Results under the STG Setting
We illustrate the results of eight methods on the STG setting under three exposure strategies and densities (including the fully observed data) in Figure 4. From the results, we can get the following insights:
Uniformly Random Exposed Data in Evaluation. In the results of uniformly random exposure, the performance rankings of eight methods keep unchanged and the performances almost keep stable (except for the Abs Greedy) over all densities. This is intuitive as the positive samples under the uniformly random exposure are independent and identically distributed. Thus the average performance will not vary much with different data densities due to the law of large numbers (Dekking et al., 2005).
Effects of Positivity Biases in Evaluation. In the results of positivity-oriented exposure, PosRec performs satisfyingly at the beginning and becomes worse as the density increases. This is due to its recommendation mechanism (i.e., always recommending the most positive items in the big matrix) is correlated with the mechanism of the exposure strategy. Specifically, when the data density is low, the exposed positive samples are the most positive items, therefore the CRS can find each of them easily in a few turns, hence the AT is low and SR@15 is high. However, when the density increases, more items with a relatively low positivity ratio will be sampled in our synthesized testing dataset. Those items have low rankings in the recommended list of PosRec. Therefore the performance deteriorates because of these “hard to predict” items. It is interesting that EAR shows a similar trend, which demonstrates that EAR also tends to recommend positive items. Aside from EAR and PosRec, other methods have relatively stable absolute performance and consistent rankings, indicating that these methods are not vulnerable to the positivity bias under the STG setting.
Effects of Popularity Biases in Evaluation. The results show a similar phenomenon: only PopRec has unstable performance and inconsistent rankings. It is because PopRec always recommends the most popular items, making it easy to find the correct items when the exposed items are the most popular ones. When the unpopular items are exposed with the data density increasing, the average performance of PopRec is held back by the unpopular items which are hard to predict. Other methods have stable performance and consistent rankings, indicating that they are not sensitive to the popularity bias under the STG setting.
In the STG setting, each item is evaluated independently, which is straightforward for the learning and evaluation of CRSs. However, the users in most real-world applications have multi interests and there is more than one correct answer in the evaluation. Therefore, we explore how things work in the MTG setting.
5.2.2. Analyzing the Results under the MTG Setting
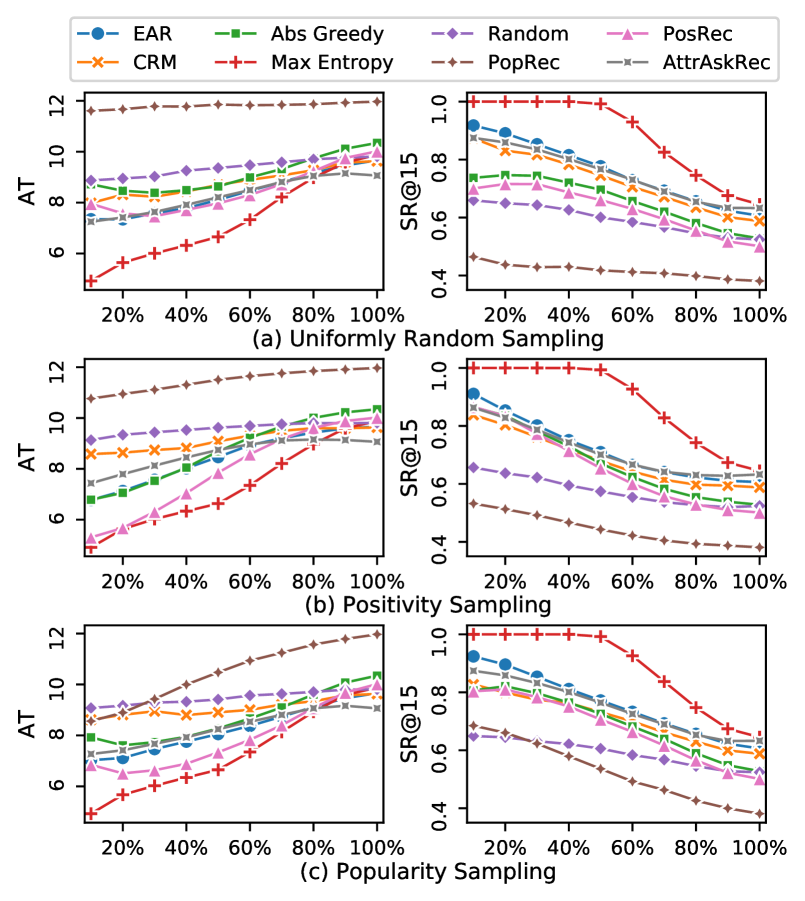
In the MTG setting, we implement the counterpart experiments above and show the results in Figure 5. It’s obvious that the results are quite different compared to the results in the STG setting. Even under the uniformly random exposure, both the absolute performance and rankings of the CRSs vary a lot on different testing data.
Challenges and Opportunities under the MTG Setting. The instability of the results comes from the complexity of the MTG setting. As discussed in Section 5.1.3, a successful recommendation is achieved when at least one of the ground-truth items is contained in the recommended list. However, multiple ground-truth items do not mean that the recommendation task becomes easier. Instead, a system needs to estimate user preferences based on diverse feedback (recall that user simulators give feedback based on multiple preferred items). Under the MTG setting, Max Entropy, with a simple conversation strategy, surprisingly performs best on SR@15. The reason that Max Entropy outperforms EAR might be that EAR is specifically designed under the STG setting. However, there is no CRS designing for the MTG setting until now. It remains to be a promising direction to develop the CRS under the MTG setting since MTG is more realistic in real life.
Effects of the Question Asking in the MTG Setting. Since the MTG setting is more complicated, the next question is how a model can perform well in this setting. From the results, we find some clues: we observe that asking attributes affects the performance in the MTG setting more significantly than in the STG setting.
There are two empirical observations: First, the AttrAskRec method performs worst in the STG setting, but it performs very well when the data density is large in the MTG setting. Second, CRM outperforms Max Entropy on AT at a certain point when the density increases. We found that CRM tends to ask more questions than Max Entropy. Specifically, we calculate the average probability for CRM to ask a question in each turn is , while Max Entropy is .
To understand the reason, we revisit the mechanism of the user simulator in the MTG setting. When being asked a question about an attribute, the user simulator will return positive feedback if one of the ground-truth items contains the queried attribute. Therefore, when there are few ground-truth items (when the density is small), many asked questions will be rejected, which wastes the interaction turn. Thus, the average turns will be high. Conversely, when there are more ground-truth items (when the data density is high), it will be easier for the CRS to get positive feedback after asking questions. The positive response can help the CRS quickly narrow down the list of candidate items, which results in smaller average turns.
Effects of Biases in the MTG Setting. Similar to the observation in the STG setting, the positivity biases and popularity biases can still affect the evaluation results of CRSs. More precisely speaking, the rankings of CRSs change more sharply. For instance, Random behaves badly when the density is low on data exposed with positivity bias. In this case, almost all exposed items have a high positivity ratio, so randomly recommending items can be a poor strategy. When the density increases and more items with a relatively low positivity ratio are exposed, the relative performance of Random increases. By contrast, the absolute performance of PosRec decreases as the density increases. PosRec only recommends items with maximal positivity ratio, hence it is unable to recommend items with low positivity ratio. Nevertheless, when the data is sampled uniformly randomly, the variation of absolute performance of both Random and PosRec is much milder. Therefore, the bias brought by the exposure strategy can aggravate the discordance of rankings.
5.3. Effects of Estimating the Missing Values
We further investigate the effects of the remedy: estimating the missing values in the partially-exposed matrix and using the estimated positive samples for building the user simulator in evaluation.
5.3.1. Matrix Completion
Estimating missing values, i.e., matrix completion is a well-studied research topic. Due to the limitation of space, we only select three methods related to our research: probabilistic matrix factorization (PMF) (Salakhutdinov and Mnih, 2007), exposure matrix factorization (ExpoMF) (Liang et al., 2016) and its variant ExpoMF-cov (Liang et al., 2016). All of these methods are classic baselines of the probabilistic methods in matrix factorization (MF). PMF is an ordinary MF method without considering biases in the data, while ExpoMF and ExpoMF-cov are more sophisticated methods since they use a random variable to model whether a user-item interaction happens. i.e., they can differentiate the unobserved event from a negative preference, which shows an advantage in situations where there are few exposed interactions. The difference between ExpoMF-cov and ExpoMF is that ExpoMF-cov adds the additional exposure covariates to take into account the additional item features.
We train these methods on the observed part of all datasets with the density and exposure strategy varied and test the performance on the unobserved part, i.e., unsampled values. We report the Recall@ and Recall@ on all datasets and illustrate the results in Figure 6. From the results, we observe the following insights:
Effects of Explicit Modeling the Exposure Event. PMF shows an inferior performance to two debiased methods (ExpoMF and ExpoMF-cov), especially under uniformly random exposure and popularity-oriented exposure. It is due to the fact that ExpoMF and ExpoMF-cov take into account whether the value in the training data represents an unobserved event or a negative sample. Therefore, with the increase of sampled positive values , their performances are constantly improved.
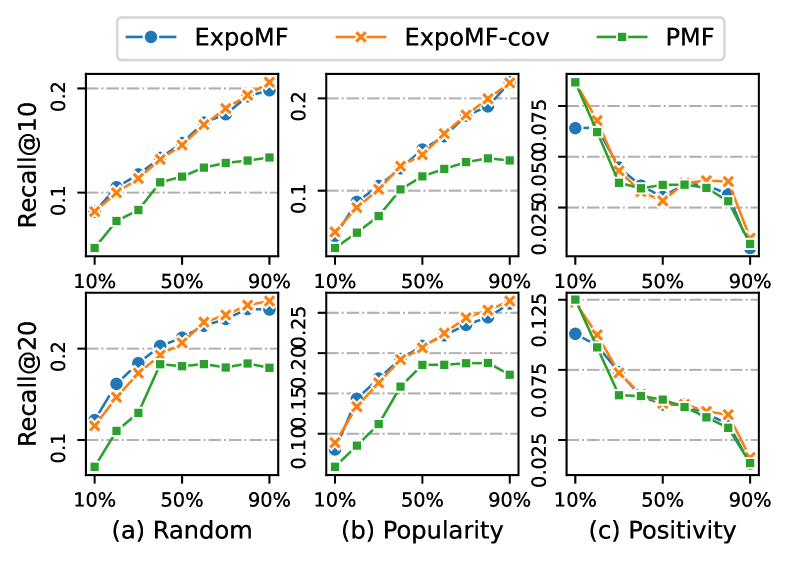
Effects of Positivity Biases in Matrix Completion. The curves of all three methods show a downward trend in the results of the positivity-oriented exposure with the density increasing. It is inevitable because the number of positive samples (i.e., ground-truth preferences) needed to predict decreases sharply with the density increases, and the remaining unexposed positive samples are actually loved by a few users and thus are hard to predict by the model. When the observed data has a larger probability of containing positive samples than the unobserved part, i.e., contains positivity bias, the task of completing all missing values in the matrix will be hard. The influence becomes more serious with positivity bias becoming more severe, which explains the downward trend of the curves.
5.3.2. Analyses of The Effects of Estimated Values in Evaluation
Due to the limited space, we only select ExpoMF-cov, which performs best in our experiments, to estimate the missing values in the partially-exposed data and evaluate all CRSs on the completed matrix. Note that the CRSs are pre-trained on the big matrix. The results of the CRS evaluation conducted on the completed data are illustrated in Figure 7. We calculate the number of the sampled datasets having inconsistent ranking of a CRS before and after matrix completion in Table 3. An inconsistent ranking means the ranking of a CRS on the current test set is inconsistent with the counterpart on the fully observed data. For example, the ranking of EAR is 5 on the fully observed data and is 7 on a sampled dataset under the positivity-oriented exposure when the density is , then EAR has an inconsistent ranking under the two different datasets.
Effects of Completing the Partially-exposed Data. By analyzing the results w.r.t. SR@15 in Table 3, we find that matrix completion can alleviate the inconsistency of CRSs in certain cases. For instance, under the random exposure, EAR has inconsistent rankings on sampled partially-exposed datasets with different data densities. The number reduces to after estimating the missing values. There are nearly half of the values in the table decrease after matrix completion, and the improvement is evident under the random exposure. This validates the helpfulness of matrix completion.
However, the matrix completion does not help restore the true rankings of CRSs w.r.t. AT, where only the number of PopRec decreases. We argue that it is because most CRSs have the indistinct absolute performance w.r.t. AT (see Figure 5), and the estimating error introduced by matrix completion can further blur the difference between them. By contrast, the absolute performances of different CRSs on SR@15 are more distinguishable, hence it is easier to restore the truth rankings after completing the matrix, even though the matrix completion introduces some errors.
Effects of Biases after Estimating Missing Values. Generally, even after estimating the missing data, the number of inconsistent rankings of the uniformly randomly sampled data is smaller than the sampled data with biases. This indicates that the biases in the evaluation data persist to affect the CRS evaluation even after estimating the missing values. In some cases, completing the missing values can bring additional errors that make the evaluation worse. Therefore, estimating the missing values in partially-exposed data can only help identify the true evaluation rankings of CRSs in certain cases where the biases are not serious. Therefore, these insights further highlight the importance of our fully-observed dataset.
| Random | Popularity | Positivity | ||||
|---|---|---|---|---|---|---|
| Methods | AT | SR@15 | AT | SR@15 | AT | SR@15 |
| EAR | 9/9 | 7/5 | 9/9 | 7/6 | 9/9 | 6/5 |
| CRM | 9/9 | 5/0 | 9/9 | 4/4 | 9/9 | 3/3 |
| Abs Greedy | 4/7 | 3/0 | 7/8 | 3/4 | 6/7 | 3/3 |
| Max Entropy | 5/9 | 0/0 | 9/9 | 0/0 | 9/9 | 0/0 |
| Random | 5/9 | 3/8 | 9/9 | 9/8 | 9/9 | 8/8 |
| PopRec | 1/0 | 1/0 | 3/2 | 3/2 | 1/0 | 0/2 |
| PosRec | 5/9 | 2/8 | 9/9 | 8/8 | 8/8 | 8/8 |
| AttrAskRec | 6/8 | 7/5 | 7/8 | 7/6 | 7/8 | 6/5 |
6. Conclusion
In this paper, we present KuaiRec, a fully-observed dataset in recommender systems. We use this dataset to synthesize partially-exposed data to study how the data density and exposure bias in the traditional partially-observed data affect the evaluation of recommendations. Extensive experiments provide interesting insights into the evaluation of CRSs.
However, there are loose ends to our discussions. We hope our unique fully-observed data can support more research in a broader context. First, it can serve as a testbed for building trustworthy user simulators using partially-observed user-item interactions. Although the matrix completion in our experiments demonstrates limited help, it still remains an open question on whether it is possible to use partially-observed data to simulate fully-observed data correctly. Our fully-observed data can further support this exploration. Second, the fully-observed dataset can serve as a benchmark dataset for many research directions in recommendation, such as debiasing in recommender systems, interactive recommendation, and faithful evaluation. At last, after releasing this fully-observed data, we want to encourage the efforts of collecting more fully-observed datasets with richer properties, such as multiple domains or more diverse demographics.
7. Acknowledgements
This work is supported by the National Natural Science Foundation of China (61972372, U19A2079, 62102382).
References
- (1)
- Abdollahpouri and Mansoury (2020) Himan Abdollahpouri and Masoud Mansoury. 2020. Multi-sided exposure bias in recommendation. International Workshop on Industrial Recommendation Systems (IRS2020) in Conjunction with ACM KDD ’2020 (2020).
- Aziz (2020) Haris Aziz. 2020. Strategyproof multi-item exchange under single-minded dichotomous preferences. Autonomous Agents and Multi-Agent Systems 34, 1 (2020), 1–11.
- Baeza-Yates et al. (1999) Ricardo Baeza-Yates, Berthier Ribeiro-Neto, et al. 1999. Modern Information Retrieval. Vol. 463. ACM press New York.
- Chen et al. (2019a) Haokun Chen, Xinyi Dai, Han Cai, Weinan Zhang, Xuejian Wang, Ruiming Tang, Yuzhou Zhang, and Yong Yu. 2019a. Large-Scale Interactive Recommendation with Tree-Structured Policy Gradient. In AAAI ’19, Vol. 33. 3312–3320.
- Chen et al. (2020) Jiawei Chen, Hande Dong, Xiang Wang, Fuli Feng, Meng Wang, and Xiangnan He. 2020. Bias and Debias in Recommender System: A Survey and Future Directions. arXiv preprint arXiv:2010.03240 (2020).
- Chen and Pu (2012) Li Chen and Pearl Pu. 2012. Critiquing-based Recommenders: Survey and Emerging Trends. User Modeling and User-Adapted Interaction 22, 1-2 (2012), 125–150.
- Chen et al. (2019b) Qibin Chen, Junyang Lin, Yichang Zhang, Ming Ding, Yukuo Cen, Hongxia Yang, and Jie Tang. 2019b. Towards Knowledge-Based Recommender Dialog System. In Proceedings of the 2019 Conference on Empirical Methods in Natural Language Processing and the 9th International Joint Conference on Natural Language Processing (EMNLP-IJCNLP ’2019). 1803–1813.
- Christakopoulou et al. (2018) Konstantina Christakopoulou, Alex Beutel, Rui Li, Sagar Jain, and Ed H. Chi. 2018. Q&R: A Two-Stage Approach toward Interactive Recommendation. In KDD ’18. 139–148.
- Christakopoulou et al. (2016) Konstantina Christakopoulou, Filip Radlinski, and Katja Hofmann. 2016. Towards Conversational Recommender Systems. In KDD ’16. 815–824.
- De Myttenaere et al. (2014) Arnaud De Myttenaere, Bénédicte Le Grand, Boris Golden, and Fabrice Rossi. 2014. Reducing Offline Evaluation Bias in Recommendation Systems. arXiv preprint arXiv:1407.0822 (2014).
- Dekking et al. (2005) Frederik Michel Dekking, Cornelis Kraaikamp, Hendrik Paul Lopuhaä, and Ludolf Erwin Meester. 2005. A Modern Introduction to Probability and Statistics: Understanding Why and How. Springer Science & Business Media.
- Deng et al. (2021) Yang Deng, Yaliang Li, Fei Sun, Bolin Ding, and Wai Lam. 2021. Unified Conversational Recommendation Policy Learning via Graph-Based Reinforcement Learning (SIGIR ’21). 1431–1441.
- Gao et al. (2022) Chongming Gao, Wenqiang Lei, Jiawei Chen, Shiqi Wang, Xiangnan He, Shijun Li, Biao Li, Yuan Zhang, and Peng Jiang. 2022. CIRS: Bursting Filter Bubbles by Counterfactual Interactive Recommender System. arXiv preprint arXiv:2204.01266 (2022).
- Gao et al. (2021) Chongming Gao, Wenqiang Lei, Xiangnan He, Maarten de Rijke, and Tat-Seng Chua. 2021. Advances and Challenges in Conversational Recommender Systems: A Survey. AI Open 2 (2021), 100–126.
- Gao et al. (2019) Chongming Gao, Shuai Yuan, Zhong Zhang, Hongzhi Yin, and Junming Shao. 2019. BLOMA: Explain Collaborative Filtering via Boosted Local Rank-One Matrix Approximation. In DASFAA ’19. Springer, 487–490.
- Gilotte et al. (2018) Alexandre Gilotte, Clément Calauzènes, Thomas Nedelec, Alexandre Abraham, and Simon Dollé. 2018. Offline A/B Testing for Recommender Systems. In WSDM ’18. 198–206.
- Huang et al. (2020) Jin Huang, Harrie Oosterhuis, Maarten de Rijke, and Herke van Hoof. 2020. Keeping Dataset Biases out of the Simulation: A Debiased Simulator for Reinforcement Learning Based Recommender Systems. In RecSys ’20. 190–199.
- Ie et al. (2019) Eugene Ie, Chih-wei Hsu, Martin Mladenov, Vihan Jain, Sanmit Narvekar, Jing Wang, Rui Wu, and Craig Boutilier. 2019. Recsim: A Configurable Simulation Platform for Recommender Systems. arXiv preprint arXiv:1909.04847 (2019).
- Jagerman et al. (2019) Rolf Jagerman, Ilya Markov, and Maarten de Rijke. 2019. When People Change Their Mind: Off-Policy Evaluation in Non-Stationary Recommendation Environments. In WSDM ’19. 447–455.
- Jannach et al. (2021) Dietmar Jannach, Ahtsham Manzoor, Wanling Cai, and Li Chen. 2021. A Survey on Conversational Recommender Systems. ACM Computing Survey 54, 5, Article 105 (may 2021), 36 pages.
- Järvelin and Kekäläinen (2000) Kalervo Järvelin and Jaana Kekäläinen. 2000. IR Evaluation Methods for Retrieving Highly Relevant Documents. In SIGIR ’00. 41–48.
- Lefortier et al. (2016) Damien Lefortier, Adith Swaminathan, Xiaotao Gu, Thorsten Joachims, and Maarten de Rijke. 2016. Large-scale Validation of Counterfactual Learning Methods: A Test-bed. arXiv preprint arXiv:1612.00367 (2016).
- Lei et al. (2021) Wenqiang Lei, Chongming Gao, and Maarten de Rijke. 2021. RecSys 2021 Tutorial on Conversational Recommendation: Formulation, Methods, and Evaluation. In RecSys ’21. 842–844.
- Lei et al. (2020a) Wenqiang Lei, Xiangnan He, Yisong Miao, Qingyun Wu, Richang Hong, Min-Yen Kan, and Tat-Seng Chua. 2020a. Estimation-Action-Reflection: Towards Deep Interaction Between Conversational and Recommender Systems. In WSDM’ 20. ACM, 304–312.
- Lei et al. (2020b) Wenqiang Lei, Gangyi Zhang, Xiangnan He, Yisong Miao, Xiang Wang, Liang Chen, and Tat-Seng Chua. 2020b. Interactive Path Reasoning on Graph for Conversational Recommendation. In KDD ’20. 2073–2083.
- Lewis et al. (2017) Mike Lewis, Denis Yarats, Yann Dauphin, Devi Parikh, and Dhruv Batra. 2017. Deal or No Deal? End-to-End Learning of Negotiation Dialogues. In EMNLP ’17. 2443–2453.
- Li et al. (2015) Lihong Li, Jin Young Kim, and Imed Zitouni. 2015. Toward Predicting the Outcome of an A/B Experiment for Search Relevance. In WSDM ’15. 37–46.
- Li et al. (2018) Raymond Li, Samira Ebrahimi Kahou, Hannes Schulz, Vincent Michalski, Laurent Charlin, and Chris Pal. 2018. Towards Deep Conversational Recommendations. In NeurIPS ’18. 9748–9758.
- Li et al. (2021) Shijun Li, Wenqiang Lei, Qingyun Wu, Xiangnan He, Peng Jiang, and Tat-Seng Chua. 2021. Seamlessly Unifying Attributes and Items: Conversational Recommendation for Cold-Start Users. TOIS ’21 (2021).
- Li et al. (2022) Shuokai Li, Ruobing Xie, Yongchun Zhu, Xiang Ao, Fuzhen Zhuang, and Qing He. 2022. User-Centric Conversational Recommendation with Multi-Aspect User Modeling. SIGIR (2022).
- Liang et al. (2016) Dawen Liang, Laurent Charlin, James McInerney, and David M. Blei. 2016. Modeling User Exposure in Recommendation. In WWW ’16. 951–961.
- Little and Rubin (2019) Roderick JA Little and Donald B Rubin. 2019. Statistical Analysis with Missing Data. Vol. 793. John Wiley & Sons.
- Liu et al. (2020a) Dugang Liu, Pengxiang Cheng, Zhenhua Dong, Xiuqiang He, Weike Pan, and Zhong Ming. 2020a. A General Knowledge Distillation Framework for Counterfactual Recommendation via Uniform Data. In SIGIR ’20. 831–840.
- Liu et al. (2021) Zeming Liu, Haifeng Wang, Zheng-Yu Niu, Hua Wu, and Wanxiang Che. 2021. Durecdial 2.0: A bilingual parallel corpus for conversational recommendation. EMNLP (2021).
- Liu et al. (2020b) Zeming Liu, Haifeng Wang, Zheng-Yu Niu, Hua Wu, Wanxiang Che, and Ting Liu. 2020b. Towards Conversational Recommendation over Multi-Type Dialogs. In ACL ’20. 1036–1049.
- Luo et al. (2020a) Kai Luo, Scott Sanner, Ga Wu, Hanze Li, and Hojin Yang. 2020a. Latent Linear Critiquing for Conversational Recommender Systems. In WWW’ 20. 2535–2541.
- Luo et al. (2020b) Kai Luo, Hojin Yang, Ga Wu, and Scott Sanner. 2020b. Deep Critiquing for VAE-Based Recommender Systems. In SIGIR ’20. 1269–1278.
- Lytras et al. (2021) Miltiadis D Lytras, Anna Visvizi, Prasanta Kr Chopdar, Akila Sarirete, and Wadee Alhalabi. 2021. Information Management in Smart Cities: Turning end users’ views into multi-item scale development, validation, and policy-making recommendations. International Journal of Information Management 56 (2021), 102146.
- Ma et al. (2019) Jianxin Ma, Chang Zhou, Peng Cui, Hongxia Yang, and Wenwu Zhu. 2019. Learning Disentangled Representations for Recommendation. In NeurIPS ’20. 5711–5722.
- Marlin and Zemel (2009) Benjamin M. Marlin and Richard S. Zemel. 2009. Collaborative Prediction and Ranking with Non-Random Missing Data. In RecSys ’09. 5–12.
- Marlin et al. (2007) Benjamin M. Marlin, Richard S. Zemel, Sam Roweis, and Malcolm Slaney. 2007. Collaborative Filtering and the Missing at Random Assumption. In UAI ’07. 267–275.
- Marsaglia et al. (2003) George Marsaglia, Wai Wan Tsang, Jingbo Wang, et al. 2003. Evaluating Kolmogorov’s distribution. Journal of statistical software 8, 18 (2003), 1–4.
- Newman (2005) Mark EJ Newman. 2005. Power laws, Pareto Distributions and Zipf’s Law. Contemporary Physics 46, 5 (2005), 323–351.
- Park and Tuzhilin (2008) Yoon-Joo Park and Alexander Tuzhilin. 2008. The Long Tail of Recommender Systems and How to Leverage It. In RecSys ’08. 11–18.
- Pradel et al. (2012) Bruno Pradel, Nicolas Usunier, and Patrick Gallinari. 2012. Ranking with Non-Random Missing Ratings: Influence of Popularity and Positivity on Evaluation Metrics. In RecSys ’12. 147–154.
- Ren et al. (2020) Xuhui Ren, Hongzhi Yin, Tong Chen, Hao Wang, Quoc Viet Hung Nguyen, Zi Huang, and Xiangliang Zhang. 2020. CRSAL: Conversational Recommender Systems with Adversarial Learning. ACM Transactions on Information Systems 0, ja (2020).
- Ren et al. (2022) Zhaochun Ren, Zhi Tian, Dongdong Li, Pengjie Ren, Liu Yang, Xin Xin, Huasheng Liang, Maarten de Rijke, and Zhumin Chen. 2022. Variational Reasoning about User Preferences for Conversational Recommendation. SIGIR (2022).
- Rendle (2010) Steffen Rendle. 2010. Factorization Machines. In ICDM ’10. 995–1000.
- Saito et al. (2021) Yuta Saito, Shunsuke Aihara, Megumi Matsutani, and Yusuke Narita. 2021. Open Bandit Dataset and Pipeline: Towards Realistic and Reproducible Off-Policy Evaluation. In NeurIPS ’21.
- Saito et al. (2020) Yuta Saito, Suguru Yaginuma, Yuta Nishino, Hayato Sakata, and Kazuhide Nakata. 2020. Unbiased Recommender Learning from Missing-Not-At-Random Implicit Feedback. In WSDM ’20. 501–509.
- Salakhutdinov and Mnih (2007) Ruslan Salakhutdinov and Andriy Mnih. 2007. Probabilistic Matrix Factorization. In NeurIPS ’07. 1257–1264.
- Schnabel et al. (2016) Tobias Schnabel, Adith Swaminathan, Ashudeep Singh, Navin Chandak, and Thorsten Joachims. 2016. Recommendations as Treatments: Debiasing Learning and Evaluation. In ICML ’16. 1670–1679.
- Sun and Zhang (2018) Yueming Sun and Yi Zhang. 2018. Conversational Recommender System. In SIGIR ’18. 235–244.
- Swaminathan and Joachims (2015) Adith Swaminathan and Thorsten Joachims. 2015. Counterfactual Risk Minimization: Learning from Logged Bandit Feedback. In ICML ’15. 814–823.
- Wang et al. (2018) Qing Wang, Chunqiu Zeng, Wubai Zhou, Tao Li, S Sitharama Iyengar, Larisa Shwartz, and Genady Ya Grabarnik. 2018. Online Interactive Collaborative Filtering Using Multi-Armed Bandit with Dependent Arms. IEEE Transactions on Knowledge and Data Engineering (TKDE) 31, 8 (2018), 1569–1580.
- Wang et al. (2022) Shiqi Wang, Chongming Gao, Min Gao, Junliang Yu, Zongwei Wang, and Hongzhi Yin. 2022. Who Are the Best Adopters? User Selection Model for Free Trial Item Promotion. arXiv preprint arXiv:2202.09508 (2022).
- Wang et al. (2020) Wenjie Wang, Fuli Feng, Xiangnan He, Hanwang Zhang, and Tat-Seng Chua. 2020. “Click” Is Not Equal to “Like”: Counterfactual Recommendation for Mitigating Clickbait Issue. arXiv preprint arXiv:2009.09945 (2020).
- Wang et al. (2021) Zhenlei Wang, Jingsen Zhang, Hongteng Xu, Xu Chen, Yongfeng Zhang, Wayne Xin Zhao, and Ji-Rong Wen. 2021. Counterfactual Data-Augmented Sequential Recommendation. In SIGIR ’21. 347–356.
- Xian et al. (2019) Yikun Xian, Zuohui Fu, S. Muthukrishnan, Gerard de Melo, and Yongfeng Zhang. 2019. Reinforcement Knowledge Graph Reasoning for Explainable Recommendation. In SIGIR ’19. 285–294.
- Xin et al. (2020) Xin Xin, Alexandros Karatzoglou, Ioannis Arapakis, and Joemon M. Jose. 2020. Self-Supervised Reinforcement Learning for Recommender Systems. In SIGIR ’20. 931–940.
- Xu et al. (2021) Kerui Xu, Jingxuan Yang, Jun Xu, Sheng Gao, Jun Guo, and Ji-Rong Wen. 2021. Adapting User Preference to Online Feedback in Multi-round Conversational Recommendation. In WSDM ’21. 364–372.
- Yin et al. (2012) Hongzhi Yin, Bin Cui, Jing Li, Junjie Yao, and Chen Chen. 2012. Challenging the Long Tail Recommendation. Proceedings of the VLDB Endowment 5, 9 (2012), 896–907.
- Yu et al. (2018) Junliang Yu, Min Gao, Jundong Li, Hongzhi Yin, and Huan Liu. 2018. Adaptive implicit friends identification over heterogeneous network for social recommendation. In Proceedings of the 27th ACM International Conference on Information and Knowledge Management. 357–366.
- Yu et al. (2019) Junliang Yu, Min Gao, Hongzhi Yin, Jundong Li, Chongming Gao, and Qinyong Wang. 2019. Generating Reliable Friends via Adversarial Training to Improve Social Recommendation. In ICDM ’19. IEEE, 768–777.
- Zhang et al. (2019) Ruiyi Zhang, Tong Yu, Yilin Shen, Hongxia Jin, Changyou Chen, and Lawrence Carin. 2019. Reward Constrained Interactive Recommendation with Natural Language Feedback. In NeurIPS ’19.
- Zhang and Balog (2020) Shuo Zhang and Krisztian Balog. 2020. Evaluating Conversational Recommender Systems via User Simulation. In KDD ’20. 1512–1520.
- Zhang et al. (2020) Xiaoying Zhang, Hong Xie, Hang Li, and John C.S. Lui. 2020. Conversational Contextual Bandit: Algorithm and Application. In WWW ’20. 662–672.
- Zhang et al. (2018) Yongfeng Zhang, Xu Chen, Qingyao Ai, Liu Yang, and W. Bruce Croft. 2018. Towards Conversational Search and Recommendation: System Ask, User Respond. In CIKM ’18. 177–186.
- Zhang et al. (2021) Yang Zhang, Fuli Feng, Xiangnan He, Tianxin Wei, Chonggang Song, Guohui Ling, and Yongdong Zhang. 2021. Causal Intervention for Leveraging Popularity Bias in Recommendation. In SIGIR ’21. 11–20.
- Zhang et al. (2022) Yiming Zhang, Lingfei Wu, Qi Shen, Yitong Pang, Zhihua Wei, Fangli Xu, Bo Long, and Jian Pei. 2022. Multiple Choice Questions Based Multi-Interest Policy Learning for Conversational Recommendation (WWW ’22). 2153–2162.
- Zhao et al. (2018) Xiangyu Zhao, Liang Zhang, Zhuoye Ding, Long Xia, Jiliang Tang, and Dawei Yin. 2018. Recommendations with Negative Feedback via Pairwise Deep Reinforcement Learning. In KDD ’18. 1040–1048.
- Zhao et al. (2013) Xiaoxue Zhao, Weinan Zhang, and Jun Wang. 2013. Interactive Collaborative Filtering. In CIKM ’13. 1411–1420.
- Zheng et al. (2018) Guanjie Zheng, Fuzheng Zhang, Zihan Zheng, Yang Xiang, Nicholas Jing Yuan, Xing Xie, and Zhenhui Li. 2018. DRN: A Deep Reinforcement Learning Framework for News Recommendation. In WWW ’18. 167–176.
- Zhou et al. (2020a) Kun Zhou, Hui Wang, Wayne Xin Zhao, Yutao Zhu, Sirui Wang, Fuzheng Zhang, Zhongyuan Wang, and Ji-Rong Wen. 2020a. S3-Rec: Self-Supervised Learning for Sequential Recommendation with Mutual Information Maximization. In CIKM ’20. 1893–1902.
- Zhou et al. (2020b) Kun Zhou, Wayne Xin Zhao, Shuqing Bian, Yuanhang Zhou, Ji-Rong Wen, and Jingsong Yu. 2020b. Improving Conversational Recommender Systems via Knowledge Graph based Semantic Fusion. In SIGKDD’ 20. 1006–1014.
- Zhou et al. (2020c) Kun Zhou, Yuanhang Zhou, Wayne Xin Zhao, Xiaoke Wang, and Ji-Rong Wen. 2020c. Towards Topic-Guided Conversational Recommender System. In COLING ’2020.
- Zhou et al. (2022) Yuanhang Zhou, Kun Zhou, Wayne Xin Zhao, Cheng Wang, Peng Jiang, and He Hu. 2022. C2-CRS: Coarse-to-Fine Contrastive Learning for Conversational Recommender System. WSDM (2022).
- Zou et al. (2020) Lixin Zou, Long Xia, Pan Du, Zhuo Zhang, Ting Bai, Weidong Liu, Jian-Yun Nie, and Dawei Yin. 2020. Pseudo Dyna-Q: A Reinforcement Learning Framework for Interactive Recommendation. In WSDM ’20. 816–824.