Self-Evolutionary Clustering
Abstract
Deep clustering outperforms conventional clustering by mutually promoting representation learning and cluster assignment. However, most existing deep clustering methods suffer from two major drawbacks. First, most cluster assignment methods are based on simple distance comparison and highly dependent on the target distribution generated by a handcrafted nonlinear mapping. These facts largely limit the possible performance that deep clustering methods can reach. Second, the clustering results can be easily guided towards wrong direction by the misassigned samples in each cluster. The existing deep clustering methods are incapable of discriminating such samples. To address these issues, a novel modular Self-Evolutionary Clustering (Self-EvoC) framework is constructed, which boosts the clustering performance by classification in a self-supervised manner. Fuzzy theory is used to score the sample membership with probability which evaluates the intermediate clustering result certainty of each sample. Based on which, the most reliable samples can be selected and augmented. The augmented data are employed to fine-tune an off-the-shelf deep network classifier with the labels from the clustering, which results in a model to generate the target distribution. The proposed framework can efficiently discriminate sample outliers and generate better target distribution with the assistance of self-supervised classifier. Extensive experiments indicate that the Self-EvoC remarkably outperforms state-of-the-art deep clustering methods on three benchmark datasets.
1 Introduction
In comparison to classification, clustering aims at discovering patterns within data in an unsupervised manner. In practical application, collection of labeled data might be very difficult or quite expensive, e.g. medical images, forest fire images, fault data of aircraft engine and so on. In some occasions, there might be unseen categories which also lack supervision information. Therefore, even though classification methods based on deep learning have witnessed rapid development, the research on deep clustering is far behind Xie et al. (2016); Guo et al. (2017). Clustering methods have not been able to benefit from the development of classification so far.
The conventional clustering methods such as -means MacQueen (1967), spectral clustering Von Luxburg (2007), DBSCAN Ester et al. (1996) map data into different clusters according to the distance evaluated in the original data space or handcrafted feature space. For these methods, how to reduce the feature dimension and preserve the local structure buried in the data are of essential meaning. The representative dimension reduction methods include linear method PCA, nonlinear dimension reduction by locally linear embedding (LLE) Roweis and Saul (2000) and so on. The feature learning ability of these algorithms is rather limited as compared with the fast developed deep learning models Lu and Yin (2021). With the help of DNN feature extractor, clustering has shown better performance, which is specially called Deep Clustering (DC) Xie et al. (2016); Peng et al. (2016); Lin and Kang (2021). Most deep clustering algorithms are trained by mutually promoting representation learning and cluster assignment according to the difference between the cluster assignment and target distribution Li et al. (2019). These methods have achieved some improvement by learning clustering toward features. However, there are still some problems unsolved. In this paper, we focus on two problems.
First, the target distribution in deep clustering model highly depends on artificially designed distribution function Xie et al. (2016); Guo et al. (2017). How can we automatically generate the target distribution suitable for specific dataset remains a problem. Deep clustering algorithms mainly have two stages, feature transformation and cluster assignment. The two stages promote each other based on clustering loss. The clustering loss evaluates the difference between the obtained intermediate data distribution and target distribution computed by an artificially designed function with the obtained intermediate distribution as input. Therefore, the target distribution generating function restricts the best performance of existing deep clustering models.
Second, misassginments of samples are inevitable in clustering and can lead clustering towards wrong direction. How to select the confidential samples for each cluster and reduce the influence from the possible misassignment to guide the clustering toward correct direction is another unsolved problem. Some researches have tried to solve the problem with self-paced learning Guo et al. (2019); Zhou et al. (2021). These solutions evaluate the easiness of samples based on the distance of the sample to the cluster centers. However, the cluster centers are usually not uniformly distributed which will bias the easiness calculation of samples belonging to different clusters. Meanwhile, these solutions incorporate extra parameters like the age parameter controlling the learning pace and step size to change the age parameter. These parameters need be set manually.
To address the above two problems, Self-EvoC framework is developed combining three modules including feature extractor, clustering and self-supervised classifier. Self-EvoC works in a modular manner where the three modules can be replaced by any model toward application. In our solution, different feature extractors are adopted including Autoencoder and off-the-shelf deep models. Fuzzy clustering is used as the clustering module which can naturally gives the confidence level of samples. Based on which, the confidential samples can be selected and the controversial samples can be spotted. The selected confidential samples are augmented with techniques like random rotating and cropping etc. The augmented data are fed to the following classifier to train a target distribution generation model in a self-supervised manner with the clustering labels. Off-the-shelf network model is employed as the classifier where no supervision is needed. The classifier is fine-tuned by the reliable augmented data and then used to generate the target distribution. In comparison to the manually defined target distribution generating function in existing deep clustering, the target distribution generating block becomes a trainable neural network module which is more reliable and adaptive. In this way, the clustering model get evolved with the motivation from the classifier in a self-supervised manner. The performance of Self-EvoC has been evaluated on three benchmarks and compared with multiple state-of-the-art methods. The experiment results verified the effectiveness of Self-EvoC. The contributions are summarized as follows.
-
•
We propose a novel modular deep clustering framework combining feature extractor, clustering and classifier. With this framework, the clustering model get evolved with the assistance of the neural network classifier in a self-supervised manner.
-
•
Fuzzy theory is introduced into clustering to model the sample fuzzy membership which provides a natural measure for sample confidence. Based on which, the reliable samples and controversial samples can be differentiated.
-
•
Off-the-shelf network model is adopted as the classifier to train a target distribution generation model instead of the manually defined function. The augmented reliable data are used to fine-tune the classifier with the cluster labels self-supervisedly.
2 Related Work
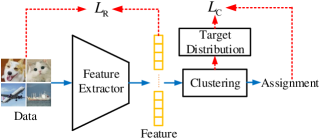
Deep Clustering is a family of clustering algorithms which take advantage of the feature extracting ability of DNN to complement the traditional clustering methods. The basic framework of deep clustering is illustrated in Figure 1. Low dimensional features can be obtained by a feature extractor. A reconstruction loss is used to measure the quality of the obtained features for most feature extractors used in deep clustering like Autoencoder. Meanwhile, the target distribution is introduced to optimize the cluster assignment in a self-training way. The target distribution is generated by a manually designed nonlinear function based on the sample assignment result. The difference between the sample assignment and the target distribution is evaluated by a clustering loss denoted as . According to the properties of the adopted DNN, deep clustering can be divided into Generative DC and non-Generative DC. Generative DC is mainly based on generative models such as VAE Kingma and Welling (2013) and GAN Wang et al. (2018), while non-Generative DC adopts Autoencoder or pre-trained models as feature extractor Xie et al. (2016); Guo et al. (2017). For objective function, there are combined-loss Song et al. (2014) and clustering loss Lin et al. (2018). The combined-loss is a combination of reconstruction loss and clustering loss as , where the tradeoff parameter need be carefully selected. The clustering loss highly depends on the manually generated target distribution.
 |
Self-EvoC can be categorized as non-Generative clustering loss based clustering. Non-Generative clustering loss based clustering uses to optimize the parameters of the feature extractor and cluster centers. Xie et al. (2016) proposed a Deep Embedded Clustering (DEC) by defining a KL divergence between the clustering distribution and target distribution as the clustering loss, where the clustering distribution is the soft clustering label and the target distribution is a nonlinear mapping of the cluster distribution. Narrowing the gap between the clustering distribution and target distribution can obtain clustering-friendly features. Li et al. (2018) proposed a CNN Autoencoder based DEC and modified the normalization method of target distribution. Besides the modification on network structure, Peng et al. (2017) designed a clustering loss as the discrepancy between pairwise example-center distributions. Feng et al. (2020) proposed a clustering model based on graph-regularized deep normalized fuzzy compactness to improve DEC. This method provides flexible cluster labels with fuzzy membership. The target distribution of these methods needs be designed very carefully and can not remove misassignments. In this paper, we try to solve these problems by incorporating the idea of confidential sample selection and self-supervised classification.
3 Self-Evolutionary Clustering
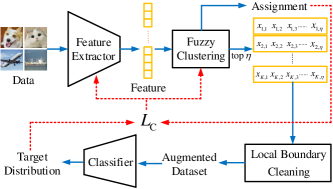
In order to obtain better target distribution automatically and constrain clustering direction, Self-EvoC framework is proposed as illustrated in Figure 2. The framework combines three replaceable modules including feature extractor, clustering and classifier, which can be trained in an end-to-end way. Denote a dataset for clustering with samples as where is the sample dimension. The feature extractor can be any off-the-shelf network model. The features obtained by the feature extractor are assigned to different clusters with fuzzy clustering method which can naturally rate the confidence of the sample membership. According to the fuzzy clustering results, an selected and augmented dataset is generated to train the following classifier. The classifier can be any off-the-shelf deep classifier. The augmented data are constructed by fuzzy selecting strategy, local loundary cleaning and augmentation. Based on the augmented data, the classifier can be further fine-tuned in a self-supervised manner with the intermediate clustering label. Then the classifier is used to predict the target distribution. The clustering loss is measured between the intermediate clustering label and the target distribution, which is used to optimize the network.
 |
3.1 Fuzzy Clustering based Selecting Strategy
The major goal of Fuzzy Selecting Strategy is to select high confidence samples for the subsequent classification. A DNN feature extractor is used to transform each example to . Generally speaking, there will be inevitable misassignments after clustering which will influence the clustering performance. At the beginning of the clustering, the features extracted by DNN are not clustering-friendly. As a result, clusters might overlap each other. In general, the closer the sample to the cluster center, the more likely it is to be the right assignment. Based on this hypothesis, most mistakenly assigned samples are supposed to locate close to the cluster boundary. However, different clusters have different distribution shapes, therefore it is inappropriate to select samples only with distance.
In order to solve the above problem, we introduce probability to model the membership confidence. Inspired by FCM (Fuzzy -means) Winkler et al. (2011), the membership of the sample to the center is formulated as
| (1) |
where is the fuzzifier value and is the number of clusters. This process can be modeled as a clustering layer in the neural network. The corresponding parameters are the clustering center matrix. The objective function to initialize the clustering layer is written as
| (2) |
where is the number of samples. During the process of optimizing Eq. (2), we first calculate the membership with Eq. (1) and then the clustering center is obtained as
| (3) |
These two steps are executed alternately until it converges.
Unfortunately, the initialization of the fuzzy clustering layer is unstable. It is observed that the optimization of Eq. (2) can lead to multiple results with the same input and hyper-parameters. To ensure stability, a fuzzy selecting strategy (FSS) is constructed. After repeated trials based on the same input and fuzzifier value, we get membership matrices. The corresponding label of each sample is the clustering center with the largest membership. We treat the result of the first trial as a benchmark and compare it with the remaining predictions. The most frequent result is selected as the most stable initialization of the clustering center .
After modeling the sample membership with probability, the membership matrix can be obtained. To assure the reliability of the samples fed to the subsequent classifier, the input samples to the classifier should have high confidence. There are two possible kinds of selection criteria, top potion of samples or general probability threshold. The distribution of membership in different clusters varies a lot. Our target is inner-cluster high confidence which can be viewed as a local property. Therefore, we choose the potion of samples with the highest confidence from each cluster, and increase per iteration to expand data capacity. is called initial selecting rate and is called increasing step.
3.2 Local Boundary Cleaning and Augmentation
Even though the samples selected by the fuzzy selecting strategy are supposed to have high confidence, there might still be some misassigned samples among the selected samples. These mistakes may produce severe destruction to the following classification and need be avoided.
The low dimensional embedded features for clustering are visualized with -SNE Van der Maaten and Hinton (2008). It is observed that most of the misassignments locate close to the boundary of the cluster. However, this phenomenon only exists with a single cluster, which is not obvious with multiple clusters. The different distributions of multiple clusters will affect each other during the process of -SNE. Based on this observation, we start from single cluster and construct local boundary cleaning to restrict the influence of misassignments.
In visualization, misassignments may form an island independent of the correct samples. We first use density clustering to detect whether there are multiple clusters in the -SNE projection of the cluster . If true, remove the smaller clusters and the remainder is denoted as . The distribution of is elliptical or circular because of the application of Euclidean distance in Eq. (1). The direction vectors and of the major axis and minor axis of the ellipse satisfy
| (6) |
where is the two dimensional mapping of the selected samples in the cluster, and are the corresponding characteristic values. The major axis and minor axis are
| (7) |
Based on Eq. (5), the major axis can be obtained. The closer the samples are to the ellipse center, the more reliable the samples are. In order to weaken the negative impact of the misassignments, we only augment the high confident samples. Specifically, the ellipse is divided into 3 equal regions. The division scale on the major axis is . The ratio of the number of augmentations for the samples in the regions , and is set as 5, 3, 1. Image augmentation techniques like random rotating and cropping are used to augment the samples within these regions. In this way, the number of reliable samples has been greatly increased and an augmented dataset is generated to fine-tune the following classifier with the clustering labels as self-supervision.
3.3 Self-supervised Classifier
A classifier is incorporated to predict the target distribution automatically. With the fuzzy selecting strategy and local boundary cleaning, the data for augmentation are narrowed down. An augmented dataset can be generated by image augmentation techniques. Unlike the original dataset , the augmented dataset are labeled with the intermediate clustering result. These labels are taken as the supervision to fine-tune the classifier. In this sense, the classifier is trained in a self-supervised manner and no outside beforehand supervision is needed. Therefore, the whole package remains unsupervised learning.
The augmented data used to fine-tune the classifier are confidential samples, which enables the classifier to automatically learn reliable target distribution. The target distribution learnt by the classifier is more accurate and adaptive than that obtained by the handcrafted nonlinear mappings in previous deep clustering. In addition, the inputs to the classifier are raw images which contain more information than the embedded features used in most deep clustering. The information loss during the feature embedding process may distort the sample distribution, which may influence the obtained target distribution. Our solution can avoid such issue. After the fine-tuning the classifier with the augmented dataset, the target distribution of all the samples in the dataset for clustering can be predicted by the classifier as
| (8) |
where is the one-hot encoding label matrix. By this encoding method, the distribution of the samples belonging to the same class can be more compact. The objective function of Self-EvoC is also defined as a clustering loss evaluated by the Kullback-Leibler divergence as
| (9) |
where is the membership matrix and is the resultant label matrix of the classifier. By minimizing the clustering loss in Eq. (7), the parameters of the feature extractor and the fuzzy clustering layer can be optimized.
3.4 Optimization
To optimize Self-EvoC, the update rule for the parameters can be obtained as
| (10) |
and
| (11) |
where is the learning rate and is the number of samples within one training batch. If the change of the predicted classifier labels between two successive iterations is smaller than a threshold , the training process will be stopped. The stopping criterion is formulated as
| (12) |
where and are two successive target distribution in iteration and . The detailed steps of the algorithm are summarized in Algorithm 1.
Input: Dataset , Local boundary cleaning mapping , Fuzzifier value , Initial selecting rate , Increasing step , Stopping threshold , Maximum iteration number , Feature extractor , Fuzzy clustering , Classifier
Parameter: parameters, parameters, parameters
Output: Cluster assignment
 |
4 Experiments
4.1 Datasets
The proposed Self-EvoC framework is evaluated on three image datasets, including two handwritten digit datasets and one real world image dataset.
MNIST dataset consists of 60,000 handwritten digit images with the size of 2828. We transform the image into a normalized 784 dimensional vector as input.
USPS dataset contains 9,298 handwritten digit images with the size of 1616 pixels. The image is transformed into a normalized 256 dimensional vector for clustering.
STL10 is a subset of the widely used benchmark ImageNet. It contains high dimensional real world images. There are 13,000 images in the dataset from 10 categories. All the images in STL10 are transformed into 96963.
4.2 Experiment Setup
Comparing methods. We demonstrate the effectiveness of Self-EvoC framework by comparing it with the following representative clustering methods, -means MacQueen (1967), FCM Winkler et al. (2011), SEC Nie et al. (2009), MBKM Sculley (2010), DEC Xie et al. (2016), IDEC Guo et al. (2017), DFCM Feng et al. (2020), GrDNFCS Feng et al. (2020). The results of the compared methods are from the literatures or obtained with open source code.
Parameters setting. Self-EvoC is a modular framework combining feature extractor, clustering and classifier to solve clustering problem. For different dataset, different feature extractors, clustering methods and classifiers can be selected. In our study, we choose the same fuzzy clustering layer implementation based on FCM for all the three datasets. The fuzzifier value is set as 1.4, 1.4 and 1.1 for MNIST, USPS and STL10 respectively. In our experiments, Autoencoder and off-the-shelf classifier are selected as the feature extractor and classifier for MNIST and USPS. Inspired by DEC, the structure of the Autoencoder is -500-100--100-500-, where is the input dimension and =10 is the dimension of the embedded features. The classifier is set as a 4-layer convolutional neural network with 10 neurons as the output. We choose pre-trained model ResNet50 for feature extraction in the STL10 experiment. The classifier used for STL10 is SpinalNet Kabir et al. (2020) which is a powerful network imitating human brachial plexus. We choose SGD as the optimizer. The learning rate is 0.001 for all the three datasets. The stopping criterion threshold is set as =0.001. The maximum iteration number is 20. All experiments are conducted on a server with Intel Xeon CPU Gold 6230 2.1GHz and GPU TITAN V. Tensorflow and Keras are used for implementation.
Evaluation Metrics. Clustering accuracy (ACC), normalized mutual information (NMI) and adjusted rand index (ARI) are used to evaluate the compared methods.
 |
4.3 Results
We report the comparison results on the 3 datasets in Table1. Self-EvoC has obtained the best performance among the compared methods. Deep clustering methods MBKM, DEC, IDEC, DFCM and GrDNFCS outperform traditional ones, which indicates the powerful feature extraction ability can improve the performance of the unsupervised clustering. With the help of fuzzy theory, the performance of GrDNFCS and Self-EvoC is better than other deep clustering methods. This suggests better features and target distribution can be generated by means of fuzzy modeling. The outperformance of Self-EvoC shows that the self-supervised classifier further improves the clustering performance.
| MNIST | USPS | STL10 | |||||||
|---|---|---|---|---|---|---|---|---|---|
| ACC | MNI | ARI | ACC | NMI | ARI | ACC | NMI | ARI | |
| -means | 0.5348 | 0.4999 | 0.3667 | 0.6679 | 0.6256 | 0.5450 | 0.7421 | 0.7234 | 0.5297 |
| FCM | 0.5468 | 0.4816 | 0.3696 | 0.6634 | 0.6200 | 0.5393 | 0.7714 | 0.6813 | 0.5818 |
| SEC | 0.6273 | 0.6038 | 0.4859 | 0.6519 | 0.6488 | 0.4936 | 0.6535 | 0.5601 | 0.4584 |
| MBKM | 0.5443 | 0.4482 | 0.3685 | 0.6287 | 0.5993 | 0.5105 | 0.6894 | 0.6794 | 0.5275 |
| DEC | 0.8653 | 0.8369 | 0.8029 | 0.7278 | 0.7352 | 0.6622 | 0.8944 | 0.8201 | 0.7826 |
| IDEC | 0.8801 | 0.8638 | 0.8325 | 0.7513 | 0.7595 | 0.6791 | 0.9005 | 0.8285 | 0.7974 |
| DFCM | 0.8817 | 0.8654 | 0.8337 | 0.7536 | 0.7636 | 0.6815 | 0.9020 | 0.8296 | 0.8009 |
| GrDNFCS | 0.9145 | 0.9074 | 0.8626 | 0.7652 | 0.7761 | 0.6903 | 0.9143 | 0.8410 | 0.8252 |
| Self-EvoC | 0.9638 | 0.9209 | 0.9236 | 0.9747 | 0.9336 | 0.9504 | 0.9420 | 0.8808 | 0.8747 |
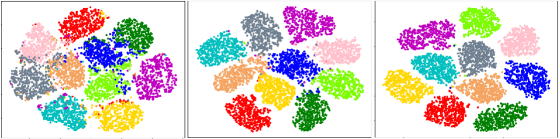
We further explore the variation of the sample distribution by visualizing the embedded space during the clustering process. The visualization on a random selected subset with 1,000 samples in each cluster in MNIST is shown in Figure 3. From left to right, the three images correspond to the visualization of the initial stage, the middle stage and the final result of the training process. It could be seen that along with the training progress, the gap between two clusters gradually increase and the clusters become highly compact. According to Xie et al. (2016) and the initial clustering results in our experiments, digits 4 and 9 colored by light green and blue are easily to be confused. However, classifier-based target distribution takes the advantage of the powerful feature representation capability of network model and can separate these two digits clearly. These results show the superiority of Self-EvoC.
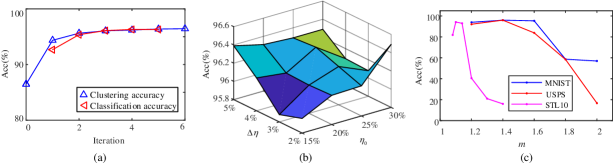
To reveal how the classifier affects the performance of Self-EvoC, the accuracy curves of the clustering and the classifier are shown in Figure 4(a). The curves are obtained from MNIST. In the MNIST experiment, the training will stop at the iteration which means the classifier predicts the target distribution for 5 times. The classifier prediction is based on the cluster assignment. It could be seen that the prediction accuracy of the classifier is higher than the clustering counterpart, which explains the evolved performance of Self-EvoC. As a result, the feature extractor and the fuzzy clustering centers can be further optimized.
The sensitivity of the important hyper-parameters are analyzed including the initial selecting rate , increasing step and fuzzifier value . Figure 4(b) gives the clustering accuracy under different setting of and . It can be seen that Self-EvoC performs slightly better with the increasing of these two parameters. However, this doesn’t mean the higher the better. Oversized and will lead to misassigned samples and deteriorate the performance. Figure 4(c) shows the variation of the clustering accuracy with respect to the fuzzifier value. It can be observed that with the increase of fuzzfizer value, the accuracy first increases and then decreases. The best fuzzfizer value for STL10 is 1.1 and the best fuzzifier value for MNIST and USPS is 1.4. The more complex the dataset, the smaller the fuzzifier value is expected.
5 Conclusion
This paper constructs a modular Self-EvoC framework, which combines feature extractor, clustering and classifier. Off-the-shelf classification algorithm is used to train a target distribution generation model, which can generate more reliable and adaptive target distribution as compared with the previous handcrafted nonlinear mappings. Fuzzy selecting strategy and local boundary cleaning are designed to select the most confidential samples within the intermediate obtained clusters. The selected data are augmented and used for fine-tuning of the classifier to generate better target distribution. The intermediate generated cluster labels are used as the supervision. In this way, the classifier is trained in a self-supervised manner. The unsupervised clustering is enhanced by self-supervised classifier. The Self-EvoC gets self-evolved. Extensive experiments on three benchmarks demonstrate the superior performance of Self-EvoC. This work has shed some new light into deep clustering.
Acknowledgments
This work is supported by National Key RD Program of China 2018AAA0101501, Science and Technology Project of SGCC (State Grid Corporation of China): Fundamental Theory of Human-in-the-loop Hybrid-Augmented Intelligence for Power Grid Dispatch and Control.
References
- Ester et al. [1996] Martin Ester, Hans-Peter Kriegel, Jörg Sander, Xiaowei Xu, et al. A density-based algorithm for discovering clusters in large spatial databases with noise. In Proceedings of the 2rd International Conference on Knowledge Discovery and Data Mining, pages 226–231, Menlo Park, USA, August 1996. AAAI.
- Feng et al. [2020] Qiying Feng, Long Chen, CL Philip Chen, and Li Guo. Deep fuzzy clustering—a representation learning approach. IEEE Transactions on Fuzzy Systems, 28(7):1420–1433, July 2020.
- Guo et al. [2017] Xifeng Guo, Long Gao, Xinwang Liu, and Jianping Yin. Improved deep embedded clustering with local structure preservation. In Proceedings of the 26th International Joint Conference on Artificial Intelligence, pages 1753–1759, Melbourne, Australia, August 2017. Morgan Kaufmann.
- Guo et al. [2019] Xifeng Guo, Xinwang Liu, En Zhu, Xinzhong Zhu, Miaomiao Li, Xin Xu, and Jianping Yin. Adaptive self-paced deep clustering with data augmentation. IEEE Transactions on Knowledge and Data Engineering, 32(9):1680–1693, September 2019.
- Kabir et al. [2020] HM Kabir, Moloud Abdar, Seyed Mohammad Jafar Jalali, Abbas Khosravi, Amir F Atiya, Saeid Nahavandi, and Dipti Srinivasan. Spinalnet: Deep neural network with gradual input. arXiv preprint arXiv:2007.03347, 2020.
- Kingma and Welling [2013] Diederik P Kingma and Max Welling. Auto-encoding variational bayes. arXiv preprint arXiv:1312.6114, 2013.
- Li et al. [2018] Fengfu Li, Hong Qiao, and Bo Zhang. Discriminatively boosted image clustering with fully convolutional auto-encoders. Pattern Recognition, 83:161–173, 2018.
- Li et al. [2019] Zhaoyang Li, Qianqian Wang, Zhiqiang Tao, Quanxue Gao, and Zhaohua Yang. Deep adversarial multi-view clustering network. In Proceedings of the 28th International Joint Conference on Artificial Intelligence, pages 2952–2958, Macao, China, August 2019. Morgan Kaufmann.
- Lin and Kang [2021] Zhiping Lin and Zhao Kang. Graph filter-based multi-view attributed graph clustering. In Proceedings of the 30th International Joint Conference on Artificial Intelligence, pages 19–26, Montreal, Canada, August 2021. Morgan Kaufmann.
- Lin et al. [2018] Wei-An Lin, Jun-Cheng Chen, Carlos D Castillo, and Rama Chellappa. Deep density clustering of unconstrained faces. In Proceedings of the IEEE Conference on Computer Vision and Pattern Recognition, pages 8128–8137, Salt Lake, USA, June 2018. IEEE.
- Lu and Yin [2021] Na Lu and Tao Yin. Transferable common feature space mining for fault diagnosis with imbalanced data. Mechanical Systems and Signal Processing, 156:107645, July 2021.
- MacQueen [1967] MacQueen. Some methods for classification and analysis of multivariate observations. In Proceedings of the 5th Berkeley symposium on mathematical statistics and probability, volume 1, pages 281–297. Oakland, USA, June 1967.
- Nie et al. [2009] Feiping Nie, Dong Xu, Ivor Wai-Hung Tsang, and Changshui Zhang. Spectral embedded clustering. In Proceedings of the 21th International Joint Conference on Artificial Intelligence, pages 1181–1186, Pasadena, California, June 2009. Morgan Kaufmann.
- Peng et al. [2016] Xi Peng, Shijie Xiao, Jiashi Feng, Wei-Yun Yau, and Zhang Yi. Deep subspace clustering with sparsity prior. In Proceedings of the 25th International Joint Conference on Artificial Intelligence, pages 1925–1931, New York, USA, July 2016. Morgan Kaufmann.
- Peng et al. [2017] Xi Peng, Jiashi Feng, Jiwen Lu, Wei-Yun Yau, and Zhang Yi. Cascade subspace clustering. In Proceedings of the 31th AAAI conference on artificial intelligence, pages 2478–2484, San Francisco, USA, February 2017. AAAI.
- Roweis and Saul [2000] Sam T Roweis and Lawrence K Saul. Nonlinear dimensionality reduction by locally linear embedding. Science, 290(5500):2323–2326, December 2000.
- Sculley [2010] David Sculley. Web-scale k-means clustering. In Proceedings of the 19th International Conference on World Wide Web, pages 1177–1178, Raleigh, USA, April 2010. ACM.
- Song et al. [2014] Chunfeng Song, Yongzhen Huang, Feng Liu, Zhenyu Wang, and Liang Wang. Deep auto-encoder based clustering. Intelligent Data Analysis, 18(6S):S65–S76, December 2014.
- Van der Maaten and Hinton [2008] Laurens Van der Maaten and Geoffrey Hinton. Visualizing data using t-sne. Journal of Machine Learning Research, 9(11), November 2008.
- Von Luxburg [2007] Ulrike Von Luxburg. A tutorial on spectral clustering. Statistics and Computing, 17(4):395–416, December 2007.
- Wang et al. [2018] Qianqian Wang, Zhengming Ding, Zhiqiang Tao, Quanxue Gao, and Yun Fu. Partial multi-view clustering via consistent gan. In 2018 IEEE International Conference on Data Mining, pages 1290–1295, Singapore, November 2018. IEEE.
- Winkler et al. [2011] Roland Winkler, Frank Klawonn, and Rudolf Kruse. Fuzzy c-means in high dimensional spaces. International Journal of Fuzzy System Applications, 1(1):1–16, January-March 2011.
- Xie et al. [2016] Junyuan Xie, Ross Girshick, and Ali Farhadi. Unsupervised deep embedding for clustering analysis. In International conference on machine learning, pages 478–487, New York, USA, June 2016. ACM.
- Zhou et al. [2021] Peng Zhou, Liang Du, Xinwang Liu, Yi-Dong Shen, Mingyu Fan, and Xuejun Li. Self-paced clustering ensemble. IEEE Transactions on Neural Networks and Learning Systems, 32(4):1497–1511, April 2021.