Exploring metallicity-dependent rates of Type Ia supernovae and their impact on galaxy formation
Abstract
Type Ia supernovae play a critical role in stellar feedback and elemental enrichment in galaxies. Recent transient surveys like the All-Sky Automated Survey for Supernova (ASAS-SN) and the Dark Energy Survey (DES) find that the specific Ia rate at may be higher in lower-mass galaxies than at Milky Way-mass. Independently, Milky Way observations show that the close-binary fraction of solar-type stars is higher at lower metallicity. Motivated by these observations, we use the FIRE-2 cosmological zoom-in simulations to explore the impact of varying Ia rate models, including metallicity dependence, on galaxies across a range of stellar masses: . First, we benchmark our simulated star-formation histories (SFHs) against observations. We show that assumed SFHs and stellar mass functions play a major role in determining the degree of tension between observations and metallicity-independent Ia rate models, and potentially cause ASAS-SN and DES observations to be much more consistent with each other than might niavely appear. Models in which the Ia rate increases with decreasing metallicity (as to ) provide significantly better agreement with observations. Encouragingly, these increases in Ia rate ( in low-mass galaxies) do not significantly impact galaxy stellar masses and morphologies: effective radii, axis ratios, and remain largely unaffected except for our most extreme rate models. We explore implications for both [Fe/H] and [] enrichment: metallicity-dependent Ia rate models can improve agreement with the observed stellar mass-metallicity relations in low-mass galaxies. Our results demonstrate that a wide range of metallicity-dependent Ia models are viable for galaxy formation and motivate future work in this area.
keywords:
stars: supernovae – galaxies: formation – galaxies: ISM – ISM: abundances – methods: numerical – software: simulations1 Introduction
Type Ia supernovae arise from the thermonuclear explosions of carbon-oxygen white dwarf (WD) stars (Hoyle & Fowler, 1960) and have importance across astrophysics and cosmology. In addition to being significant sources of iron and other elements, they provide mechanical feedback in the inter-stellar medium (ISM) of galaxies - see for example Iwamoto et al. (1999), Brachwitz et al. (2000), Lach et al. (2020) for discussions of Ia nucleosynthesis and Matteucci & Greggio (1986), Kobayashi et al. (2006, 2015); Kobayashi et al. (2020) for their impact on galactic and cosmic elemental enrichment. Ia are also fundamental to our study of cosmic expansion, since their intrinsic luminosities and therefore distances can be constrained with high precision (Phillips, 1993; Hamuy et al., 1995, amongst others), and their homogeneity allows for their use as ‘standard candles’ – an important rung of the extragalactic distance ladder. This makes them excellent probes of the Universe on the largest scales and of the evolution of cosmic expansion (see for example Scolnic, 2013; Abbott et al., 2019; Riess, 2020).
Despite the critical role that Ia supernovae play in astrophysics and cosmology, our understanding of their progenitors and explosion mechanisms remains limited (see Maoz & Mannucci, 2012; Wang & Han, 2012; Maoz et al., 2014, for reviews on the subject). There are two main competing ideas regarding the physical progenitor systems that lead to the explosion, both involving a WD in a close-binary system with a companion star. In the single-degenerate (SD) scenario, the binary companion is a main sequence (MS) star (as in Whelan & Iben, 1973; Nomoto, 1982), while in the double-degenerate (DD) model it is another carbon-oxygen WD (eg., Tutukov & Iungelson, 1976; Tutukov & Yungelson, 1979; Iben & Tutukov, 1984; Webbink, 1984; Thompson, 2011; Dong et al., 2015). Both ideas have their pros and cons: although observational evidence disfavours the SD model in many cases (Nugent et al., 2011; Chomiuk et al., 2012; Shappee et al., 2013, 2018; Tucker et al., 2020), there are theoretical difficulties with the exact production mechanism of Ia from the DD scenario (Shen et al., 2012, for example).
Characterizing the delay time distribution (DTD) of Ia supernovae is essential to test the validity of various progenitor scenarios. The DTD describes the supernova rate as a function of the time since star formation, and thus carries characteristic signatures of the progenitor mechanism (see Wang & Han, 2012; Maoz & Graur, 2017, for a review of observations). The SD scenario produces a broad range of functional forms, most of which fail to account for the longer delay times seen in observations (for example Graur et al., 2014). Conversely, most DD models predict a power-law DTD form of roughly , where is the delay time after the formation of a stellar population. There is also evidence that some Ia occur promptly after star formation ( Myr), along with a delayed component that occurs much later ( 1 Gyr) (Mannucci et al., 2005; Scannapieco & Bildsten, 2005; Sullivan et al., 2006; Brandt et al., 2010; Maoz et al., 2011; Maoz & Mannucci, 2012).
Another key observation in the study of Type Ia supernovae is the properties of their host galaxies. According to observations, lower-mass galaxies produce more Ia per unit stellar mass than higher-mass galaxies (for example Mannucci et al., 2005). Many observational surveys have studied the relationship between Ia and their host galaxies, such as the Lick Observatory Supernova Survey (LOSS; Li et al., 2000), the Nearby Supernova Factory (SNFactory; Aldering et al., 2002; Childress et al., 2013), the Texas Supernova Search (TSS; Quimby, 2006), the SuperNova Legacy Survey (SNLS; Astier et al., 2006; Guy et al., 2010), Sloan Digital Sky Survey-II Supernova Survey (Frieman et al., 2008), and the Palomar Transient Facility (PTF; Law et al., 2009). These efforts have identified trends between the Ia rate and host galaxy characteristics (see Neill et al., 2006; Sullivan et al., 2006; Li et al., 2011; Quimby et al., 2012; Smith et al., 2012; Gao & Pritchet, 2013; Graur & Maoz, 2013; Graur et al., 2015, 2017; Heringer et al., 2017, 2019).
Recently, Brown et al. (2019) showed that in the All-Sky Automated Survey for Supernova (ASAS-SN; Shappee et al., 2013; Kochanek et al., 2017), the specific rate of Ia supernovae (total rate divided by galaxy stellar mass) is significantly higher in lower-mass galaxies, being times higher at than at in their strongest observed trends. One might expect this trend qualitatively, given that more massive galaxies have lower specific star formation rates (sSFRs) on average at , and thus have lower specific Ia rates – especially due to the strong prompt component of Ia rate models after a brief time delay following a burst of star formation. However, Brown et al. (2019) find no significant difference in this mass dependence even when splitting their sample of supernova host galaxies into star-forming and quiescent. Furthermore, their inferred increase of appears quantitatively too strong to be explained simply by the dependence of average sSFR on galaxy stellar mass. This seemingly indicates that the observed trend is not simply a consequence of galaxies being star-forming or quiescent at different masses, but rather has something to do with the intrinsic nature of the Ia rates themselves.
Other supernova survey results also show similar trends relative to host galaxy mass, such as Graur & Maoz (2013) and more recently, the Dark Energy Survey (DES; Wiseman et al., 2021), among others. While the results from these different studies all qualitatively agree on the observed increase in Ia specific rate at lower galaxy stellar mass, they contain certain differences in the properties of their supernova and host galaxy samples. In particular, the Graur & Maoz (2013) results span a range from to in galaxy stellar mass, the DES (Wiseman et al., 2021) sample from to , and the ASAS-SN (Brown et al., 2019) sample covering the largest range from to . Additionally, the volume-limited sample from ASAS-SN is the most local (), while the other two samples cover slightly higher redshift ranges while still being close to present day: for Graur & Maoz (2013) and for DES. Sample nuances notwithstanding, the fact remains that multiple supernova surveys have shown that the specific Ia rate increases with decreasing host galaxy mass.
In this paper we explore potential variations to models for Ia rates and DTDs that might account for this mass dependence. One motivation comes from observations of stars in the Milky Way: the close-binary fraction of solar-type stars in our Galaxy is higher in stellar populations with lower metallicity (see Moe et al., 2019, for example). This has potential implications for Ia rates, because all widely accepted models for Ia require the presence of stars in a close-binary system. To the extent that stellar populations in lower-mass galaxies are more metal-poor on average, (for example Lequeux et al., 1979; Tremonti et al., 2004; Gallazzi et al., 2005; Lee et al., 2006; Kirby et al., 2013; Leethochawalit et al., 2018), lower-mass galaxies should have higher close-binary fractions, potentially boosting their Ia rates per unit stellar mass relative to higher-mass galaxies. For a related viewpoint regarding the dependence of wide binary fractions on iron abundance, see Hwang et al. (2021).
Further motivation for metallicity dependence to Ia rates also comes from other observations of Milky Way stellar populations: blue straggler stars (BSS) are more common at lower metallicities (as discussed in Wyse et al., 2020). While this study argues that mass transfer in close-binary pairs is the likely cause for BSS formation, this result has implications for Ia rates too, by lending further credence to the prevalence of higher close-binary fractions in metal-poor populations. This motivates our exploration of metallicity-dependence Ia rate models in an effort to investigate the mass dependence of specific Ia rates, and their implications for the astrophysics of stellar feedback and elemental enrichment in galaxy formation.
A number of previous studies have examined different models for the rates of core-collapse supernova in galaxy simulations (Springel & Hernquist, 2003; Agertz et al., 2013; Crain et al., 2015; Kim et al., 2016; Rosdahl et al., 2017; Peeples et al., 2019; Keller & Kruijssen, 2020), and certain previous observational studies (such as Cooper et al., 2009) have discussed metallicity dependence of observed Ia rates. However, to our knowledge our paper is the first to explore metallicity-dependent models for Ia rates using cosmological zoom-in simulations, through which we also study their impact on galaxy formation.
2 Methods
| Name† | Stellar | Baryonic | sSFR | Ref. | |
| Mass | Resolution | (lookback) | |||
| [] | [] | [Gyr] | |||
| m12m | A | ||||
| Romulus | B | ||||
| m12b | C | ||||
| m12f | D | ||||
| Thelma | C | ||||
| Romeo | C | ||||
| m12i | E | ||||
| m12c | C | ||||
| m12w | F | ||||
| m11g | G | ||||
| Remus | B | ||||
| Juliet | C | ||||
| Louise | C | ||||
| m11f | G | ||||
| m12z | C | ||||
| m12r | F | ||||
| m11d | H | ||||
| m11e | H | ||||
| m11v | A | ||||
| m11i | H | ||||
| m11c | A | ||||
| m11q | A | ||||
| m11h | H | ||||
| m11a | G | ||||
| m11b | G | ||||
| m10z | A | ||||
| m10y | A | ||||
| m09 | [& ] | I |
-
•
†Simulation first introduced at this resolution in: A: Hopkins et al. (2018b), B: Garrison-Kimmel et al. (2019b), C: Garrison-Kimmel et al. (2019a), D: Garrison-Kimmel et al. (2017), E: Wetzel et al. (2016), F: Samuel et al. (2020), G: Chan et al. (2018), H: El-Badry et al. (2018), and I: Wheeler et al. (2019).
2.1 FIRE-2 simulations
We use a fiducial suite of 28 cosmological zoom-in simulations of galaxies with stellar masses from - , from the Feedback In Realistic Environments (FIRE) project111http://fire.northwestern.edu (Hopkins et al., 2018b). FIRE simulations are run using Gizmo, a Lagrangian Meshless Finite Mass (MFM) hydrodynamics code (Hopkins, 2015). Each simulation includes an implementation of fluid dynamics, star formation, and stellar feedback based on the FIRE-2 numerical prescription. FIRE-2 models the multi-phase inter-stellar medium (ISM) in galaxies and incorporates physically motivated, metallicity-dependent radiative heating and cooling processes for gas. These include free-free, photoionisation and recombination, Compton, photo-electric and dust collisional, cosmic ray, molecular, metal-line, and fine structure processes. They account for elements (H, He, C, N, O, Ne, Mg, Si, S, Ca, Fe) across a temperature range of . They also include the sub-grid diffusion and mixing of these elements in gas phase via turbulence (see Escala et al., 2018; Hopkins et al., 2018b, for further details). The fiducial FIRE-2 simulations also include a spatially uniform, redshift-dependent UV background from Faucher-Giguère et al. (2009). In calculating metallicities throughout this paper, we scale elemental abundances to the (proto-)Solar values from Asplund et al. (2009).
Star particles form out of gas that is self-gravitating, Jeans-unstable, cold (), dense (), and molecular (following Krumholz & Gnedin, 2011). Each star particle represents a single stellar population, assuming a Kroupa (2001) stellar initial mass function. During formation, star particles also inherit the mass and elemental abundances of their respective progenitor gas particles. In FIRE-2, star particles evolve along standard stellar population models from e.g. STARBURST99 v7.0 (Leitherer et al., 1999). We also include the following time-resolved stellar feedback processes: core-collapse and Type Ia supernovae, continuous mass loss, radiation pressure, photoionisation, and photo-electric heating. FIRE-2 uses rates for core-collapse supernovae from STARBURST99 (Leitherer et al., 1999), and their nucleosynthetic yields from Nomoto et al. (2006). Stellar wind yields, sourced primarily from O, B, and AGB stars, are from a combination of models from van den Hoek & Groenewegen (1997), Marigo (2001), and Izzard et al. (2004), synthesised in Wiersma et al. (2009). For details on the implementation of Ia supernovae, see Section 2.3. For a discussion of the implementation of supernova feedback energetics in FIRE-2, see Hopkins et al. (2018a).
We generate cosmological zoom-in initial conditions for each simulation at using the MUSIC code (Hahn & Abel, 2011). These initial conditions are embedded within periodic cosmological boxes of side length ranging from to Mpc. We save 600 snapshots per simulation from to , with an average spacing of Myr. For all simulations we assume flat CDM cosmology, using parameters broadly consistent with those from Planck Collaboration et al. (2018): , , , , , and .
In each simulation, we consider only the host galaxy and not the satellites. Our sample of simulated galaxies contains 15 hosts with dark matter (DM) halo masses of (labelled as ‘m12’, along with ‘Romeo’, ‘Juliet’, ‘Romulus’, ‘Remus’, ‘Thelma’, and ‘Louise’), 10 with halo masses of (labelled as ‘m11’), 2 with halo masses of (labelled as ‘m10’), and 1 with a halo mass of (labelled as ‘m09’). Here refers to the total mass within the radius containing 200 times the mean matter density of the Universe.
Table 1 lists all of the (fiducial) FIRE-2 simulations that we use along with the stellar masses of each galaxy, the initial baryonic particle masses in the simulation, the lookback time to when each galaxy assembled per cent of its stellar mass at , and its sSFR at .
In this paper, we examine not only metallicity-dependent models for Ia supernova rates using the FIRE simulations, but also their dependence on and impact on various galaxy properties – star formation rate (SFR), star formation history (SFH), morphology, and elemental abundance. Previous studies have benchmarked a number of these properties for the fiducial FIRE-2 simulations, and we list them here for reference. Hopkins et al. (2018a) describe the implementation and testing of supernova modelling in FIRE-2, but without much specific detail on different models for Ia rates. For discussion of stellar mass assembly timescales and SFHs in FIRE-2 galaxies, see Garrison-Kimmel et al. (2019a), Garrison-Kimmel et al. (2019b), Graus et al. (2019), Iyer et al. (2020), and Santistevan et al. (2020). Sparre et al. (2017) and Flores Velázquez et al. (2021) examined SFRs of FIRE-2 galaxies using different observational tracers, while Emami et al. (2021) tested the impact of bursty SFHs on the sizes of FIRE-2 low-mass galaxies. For stellar elemental abundances in FIRE, Ma et al. (2016), Escala et al. (2018), and Hopkins et al. (2020) benchmarked both iron and alpha-capture element distributions in high-mass and low-mass galaxies, while Wheeler et al. (2019) provided the same for ultra-faint galaxies.
2.2 Benchmarking star-formation histories in FIRE-2
Before studying supernova rates, we first examine the SFHs for FIRE-2 galaxies. Irrespective of choice of Ia DTD (either the Mannucci et al. (2006) or the Maoz & Graur (2017) models), at any given time, Ia rates should be most sensitive to recent star formation. In Appendix A and Figure 11, we show that for the entire range in galaxy masses we consider, star formation within the last in lookback time accounts for the majority of Ia events at , with lower-mass galaxies being somewhat more sensitive to slightly earlier star formation. Thus, we benchmark recent SFHs in our simulations against a compilation of observations and semi-empirical models of galaxies from to , to provide confidence in using FIRE-2 to compare to observed Ia rates and to test alternative rate models.
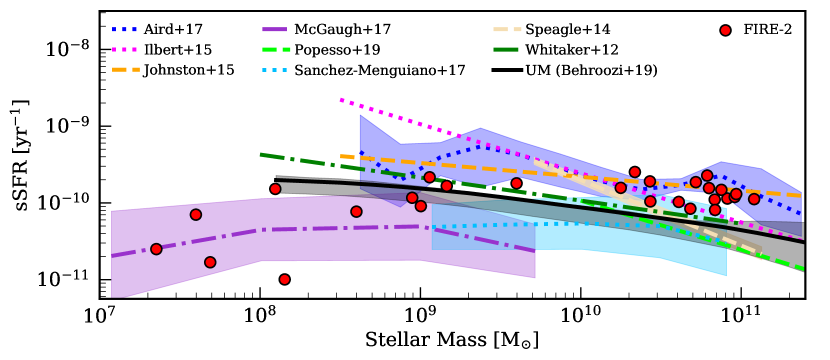 |
Figure 1 shows the sSFR at versus stellar mass for each FIRE-2 galaxy. We also show sSFRs from a compilation of observations as well as from the semi-empirical UniverseMachine model (hereafter UM; Behroozi et al., 2019). In computing present-day sSFRs, we take the mean of the sSFR, , over the last in lookback time, to account for stochasticity in the simulations and to better match the redshift range of the observations. We show the mean or median trend line along with per cent confidence intervals for the observed samples wherever applicable, while for the remaining observations we provide a best-fit relation to compare against.
The intrinsic scatter between different observational star-forming main sequence (SFMS) relations is large, likely from the variety of techniques used to infer SFRs in their respective samples. Whitaker et al. (2012) rely on Spitzer-MIPS fluxes from the S-COSMOS and FIDEL surveys. Speagle et al. (2014) present a compilation of SFMS measurements from a variety of observational papers using different techniques for measuring SFRs. Ilbert et al. (2015) rely on mid- and far-infrared observations of a catalogue of galaxies from the COSMOS and GOODS surveys. Johnston et al. (2015) employ SED fitting of broad-band photometry and mid-infrared data from the VIDEO survey. Aird et al. (2017) use deep Chandra X-ray luminosity observations and measurements of high- and low-mass X-ray binary stars. McGaugh et al. (2017) estimate SFRs for lower-mass (and low-surface-brightness) galaxies using a compilation of H flux measurements. Popesso et al. (2019) leverage infrared observations from WISE and Herschel as well as H fluxes. Finally, Sánchez-Menguiano et al. (2019) derive SFRs from dust-corrected H luminosities of galaxies in the SDSS-IV MaNGA survey. We do not claim to prefer any one sample over the others, because the differences in the various observational techniques are beyond the scope of this paper - for a more detailed study of different SFR tracers in the FIRE simulations, see Flores Velázquez et al. (2021) instead. Here, however, we present the entire spread of observed samples to compare our simulations against.
Nominally, the FIRE-2 trendline for all does not necessarily agree with any single observed sample extrapolated across the entire mass range – in particular, some such as Ilbert et al. (2015) show a significantly steeper trend in sSFR. However, all of our simulations broadly agree with the full range of observed sSFRs after accounting for uncertainties and systematic scatter between datasets. Although extrapolations of the higher-mass observed SFMS to would suggest tension with our lower-mass simulations, those simulations agree within with the McGaugh et al. (2017) values, measured directly for low-mass galaxies. Additionally, in Appendix B and Figure 12, we compare the per cent stellar mass assembly timescales for FIRE-2 galaxies with observed values for Local Group galaxies as well as observed and semi-empirical values at high masses. That comparison shows good systematic agreement between our low-mass simulations and Local Group observations. Since a slightly longer star formation timescale is relevant for Ia rates for low-mass galaxies, this comparison provides confidence in our low-mass SFHs despite the seeming tension with extrapolations of the high-mass SFMs. Altogether, examining our simulated SFHs validates their accuracy, especially in the context of their Ia rates being ‘realistic’ and not biased by the idiosyncrasies of their recent SFHs.
2.3 Type Ia supernovae: delay time distributions and nucleosynthetic yields
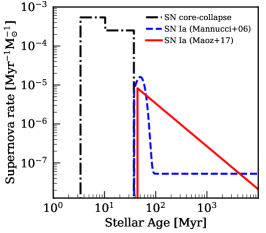
FIRE-2 assumes nucleosynthetic yields for Type Ia supernovae from Iwamoto et al. (1999). The original Ia DTD implementationin FIRE-2 is that of Mannucci et al. (2006), which uses a prompt Gaussian component followed by a constant rate at later times. However, the DTD from Maoz & Graur (2017), with a roughly form, is more observationally and theoretically motivated. Thus, for our analysis here, we focus on the DTD from Maoz & Graur (2017) and metallicity-dependent modifications to its normalisation (as described in Section 2.4). We also examine re-simulations of specific galaxies with different metallicity-dependent Ia rate models, as discussed in Section 2.4 and Table 2. The left and centre panels of Figure 2 compare the functional forms of the two DTDs, with the FIRE-2 implementation of the core-collapse supernova rates also shown for comparison.
As Figure 2 (centre) shows, the Maoz & Graur (2017) DTD leads to a higher cumulative number of Ia for times Myr, and the ratio of the number of supernovae relative to the Mannucci et al. (2006) DTD is: at Gyr, at Gyr, and at Gyr. Also, the total number of core-collapse supernovae is higher than Ia in either case, and the mechanical kinetic energy of IMF-averaged supernova events implemented in FIRE-2 is identical for core-collapse and Ia ( erg), so Ia do not dominate supernova feedback unless their rate is increased by more than , which is important for understanding the results from our metallicity-dependent Ia rates. To explore the overall normalization of this rate increase, we also impose an (arbitrary) cap on how much the rate can be boosted – either or , as Equation 1 shows.
During simulation runtime, Gizmo samples supernova events probabilistically from the DTD based on the age of each star particle. For the first part of our analysis, we re-compute Ia rates keeping galaxy properties fixed (as shown in Table 1), by post-processing a single snapshot. We consider the ages (at ) of all star particles within a kpc spherical volume around each host galaxy, and we apply them to the DTD of choice to retrieve a Ia rate for each star particle. We then add these to obtain an overall Ia rate for the galaxy, and we divided by the total stellar mass of the galaxy at to compute the specific Ia rate. To account for stochasticity (burstiness) in the star-formation rates, and to roughly match the redshift distribution of the observations that we compare against, we average the Ia rate over the past Myr in lookback time from .
 |
 |
 |
2.4 Metallicity-dependent Ia rates and re-simulations
Motivated by observations of the Milky Way showing that the close-binary fraction of stars is higher in lower-metallicity stars (see Section 1), we introduce a power-law metallicity-dependent modifier to the normalization of the Ia DTD from Maoz & Graur (2017). Note that a detailed theoretical examination of the physics behind such a metallicity dependence and its exact nature are beyond the scope of this paper; instead we carry out an empirical analysis of metallicity-dependent rate modifications using the FIRE-2 simulations, and their macroscopic effects on stellar feedback, elemental enrichment, and galaxy formation in general.
Our modifications do not change the shape of the DTD nor the minimum delay time: we only modify its normalisation based on the total metal mass fraction of the star particle for which the rate is being computed, as shown below.
| (1) |
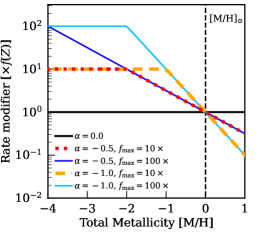
Equation 1 shows the functional form for our power-law modifier, where for each star particle, we multiply the normalisation of the Maoz & Graur (2017) DTD (denoted by ) with the minimum of the following two quantities: (a) a metallicity-dependent power law, normalised to the solar metal mass fraction (from Asplund et al., 2009), with a variable exponent (denoted by ), and (b) an (arbitrary) cap of either or imposed on the rate enhancement. The latter allows us to control the strength of the total boost to the Ia rate and ensure that it is not arbitrarily large for populations with arbitrarily low metallicities. A cap of also means that the feedback from Ia is comparable to (does not dominate over) that from core-collapse supernovae (which we do not modify) at low metallicities.
Figure 2 (right) provides a visual representation of the metallicity dependence of our modifier, including the normalisation to Solar abundance. The impact of the choice of rate-boost cap also is visible for [M/H] . Again, the (simple) modifiers that we explore affect only the normalisation of the Maoz & Graur (2017) DTD, without altering its shape.
There is an important distinction between re-computing rates in post-processing with our metallicity-dependent models and fixed galaxy properties, and self-consistently re-simulating galaxies with modified Ia rate models. To test our metallicity-dependent rate models and compare to results from observational surveys, we first compute Ia rates for various FIRE-2 simulations by applying these models in post-processing only. While this allows us to estimate the Ia rates resulting from various modifications to the DTD, it does not change the simulation’s feedback energetics, enrichment, or SFH (all of which are based on the original simulations using the DTD from Mannucci et al., 2006). Note that this is not an issue for the fiducial, metallicity-independent Maoz & Graur (2017) DTD, since the difference in the number of Ia over Gyr is per cent, but becomes a major concern when we introduce metallicity dependence. Therefore, to self-consistently model the simulations’ formation histories, we re-simulate a subset (4) of the FIRE-2 galaxies (m12i, m11e, m11b and m09, with original stellar masses of , , , and respectively) using the DTD from Maoz & Graur (2017) and various metallicity-dependent rate modifiers. We then examine their (self-consistent) Ia rates, elemental abundances, and other galaxy properties. Table 2 lists these re-simulations, including the input models that we use and the resultant galaxy properties at .
| Name | Power-law | Rate | Stellar | sSFR | [Fe/H] | [Mg/Fe] | Ax. ratio | |||
|---|---|---|---|---|---|---|---|---|---|---|
| Exponent | Boost Cap | Mass | (lookback) | (stellar) | (stellar) | (stellar) | (stellar) | (stellar) | ||
| () | () | [] | [Gyr] | [] | [kpc] | (min/maj) | ||||
| m12i_Mann† | N/A | N/A | ||||||||
| m12i_Maoz | N/A | N/A | ||||||||
| m12i_Z05-10x | ||||||||||
| m12i_Z05-100x | ||||||||||
| m12i_Z1-10x | ||||||||||
| m12i_Z1-100x | ||||||||||
| m11e_Mann† | N/A | N/A | ||||||||
| m11e_Maoz | N/A | N/A | ||||||||
| m11e_Z05-10x | ||||||||||
| m11e_Z05-100x | ||||||||||
| m11e_Z1-10x | ||||||||||
| m11e_Z1-100x | ||||||||||
| m11b_Mann† | N/A | N/A | ||||||||
| m11b_Maoz | N/A | N/A | ||||||||
| m11b_Z05-10x | ||||||||||
| m11b_Z05-100x | ||||||||||
| m11b_Z1-10x | ||||||||||
| m11b_Z1-100x | ||||||||||
| m09_Mann† | N/A | N/A | ||||||||
| m09_Maoz | N/A | N/A | ||||||||
| m09_Z05-10x | ||||||||||
| m09_Z05-100x |
2.5 Observed Ia supernova rates
The two primary observational datasets of Ia rates we compare against throughout this paper are from ASAS-SN (Brown et al., 2019) and DES (Wiseman et al., 2021). The quantity actually measured in both surveys is the number of Ia supernovae per unit time in galaxies in a given mass bin. They then divide these values by the total stellar mass in that bin from an independently measured galaxy stellar mass function (SMF) at to get a specific rate of Ia. This choice of assumed SMF is important, because it directly (linearly) affects the inferred specific rate of Ia.
Brown et al. (2019) use the SMF from Bell et al. (2003), which is a fairly ‘shallow’ mass function, with almost flat towards lower stellar masses. On the other hand, Wiseman et al. (2021) use the Baldry et al. (2012) SMF, which is much steeper towards the low-mass end – roughly . This leads to a discrepancy in the total stellar mass in different mass bins assumed in both studies, especially at lower masses. As we will show, this difference in assumed stellar mass function accounts for almost all of the apparent difference in specific Ia rate between ASAS-SN and DES in the regime .
Additionally, the choice of SMF influences the resultant abundance-matching relation in models like UM and requires different galaxy SFHs to be self-consistent. Specifically, a steeper SMF requires higher late-time SFRs to match the shallower - relation, while choosing a shallower SMF requires a steeper - relation and thus lower late-time SFRs, especially at lower masses. This also affects the resultant Ia rate, because supernova rates at are sensitive to recent star formation.
 |
In Figure 3, we compare specific rates of Ia supernovae from ASAS-SN and DES. We normalize all rates (simulated and observed) to the same (arbitrary) rate for galaxies at . We do this because of the convention in Brown et al. (2019), as computing absolute Ia rates from observations is non-trivial, and our primary goal is to explore mass dependence of the rates, not their exact normalisation.
At masses , the trend in specific rate from DES qualitatively agrees with the original ASAS-SN values (those that utilise the Bell et al. (2003) SMF), for both their samples, rising by a factor of from down to . However, the two are discrepant for galaxies , up to a factor of . Both original ASAS-SN samples that utilise the shallower Bell et al. (2003) SMF show significantly higher Ia rates at lower stellar masses compared to DES ( at , and larger at even lower masses). We also show modified versions of both ASAS-SN samples that use the Baldry et al. (2012) SMF instead, which are more consistent with DES results. We compute this by multiplying the ASAS-SN rates in each mass bin by the ratio of the total stellar mass in that bin from the Bell et al. (2003) SMF to that from the Baldry et al. (2012) SMF, as Equation 2 below shows:
| (2) |
This modification leads to better agreement (within ) between ASAS-SN and DES for Ia rates, with almost all the discrepancy at lower masses eliminated. The question of the trend in specific Ia rate versus stellar mass then comes down to that of the appropriate SMF at . A steeper SMF results in higher SFRs for low-mass galaxies at late times and specific Ia rates that have shallower dependence on stellar mass. Conversely, a shallower SMF leads to lower late-time SFRs and higher Ia rates at the low-mass end. While a more thorough examination of this issue is beyond the scope of this paper, it is important to note as a significant source of systematic uncertainty. Note: henceforth, we use the ASAS-SN volume-limited rates rescaled to the Baldry et al. (2012) SMF as our ‘reference’ observed rate to compare against, while also showing the full systematic scatter in rates across different observations and assumed SMFs.
3 Results
3.1 Comparisons to observed Ia rates
The DTD from Maoz & Graur (2017) is an updated, more physically motivated model with stronger observational support than that of Mannucci et al. (2006). We also find that computing Ia rates in our simulations using either of the two DTDs results in qualitatively the same (approximately flat) trend versus galaxy mass. Therefore, for all subsequent analysis with metallicity-independent Ia rates, we apply only the Maoz & Graur (2017) DTD in post-processing.
3.1.1 Metallicity-independent Ia rates
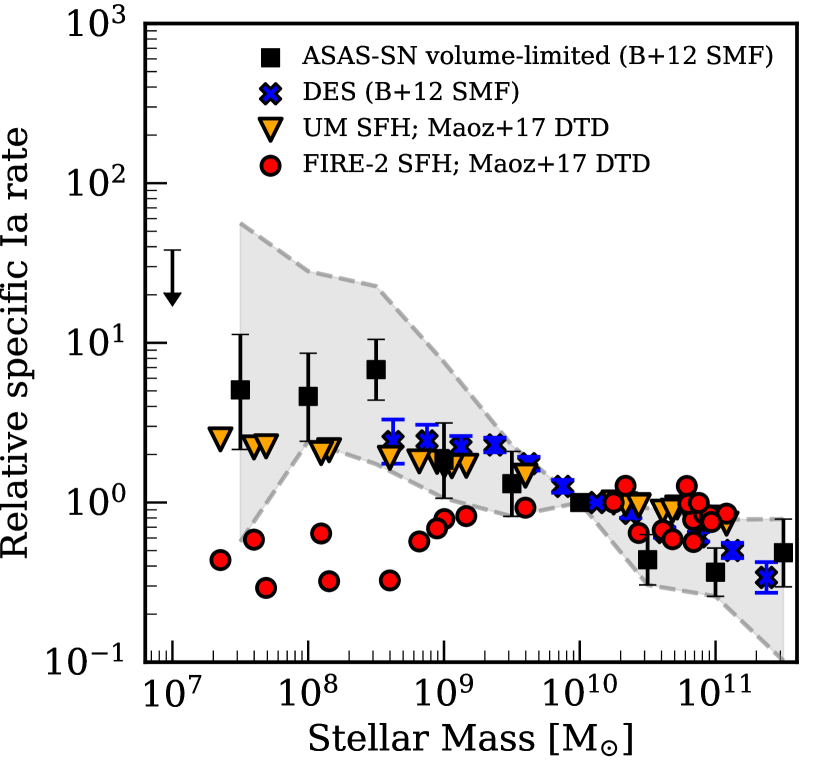 |
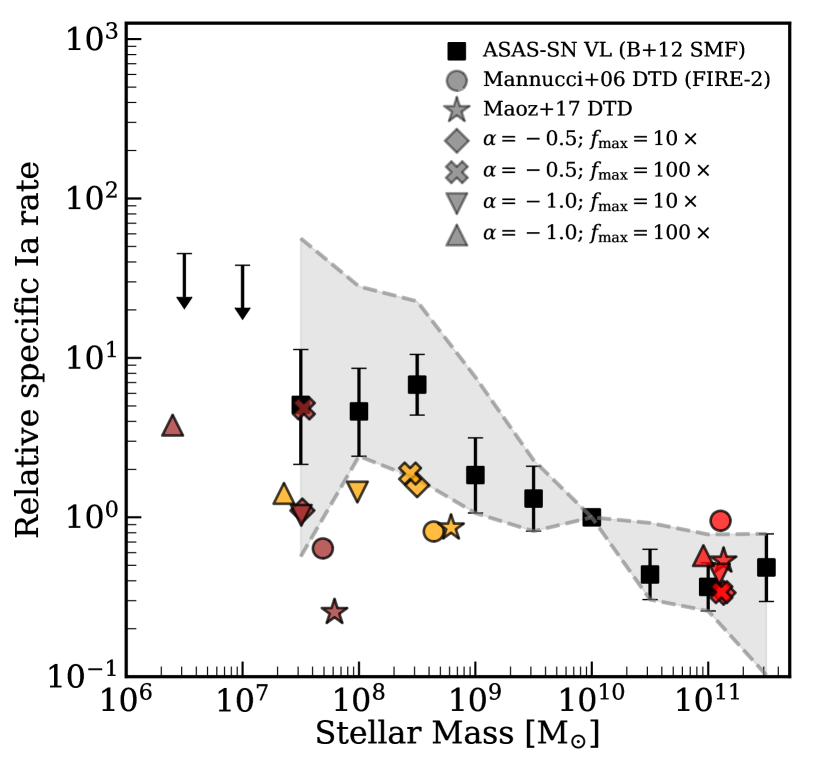
Figure 4 compares observations of specific Ia rates to those from applying the metallicity-independent Maoz & Graur (2017) DTD to our simulations. For this figure and all subsequent ones showing Ia rates, we compare against the full systematic spread of allowed observational trends in specific Ia rate versus stellar mass from Figure 3 (grey contours and shaded region), as well as the ASAS-SN values adjusted to the Baldry et al. (2012) SMF as a representative sample. An important caveat about the grey shaded region is that just because it shows the full systematic spread in possible observations does not mean that one can simply fit the shallowest or steepest slope, and does not necessarily say that any single observational dataset is consistent with that entire range of slopes.
As before, we normalise to the same (arbitrary) rate at . Given that we benchmark sSFRs and ( per cent stellar mass assembly timescale) values in our simulations at (Figures 1 and 12), and that our choices of DTD in FIRE-2 (Mannucci et al., 2006; Maoz & Graur, 2017) are normalised to match observations, we know that the absolute Ia rates in our galaxies are approximately consistent with observations, by design. Thus, we focus only on the relative trends in specific Ia rates here and in subsequent figures.
Figure 4 shows a potential discrepancy between the simulated Ia rates using the fiducial DTD from Maoz & Graur (2017) and the rates from observations, especially with the stronger of the allowed trends. The potential discrepancy seems especially strong at low masses, with the FIRE-2 rates being lower than the upper end of the spread in observations at , and lower than ASAS-SN values using the Baldry et al. (2012) SMF at the same mass. To check any possible variations (stochasticity) or systematic offsets in our simulated SFHs, we also show the rates computed by applying the same DTD to average galaxy SFHs UM. While the UM rates reduce the tension with observations somewhat, both the slope of the trend with mass and the relative rates still show a potential discrepancy at low masses. Going from to , the re-scaled ASAS-SN rates increase by , the fiducial FIRE-2 rates decrease by , and the UM rates increase by . DES values don’t cover the entire mass range, but increase by going from to . Considering the full systematic spread in possible observed trends either somewhat decreases the discrepancy with the Maoz & Graur (2017) DTD or greatly increases it, given the logarithmic scale on the y-axis. The fact that these discrepancies exist regardless of the choice of SFHs further motivates our exploration of modified (metallicity-dependent) rates for Ia supernovae.
3.1.2 Metallicity-dependent Ia rates
 |
 |
 |
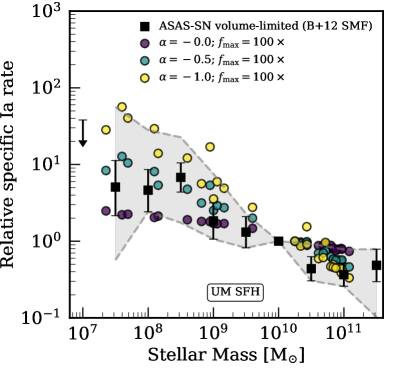 |
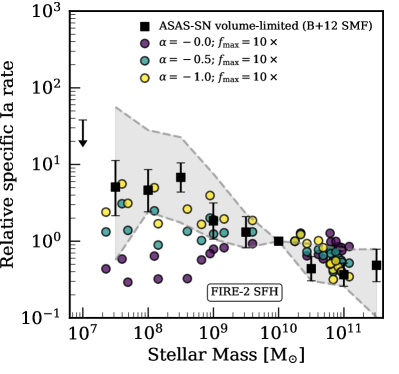
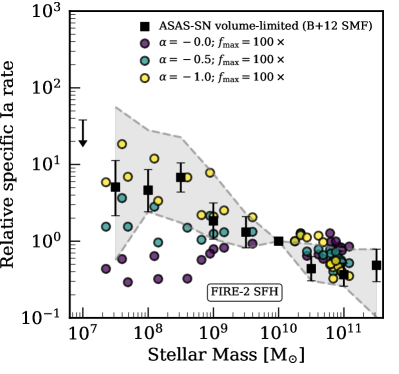
Figure 5 shows our metallicity-dependent modifier to Ia rates applied to the FIRE-2 simulations in post-processing (we test self-consistent re-simulations in Section 3.2.1), compared to the same range in allowed observational trends as in Figure 4. For our models, we show Ia rates based on power-law exponent values (see Equation 1) of , , and . The top two panels of Figure 5 show metallicity-dependent rates using the fiducial FIRE-2 SFHs, along with a rate boost cap of or . Reproducing the strongest allowed trend in the observations requires a fairly extreme metallicity dependence of and .
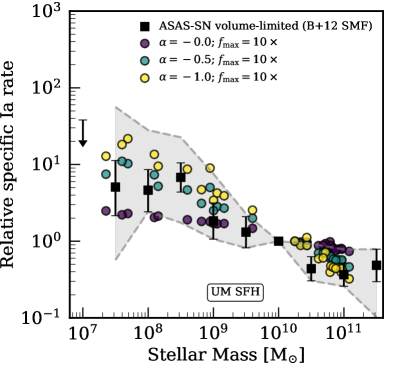
The bottom two panels of Figure 5 show the application of the metallicity-dependent modifiers to Ia rates to SFHs from UM instead. We do this by retaining the metallicities of the star particles in FIRE-2 galaxies but adjusting their ages to match the SFHs of the UM galaxy closest in stellar mass at . While this is not fully self-consistent, given that the elemental enrichment history of a galaxy may change with its SFH, it does preserve the relative rank ordering of age and metallicity among star particles, and we consider it a reasonable test given the absence of a rigorous semi-empirical model for enrichment. With these SFHs (that have more recent star formation in lower galaxies, hence a more enhanced Ia rate there), a power-law exponent of is sufficient to match ASAS-SN values using the Baldry et al. (2012) SMF, and that of is sufficient to reproduce the strongest observed trend in Ia rate, depending on the choice of .
 |
3.2 Metallicity-dependent models for Ia rates in self-consistent galaxy re-simulations
3.2.1 Self-consistent metallicity-dependent Ia rates
Having shown that metallicity-dependent Ia rate modifiers are able, in principle, to produce simulated rates that are consistent with the full range allowed by observations, we seek to examine the effects of boosting Ia rates on other aspects of galaxy formation. Re-simulating galaxies with different Ia rate models is fundamentally different from simply computing rates in post-processing. In the former, changes to the Ia rate affect both mechanical feedback and metal enrichment, leading to differences in SFHs as well as enrichment histories, while in the latter (and all of our analysis so far) we simply compute Ia rates without altering galaxy properties.
Self-consistent re-simulations are especially important for lower-mass galaxies, with more metal-poor stellar populations, which would have their rates boosted much more than the Milky-Way mass galaxies. As explained in Section 2.4, we re-simulate 4 of the FIRE-2 galaxies (m12i, m11e, m11b, and m09) with various metallicity-dependent modifiers to the Maoz & Graur (2017) DTD. Table 2 lists these re-simulations, with their Ia rate modifiers, and resultant galaxy properties.
Figure 6 shows the specific Ia rates for the re-simulations of 3 of the galaxies run with our metallicity-dependent rate models. Importantly, the effect on the rate versus diagram is not quite the same as that from our post-processing analysis in Figure 5, especially for the lower-mass galaxies (m11e and m11b), because the re-simulations with extreme rate models ( and ) form significantly fewer stars, owing to increased supernova feedback. This means that the rates in the re-simulated galaxies are plausibly consistent with the shallowest observed trends and quasi-consistent with the re-scaled ASAS-SN rates, but not with the steepest possible observed trends. However, they allow us to favour our moderately metallicity-dependent model (, ) since it gives us rates within observational scatter while not having too large of an impact on the final galaxy masses.
3.2.2 Effects on galaxy properties: mass, size, morphology
We next examine the effect of our modified models for Ia rates on the overall properties of these galaxies. For the re-simulations of m12i, m11e, and m11b, we compare 4 parameters at : (a) stellar mass, (b) , the radius enclosing per cent of the stellar mass, (c) for stars, a measure of rotational versus dispersion support, and (d) minor to major axis ratio of the stars (based on the principal axes of the rotational inertia tensor of the galaxy). Note that the m09 re-simulations are at a mass scale especially sensitive to even the slightest perturbations in feedback energetics and with morphologies and sizes that are not well constrained by observations, so we do not include those in this part of the analysis.
 |
Figure 7 (top) shows that for the Milky Way-mass galaxy m12i, the various re-simulations do not significantly impact its stellar mass, because the Ia rates near solar metallicity scale are barely changed (by design). Thus, any changes to its early formation (when it was low metallicity) do not significantly alter its properties at . The lower-mass galaxies m11e and m11b, however, show a gradual decline in stellar mass with increasing Ia rate boosts, with the most extreme models leading to an almost order of magnitude drop. Figure 7 (upper middle) shows , which gradually increases with more extreme rate models for m12i and m11b. m11e shows a sharper increase in radius, with the most extreme metallicity-dependent models resulting in diffuse galaxies. We suspect that this is because some feature of m11e’s formation history makes its size especially susceptible to changes in feedback energetics. For more detailed studies on ‘puffiness’ of low-mass galaxies using the FIRE simulations, refer to El-Badry et al. (2016) and Kado-Fong et al. (2021). Figure 7 (lower middle) shows that the stellar , or the rotation versus dispersion metric, remains nearly unchanged for all 3 galaxies regardless of the choice of model for Ia rates. Finally, Figure 7 (bottom) shows that m12i remains ‘disk-like’ (small axis ratios) for all its variant re-simulations, while m11e and m11b show increasing axis ratios and more spheroidal morphologies for the more extreme rate models.
We conclude that our most extreme metallicity-dependent Ia rate models most clearly impact the stellar masses and effective radii of the re-simulated galaxies, especially at lower-masses. However, there remains room for our more modest rate models that don’t have as large of an impact on the resultant galaxy overall. For these properties, rigorously comparing against observations is beyond the scope of this paper – but is potentially important for future work.
3.2.3 Relation between stellar mass and metallicity
 |
 |
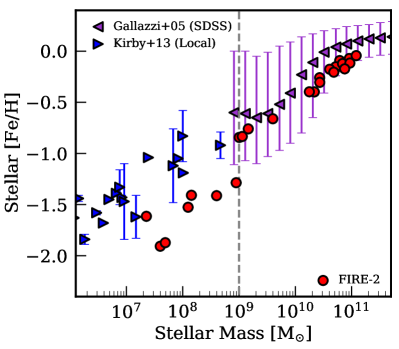
We also examine the impact on stellar elemental abundances. Figure 8 (left) shows the present-day relation between stellar metallicity, [Fe/H], and stellar mass for our entire suite of original FIRE-2 galaxies. We compare to observed stellar iron abundances from Kirby et al. (2013) at low mass and Gallazzi et al. (2005) at high mass. While Gallazzi et al. (2005) measured metallicities of high-mass galaxies with SDSS fiber spectroscopy, Kirby et al. (2013) measured resolved star-by-star metallicities in Local Group low-mass galaxies. Therefore, to make accurate comparisons, we compute iron abundances for our simulated galaxies in 2 ways: (a) using the logarithmic value of -weighted linear mean metallicity for galaxies with , and (b) a median value of log iron abundances of individual star particles, weighted by the particle masses. Equation 3 describes the log -weighted linear mean metallicity, where the sums are over star particles (denoted by ), represents the iron mass fraction of star particles, and is the Solar iron mass fraction from Asplund et al. (2009).
| (3) |
We find that iron abundances for FIRE-2 galaxies at stellar masses agree with observations within , while galaxies at lower masses show a systematic deficit relative to the observed relation. Previous studies of FIRE-2 simulations have shown this offset at as well, such as Ma et al. (2016), Wetzel et al. (2016), Escala et al. (2018), Wheeler et al. (2019), and Hopkins et al. (2020).
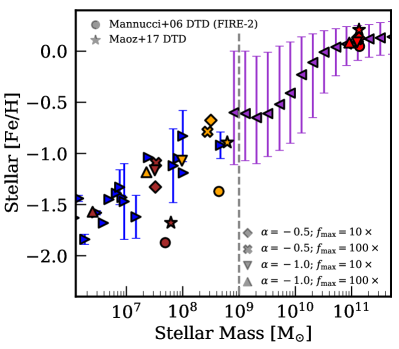
The right panel of Figure 8 shows the same stellar mass-metallicity relation, but for our re-simulations of m12i, m11e, and m11b with metallicity-dependent rates. The metallicities of the m12i re-simulations hardly change, because the boost in Ia rates at this mass is negligible – the good agreement with observations remains. For the lower-mass m11e and m11b re-simulations, the switch from the Mannucci et al. (2006) DTD to the metallicity-independent DTD from Maoz & Graur (2017) leads to a modest but significant increase in [Fe/H], because of the net increase in the total number of Ia supernovae. A previous study using FIRE simulations (Muley et al., 2021) also reported this increase in total number by simply switching to the Maoz & Graur (2017) DTD. Additionally, the metallicity-dependent rate models lead to improved agreement with the observed mass-metallicity relation. For the most extreme rate models ( with or ), the overall drop in stellar mass leads to the galaxies moving down along the relation, while still agreeing well with the observed values. This suggests that the systematic discrepancy in low-mass, low-metallicity galaxies is possibly from underestimation of Type Ia supernova rates, and our intermediately metallicity-dependent models can account for any apparent discrepancy at these masses.
3.2.4 Iron abundances in ultra-faint galaxies
 |
At stellar masses of , previous studies (Wheeler et al., 2019, for example), have shown that simulated galaxies tend to significantly under-produce their iron abundance relative to observations such as those from Kirby et al. (2013). Simulation projects besides FIRE also have shown this under-enrichment of ultra-faint galaxies by dex or more relative to Kirby et al. (2013), such as Macciò et al. (2017), the Engineering Dwarfs at Galaxy formation’s Edge (EDGE; Agertz et al., 2020) project, and the Mint Resolution DC Justice League simulations (Applebaum et al., 2021). We investigate whether introducing metallicity-dependent models for Ia rates alleviates this tension, using the re-simulated versions of m09.
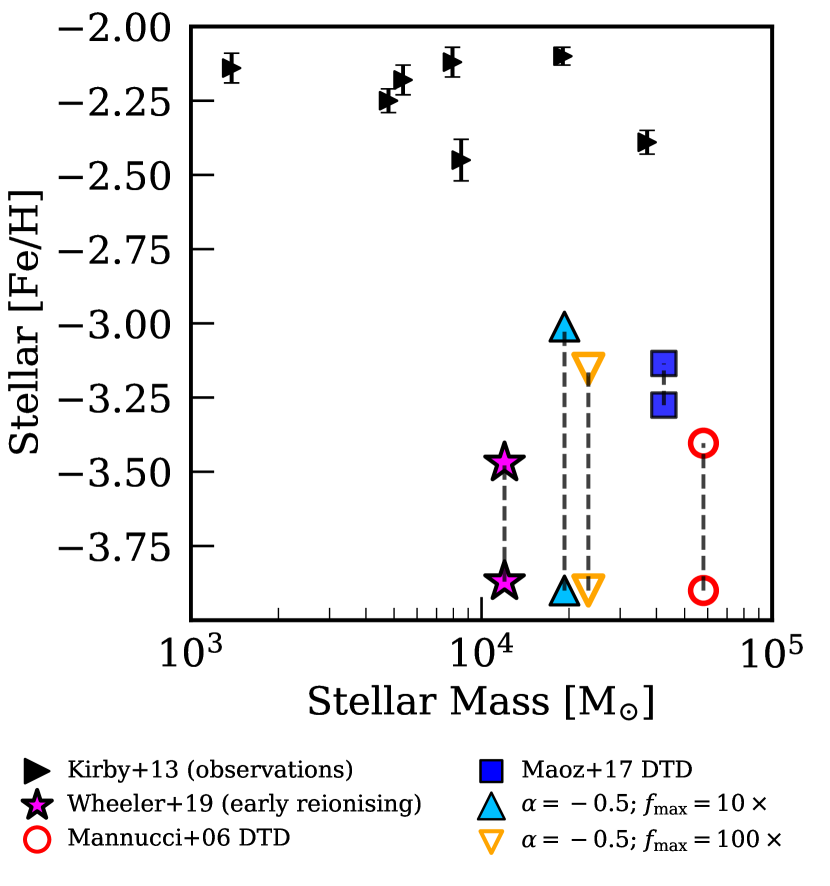
Figure 9 shows the relation between stellar [Fe/H] and stellar mass at . We also show observations in Kirby et al. (2013). For comparison to prior studies using the FIRE-2 simulations, we include the point from Wheeler et al. (2019) for the original m09 simulation, which used the standard cosmic UV background in FIRE-2 (Faucher-Giguère et al., 2009), corresponding to an earlier redshift of HI reionisation of . We also show median [Fe/H] abundances for our version of the m09 simulation with an updated cosmic UV background model (Faucher-Giguère, 2020), corresponding to a later reionisation redshift of , as well as the versions of it re-simulated with different metallicity-dependent models for Ia rates.
For all simulations, we show 2 different -weighted median [Fe/H] values, connected by a grey dashed line in each case. This is because the FIRE-2 model does not model Pop III stars, instead assigning a metallicity floor of [Fe/H] to pristine gas when simulations begin. (This value is based on Asplund et al. (2009) Solar values, which corresponds to in units of Anders & Grevesse (1989).) At these extremely low masses, reionisation plus stellar feedback result in short SFHs with few enriched stars forming, such that many star particles form from gas at the metallicity floor, which results in the median [Fe/H] value being artificially skewed towards . Because we cannot adjust for this in the absence of a full model of Pop III stars, and because Pop III stars would not survive to to have their [Fe/H] measured, we show two median [Fe/H] values for each galaxy - one that takes into account all star particles and another that only considers star particles that have been enriched above the metallicity floor.
A couple of other considerations also potentially justify considering the enriched populations: (a) even at the full resolution, our simulations may not be fully time-resolving the SFHs of these extremely low-mass galaxies to resolve early enrichment events, and (b) uncertainties surrounding variations in early stellar initial mass functions (IMFs) suggest that the low-mass end may not be fully populated at low metallicities.
Note that our modifications to the UV/X-ray ionising background and Ia rates in m09 have a non-trivial impact on its stellar mass – these impacts, however, make sense given the underlying changes in physics. The first-order effect is that of the updated ionising background; simply changing the reionisation timeline from to the updated one with , that is, going from the pink Wheeler et al. (2019) point to the unfilled red Mannucci et al. (2006) point leads to an increase in by a factor of . This makes sense because the impact of the reionisation timeline on star formation is largest at this mass scale. Going from the unfilled red to the filled blue point leads to a small decrease in because of the modest increase in overall numbers of Ia supernovae. Finally, the significant boosts to the Ia rates in the metallicity-dependent model re-simulations lead to further decrease in , and the and versions are similar to each other within run-to-run numerical stochasticity. An interesting coincidence is that adding metallicity dependence to Ia rates leads to a final at that is significantly closer to that from Wheeler et al. (2019), despite the differences in the cosmic ionising background.
As Figure 9 shows, going from the original FIRE-2 version with the Mannucci et al. (2006) DTD to the metallicity-independent DTD from Maoz & Graur (2017) to metallicity-dependent rate models increases the median iron abundance and in general reduces, but does not eliminate, the tension with observations. Considering only enriched stellar populations leads to much better agreement. However, the differences across our metallicity-dependent models for Ia rates are too modest to provide a definitive test. We remind the reader that other simulation studies (EDGE, DC Justice League) also report the original discrepancy, and that a combination of modelling core-collapse supernova enrichment in Pop III stars and metallicity-dependent Ia rates might provide the best agreement in the stellar mass-metallicity relation at these galaxy masses.
3.2.5 Stellar -element abundances
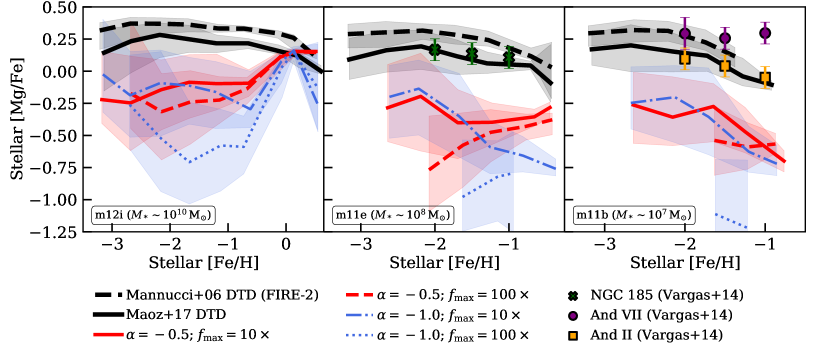 |
Finally, we investigate the impact of modifying rates of Ia supernovae on stellar alpha-to-iron ratios. Specifically, we consider stellar [Mg/Fe], because boosting the Ia rate without changing the core-collapse supernova rate should drive up iron abundances without changing -element abundances like magnesium, thus leading to lower [Mg/Fe].
We investigate stellar [Mg/Fe] versus [Fe/H] for 3 of our re-simulated galaxies in Figure 10. For m11b and m11e, [Mg/Fe] versus [Fe/H] for the metallicity-independent DTDs from Mannucci et al. (2006) and Maoz & Graur (2017) are broadly consistent with observations of select Local Group dwarf galaxies at similar masses from Vargas et al. (2014), as the right panel shows. For re-simulations with metallicity-dependent models for Ia rates, the median [Mg/Fe] drops as expected. These reductions in normalisation are for and for . One caveat here is that uncertainties in our assumed core-collapse supernova rates and magnesium yields might also play a role in determining the overall [Mg/Fe] normalisation, but likely to a lesser extent that our strong metallicity-dependent Ia rate modifiers.
In the 2 lower-mass galaxies (m11e and m11b), we find for certain models that [Mg/Fe] values actually increase with [Fe/H], resulting in a positive slope, and a dearth of stars at low [Fe/H], given how rapidly [Fe/H] enriches at low [Fe/H] in the more extreme metallicity-dependent Ia models, especially during strong early burst of star formation. The higher-mass simulation (m12i) also shows such positive slopes in some cases. This is possibly from early stellar populations being metal poor leading to increased Ia rates and a drop in [Mg/Fe], with later populations converging on solar (or higher) abundances and not having their Ia rates boosted significantly. Such an effect could result in the seen convergence of [Mg/Fe] values around [Fe/H] . In either case, we are not aware of any observed significant positive slopes in [Mg/Fe] versus [Fe/H].
Figure 10 also shows, in the more extreme () rate variants of the two lower-mass galaxies m11e and m11b, a gap in [Fe/H] values, which ‘jump’ to and above. This is because both galaxies have relatively small numbers of enriched stars, and those enriched populations have abundances of [Fe/H] from increased stellar feedback when their Ia rates were significantly boosted. In the extreme variants of both m11e and m11b, the greatly increased Ia feedback results in truncated, bursty star formation, and a majority of stars end up staying at the metallicity floor, while some enriched populations end up with [Fe/H] . This results in a narrow distribution of iron abundances for enriched stars at [Fe/H] to .
Overall, we find that the more extreme models for Ia rates (those with or ) result in dramatic drops in stellar [Mg/Fe], or strongly positive trends in [Mg/Fe], versus [Fe/H], likely ruled out by observations. This allows us to disfavour those extreme models and instead favour ones with more modest dependence of Ia rate on overall metallicity.
4 Summary and Conclusions
We explored a range of metallicity-dependent models for Ia supernova rates, motivated by the observed trends in specific Ia rate versus galaxy mass in surveys like ASAS-SN and DES, and by observations of the metallicity dependence of the close-binary fraction of Milky Way stars. We also explored the impact of these models on various aspects of galaxy formation.
Some studies (DES; Wiseman et al., 2021, for example) argued that the trend in the specific Ia rate versus galaxy stellar mass is potentially consistent with a DTD similar to that of Maoz & Graur (2017), without invoking any additional dependence. However, others (such as ASAS-SN; Brown et al., 2019) claim that such a DTD cannot be reconciled with observed trends. We find that differences between these works/surveys arise not primarily because of differences in Ia measurements or assumed DTDs, but rather, primarily from different assumed galaxy SMFs and SFHs at . If the low-mass SMF rises steeply (as per Baldry et al., 2012), late-time SFHs of low-mass galaxies would be higher and the inferred specific Ia rates for low-mass galaxies much lower – in this case, the tension is significantly weaker but potentially still not reconciliable with metallicity-independent Ia rates. If the SMF is shallow at lower masses, with lower late-time SFHs (as determined in Bell et al., 2003, and predicted in the FIRE simulations), then the tension is quite strong and additional metallicity dependence of the Ia DTD is definitely required.
Here we summarise our main results, including the various motivations for metallicity-dependent Ia rates, our range of explored models, and their impact on difference aspects of galaxy formation and evolution:
(i) Specific Ia rates depend mostly on recent SFHs and choice of SMFs, especially at the low-mass end: We showed that for the DTD from Maoz & Graur (2017), Ia rates at are mostly sensitive to recent star formation, Gyr. Additionally, assuming a steep low-mass SMF (as in Baldry et al., 2012) and higher late-time SFRs results in a weaker inferred trend of Ia rate versus stellar mass, while a shallower low-mass SMF (such as Bell et al., 2003) and lower late-time SFRs leads to a steeper dependence of Ia rate on galaxy mass. The latter definitely cannot be reconciled with a vanilla DTD and we see weak tension even for the former, motivating additional dependence of Ia rates on a quantity like metallicity.
(ii) Our metallicity-dependent model for Ia rates, motivated by observations: Milky Way observations (Moe et al., 2019; Wyse et al., 2020) of the close-binary fraction of Solar-type stars being anti-correlated with metallicity motivated our choice of metallicity-dependent modifiers to the Ia DTD from Maoz & Graur (2017). We chose the form , with and or . When computing rates in post-processing, we found a viable set of models that recover the full systematic spread in observed trends, including the steepest ones consistent with a shallower low-mass SMF.
(iii) Re-simulations with self-consistent modifications to Ia rates improve agreement with observed rates except for when the more extreme cases lead to strongly increased feedback: The re-simulated galaxies show minimal changes to stellar masses, sizes, circularity, and shapes, barring the most extreme models with or , which puff up, over-quench, and/or destroy their disk-like structure. The specific Ia rates in these re-simulations, while closer to the steeper observed trends, are at best too shallow and do not resolve the tension completely because of the trade off between boosting supernova rates and forming fewer new stars overall.
(iv) Better agreement with observed stellar mass-metallicity relation, with uncertainty for extremely low-mass galaxies: While high-mass galaxies in the fiducial FIRE-2 suite show reasonable agreement with observed metallicities, lower-mass galaxies are systematically lower by dex (as has also been shown previously by Ma et al., 2016; Escala et al., 2018; Hopkins et al., 2020). The metallicity-dependent rate models increase the stellar iron abundance in simulations with lower stellar masses () and more metal-poor populations, improving somewhat the agreement with the observed mass-metallicity relation at low masses. For extremely low-mass () galaxies, however, the self-limiting nature of increased Ia feedback (and possibly persistant resolution limits of our simulations) mean that that our modified models can account for only about half of the deficit in [Fe/H] compared with observations. Previously Muley et al. (2021) have shown, using FIRE simulations, that age- and metallicity-dependent core-collapse supernova yields also do not solve the [Fe/H] discrepancy at extremely low masses. Both of these results point to potential new astrophysics or a combination of modifications to feedback and enrichment processes being the solution, motivating future work on this subject that explores different factors in combination.
(v) Impact of modifying Ia rates on alpha element abundances: The primary effect of boosting Ia rates is to lower [Mg/Fe], with a higher-order effect altering the slope of the [Mg/Fe] versus [Fe/H] trend, especially in low-mass galaxies. This enables us to strongly disfavour our more extreme models ( and/or ) in favour of those with a more moderate dependence of Ia rates on metallicity.
Although Type Ia supernovae are only one piece of the puzzle for understanding stellar populations and modelling feedback in galaxies (along with core-collapse supernovae, stellar winds, photoionisation, photoelectric heating, etc.), understanding their numbers, rates, and energetics is nonetheless crucial to a wide variety of topics in astrophysics and cosmology. To our knowledge, this work is the first to explore metallicity-dependent Ia rates and their impact using cosmological simulations of galaxy formation. We hope to lay the groundwork for and motivate future studies in this area.
Acknowledgements
We thank Peter Behroozi, Ivanna Escala, Shea Garrison-Kimmel, Robyn Sanderson, Dan Weisz, and Philip Wiseman for valuable discussions that improved this paper overall, as well as sharing data in some cases.
This analysis relied on NumPy (Harris et al., 2020), SciPy (Jones et al., 2001; Virtanen et al., 2020), AstroPy222https://www.astropy.org/, a community-developed core Python package for Astronomy (Astropy Collaboration et al., 2013, 2018), Matplotlib, a Python library for publication-quality graphics (Hunter, 2007), the IPython package (Pérez & Granger, 2007), and the publicly available package GizmoAnalysis (Wetzel & Garrison-Kimmel, 2020, available at https://bitbucket.org/awetzel/gizmo_analysis); as well as NASA’s Astrophysics Data System (ADS)333https://ui.adsabs.harvard.edu/ and the arXiv444https://www.arxiv.org/ preprint service.
PJG and AW received support from: the NSF via CAREER award AST-2045928 and grant AST-2107772; NASA ATP grants 80NSSC18K1097 and 80NSSC20K0513; HST grants GO-14734, AR-15057, AR-15809, and GO-15902 from STScI; a Scialog Award from the Heising-Simons Foundation; and a Hellman Fellowship. AW and BJS acknowledge the Scialog Fellows program, sponsored by the Research Corporation for Science Advancement, which motivated some of this work. Support for PFH was provided by NSF Research Grants 1911233 & 20009234, NSF CAREER grant 1455342, NASA grants 80NSSC18K0562, HST-AR-15800.001-A. BJS received support from NSF grants AST-1920392, AST-1911074, AST-1908952, and AST-2050710 and NASA grants HST-GO-16451, HST-GO-16498, and 80NSSC21K1788. CW acknowledges support from NSF LEAPS-MPS grant AST-2137988. CAFG received support from NSF grants AST-1715216, AST-2108230, and CAREER award AST-1652522; from NASA grant 17-ATP17-0067; from STScI through grant HST-AR-16124.001-A; and from the Research Corporation for Science Advancement through a Cottrell Scholar Award.
We ran simulations and performed numerical calculations using: the UC Davis computer cluster Peloton, the Caltech computer cluster Wheeler, the Northwestern computer cluster Quest; XSEDE, supported by NSF grant ACI-1548562; Blue Waters, supported by the NSF; Frontera allocations FTA/Hopkins-AST21010 and AST20016, supported by the NSF and TACC; XSEDE allocations TG-AST140023 and TG-AST140064, and NASA HEC allocations SMD-16-7561, SMD-17-1204, and SMD-16-7592; Pleiades, via the NASA HEC program through the NAS Division at Ames Research Center.
Data Availability
The python code and data tables used to create each figure are available at https://github.com/pratikgandhi95/Ia-rates-metallicity-dependence. The FIRE-2 simulations are publicly available (Wetzel et al., 2022) at http://flathub.flatironinstitute.org/fire. Additional FIRE simulation data is available at https://fire.northwestern.edu/data/. A public version of the GIZMO code is available at http://www.tapir.caltech.edu/~phopkins/Site/GIZMO.html.
References
- Abbott et al. (2019) Abbott T. M. C., et al., 2019, ApJ, 872, L30
- Agertz et al. (2013) Agertz O., Kravtsov A. V., Leitner S. N., Gnedin N. Y., 2013, ApJ, 770, 25
- Agertz et al. (2020) Agertz O., et al., 2020, MNRAS, 491, 1656
- Aird et al. (2017) Aird J., Coil A. L., Georgakakis A., 2017, MNRAS, 465, 3390
- Aldering et al. (2002) Aldering G., et al., 2002, in Tyson J. A., Wolff S., eds, Society of Photo-Optical Instrumentation Engineers (SPIE) Conference Series Vol. 4836, Survey and Other Telescope Technologies and Discoveries. pp 61–72, doi:10.1117/12.458107
- Anders & Grevesse (1989) Anders E., Grevesse N., 1989, Geochimica Cosmochimica Acta, 53, 197
- Applebaum et al. (2021) Applebaum E., Brooks A. M., Christensen C. R., Munshi F., Quinn T. R., Shen S., Tremmel M., 2021, ApJ, 906, 96
- Asplund et al. (2009) Asplund M., Grevesse N., Sauval A. J., Scott P., 2009, ARA&A, 47, 481
- Astier et al. (2006) Astier P., et al., 2006, A&A, 447, 31
- Astropy Collaboration et al. (2013) Astropy Collaboration et al., 2013, A&A, 558, A33
- Astropy Collaboration et al. (2018) Astropy Collaboration et al., 2018, AJ, 156, 123
- Baldry et al. (2012) Baldry I. K., et al., 2012, MNRAS, 421, 621
- Behroozi et al. (2019) Behroozi P., Wechsler R. H., Hearin A. P., Conroy C., 2019, MNRAS, 488, 3143
- Bell et al. (2003) Bell E. F., McIntosh D. H., Katz N., Weinberg M. D., 2003, ApJS, 149, 289
- Brachwitz et al. (2000) Brachwitz F., et al., 2000, ApJ, 536, 934
- Brandt et al. (2010) Brandt T. D., Tojeiro R., Aubourg É., Heavens A., Jimenez R., Strauss M. A., 2010, AJ, 140, 804
- Brown et al. (2019) Brown J. S., et al., 2019, MNRAS, 484, 3785
- Chan et al. (2018) Chan T. K., Kereš D., Wetzel A., Hopkins P. F., Faucher-Giguère C. A., El-Badry K., Garrison-Kimmel S., Boylan-Kolchin M., 2018, MNRAS, 478, 906
- Childress et al. (2013) Childress M., et al., 2013, ApJ, 770, 107
- Chomiuk et al. (2012) Chomiuk L., et al., 2012, ApJ, 750, 164
- Cooper et al. (2009) Cooper M. C., Newman J. A., Yan R., 2009, ApJ, 704, 687
- Crain et al. (2015) Crain R. A., et al., 2015, MNRAS, 450, 1937
- Dong et al. (2015) Dong S., Katz B., Kushnir D., Prieto J. L., 2015, MNRAS, 454, L61
- El-Badry et al. (2016) El-Badry K., Wetzel A., Geha M., Hopkins P. F., Kereš D., Chan T. K., Faucher-Giguère C.-A., 2016, ApJ, 820, 131
- El-Badry et al. (2018) El-Badry K., et al., 2018, MNRAS, 473, 1930
- Emami et al. (2021) Emami N., et al., 2021, arXiv e-prints, p. arXiv:2108.08857
- Escala et al. (2018) Escala I., et al., 2018, MNRAS, 474, 2194
- Faucher-Giguère (2020) Faucher-Giguère C.-A., 2020, MNRAS, 493, 1614
- Faucher-Giguère et al. (2009) Faucher-Giguère C.-A., Lidz A., Zaldarriaga M., Hernquist L., 2009, ApJ, 703, 1416
- Flores Velázquez et al. (2021) Flores Velázquez J. A., et al., 2021, MNRAS, 501, 4812
- Frieman et al. (2008) Frieman J. A., et al., 2008, AJ, 135, 338
- Gallazzi et al. (2005) Gallazzi A., Charlot S., Brinchmann J., White S. D. M., Tremonti C. A., 2005, MNRAS, 362, 41
- Gao & Pritchet (2013) Gao Y., Pritchet C., 2013, AJ, 145, 83
- Garrison-Kimmel et al. (2017) Garrison-Kimmel S., et al., 2017, MNRAS, 471, 1709
- Garrison-Kimmel et al. (2019a) Garrison-Kimmel S., et al., 2019a, MNRAS, 487, 1380
- Garrison-Kimmel et al. (2019b) Garrison-Kimmel S., et al., 2019b, MNRAS, 489, 4574
- Graur & Maoz (2013) Graur O., Maoz D., 2013, MNRAS, 430, 1746
- Graur et al. (2014) Graur O., et al., 2014, ApJ, 783, 28
- Graur et al. (2015) Graur O., Bianco F. B., Modjaz M., 2015, MNRAS, 450, 905
- Graur et al. (2017) Graur O., Bianco F. B., Huang S., Modjaz M., Shivvers I., Filippenko A. V., Li W., Eldridge J. J., 2017, ApJ, 837, 120
- Graus et al. (2019) Graus A. S., et al., 2019, MNRAS, 490, 1186
- Guy et al. (2010) Guy J., et al., 2010, A&A, 523, A7
- Hahn & Abel (2011) Hahn O., Abel T., 2011, MNRAS, 415, 2101
- Hamuy et al. (1995) Hamuy M., Phillips M. M., Maza J., Suntzeff N. B., Schommer R. A., Aviles R., 1995, AJ, 109, 1
- Harris et al. (2020) Harris C. R., et al., 2020, Nature, 585, 357
- Heringer et al. (2017) Heringer E., Pritchet C., Kezwer J., Graham M. L., Sand D., Bildfell C., 2017, ApJ, 834, 15
- Heringer et al. (2019) Heringer E., Pritchet C., van Kerkwijk M. H., 2019, ApJ, 882, 52
- Hopkins (2015) Hopkins P. F., 2015, MNRAS, 450, 53
- Hopkins et al. (2018a) Hopkins P. F., et al., 2018a, MNRAS, 477, 1578
- Hopkins et al. (2018b) Hopkins P. F., et al., 2018b, MNRAS, 480, 800
- Hopkins et al. (2020) Hopkins P. F., et al., 2020, MNRAS, 492, 3465
- Hoyle & Fowler (1960) Hoyle F., Fowler W. A., 1960, ApJ, 132, 565
- Hunter (2007) Hunter J. D., 2007, Computing in Science Engineering, 9, 90
- Hwang et al. (2021) Hwang H.-C., et al., 2021, arXiv e-prints, p. arXiv:2111.01788
- Iben & Tutukov (1984) Iben I. J., Tutukov A. V., 1984, ApJS, 54, 335
- Ilbert et al. (2015) Ilbert O., et al., 2015, A&A, 579, A2
- Iwamoto et al. (1999) Iwamoto K., Brachwitz F., Nomoto K., Kishimoto N., Umeda H., Hix W. R., Thielemann F.-K., 1999, ApJS, 125, 439
- Iyer et al. (2020) Iyer K. G., et al., 2020, MNRAS, 498, 430
- Izzard et al. (2004) Izzard R. G., Tout C. A., Karakas A. I., Pols O. R., 2004, MNRAS, 350, 407
- Johnston et al. (2015) Johnston R., Vaccari M., Jarvis M., Smith M., Giovannoli E., Häußler B., Prescott M., 2015, MNRAS, 453, 2540
- Jones et al. (2001) Jones E., Oliphant T., Peterson P., et al., 2001, SciPy: Open source scientific tools for Python, http://www.scipy.org/
- Kado-Fong et al. (2021) Kado-Fong E., et al., 2021, arXiv e-prints, p. arXiv:2109.05034
- Keller & Kruijssen (2020) Keller B. W., Kruijssen J. M. D., 2020, arXiv e-prints, p. arXiv:2004.03608
- Kim et al. (2016) Kim J.-h., et al., 2016, ApJ, 833, 202
- Kirby et al. (2013) Kirby E. N., Cohen J. G., Guhathakurta P., Cheng L., Bullock J. S., Gallazzi A., 2013, ApJ, 779, 102
- Kobayashi et al. (2006) Kobayashi C., Umeda H., Nomoto K., Tominaga N., Ohkubo T., 2006, ApJ, 653, 1145
- Kobayashi et al. (2015) Kobayashi C., Nomoto K., Hachisu I., 2015, ApJ, 804, L24
- Kobayashi et al. (2020) Kobayashi C., Leung S.-C., Nomoto K., 2020, ApJ, 895, 138
- Kochanek et al. (2017) Kochanek C. S., et al., 2017, PASP, 129, 104502
- Kroupa (2001) Kroupa P., 2001, MNRAS, 322, 231
- Krumholz & Gnedin (2011) Krumholz M. R., Gnedin N. Y., 2011, ApJ, 729, 36
- Lach et al. (2020) Lach F., Röpke F. K., Seitenzahl I. R., Coté B., Gronow S., Ruiter A. J., 2020, A&A, 644, A118
- Law et al. (2009) Law N. M., et al., 2009, PASP, 121, 1395
- Lee et al. (2006) Lee H., Skillman E. D., Cannon J. M., Jackson D. C., Gehrz R. D., Polomski E. F., Woodward C. E., 2006, ApJ, 647, 970
- Leethochawalit et al. (2018) Leethochawalit N., Kirby E. N., Moran S. M., Ellis R. S., Treu T., 2018, ApJ, 856, 15
- Leitherer et al. (1999) Leitherer C., et al., 1999, ApJS, 123, 3
- Leitner (2012) Leitner S. N., 2012, ApJ, 745, 149
- Lequeux et al. (1979) Lequeux J., Peimbert M., Rayo J. F., Serrano A., Torres-Peimbert S., 1979, A&A, 500, 145
- Li et al. (2000) Li W. D., et al., 2000, in Holt S. S., Zhang W. W., eds, American Institute of Physics Conference Series Vol. 522, Cosmic Explosions: Tenth AstroPhysics Conference. pp 103–106 (arXiv:astro-ph/9912336), doi:10.1063/1.1291702
- Li et al. (2011) Li W., Chornock R., Leaman J., Filippenko A. V., Poznanski D., Wang X., Ganeshalingam M., Mannucci F., 2011, MNRAS, 412, 1473
- Ma et al. (2016) Ma X., Hopkins P. F., Faucher-Giguère C.-A., Zolman N., Muratov A. L., Kereš D., Quataert E., 2016, MNRAS, 456, 2140
- Macciò et al. (2017) Macciò A. V., Frings J., Buck T., Penzo C., Dutton A. A., Blank M., Obreja A., 2017, MNRAS, 472, 2356
- Mannucci et al. (2005) Mannucci F., Della Valle M., Panagia N., Cappellaro E., Cresci G., Maiolino R., Petrosian A., Turatto M., 2005, A&A, 433, 807
- Mannucci et al. (2006) Mannucci F., Della Valle M., Panagia N., 2006, MNRAS, 370, 773
- Maoz & Graur (2017) Maoz D., Graur O., 2017, ApJ, 848, 25
- Maoz & Mannucci (2012) Maoz D., Mannucci F., 2012, Publ. Astron. Soc. Australia, 29, 447
- Maoz et al. (2011) Maoz D., Mannucci F., Li W., Filippenko A. V., Della Valle M., Panagia N., 2011, MNRAS, 412, 1508
- Maoz et al. (2014) Maoz D., Mannucci F., Nelemans G., 2014, ARA&A, 52, 107
- Marigo (2001) Marigo P., 2001, A&A, 370, 194
- Matteucci & Greggio (1986) Matteucci F., Greggio L., 1986, A&A, 154, 279
- McGaugh et al. (2017) McGaugh S. S., Schombert J. M., Lelli F., 2017, ApJ, 851, 22
- Moe et al. (2019) Moe M., Kratter K. M., Badenes C., 2019, ApJ, 875, 61
- Muley et al. (2021) Muley D. A., Wheeler C. R., Hopkins P. F., Wetzel A., Emerick A., Kereš D., 2021, MNRAS, 508, 508
- Neill et al. (2006) Neill J. D., et al., 2006, AJ, 132, 1126
- Nomoto (1982) Nomoto K., 1982, ApJ, 253, 798
- Nomoto et al. (2006) Nomoto K., Tominaga N., Umeda H., Kobayashi C., Maeda K., 2006, Nuclear Phys. A, 777, 424
- Nugent et al. (2011) Nugent P. E., et al., 2011, Nature, 480, 344
- Peeples et al. (2019) Peeples M. S., et al., 2019, ApJ, 873, 129
- Pérez & Granger (2007) Pérez F., Granger B. E., 2007, Computing in Science and Engineering, 9, 21
- Phillips (1993) Phillips M. M., 1993, ApJ, 413, L105
- Planck Collaboration et al. (2018) Planck Collaboration et al., 2018, arXiv e-prints, p. arXiv:1807.06209
- Popesso et al. (2019) Popesso P., et al., 2019, MNRAS, 483, 3213
- Quimby (2006) Quimby R. M., 2006, PhD thesis, The University of Texas at Austin
- Quimby et al. (2012) Quimby R. M., Yuan F., Akerlof C., Wheeler J. C., Warren M. S., 2012, AJ, 144, 177
- Riess (2020) Riess A. G., 2020, Nature Reviews Physics, 2, 10
- Rosdahl et al. (2017) Rosdahl J., Schaye J., Dubois Y., Kimm T., Teyssier R., 2017, MNRAS, 466, 11
- Samuel et al. (2020) Samuel J., et al., 2020, MNRAS, 491, 1471
- Sánchez-Menguiano et al. (2019) Sánchez-Menguiano L., Sánchez Almeida J., Muñoz-Tuñón C., Sánchez S. F., Filho M., Hwang H.-C., Drory N., 2019, ApJ, 882, 9
- Santistevan et al. (2020) Santistevan I. B., Wetzel A., El-Badry K., Bland-Hawthorn J., Boylan-Kolchin M., Bailin J., Faucher-Giguère C.-A., Benincasa S., 2020, MNRAS, 497, 747
- Scannapieco & Bildsten (2005) Scannapieco E., Bildsten L., 2005, ApJ, 629, L85
- Scolnic (2013) Scolnic D. M., 2013, PhD thesis, The Johns Hopkins University
- Shappee et al. (2013) Shappee B. J., Stanek K. Z., Pogge R. W., Garnavich P. M., 2013, ApJ, 762, L5
- Shappee et al. (2018) Shappee B. J., Piro A. L., Stanek K. Z., Patel S. G., Margutti R. A., Lipunov V. M., Pogge R. W., 2018, ApJ, 855, 6
- Shen et al. (2012) Shen K. J., Bildsten L., Kasen D., Quataert E., 2012, ApJ, 748, 35
- Skillman et al. (2017) Skillman E. D., et al., 2017, ApJ, 837, 102
- Smith et al. (2012) Smith M., et al., 2012, ApJ, 755, 61
- Sparre et al. (2017) Sparre M., Hayward C. C., Feldmann R., Faucher-Giguère C.-A., Muratov A. L., Kereš D., Hopkins P. F., 2017, MNRAS, 466, 88
- Speagle et al. (2014) Speagle J. S., Steinhardt C. L., Capak P. L., Silverman J. D., 2014, ApJS, 214, 15
- Springel & Hernquist (2003) Springel V., Hernquist L., 2003, MNRAS, 339, 289
- Sullivan et al. (2006) Sullivan M., et al., 2006, ApJ, 648, 868
- Thompson (2011) Thompson T. A., 2011, ApJ, 741, 82
- Tremonti et al. (2004) Tremonti C. A., et al., 2004, ApJ, 613, 898
- Tucker et al. (2020) Tucker M. A., et al., 2020, MNRAS, 493, 1044
- Tutukov & Iungelson (1976) Tutukov A. V., Iungelson L. R., 1976, Astrofizika, 12, 521
- Tutukov & Yungelson (1979) Tutukov A. V., Yungelson L. R., 1979, Acta Astron., 29, 665
- Vargas et al. (2014) Vargas L. C., Geha M. C., Tollerud E. J., 2014, ApJ, 790, 73
- Virtanen et al. (2020) Virtanen P., et al., 2020, Nature Methods, 17, 261
- Wang & Han (2012) Wang B., Han Z., 2012, New Astron. Rev., 56, 122
- Webbink (1984) Webbink R. F., 1984, ApJ, 277, 355
- Weisz et al. (2014) Weisz D. R., Dolphin A. E., Skillman E. D., Holtzman J., Gilbert K. M., Dalcanton J. J., Williams B. F., 2014, ApJ, 789, 147
- Wetzel & Garrison-Kimmel (2020) Wetzel A., Garrison-Kimmel S., 2020, GizmoAnalysis: Read and analyze Gizmo simulations (ascl:2002.015)
- Wetzel et al. (2016) Wetzel A. R., Hopkins P. F., Kim J.-h., Faucher-Giguère C.-A., Kereš D., Quataert E., 2016, ApJ, 827, L23
- Wetzel et al. (2022) Wetzel A., et al., 2022, arXiv e-prints, p. arXiv:2202.06969
- Wheeler et al. (2019) Wheeler C., et al., 2019, MNRAS, 490, 4447
- Whelan & Iben (1973) Whelan J., Iben Icko J., 1973, ApJ, 186, 1007
- Whitaker et al. (2012) Whitaker K. E., van Dokkum P. G., Brammer G., Franx M., 2012, ApJ, 754, L29
- Wiersma et al. (2009) Wiersma R. P. C., Schaye J., Theuns T., Dalla Vecchia C., Tornatore L., 2009, MNRAS, 399, 574
- Wiseman et al. (2021) Wiseman P., et al., 2021, arXiv e-prints, p. arXiv:2105.11954
- Wyse et al. (2020) Wyse R. F. G., Moe M., Kratter K. M., 2020, MNRAS, 493, 6109
- van den Hoek & Groenewegen (1997) van den Hoek L. B., Groenewegen M. A. T., 1997, A&AS, 123, 305
Appendix A Sensitivity of Ia rates to stellar ages
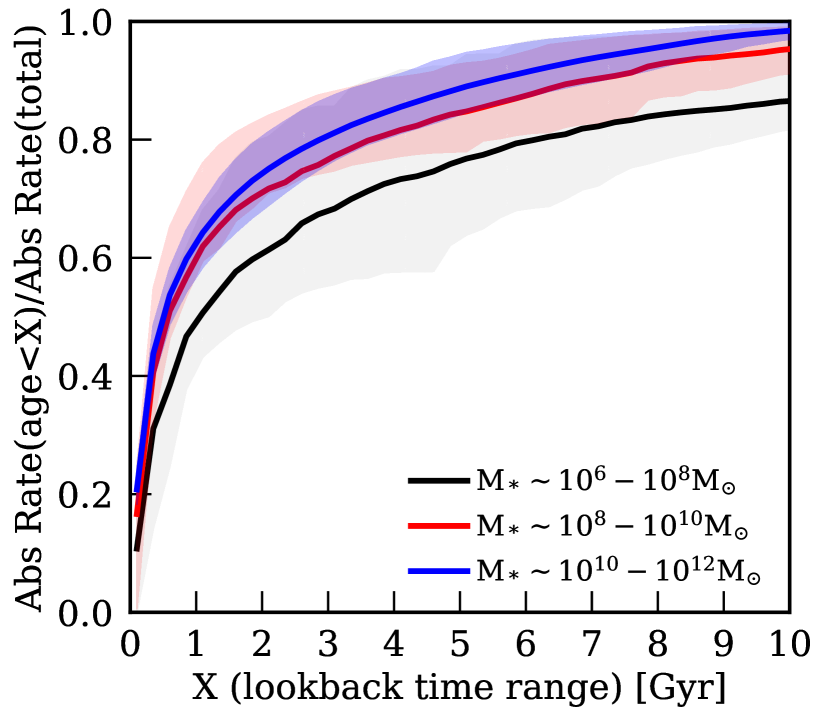
Here, we further explore the sensitivity of Ia rates on the galaxy SFH and ages of the stellar populations, using the Maoz & Graur (2017) DTD applied to our FIRE-2 galaxies. Figure 11 shows, for bins in present-day stellar mass, the cumulative contribution fraction to the total present-day Ia rate in our simulations from stellar populations younger than a given age (measured in lookback time from ). By considering only those stellar populations formed within different ranges in lookback time from present day, we compute the ratio of absolute Ia rates from the selected stars relative to the total Ia rate from all stars. Including only stellar populations formed within the last Gyr accounts for the majority of the present-day Ia rates across all galaxy masses that we examine.
Thus, for all star-forming galaxies and simulations in our analysis, the Ia rates are sensitive primarily to recent ( Gyr) star formation. This motivates why, in Section 2.2 and Appendix B, we benchmark our simulated SFHs to observational and semi-empirical results using metrics for only recent SFHs: the per cent stellar mass assembly timescales in Figure 12 and the star-formation rates at in Figure 1.
 |
Appendix B Additional benchmarks of simulated star formation histories
We present another benchmark of the SFHs of FIRE-2 simulations, especially for our lower-mass galaxies, beyond the sSFRs in Figure 1. We consider , the lookback time prior present day when a galaxy assembled per cent of its current stellar mass. For reference, for a simple flat SFH (constant SFR), per cent of the present-day Ia rate comes from stars that form after . Figure 12 shows for our fiducial suite of FIRE-2 galaxies. For comparison, we show values from observations compiled by Leitner (2012), the semi-empirical model UniverseMachine (UM; Behroozi et al., 2019), as well as those for Local Group galaxies (Weisz et al., 2014; Skillman et al., 2017). For galaxies with , we find good agreement to within between our simulations and observations. At higher masses, we find that FIRE-2 galaxies systematically form later than semi-empirical models would suggest, with disagreement. A previous comparison of stellar mass assembly of mass galaxies in FIRE in Santistevan et al. (2020) appears to show better agreement with the Leitner (2012) and UM trends, but we note that their comparison in their Figure 2 is in redshift space, which likely causes the discrepancy to appear smaller than it does in linear time units here.
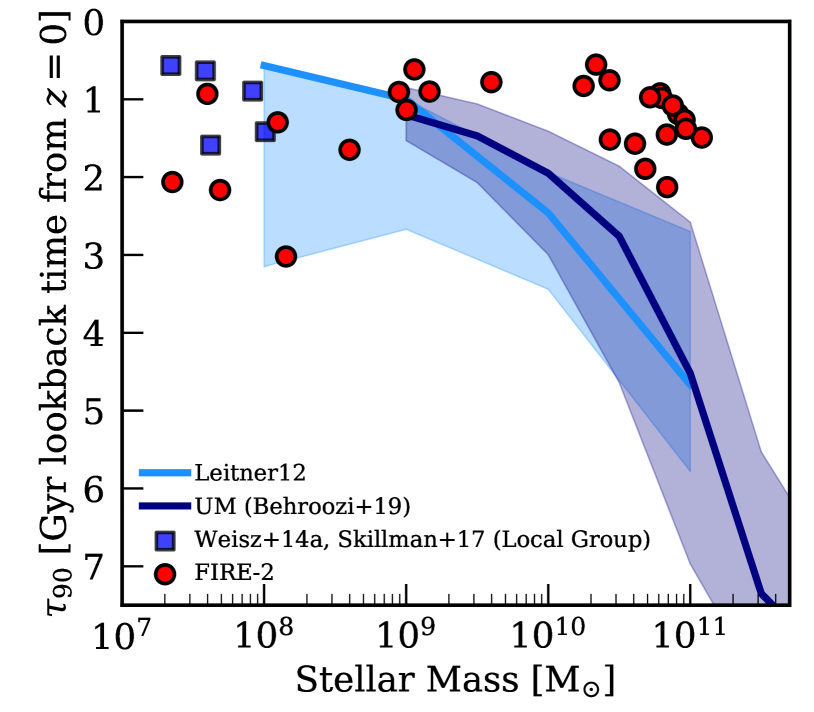 |
For higher mass galaxies, because Ia rates are primarily sensitive to a galaxy’s recent ( Gyr) star-formation, the sSFR comparison in Figure 1 is more relevant than . However, for , star formation on a slightly longer timescale matters, so this agreement of values with observations lends confidence to the Ia rates in our low-mass FIRE-2 galaxies - with the still important note of caution that our stellar mass dependence of both sSFR and specific Ia rates in FIRE-2 may be shallower than observed (as per Figures 1 and 4).