Dynamical friction in globular cluster-rich ultra-diffuse galaxies: the case of NGC5846-UDG1
Abstract
Ultra-diffuse galaxies that contain a large sample of globular clusters (GCs) offer an opportunity to test the predictions of galactic dynamics theory. NGC5846-UDG1 is an excellent example, with a high-quality sample of dozens of GC candidates. We show that the observed distribution of GCs in NGC5846-UDG1 is suggestive of mass segregation induced by gravitational dynamical friction. We present simple analytic calculations, backed by a series of numerical simulations, that naturally explain the observed present-day pattern of GC masses and radial positions. Subject to some assumptions on the GC population at birth, the analysis supports the possibility that NGC5846-UDG1 resides in a massive dark matter halo. This is an example for the use of GC-rich systems as dynamical (in addition to kinematical) tracers of dark matter.
1 Introduction
Dynamical processes shape galaxies and may provide constraints on the nature of dark matter (Binney & Tremaine, 2008). In particular, dynamical friction (Chandrasekhar, 1943) can significantly impact the orbits of globular clusters (GCs) near the center of massive galaxies (Tremaine et al., 1975) or in the halos of dwarf and ultra-diffuse galaxies (e.g. Tremaine, 1976; Sanchez-Salcedo et al., 2006; Nusser, 2018; Dutta Chowdhury et al., 2020). The Fornax dwarf satellite galaxy, hosting 5 or 6 GCs, is a well-studied test case where dynamical friction should have imprinted itself in the galaxy. Indeed, it was argued long ago that the lack of a nuclear star cluster in Fornax is surprising and perhaps poses a puzzle, because the dynamical friction time for GC orbits appears to be short compared with the age of the system (Tremaine, 1976). Several studies have revisited this “Fornax globular cluster timing problem”, primarily focusing on the possibility that the dark matter halo in Fornax is cored (Oh et al., 2000; Sanchez-Salcedo et al., 2006; Goerdt et al., 2006; Cole et al., 2012; Boldrini et al., 2020; Meadows et al., 2020; Shao et al., 2020; Bar et al., 2021). However, the number of GCs in Fornax, although large relative to other Milky Way dwarf satellites, may be too small to allow robust conclusions.
The potential to constrain dark matter via dynamical considerations motivates us to look for additional galaxies with a large population of GCs. This is timely in part due to recent studies of ultra-diffuse galaxies (UDGs) which often times host large numbers of GCs (van Dokkum et al., 2017, 2018; Lim et al., 2018; Shen et al., 2021). In this paper we consider NGC5846-UDG1 (UDG1 for short; Forbes et al. 2019, 2021; Müller et al. 2020, 2021; Danieli et al. 2022), that recently attracted considerable attention.111See also NGC1052-DF2, with spectroscopically-confirmed GCs, which was studied in Nusser (2018) and in Dutta Chowdhury et al. (2019, 2020). At a distance of Mpc, stellar luminosity of and half light radius kpc, UDG1 harbors some GC candidates, representing of the stellar mass at the preset day (Danieli et al., 2022).
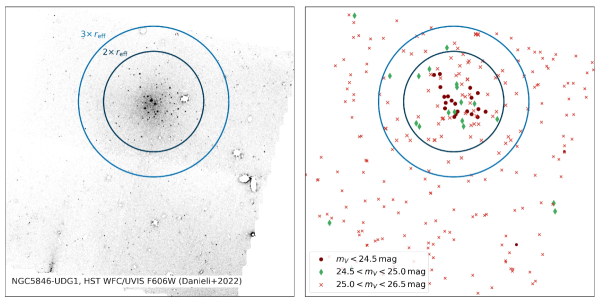
The left panel of Fig. 1 shows the -band Hubble Space Telescope (HST) WFC3/UVIS image of UDG1 and its nearby field, adapted from Danieli et al. (2022). The right panel shows all compact sources that were selected as GC candidates based on the photometric selection criteria in Danieli et al. (2022). In this work we focus on a low contamination sample of GC candidates, consisting of the 33 mag objects contained within (twice the Sérsic half-light radius of the stellar body; inner circle in Fig. 1), which has a background contamination of about object, estimated by comparison to the nearby field (Danieli et al., 2022). Spectrocscopic information is available for of these bright GCs (Müller et al., 2020).
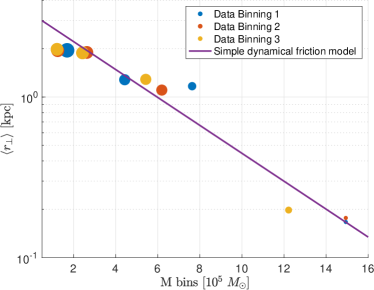
It is noteworthy that most of the brighter GCs in the right panel of Fig. 1 are concentrated in the region . To explore this further, in Fig. 2 we show the luminosity of this sample of GCs vs. their projected distance from the center of the galaxy. The data shows a clear trend: more luminous GCs are on average closer to the center of the galaxy. We estimate a p-value of about for the hypothesis that the data is a chance fluctuation and that there is no mass segregation (see App. A). This luminosity or mass segregation calls for a quantitative dynamical explanation.
In this paper we show that this explanation can be naturally provided by dynamical friction. The deceleration experienced by a GC due to dynamical friction in a galactic halo is roughly proportional to the GC mass . Therefore, more massive GCs inspiral closer to the center of the galaxy, resulting in mass segregation. This simple picture can be expected to hold over an intermediate duration of time: long enough to enable dynamical friction to act, but short enough so that GC mergers do not convert a large fraction of the total mass in GCs into a nuclear cluster. As we will demonstrate, using more detailed analytic estimates as well as a suite of numerical simulations, UDG1 as we view it today may indeed be in this intermediate stage.

The paper is organized as follows. In Sec. 2 we discuss dynamical effects that shape the GC population in UDG1 and similar galaxies. In Sec. 3 we recapitulate observational studies of UDG1, and define benchmark mass models. In Sec. 4 we set up and study N-body simulations, in which some dynamical effects (notably dynamical friction and GC mass loss) are modeled semi-analytically. In Sec. 5 we discuss the results. We conclude in Sec. 6.
We reserve some details to Appendices. In App. A we show the sensitivity of the results to GC selection criteria and the significance of the mass segregation trend. In App. B we derive two-body relaxation in an external potential. In App. C we discuss projection effects. In App. D we present a preliminary analysis of the faintest GC candidates in UDG1. In App. E we present a number of convergence and stability tests of the simulations.
2 Back of the envelope analytic estimates
The orbits of GCs traversing a background medium are processed by dynamical friction (DF; Chandrasekhar 1943). A convenient expression for the time-scale of dynamical friction is presented in Hui et al. (2017),
where is the density of the medium inducing the DF, is the GC mass, and is a dimensionless factor encoding the details of the velocity dispersion of the medium and a Coulomb logarithm. For some dwarf galaxies and UDGs, Gyr, meaning that DF should be effective over the life of the galaxy. This was noticed long ago for the Fornax dwarf spheroidal satellite galaxy (Tremaine, 1976) and more recently for NGC1052-DF2 (Nusser, 2018; Dutta Chowdhury et al., 2019)222See also Lotz et al. (2001) for a survey of GCs in dwarf elliptical galaxies in the Virgo cluster and Sánchez-Salcedo & Lora (2022) for an analysis of GCs in dwarf spheroidal and dwarf irregular galaxies..
UDG1 with its unusually large population of GCs is likely another system where DF is effective. The mass segregation observed in Fig. 2 can be interpreted as a natural outcome of DF, because of the dependence in Eq. (2) (neglecting logarithmic dependence on , sequestered in ). To illustrate how the scaling leads to mass segregation, consider a cored halo, for which is independent of radial position to leading order (Bar et al., 2021). In such a system, a GC on a circular orbit which starts its life at radius , migrates during time to a lower radius (Bar et al., 2021). Accounting for projection and averaging over a population of GC orbits (see Eq. (C1)), one finds
| (2) |
where angle brackets denote population average.
Assuming that the orbit distributions of GCs of different masses start with the same average initial radius, the simple model in Eq. (2) can be compared to data, with two free parameters: (i) the initial average projected radius, , and (ii) the core DF time measured in units of the age of the system, , computed for a reference GC mass .
In Fig. 3 we compare this model to the data from UDG1. We set kpc, somewhat larger than the observed stellar average projected radius kpc; and , with M⊙, amounting to
| (3) |
To convert from GC luminosity to mass, we assume a mass-to-light ratio M⊙, following Müller et al. (2020). The data in Fig. 3 is shown for three different choices of binning in 333The bin settings are: (1) , (2) , and (3) ..
In the rest of this section we discuss a number of additional effects that are, to some extent, intertwined with DF. These include gravitational GC-GC interactions; GC mergers; deformation of the background stellar and dark matter halo and dynamical heating by GCs; and GC mass loss. Some of these effects are interesting and could, under specific circumstances, modify the simple DF analysis. We will include a treatment of all of these effects in the numerical simulations described in Sec. 4.
2.1 Mergers of GCs
A large density of GCs could lead to a high rate of GC-GC mergers. A crude estimate of the merger rate per GC is
where is the number density of GCs and is the merger cross-section. Multiplying by the currently observed number of GCs yields mergers in UDG1.
The crude estimate above can be compared with results of numerical simulations performed in Dutta Chowdhury et al. (2020) for a different galaxy, NGC1052-DF2 (DF2). DF2 hosts a stellar core comparable to that of UDG1, but has only about a third of the number of GCs. Performing a simulation with “live” GCs (i.e. made of a collection of stars rather than a single object, so that GC collisions can be resolved in some detail), Dutta Chowdhury et al. (2020) found an average number of GC mergers in DF2, over Gyr, of about (at a rate of ). Since the number of mergers , this would be consistent with mergers in UDG1 over Gyr. We note however that Dutta Chowdhury et al. (2020) used the observed present-day distribution of GCs in DF2 as initial conditions for their simulations. Therefore, they simulated the future of the GC system, and since DF causes the GC distribution to converge inwards with time, it is likely that the (already small) reported merger efficiency was even smaller over a similar time scale in the past. In our work we will attempt to trace the history of the GC system in UDG1, so the initial conditions we select correspond to a GC system that is less dense than currently observed. Thus, the rate of mergers we find is indeed generically small.
In Sec. 4 we will discuss how we implement GC mergers in our simulations. We agree with the conclusions of Dutta Chowdhury et al. (2020) that DF enhances the GC merger rate, as an outcome of the increase of GC density with time.
It is tempting to speculate that the most luminous (and most centrally-located) GCs of UDG1 (see Fig. 2) could be the result of DF-induced mergers. A closely related hypothesis was brought up long ago in the context of nuclear clusters in other galaxies (Tremaine et al., 1975; Capuzzo-Dolcetta, 1993; Ostriker & Gnedin, 1997; Capuzzo-Dolcetta & Tesseri, 1997; Gnedin et al., 2014; Arca-Sedda & Capuzzo-Dolcetta, 2014a). We return to this possibility later on.
2.2 Mass loss of GCs
Old massive () GCs are expected to have lost a part of their mass over their life due to stellar evolution and dynamical processes (for a recent review, see Krumholz et al. (2019)). We estimate the importance of this effect for our analysis, adopting a phenomenological approach. We treat GCs as point masses, losing mass at a prescribed rate without modeling the “microphysics” of the process. As a benchmark, we adopt the mass loss rate from Shao et al. (2020) (c.f. Fig. C1 there).444Strictly speaking, the results there are reported around whereas our analysis extends to larger GC masses, which are expected to lose a smaller mass fraction. We neglect this complication in the following. With this prescription, GCs lose of their initial mass over a short interval in an early phase, followed by a intermediate phase of mass loss. The remainder is characterized by a slower steady mass loss of about of the GC mass (compared to the beginning of that last phase).
Assuming that dynamical relaxation time scales are longer than Gyr (although see Sec. 2.3 for possible exceptions), it is a reasonable approximation to simply consider the initial GC distribution to be defined after the first brief mass loss episode. Therefore, it seems reasonable to assume a mass loss rate of , i.e. with , Gyr. In a simplified model like that leading to Eq. (2), this can be roughly incorporated by using an “effective” GC mass , where is the currently observed GC mass (neglecting mergers). This amounts to an effective that is shorter compared to a naive expectation based on the currently observed GC masses. We thus expect that mass loss is not a crucial factor in the dynamics of UDG1. Nevertheless, for completeness, when we set up simulations in Sec. 4 we take this effect into account.
2.3 Relaxation of GCs between themselves
Two-body relaxation between stars or star clusters is typically thought to be unimportant on the scales of galaxies (Binney & Tremaine, 2008),555Except very near galactic centers or for some candidates of dark matter (Hernandez et al., 2004; Hui et al., 2017; Bar-Or et al., 2019). but diffuse galaxies with a rich GC population may present a counter-example. Assume GCs of equal masses spread over a radial scale with velocity scale , comprising a fraction of the total mass within (i.e. ). It is straightforward to extend classic arguments (Binney & Tremaine, 2008) to derive a two-body relaxation time scale (for details, see App. B)
where . Here, the reference value chosen for represents a somewhat extreme scenario in which the gravitational potential of UDG1 is dominated by the stellar mass. We note that the spectroscopic study of Forbes et al. (2021) reported a line-of-sight velocity dispersion km/sec, suggesting a dark matter-dominated halo and yielding a long two-body relaxation time-scale for GCs in UDG1.
Two-body relaxation of GCs assists DF in inducing mass segregation. In App. B we present an N-body simulation in a smooth external potential that demonstrates this effect.
As briefly reviewed in Sec. 2.2, GCs are expected to lose of their mass over their life. With this in mind, Danieli et al. (2022) pointed out that the GC population may have initially comprised an fraction of the stellar mass in UDG1. This scenario could make two-body relaxation surprisingly efficient, if, in addition, the total halo mass of (and therefore velocity dispersion in) UDG1 is small. To see this, note that inserting (à la the GC-dominance hypothesis of Danieli et al. (2022)) along with km/sec (low mass / no dark matter hypothesis) into Eq. (2.3) yields Gyr, a short relaxation time that could in principle affect the GC distribution at a noticeable level even during the brief initial mass loss phase of the GCs.666This scenario requires that most of the GCs were formed nearly at the same time, and no more than a few 100 Myr apart. If the halo is dark matter dominated (as supported by the spectroscopic study of Forbes et al. (2021)), then along with km/sec gives Gyr, making two-body relaxation relatively unimportant.
Put in a wider scope, these estimates suggest that there may be regions in “parameter space” of ultra-diffuse galaxies where two-body relaxation of GCs could be important.
Lastly, although we focused on the implications of two-body relaxation on the scale of an entire galaxy, the effect can manifest in part of a galaxy. Consider the possibility that GCs are driven by DF close the galactic center and stall there, e.g. due to core stalling (Read et al., 2006). Re-purposing Eq. (2.3) for this case, we find
| (6) |
Here values are motivated by UDG1, c.f. Sec. 3. The short relaxation time that we find suggests that even if DF becomes ineffective due to core stalling, mass segregation of GCs may proceed due to their N-body interaction, potentially allowing the formation of a nucleus.
3 Observational constraints and mass models of UDG1
In this section we summarize observational constraints on UDG1, and describe halo mass models that we will use in numerical simulations.
Similar to Danieli et al. (2022), we adopt a distance of Mpc to UDG1, based on the distance to the NGC5846 group, reported in Kourkchi & Tully (2017). Note that the association of UDG1 with the NGC5846 galaxy is not guaranteed and may perhaps be disfavoured from kinematical measurements; Forbes et al. (2021) reports a radial velocity km/sec to UDG1, whereas NGC5846 galaxy was measured at km/sec (Cappellari et al., 2011). A radial-velocity difference of km/sec is rather high for a satellite. We note that the trend seen in Fig. 2 is qualitatively insensitive to the distance estimate, although detailed constraints on the galaxy halo could be affected. For example, since and , within the scope of a simple analysis as in Fig. 3 we can estimate that a () uncertainty on yields an () uncertainty on the DF time-scale (with larger distances implying smaller DF).
The stellar luminosity was found to be well-described by a Sérsic profile with index , half-light radius kpc and luminosity (Danieli et al., 2022).
UDG1 was noted for its large GC content (Müller et al., 2021, 2020; Forbes et al., 2021). The highest quality photometric data of these GCs was obtained using 2-orbit WFC3/UVIS observations of the Hubble Space Telescope (Danieli et al., 2022). The compact objects catalog was processed into different populations corresponding to different selection criteria of magnitude, angular size, position and color. Here we primarily adopt the two sets in the magnitude range due to their high quality and low contamination (about expected object out of in , based on a nearby background field), c.f. right panel of Fig. 1. We note that our results are insensitive to the photometric selection criteria, as discussed at App. A.
At the faint end, , the catalog suffers larger contamination (about expected objects out of ). We refrain from using it in our main analysis, but note that it can be useful in principle within a more comprehensive statistical analysis. We show a preliminary analysis in App. D.
Spectroscopic studies of UDG1 have confirmed the membership of GCs in the galaxy (Müller et al., 2020; Forbes et al., 2021). Furthermore, Forbes et al. (2021) reported a GC line-of-sight velocity dispersion km/sec, implying that dynamics are dominated by dark matter. In what follows we describe two dark matter-dominated mass models that roughly saturate the reported from Forbes et al. (2021), and one mass model that neglects dark matter altogether.
-
Stars
A mass model following the observed stellar luminosity, adopting following Müller et al. (2020).
-
Burkert
A mass model following Burkert (1995), . We set kpc and . The value we adopt for allows us to test a profile that is significantly more massive than the Stars profile, yet sufficiently dilute to have Gyr. In addition, this value is consistent with a velocity dispersion km/sec reported in Forbes et al. (2021) (saturating the upper bound of Müller et al. (2020)).
- NFW
In Fig. 4 we show the density, line-of-sight velocity dispersion, DF time scale, and enclosed mass of the different mass models.
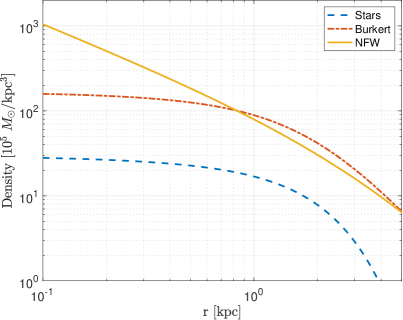


We can compare Fig. 3 to the DF time scale in the bottom-right of Fig. 4. None of the models have constant and as a function of radius, as assumed in the toy model of Sec. 2, but the cored models (Stars and Burkert) come close. All of the models predict significant DF over a 10 Gyr time scale, for GC orbits entering within a few kpc from the galaxy center.
4 Numerical simulations
Our goal in the simulations is twofold. First, we aim to test the possibility that the apparent mass segregation in UDG1 is due to DF. A central unknown in the problem is the initial distribution of GCs; our first task is to explore a range of initial conditions and see if a reasonable starting distribution can naturally evolve into the observed one. Second, provided that we can indeed identify reasonable initial conditions for the distribution of GCs, consistent with current observations, we also aim to examine whether the GC data can discriminate between different halo models.
Predicting the long term dynamics of a GC population in a galaxy like UDG1 would optimally involve direct integration of live GCs à la Dutta Chowdhury et al. (2020) with baryonic effects à la Shao et al. (2020) in high resolution models of galaxies à la Meadows et al. (2020). Here, we take a more modest approach, simulating the N-body dynamics of GCs in a smooth external gravitational potential, adding dynamical friction using a semi-analytic prescription (Petts et al., 2015; Bar et al., 2021).
4.1 Simulation description
4.1.1 Outline
Dynamics. We set-up an N-body simulation, where each body represents a GC with a Plummer softening of pc, i.e., the gravitational potential due to GC is . The background halos of stars and dark matter are modeled by a smooth and static profiles corresponding to the models in Sec. 3, such that the background gravitational acceleration is modeled as .
DF is implemented using a deceleration term . Specifically, we assume (corresponding to a Maxwellian velocity distribution), where and is the local velocity dispersion of the medium. The Coulomb logarithm is modeled following Bar et al. (2021), where in the Stars and Burkert cases we select , and for NFW with kpc. In both case we use in practice to regulate the logarithm when it becomes small and the treatment breaks down. As discussed in Bar et al. (2021), we can expect that the semi-analytic procedure captures the correct numerical value of to a factor of 2 or so.
As GCs inspiral inwards due to DF, some of their orbital energy is transferred to and heats the background medium. Accurate modeling of this effect requires simulations that resolve the particles of the medium, which is beyond the scope of this work. Instead, to roughly model this effect, we limit DF to radii where . At radii , where is defined by , we turn off the DF deceleration term. We update every Gyr. For cored profiles (Stars and Burkert) we turn DF off at to mimic core stalling (Read et al., 2006; Kaur & Sridhar, 2018; Meadows et al., 2020; Dutta Chowdhury et al., 2019).
We implement GC mergers using an effective merger criterion. The merger criterion we choose is the simultaneous fulfillment of the conditions and pc (c.f. Dutta Chowdhury et al. (2020)). Here, is the reduced mass of the GC pair, is the relative velocity, and is the relative potential. For point-like objects, . In general, . For Plummer spheres with softening parameter we find that provides a very good approximation, which we adopt in the simulations.
Upon a merger, we assign the new combined GC mass , velocity , and location . This corresponds to a linear momentum-conserving “sticking” of GCs. Energy is not conserved in this process: we neglect mass loss during the merger, thus energy must be transferred to the internal dynamics of the GC, which we do not model.
We approximate the process of continuous mass loss by decreasing GC masses in time steps of Gyr, following the mass loss trend described in Sec. 2.2.
Initial conditions. Simulated GCs start in random positions in an (on average) isotropic distribution. We test initial GC radial distributions which start-off as a Sérsic profile with different values of . For simplicity, throughout we retain , similar to the stellar distribution.
We initiate the GC velocity distribution such that the radial distribution would remain stationary in the absence of DF, mass loss, and mergers (Binney & Tremaine, 2008). Defining (where taken conventionally to asymptote to zero at ), the goal is to derive the distribution function based on the number-density profile of GCs , under a spherically-symmetric external potential , satisfying the Poisson equation for the halo’s mass density . We adopt a numerically-convenient expression for (Magni, 2015)
| (7) | |||||
For the density profiles that we use, the first two terms vanish, leaving
| (8) |
We track the system during a Gyr time period.
As discussed in the next subsection, we test different possibilities for the GC initial mass distribution. As a rule, we aim for an initial GC mass function that approximately matches the current GC mass function, accounting for mass loss.
Implementation. We implement the code in MATLAB using the ode45 solver, partially based on Pedcenko (2020). We use kpc-Gyr- units, for which and kpc/Gyr km/sec. We use a constant time-step of ( and being characteristic radius and velocity scales of the system). This amounts to Gyr.
Convergence. When DF, mergers, and mass loss are turned off, we find that energy is conserved to better than over Gyr.
Sensitivity to parameters. We tested the sensitivity of our results with respect to several parameters of the simulations, rerunning with (i) different Plummer softenings, and pc; (ii) different merger radii and pc; (iii) unrestricted DF, i.e. without turning off DF for and ; (iv) a higher central concentration initial GC distribution – with a Sérsic index of . In every case we retained all other parameters constant. We show the results in App. E. In general, we find that the choices of , and DF near the center do not appreciably impact the radial distribution of GCs. Mergers, however, do depend relatively strongly on the choice of these parameters – but still restricted to no more than few merger events per simulation ( mergers/GCs). In the simulation run with an initially higher central concentration GC distribution we find more mergers (/GC), without significantly altering our main results.
4.1.2 Method for comparing with observations
For each halo and initial GC distribution model, we run 40 simulation realizations. We then compute the average projected distance and the number of GCs in the final state, splitting the GC sample into mass bins. We report 68% confidence intervals for and ; these confidence intervals are dominated by the intrinsic randomness of the finite number of GCs per mass bin (we have verified that the averages and their confidence intervals are stable w.r.t. increasing the number of realizations per model). The predicted moments and can then be compared to the observed moments in the data. As noted in Sec. 3, we only use GC candidates at kpc, in order to minimize the background contamination from non-GCs sources.
We comment that when GC mergers are not important (average number of mergers per GC during 10 Gyr much smaller than unity), the variable simply reflects the observed current number of GCs per mass bin, and does not contain any additional information on the dynamics (apart, of course, from demonstrating the fact that mergers are not important).
5 Results and Discussion
5.1 Results: observed GC mass function as initial condition
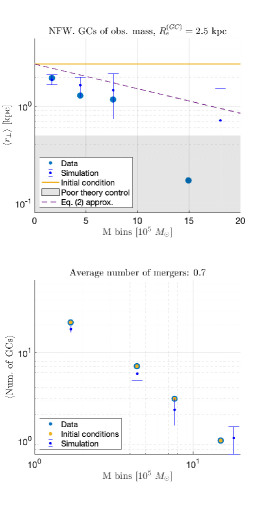
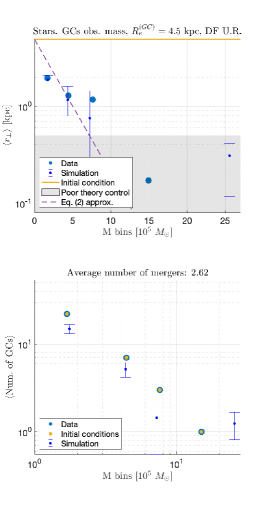
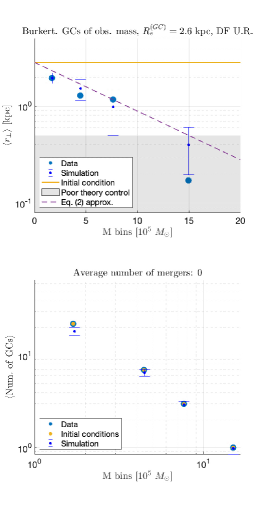
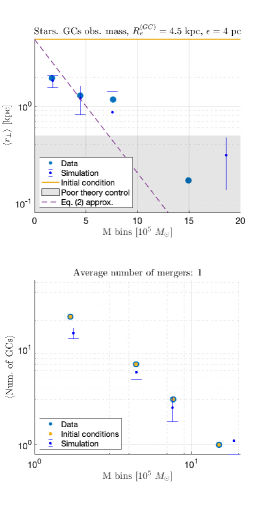
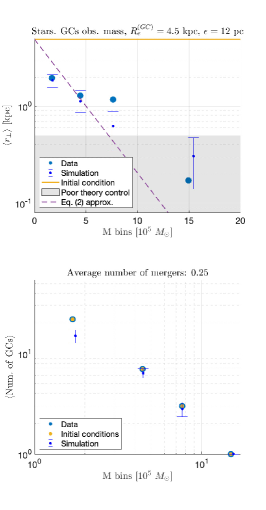
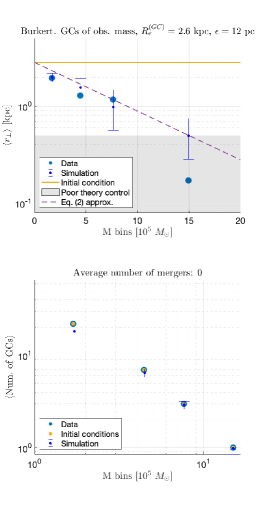
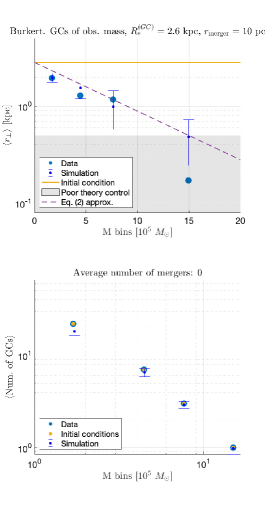
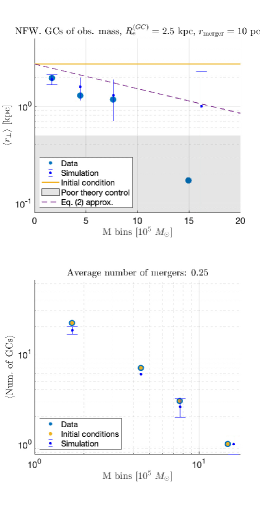
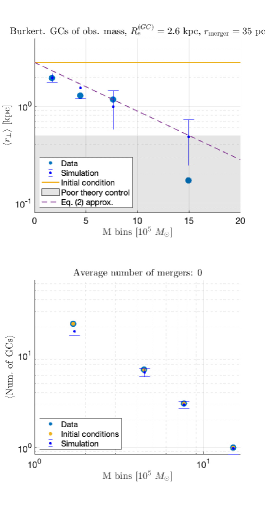
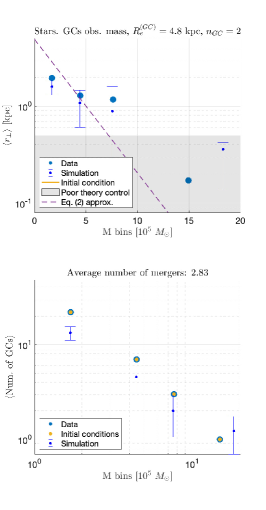
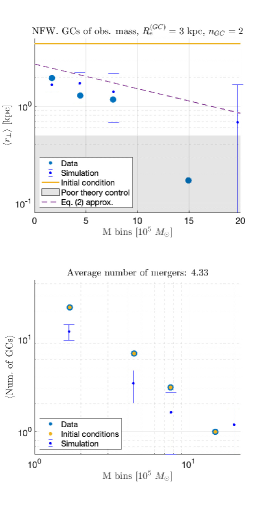
In this subsection we run the simulations with the observed GC mass distribution as an initial condition: that is, the initial set of GCs is chosen to be identical to the observed set (c.f. Fig. 2, correcting only for mass loss). Thus, apart from mergers and mass loss, the only difference between the initial set of GCs and the currently observed set, is the radial distribution. We seek approximate “best-fit” results for each halo model from Sec. 3, scanning the GCs initial radius and determining agreement with the data by eye. (A more elaborate optimization procedure does not change the results appreciably.) We show the results in Fig. 5. In all three models we find reasonable fits to the current GC radial distribution (top row).
The main result of the analysis are the Sérsic radii of the initial GC distribution. These values are indicated in the top row of Fig. 5 in the title and the horizontal orange line. For the Stars model, we find kpc, significantly more extended than the current distribution of the stellar body. For Burkert and NFW models we find and kpc, respectively, just mildly more extended than the stellar body of UDG1.
We also plot in the top row of Fig. 5 an adaptation of Eq. (2) corresponding to different models and initial conditions. We set the parameter as the initial average projected distance and the DF time parameter at a reference mass and the half-light radius of the stellar body (recall, the sample of GCs we work with is restricted to ). We see that Eq. (2) is a useful approximation, in reasonable agreement with the simulations.
In the bottom row of Fig. 5 we plot the average number of GCs per mass bin. We find a small number of mergers in all cases (indicated in the title of the figures). One may notice that even in the absence of mergers (in the Burkert case), the simulation prediction for the number of GCs can be smaller than the initial one. This is the result of masking out GCs at kpc when converting simulation results for comparison with observational data (we present “initial conditions” number without this cut).


5.2 Results: almost-as-observed GC mass function as initial condition
In this subsection we consider an initial set of GC masses that is slightly different than the observed set. This allows us to demonstrate two points. The first point is that a small deficit in the predicted number of GCs in the low- bins, as can be noted in the bottom row of Fig. 5, can easily be compensated for by a small increase in the assumed initial number of low mass GCs. The second point concerns the possibility that GC mergers – rather than pure DF – are the origin of the most massive few GCs in the observed set. We find that, within the limitations of our simulations, this formation channel for the single most massive GC may be feasible, although assessing its likelihood in detail is somewhat beyond the expected domain of validity of our method.
We perform this exploration using the NFW halo model. The initial set of GCs is chosen as follows. We break the most massive GC () into GCs, one with , and with . We also add light GCs with .
The result of this exercise is shown in Fig. 6. We find that: (i) The added low-mass GCs in the initial set bring the final set to perfect agreement with observations. (ii) The simulations do sometimes yield a sufficiently massive most-massive-GC, roughly consistent with observations, but this is not common, and happens in only about 20% of the runs. When the most-massive-GC is produced by a merger, then this merger is essentially always taking place between the second-most-massive GC in the initial state and one of the intermediate GCs.
Both (i) and (ii) above are consequences of the paucity of mergers observed in our simulations. Regarding the low mass GCs, we expect that the result is quite robust. Regarding the more massive GCs, since these migrate into the inner halo, where our treatment of DF becomes less trustworthy, it is plausible that our simulations underestimate the massive GC merger rate to some extent. A refined treatment of the dynamics in the inner few hundred pc of the system would be needed to clarify this issue.

5.3 Discussion
The main lesson that we draw from our analysis, analytical and numerical, is that DF provides a natural explanation for the apparent mass segregation of GCs in UDG1. The projected radial distribution obtained in the simulations is consistent with the trend (see Eq. (2) and Fig. 3). The slope and intercept of this trend are compatible with simple analytic estimates based on DF theory. The dark matter-dominated halo models are also consistent with independent constraints on the stellar velocity dispersion (Forbes et al., 2021), and suggest a reasonable initial condition for GCs that is only slightly more extended than the current observed stellar body.
We find a low merger rate, per 10 Gyr (i.e. per GC per 10 Gyr), for all of our halo models. Factors that may, in principle, relax this result include: (i) we “turn off” DF in the inner halo, below a radius defined as to guarantee . Dissipative effects below this radius ( kpc) are not modeled, and could induce more mergers; (ii) our merger criteria may be too strict. We test both of these factors in App. E, finding that the results remain fairly robust (especially for DM-dominated halo models) even when DF is kept “on” throughout the halo and when the merger criteria are varied.
The few mergers that are observed in the simulations often involve the most massive GCs, as these both have a larger intrinsic collision cross section and also settle into the inner halo such that their density is increased. Thus, the occasional mergers observed in the Stars and NFW halo models can slightly skew the initial mass distribution, and with a probability of the order of 20% could even account for the formation of the most massive GC in the sample through merger.
As a guide for numerical studies, it is possible to analytically estimate the mass of the nuclear cluster resulting from GC mergers in an NFW halo. Following Bar et al. (2021), we approximate , applicable for circular orbits with , and define , the radius below which GCs on circular orbits decay to the galactic center after time , . The nuclear cluster mass is then
| (9) |
where runs on GC mass bins, is the initial GC number density. Using this expression, we find for the NFW simulation in Fig. 5, consistent with the numerical results.
5.4 Caveats and questionable simplifications
Before we conclude, we would like to highlight a few possible caveats in our analysis.
-
1.
Use of semi-analytic description of dynamical friction. A semi-analytic description of DF has been shown to achieve reasonable agreement with dedicated simulations for a cuspy halo profile (Arca-Sedda & Capuzzo-Dolcetta, 2014b; Bar et al., 2021). However, the procedure may be less accurate for cored profiles. It is generally agreed that DF is suppressed near the center of a cored halo (Read et al., 2006; Cole et al., 2012; Kaur & Sridhar, 2018; Meadows et al., 2020). However, studies that employ direct numerical simulations do not agree on some details: Cole et al. (2012); Banik & van den Bosch (2021) report stalling and buoyancy effects at about the core radius, whereas Meadows et al. (2020) reports continued DF, consistent with constant , and broadly consistent with semi-analytic expectations (Petts et al., 2015; Bar et al., 2021).
-
2.
Merger prescription and tidal disruption. We neglected the internal dynamics of GCs in the treatment of mergers, and ignored GC tidal disruption by other GCs and by the host halo. Some support for this approximation comes from Dutta Chowdhury et al. (2020), that argued that in a similar setting (NGC1052-DF2) the tidal capture of GCs is not a dominant effect. It would be useful to repeat our calculations using simulations of live GCs, to resolve internal GC dynamics.
We note that disruption of GCs by the halo is unlikely to be important. For circular orbits near the center of a NFW profile, where the effect is most significant, the tidal radius is (Renaud et al. 2011; Orkney et al. 2019). We find for our NFW model , which is much larger than GCs sizes, even when evaluated at a very small radius, kpc.
-
3.
Mass to light ratio. We assumed a GC mass-to-light (M/L) ratio of , motivated by Müller et al. (2020) who reported this value, derived from the stacked measured spectra of GCs. Stacking aside, a GC-by-GC analysis suggests a small spread in the mass-to-light ratio (), laregly consistent with the uncertainty of the mass-to-light ratio for the stacked spectra (). Moreover, most of the GCs in the high quality sample that we analysed ( out of ) have no spectroscopic data, and thus no direct estimate. Nevertheless, their relatively uniform color (Danieli et al., 2022) suggests they are probably similar to the rest of GC sample.
A systematic uncertainty in the mass-to-light ratio (either GC-by-GC, or overall) would affect DF estimates, since .
-
4.
Initial conditions. Our exploration of possible initial conditions for the GC sample was rudimentary, and could be made more systematic. An essential part of the basic preference we find for DF obviously stems from our choice to initiate the GC sample with the same initial radial distribution across GC mass bins; one could, if one wanted, entertain the possibility that DF is ineffective in the system (some models of dark matter, for example, can effectively quench DF (Hui et al., 2017; Bar et al., 2021), and that for some reason, more massive GCs are preferentially formed deeper into the host halo compared to less massive GCs, in a formation pattern that mimics the natural expectations from DF. Indeed, galaxy formation simulations may indicate that more massive GCs form closer to the center of galaxies (Reina-Campos et al., 2021).
Another concrete example for a mechanism that could also induce GC mass segregation was briefly discussed in Sec. 2.3: if the total mass of UDG1 was dominated by GCs during a brief () early epoch before substantial GC mass loss took place, and under the (perhaps highly simplified) assumption that GCs formed at the same time, two-body relaxation of the GCs could have contributed to the mass segregation. This would essentially amount to mass segregation in initial conditions, since we do not attempt to model this epoch within our simulations.
We stress that the DF within our models is an irreducible effect. It should contribute to mass segregation also in the scenario of initial mass segregation. We note however that this expectation may spoil in the case of a high merger rate.
-
5.
Galaxy mergers. We did not consider the possibility that UDG1 has undergone mergers with other galaxies.
-
6.
Tidal stripping. Likely a member of NGC5846 galaxy group (Müller et al., 2020; Danieli et al., 2022), UDG1 may have been affected by tidal forces. Taking as a benchmark the near galaxy NGC5846 and the distance assumption of Mpc, the two galaxies are separated by projected distance kpc. Taking this as an estimate for the true distance between the galaxies, the tidal radius is
Here, the reference value for the mass of UDG1 is on the low side, neglecting any contribution from dark matter; thus, it is relevant for the Stars model. For the mass of NGC5846, we a used . We see that the GC initial condition found for the Stars model (half-mass radius of kpc) may indicate some level of inconsistency with the tidal radius estimate. The dark matter-dominated halo models (NFW and Burkert) seem conveniently compatible with the tidal radius – although the halos themselves may be somewhat affected by tidal stripping.
6 Summary
We have shown that the observed radial distribution of globular clusters (GCs) in NGC5846-UDG1 (UDG1) is suggestive of mass segregation. The mass segregation pattern can naturally be explained by dynamical friction (DF). While the basic imprint of DF appears clear, uncertainties on the initial distribution of GCs at formation complicate the task of drawing robust constraints on the dark matter content of the halo. Assuming that GCs form at a characteristic radius that is not widely different from that of the bulk of the stellar population (not in GCs), and that the characteristic GC formation radius does not depend on GC birth mass, the data provides dynamical support for a massive dark matter-dominated halo for UDG1. This demonstrates that dynamical arguments (and not only kinematics) can shed light on the distribution of dark matter in galaxies.
The dynamical preference for a massive halo can be further tested with kinematics data. Indeed, it is broadly consistent with existing kinematics results from Forbes et al. (2021).
Our study motivates, and can benefit from several technical improvements in the scope and detail of our numerical simulations, as noted in the main text. Input from the theory of the formation of GCs, their expected mass function at birth and their initial characteristic radial scale (especially in comparison with the main stellar system), could provide better-informed priors for the initial conditions, allowing the dynamics analysis to produce sharper constraints on the dark matter halo. Alternatively, a more detailed phenomenological scrutiny of GC initial conditions in UDG1 may be useful to inform GC formation theory, especially if combined with kinematics constraints.
More observational studies of UDG1-like galaxies, where GCs at various masses can be reliably identified and characterized, will play an important role in future work of this kind. The large sky coverage and point-source depth of the upcoming Vera Rubin Observatory Legacy Survey of Space and Time (LSST Science Collaboration et al., 2009) will enable mapping of GCs associated with low surface brightness galaxies in the nearby universe. Looking ahead, the Nancy Grace Roman Space Telescope (Spergel et al., 2015) will open an unprecedented window into studies of extragalactic GCs. Its wide-field imaging, high spatial resolution, and sensitivity will allow probing GCs below the turn-over magnitude across the sky and out to larger distances.
Appendix A Robustness of the GC sample and mass segregation
It is important to substantiate that our results are not sensitive to the photometric selection criteria of Danieli et al. (2022). Fig. 1 demonstrates that our sample ( mag) is expected to be contaminated by object at the low-luminosity end. Therefore contamination is very unlikely to change the results.
Another risk of using photometric selection criteria is the potential oversight of true GCs. To test this possibility, we re-examine the data presented in Danieli et al. (2022) by generously relaxing the selection criteria: changing the FWHM size and color from pix ( pix) and () for mag ( mag) to pix and . This new sample is shown in Fig. 7, after masking two bright objects whose spectroscopy suggests non-membership with UDG1 (Müller et al., 2020)777We thank Oliver Müller for help on this point.. Relaxing the selection criteria, new objects are added (whose would-be luminosities are estimated assuming distance to UDG1): (i) out of the are relatively faint objects at large radii, consistent with a contamination of objects by comparing to a nearby background field. (ii) A very red and bright object with a color of mag. It is suggestive to compare this to the spectroscopically-confirmed GCs (which have similar brightness) and are narrowly distributed at mag with a standard deviation of mag. Due to this large difference, we assume this object to be foreground. We note that it is difficult to substantiate spectroscopically as this object is very near on the sky to a very bright foreground star.
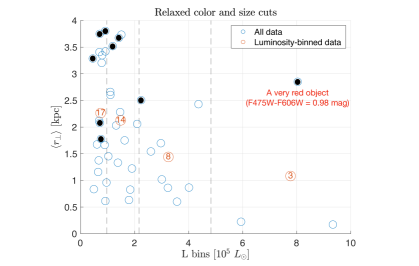
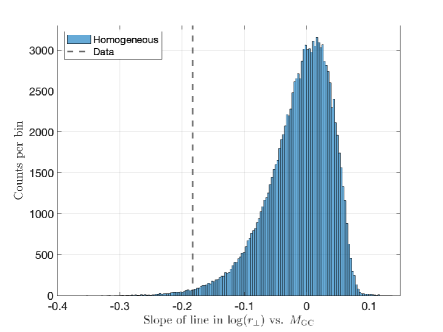
It is also important to quantify the significance of the mass segregation trend, argued in Fig. 2. To that end, we generate a mock sample of GCs from a common radial distribution – exactly like our simulations setup (Sec. 4). We carry out two exercises with this mock data. First (Fig. 8, left), we show an example of the radii of GCs vs. their mass, as in Fig. 5, showing that the no-mass-segregation hypothesis is not compatible with the data, in comparison to the models shown in the paper. Second, we define a test statistic that is a good proxy to mass segregation: the slope of the line in vs. . We show a histogram of this test statistic for the mock data. We estimate from this a p-value for the hypothesis that the data contains no mass segregation. These exercises support our claim of a mass segregation trend in the data of UDG1.
Appendix B Two-body relaxation of GCs in a background potential
The classic two-body relaxation time-scale of a self-gravitating system can be extended to the case of a N-body system in an external potential, following Binney & Tremaine (2008). Assume GCs, each with a mass spread along a characteristic radius with a characteristic velocity induced by a body of mass . The mean square change in velocity per crossing time is then
| (B1) |
Defining (likely for the example of UDG1) and using , with being the impact factor parameter where a mass is deflected by degrees, i.e. , one finds . We therefore obtain
| (B2) |
The relaxation time is
| (B3) |
where .
For a UDG with km/sec and kpc, Gyr, one finds
| (B4) |
(it is possible to replace , which changes dependencies on variables.)
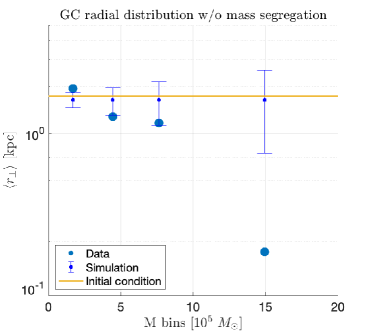
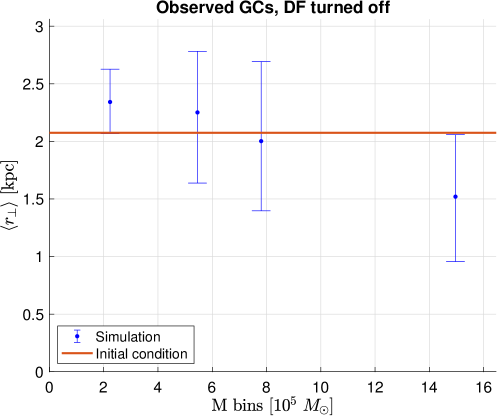
We find the interesting result that two-body relaxation of GCs is marginally effective in a galaxy such as NGC5846-UDG1, in the case where its dynamics is dominated by the observed stellar body. Indeed, we find support for these estimates in a N-body simulation where external dynamical friction is turned off, see Fig. 9. Unsurprisingly, more massive GCs sink to small radii whereas lighter GCs experience a “buoyancy”-like effect. This should be kept in mind: while lighter constituents (stars and dark matter) of the galaxy mostly operate as friction, the GC distribution works both as friction and as heating. Of course, this effect is only appreciable in light mass models such as the Stars model.
Appendix C Projection effects
The expectation value of the projected distances can be re-expressed as
| (C1) |
where we assumed spherical symmetry.
For a single GC, taking a circular orbit with radius for simplicity, the time-average expected projected radius is
| (C2) |
This is of course only a crude estimate. We may do better by using simulation data. Taking the last Gyr of and of different simulations and mass models, we find (subscript denotes averaging over time)
| (C3) |
Indeed, this agrees with the estimates used in the literature, e.g. and in Hui et al. (2017) and Meadows et al. (2020), respectively.
Appendix D Faintest objects set
Below a luminosity threshold corresponding magnitude , there is considerable contamination of other sources in the field of view of the galaxy (Danieli et al., 2022). In the selection criteria of Danieli et al. (2022), the lowest luminosity set contains objects, whereas a nearby background sample with times more area contains sources – or about objects per galactic-area, implying contamination in that low-luminosity set. In order to nevertheless extract information about the radial distribution of true GCs in this set, we first divide the galaxy into radial bins of area . When the background area , the expected background objects per bin is . Assuming the background is Poisson-distributed, we can estimate the true number of objects in a given bin. In the current work, we refrain from a full statistical analysis, which would require a more careful treatment and modeling of the statistical distribution of true GCs. Instead, we plot in Fig. 10 the data along with contamination per radial bin and demonstrate that a Sérsic profile in the ballpark of the Stars distribution is a good fit to the data.

Appendix E Further simulations
In this Appendix we demonstrate the sensitivity of our results in Fig. 5 under the change of several modelling choices that we made in Sec. 4. In Fig. 11 we show the simulations without the restriction of DF at and . Namely, in producing this plot, we let DF remain active throughout the halo. In Fig. 12 we show the results of simulations for different values of the GC Plummer softening parameter . In Fig. 13 we show the results of simulations for different values of the critical merger radius . In Fig. 14 we show the results of simulations for a more centrally-concentrated initial distribution of GCs, using a Sérsic index .


References
- Arca-Sedda & Capuzzo-Dolcetta (2014a) Arca-Sedda, M., & Capuzzo-Dolcetta, R. 2014a, Mon. Not. Roy. Astron. Soc., 444, 3738
- Arca-Sedda & Capuzzo-Dolcetta (2014b) —. 2014b, The Astrophysical Journal, 785, 51
- Banik & van den Bosch (2021) Banik, U., & van den Bosch, F. C. 2021, arXiv e-prints, arXiv:2112.06944
- Bar et al. (2021) Bar, N., Blas, D., Blum, K., & Kim, H. 2021, arXiv:2102.11522
- Bar-Or et al. (2019) Bar-Or, B., Fouvry, J.-B., & Tremaine, S. 2019, Astrophys. J., 871, 28
- Binney & Tremaine (2008) Binney, J., & Tremaine, S. 2008, Galactic Dynamics: Second Edition
- Boldrini et al. (2020) Boldrini, P., Mohayaee, R., & Silk, J. 2020, Monthly Notices of the Royal Astronomical Society, 492, 3169
- Burkert (1995) Burkert, A. 1995, The Astrophysical Journal Letters, 447, L25
- Cappellari et al. (2011) Cappellari, M., Emsellem, E., Krajnović, D., et al. 2011, Monthly Notices of the Royal Astronomical Society, 413, 813. https://doi.org/10.1111/j.1365-2966.2010.18174.x
- Capuzzo-Dolcetta (1993) Capuzzo-Dolcetta, R. 1993, The Astrophysical Journal, 415, 616
- Capuzzo-Dolcetta & Tesseri (1997) Capuzzo-Dolcetta, R., & Tesseri, A. 1997, Mon. Not. Roy. Astron. Soc., 292, 808
- Chandrasekhar (1943) Chandrasekhar, S. 1943, ApJ, 97, 255
- Cole et al. (2012) Cole, D. R., Dehnen, W., Read, J. I., & Wilkinson, M. I. 2012, Mon. Not. Roy. Astron. Soc., 426, 601
- Danieli et al. (2022) Danieli, S., van Dokkum, P., Trujillo-Gomez, S., et al. 2022, arXiv e-prints, arXiv:2111.14851
- Dutta Chowdhury et al. (2019) Dutta Chowdhury, D., van den Bosch, F. C., & van Dokkum, P. 2019, The Astrophysical Journal, 877, 133. http://dx.doi.org/10.3847/1538-4357/ab1be4
- Dutta Chowdhury et al. (2020) —. 2020, The Astrophysical Journal, 903, 149. http://dx.doi.org/10.3847/1538-4357/abb947
- Forbes et al. (2019) Forbes, D. A., Gannon, J., Couch, W. J., et al. 2019, A&A, 626, A66
- Forbes et al. (2021) Forbes, D. A., Gannon, J. S., Romanowsky, A. J., et al. 2021, Mon. Not. Roy. Astron. Soc., 500, 1279
- Gnedin et al. (2014) Gnedin, O. Y., Ostriker, J. P., & Tremaine, S. 2014, The Astrophysical Journal, 785, 71
- Goerdt et al. (2006) Goerdt, T., Moore, B., Read, J. I., Stadel, J., & Zemp, M. 2006, Mon. Not. Roy. Astron. Soc., 368, 1073
- Hernandez et al. (2004) Hernandez, X., Matos, T., Sussman, R. A., & Verbin, Y. 2004, Phys. Rev. D, 70, 043537
- Hui et al. (2017) Hui, L., Ostriker, J. P., Tremaine, S., & Witten, E. 2017, Phys. Rev., D95, 043541
- Kaur & Sridhar (2018) Kaur, K., & Sridhar, S. 2018, Astrophys. J., 868, 134
- Kourkchi & Tully (2017) Kourkchi, E., & Tully, R. B. 2017, ApJ, 843, 16
- Krumholz et al. (2019) Krumholz, M. R., McKee, C. F., & Bland-Hawthorn, J. 2019, Annual Review of Astronomy and Astrophysics, 57, 227–303. http://dx.doi.org/10.1146/annurev-astro-091918-104430
- Lim et al. (2018) Lim, S., Peng, E. W., Côté, P., et al. 2018, ApJ, 862, 82
- Lotz et al. (2001) Lotz, J. M., Telford, R., Ferguson, H. C., et al. 2001, Astrophys. J., 552, 572
- LSST Science Collaboration et al. (2009) LSST Science Collaboration, Abell, P. A., Allison, J., et al. 2009, arXiv e-prints, arXiv:0912.0201
- Magni (2015) Magni, S. 2015, PhD thesis
- Meadows et al. (2020) Meadows, N., Navarro, J. F., Santos-Santos, I., Benítez-Llambay, A., & Frenk, C. 2020, Mon. Not. Roy. Astron. Soc., 491, 3336
- Müller et al. (2020) Müller, O., Marleau, F. R., Duc, P.-A., et al. 2020, A&A, 640, A106
- Müller et al. (2021) Müller, O., Durrell, P. R., Marleau, F. R., et al. 2021, ApJ, 923, 9
- Navarro et al. (1997) Navarro, J. F., Frenk, C. S., & White, S. D. M. 1997, Astrophys. J., 490, 493
- Nusser (2018) Nusser, A. 2018, The Astrophysical Journal, 863, L17. http://dx.doi.org/10.3847/2041-8213/aad6ee
- Oh et al. (2000) Oh, K. S., Lin, D. N. C., & Richer, H. B. 2000, ApJ, 531, 727
- Orkney et al. (2019) Orkney, M. D. A., Read, J. I., Petts, J. A., & Gieles, M. 2019, Mon. Not. Roy. Astron. Soc., 488, 2977
- Ostriker & Gnedin (1997) Ostriker, J. P., & Gnedin, O. Y. 1997, The Astrophysical Journal, 487, 667
- Pedcenko (2020) Pedcenko, A. 2020, N-body simulation with ode45, ,
- Petts et al. (2015) Petts, J. A., Gualandris, A., & Read, J. I. 2015, Mon. Not. Roy. Astron. Soc., 454, 3778
- Read et al. (2006) Read, J. I., Goerdt, T., Moore, B., et al. 2006, Mon. Not. Roy. Astron. Soc., 373, 1451
- Reina-Campos et al. (2021) Reina-Campos, M., Trujillo-Gomez, S., Deason, A. J., et al. 2021, arXiv e-prints, arXiv:2106.07652
- Renaud et al. (2011) Renaud, F., Gieles, M., & Boily, C. M. 2011, Mon. Not. Roy. Astron. Soc., 418, 759
- Sánchez-Salcedo & Lora (2022) Sánchez-Salcedo, F. J., & Lora, V. 2022, MNRAS, 511, 1860
- Sanchez-Salcedo et al. (2006) Sanchez-Salcedo, F. J., Reyes-Iturbide, J., & Hernandez, X. 2006, Mon. Not. Roy. Astron. Soc., 370, 1829
- Shao et al. (2020) Shao, S., Cautun, M., Frenk, C. S., et al. 2020, arXiv:2012.08058
- Shen et al. (2021) Shen, Z., van Dokkum, P., & Danieli, S. 2021, ApJ, 909, 179
- Spergel et al. (2015) Spergel, D., Gehrels, N., Baltay, C., et al. 2015, arXiv e-prints, arXiv:1503.03757
- Tremaine (1976) Tremaine, S. 1976, The Astrophysical Journal, 203, 345
- Tremaine et al. (1975) Tremaine, S. D., Ostriker, J. P., & Spitzer, L., J. 1975, The Astrophysical Journal, 196, 407
- van Dokkum et al. (2017) van Dokkum, P., Abraham, R., Romanowsky, A. J., et al. 2017, ApJ, 844, L11
- van Dokkum et al. (2018) van Dokkum, P., Cohen, Y., Danieli, S., et al. 2018, ApJ, 856, L30