MIXING OF CONDENSABLE CONSTITUENTS WITH H-HE DURING THE FORMATION & EVOLUTION OF JUPITER
Abstract
Simulations of Jupiter’s formation are presented that incorporate mixing of H-He with denser material entering the planet as solids. Heavy compounds and gas mix substantially when the planet becomes roughly as massive as Earth, because incoming planetesimals can fully vaporize. Supersaturation of vaporized silicates causes the excess to sink as droplets, but water remains at higher altitudes. Because the mean molecular weight decreases rapidly outward, some of the compositional inhomogeneities produced during formation can survive for billions of years. After Gyr, our Jupiter model retains compositional gradients; proceeding outward one finds: i) an inner heavy-element core, the outer part derived from hot supersaturated rain-out; ii) a composition-gradient region, containing most of the heavy elements, where H-He abundance increases outward, reaching about mass fraction at of the radius, with silicates enhanced relative to water in the lower parts and depleted in the upper parts; iii) a uniform composition region (neglecting He immiscibility) that is enriched over protosolar and contains most of the planet’s mass; and iv) an outer region where cloud formation (condensation) of heavy constituents occurs. This radial compositional profile has heavy elements more broadly distributed than predicted by classical formation models, but less diluted than suggested by Juno-constrained gravity models. The compositional gradients in the region containing the bulk of the heavy elements prevent convection, in both our models and those fitting current gravity, resulting in a hot interior where much of the accretion energy remains trapped.
—
1 Introduction
Any attempt to explain Jupiter should aspire to be compatible with the current structure, the main features of which have been partially clarified by the Juno mission and are described by Stevenson (2020). Some aspects of that structure remain uncertain, but the key implication is the presence of perhaps twenty or thirty Earth masses () of heavy elements, denoted by (the mass fraction of everything other than hydrogen and helium), with some tendency toward a central concentration of . Instead of the old well-defined core picture ( for ; for ; with radius , Jupiter’s radius), new data suggest a “dilute” core (Wahl et al., 2017), perhaps with a large stable region where . Ring seismology suggests Saturn may also have a dilute core, probably with an analogous stable region (Mankovich & Fuller, 2021).
The substantial (factor of five or more) average enrichment in over the solar composition must arise from some aspect of the formation process, and the current distribution, , is presumably also affected by initial conditions as well as by any processes of redistribution after formation. The emphasis on is appropriate because its contributions are likely to arrive as condensed matter that is partially or totally decoupled from the gaseous nebula in which they form.
Re-assimilation of heavy elements into the gas phase within the planet (eventually a dense, hot fluid as the planet grows) can happen because of evaporation and mixing upon planetary assembly (Pollack et al., 1986). Our paper focuses on the existence and consequences of this possible mixing. Although less susceptible to observation, it is also of interest to quantify the fate of the different constituents: ice, silicates and iron. In particular, ice (H2O) has very different physical behavior than silicates or iron. Interior models based on gravity are insensitive to these distinctions, but the different contributions to may be separable in deep atmospheric observations and might affect the convective history.
Traditionally, planets were thought to separate into shells of iron, silicates and ice because these materials are mutually immiscible at relevant temperatures () and pressures (), and have very different densities. Current understanding implies otherwise: ice and rock can mix in all proportions at the relevant and (A. Vazan, 2022, personal communication), and even silicates and iron may mix to the atomic level above . This precludes the old, sharply defined layering, but the planetary growth simulations described in the present paper show that some differentiation can arise, at least between silicates and ices, simply because of the wildly different vaporization temperatures. An incoming planetesimal that is a mixture of ice and rock can break up and disseminate, with ice vaporizing when its surface temperature is around –, while rock can only substantially vaporize for surface temperatures around –. In both cases, the ambient hydrogen-dominated atmosphere may oversaturate with the excess condensable material raining out as liquid droplets, but with the vapor loading of the surrounding gas being much higher in ice than in rock high up, and the rock vapor loading increasing deeper down. In both regions, and are low enough that mixing of ice and rock, thermodynamically favored at greater depths, is not relevant. In short, ice and rock partially separate, not for the old reason (immiscibility) but because of the very different vaporization properties. The density differences are not directly relevant but become important in stabilization because the deeper vaporization occurs in the denser constituent. The result is a diffuse boundary between water and rock that can inhibit convection, with the observable atmosphere being enriched by the vaporized ices especially.
A successful Jupiter model should also explain the observed atmospheric abundances, the planetary heat flow and the magnetic field. We are particularly concerned with the first of these here, since it may be related to the assumed accretion history, or even to the delivery of material from deep down to the outer layers of the planet. However, our goal is not to compete with detailed models for the gravity and magnetic fields, but rather to identify possible evolutionary stories leading to structures that are broadly compatible with data. We note that heat flow is not a good way of deciding whether the interior is hotter than in fully adiabatic models, since most of the heat from Jupiter is emitted early and the current luminosity multiplied by the age of Jupiter is small relative to the heat content at the onset of the final cooling phase.
1.1 Basic Formation Mechanisms
In early work on Jupiter’s formation, two main ideas were followed. The first assumed that Jupiter formation was analogous to the formation of stars by gravitational (Jeans) instability (see Boss, 2019, and references therein). This approach is not currently favored and appears to have multiple problems, both for the planets in our solar system and for the vast majority of known exoplanets. The most frequently stated difficulty lies in the presence of at abundances and spatial distributions that seem incompatible with the simple Jeans picture; indeed this is why Perri & Cameron (1974) abandoned it in favor of core accretion, described below. There are also theoretical concerns that center around the tendency for disks to redistribute material by gravitational torques before the needed instability is reached.
We focus instead on the widely favored and more likely scenario in which the formation of Jupiter (and giant planets in general) is accomplished by first forming a core of heavy elements, embedded within a gaseous nebula, and followed by accumulation of gas. The accretion of gas and solids is actually concurrent, but initially solids dominate, whereas later gas is accreted at a much larger rate than are solids. This gas accretion is limited by the disk at some point, and eventually stopped by a combination of gap formation and the dispersal of the gaseous component of the protoplanetary disk.
Even in the core accretion scenario, there was still the notion of a possible gravitational instability or equivalently a “critical” core mass (Perri & Cameron, 1974; Mizuno, 1980; Stevenson, 1982; Bodenheimer & Pollack, 1986; Wuchterl, 1993), but there was no fully consistent approach to the concurrent accretion of solids and gas until the seminal work of Pollack et al. (1996). They found that the accumulation of a massive envelope was mediated by the need for the envelope to lose heat. An important consequence is the absence of a well-defined critical mass, although it is still true that core mass and elapsed time determine the ability of the gas envelope to grow, so a core of order is still a relevant goal.
1.2 Formation Phases
This led to a picture, still presumed to be largely correct, in which Jupiter’s formation is divided into three phases, as identified in Pollack et al. (1996), here extended to five. In Phase I, solids accretion exceeds that of H-He, hence the accreting body is high , except for the very low mass H-He gas envelope that surrounds it. This phase proceeds to a mass of at least several Earth masses. The surface density of solids within the nebula and the opacity of the forming envelope are important quantities. For realistic timescales of Phase I (– years), the gaseous envelope around this embryo is set by the assumed hydrostatic equilibrium from the embryo surface out to some fraction of the Hill or Bondi sphere (connecting to the surrounding nebula). In Phase II, when gas accretion is larger than solids accretion, the supply of material is much diminished, because the zone providing accretion is largely depleted. Gas continues to accumulate, mediated by the cooling of the planet and the continued presence of a nearly hydrostatic equilibrium extending out to the nebula. Phase III begins when the accreted mass of H-He gas equals the mass within the planet, and the hydrostatic structure may be greatly affected by the very compressible gaseous envelope. For a gas-dominated planet like Jupiter, this phase ends when the planet’s ability to acquire H-He exceeds what the surrounding disk can supply. The planet then enters Phase IV of disk-limited accretion in which planet growth is dictated by disk thermodynamics. Such a limit was hypothesized by Pollack et al. (1996), but not included in formation models in a self-consistent manner until the work of Lissauer et al. (2009). A surface shock may form at this stage as the planet detaches from the nebula. The final mass, , is reached in this phase and arises from processes that are not intrinsic to the planet, e.g., gap formation by disk-planet tidal interactions and the exhaustion of the accessible gas in the neighboring nebula. This general picture can be augmented by later accretion of solids, referred to here as Phase V, in order to explain the observed atmospheric enrichment of perhaps a factor of three over solar (Owen & Encrenaz, 2003).
1.3 Objective of the Calculations
The pioneering (and much subsequent) work on this picture omits consideration on the dissolution of solids in the envelope, and this is the first attempt to look in detail at how Jupiter’s structure is changed by a more realistic picture for the incoming material. Bodenheimer et al. (2018) consider many of the same issues, but for the simpler case in which ice is absent, motivated by the presence of light-gas envelopes of many exoplanets orbiting well interior to the ice condensation zone.
This study forms a counterpart to the simplest extreme for Jupiter, which assumes that infalling solids reach a condensed core, although all the energy of that infall is imparted to the gas. It is natural to suppose that we can thereby reconcile the “dilute” core (the current state of Jupiter) with formation models. Alas, it would appear that the story is not so simple because the models described here only go part way: They eliminate the sharply defined core of almost all previous models of Jupiter’s growth, but nonetheless produce a much more confined central region of nearly pure heavy elements than Jupiter’s interior models seem to favor. This conundrum (see also, e.g., Müller et al., 2020) does not at present have an explanation. Possible reconciliations include alternative accretion histories (e.g., Alibert et al., 2018), a failure to consider fully the post-formation convective mixing, and the possible effects of “giant impacts” (e.g., Liu et al., 2019). Meteoritic evidence (Kruijer et al., 2017) is compatible with the general story of formation described here.
1.4 Miscibility and Stability
These models ignore the late-stage onset of helium rain, the existence of which is not in doubt (because of Galileo probe measurements), and the consequences of which are mildly important for the modeling of current gravity. The motivations for this choice are twofold. First, it is not at all relevant to the epoch of planetary accretion that is the focus of this paper. Second, and perhaps less obviously, we know of no reason why the onset of helium rain would have major consequences for the distribution of (even though we are aware of studies that presume this to be possible).
We expect that is related to the formation process and that incoming solids are reassimilated rather than reaching a core intact for the following reasons. Once a significant mass (of order one Earth mass) is reached, incoming planetesimals can disaggregate into small particles because the ram pressure of the gas can exceed the compressive strength of the incoming body, much like for the Tunguska event in 1908. This material can rapidly vaporize, leading to a picture in which the mass of added solids relative to the concurring accretion of gas defines the mass fraction of heavy elements (Helled & Stevenson, 2017). Actually, our models suggest supersaturation and rain-out of excess condensate (silicate or water) as droplets, which reassimilate at greater depth as supercritical (single phase) fluid. The high temperature and increasing pressure ensure that there is no phase separation into immiscible layers, as is thermodynamically predicted for the formation of Earth (Stevenson, 1990). In this sense, “core” formation in Jupiter is conceptually different from core formation in terrestrial planets, because the latter depends on immiscibility. At later times, when the relevant hydrogen is cooler but metallic, miscibility is predicted by quantum mechanics (Wilson & Militzer, 2012).
The higher density of material relative to hydrogen is not relevant to the subsequent evolution except through its effect on convective vigor. In the presence of a pressure gradient (provided by gravity in this instance), a static fluid of different constituents can separate diffusively (barodiffusion), but the consequences of this process are small even for the age of the universe, for any mixture of interest. Accordingly, when we see that deep within in Jupiter, we must attribute this to something that happened in the delivery process and not to something that is ordained by mere consideration of thermodynamics and gravity. Moreover, a stable compositional gradient () can have profound consequences for the thermal evolution of the body, especially if that body is mostly degenerate (, where is the coefficient of thermal expansion). The reason is that a modest compositional gradient can suppress convection. For example, a doubling of the temperature deep down, say from to , can be stabilized by increasing by . There are many factors that affect the formation of Jupiter, and we focus on only one in this paper but, clearly, the magnitude and shape of are diagnostic, particularly since we seek to understand the origin of our solar system.
2 Methods
The basic procedure is the solution of the standard differential equations of stellar structure in spherical symmetry: mass conservation, hydrostatic equilibrium, energy conservation, and energy transport by radiation, convection or conduction (Henyey et al., 1964; Kippenhahn & Weigert, 1990). Extensive modifications of the physics to treat the planetary case include: i) accounting for the mass and energy deposition caused by accretion of solids and gases from the primordial accretion disk; ii) including equations of state of material rich in heavy elements, such as water vapor and silicate vapor; iii) inclusion of dust grains in the calculation of radiative opacity; iv) allowance for a central core composed entirely of heavy elements; v) accounting for the ablation and breakup of solid material (planetesimals) as it passes through the gaseous envelope of the planet; vi) treatment of gradients in chemical composition that affect the convective transfer of material and energy; vii) allowing for the effects of the central star in heating the planet and driving mass loss from it; and viii) including aspects of the physics of the protoplanetary disk that affect accretion onto the planet.
The treatments of many of these effects are discussed in previous papers. Pollack et al. (1996) and D’Angelo et al. (2014) summarize the interaction of accreting planetesimals with the gaseous envelope, including ablation, breakup, determination of the capture radius of the planet, and energy deposition. Bodenheimer et al. (2018) discuss the effects of composition gradients in the heavy elements, which can suppress the efficiency of convective transfer; they also summarize the main points regarding the equation of state and opacity, as well as the effects of the central star. Lissauer et al. (2009) describe three-dimensional hydrodynamic simulations of disk gas surrounding a forming planet. These simulations determine, first, an outer boundary condition on the planet, and, second, the maximum rate at which the disk can supply gas to the planet, as a function of planet mass, the “unperturbed” (in the absence of gravitational perturbations from the planet) surface mass density of the disk in the vicinity of the planet, and disk viscosity. Once this limiting rate is reached, the planet contracts and hydrodynamic flow onto it from the disk occurs. The disk physics involved, and the accretion rates of gas and solids that are derived, are further discussed in Bodenheimer et al. (2013) and D’Angelo et al. (2021).
2.1 Planetesimal Dissolution
In the present work, Jupiter, forming at , accretes planetesimals composed of water ice and rock (silicates, SiO2), assumed to have equal mass fractions. In Pollack et al. (1996) and D’Angelo et al. (2014) the interaction of the accreting planetesimals and the gaseous envelope is described in detail. The trajectories of planetesimals coming in at various impact parameters are integrated, taking into account gravity and gas drag. Along the trajectories, planetesimals lose mass by ablation, and when the dynamical pressure on a planetesimal exceeds its compressive strength, it breaks up if the effects of self-gravity are overcome. The results from the various impact parameters are averaged to give the profiles of added mass and energy with radius. In the cited works, the deposited mass sinks to the core (a well-defined entity under those assumptions), releasing gravitational energy on the way. In contrast, in the present calculations mass and energy deposited by ablation and breakup can remain local.
As discussed in more detail in Bodenheimer et al. (2018), once vaporized at a given layer, the partial pressure of a given substance is compared with the vapor pressure of the substance. If , the excess material above sinks (rains out) to a level where the temperature allows the two quantities to be equal. For water and silicates, respectively, the vapor pressures are
| (1) | |||||
| (2) |
where the temperature is in degrees kelvin and the pressure in . In Equations (1) and (2), represents the temperature at the surface of accreted solids, for the calculation of ablation, and the temperature of the ambient gas for the calculation of rain out. Equation (1) is taken from Iaroslavitz & Podolak (2007), whereas Equation (2) is based on a numerical fit to data from Melosh (2007). Above the critical temperature, and for water and rock, respectively, is set to infinity. Water vapor and rock vapor are treated independently. Although these equations and assumptions are approximate, we do not expect our main results to be sensitive to their deficiencies at very high .
2.2 Equation of State
The equation of state of the gaseous envelope is obtained from Saumon et al. (1995) for the case of solar-abundance gas, which applies in the outer part of the envelope. The composition of this gas assumes (mass fraction of H), (mass fraction of He), and (mass fraction of all other elements). For hydrogen/helium gas mixed with rock and/or water vapor, tables are obtained based on the quotidian equation of state of More et al. (1988), as extended by Vazan et al. (2013). Separate tables exist for water vapor and silicate vapor. In each case, sub-tables contain the heavy material mixed with various mass fractions of hydrogen/helium gas, with fractions ranging from to . If silicates and water are both present at a given layer, the equation of state interpolates between the two tables, each table weighted by the mass fraction of the corresponding species. The inputs to the equation-of-state tables are the density, temperature, and composition at the local position. The tables provide pressure, specific internal energy, and adiabatic gradient, which are needed for the solution of the structure equations.
2.3 Energy Transport
During the principal epoch of formation (Phases I-IV), the outer layers of the model planet are characterized by energy transport by radiation. These layers have close to solar (nebular) composition, and the main source of opacity is dust grains, which enter the planet along with the nebular gas. The grains are assumed to have a size distribution ranging from to . Details on the grain opacity appear in D’Angelo & Bodenheimer (2016) and are based on tables calculated by D’Angelo & Bodenheimer (2013). In the outer regions of the planet, where grains are present, these opacities are roughly four times as large as those of Movshovitz et al. (2010), who considered grain sizes and included coagulation. As one proceeds inward in the model, the composition becomes richer in heavy elements, and the opacity increases rapidly; the references for the opacity calculation are given in Bodenheimer et al. (2018). Thus, the inner region of the planet with heavy element mass fraction , becomes unstable to convection according to the Schwarzschild criterion (e.g., Kippenhahn & Weigert, 1990). During the final phases of planetary evolution, after accretion stops, the outer part of the planet, with composition close to solar, is also convectively unstable, except for a thin radiative layer at the outer edge. During these phases, the grains are assumed to sink and evaporate, and the radiative opacity is dominated by molecular sources (Freedman et al., 2014).
The region with a molecular weight gradient suppresses ordinary convection, as discussed in Bodenheimer et al. (2018). It is possible (though not mandatory) that “semiconvection” (often referred to as double-diffusive convection) can arise because the diffusion of heat (mediated by electrons) can be much faster than the diffusion of molecular species. Such mixing would tend to smooth out a compositional gradient and make the core more dilute as in Leconte & Chabrier (2012). However, this kind of convection is driven by heat from below only (most of Jupiter’s luminosity is driven by cooling from above), and such heat flow is necessarily small since that region is of small mass and low specific heat (hence low heat content, despite its high temperature). This is a very different situation from that discussed by Leconte & Chabrier (2012), where they assumed substantial dispersal of heavy elements in their initial conditions. It is irrelevant that this convection can operate post-formation for billions of years since its consequences are limited by the small total heat content in the central region. Quantitative details are described in Helled at al. (2022). To give a specific example, the thermal energy released by a core of heavy elements that has cooled by is a factor of several less than the gravitational work that would be needed to disperse such a core in Jupiter, even ignoring the inefficiency of double diffusion. We conclude that it is reasonable to exclude this type of convection in the calculations. The issues this raises are discussed further in the concluding section.
When energy transport by convection is suppressed, the calculations assume transport at a much reduced rate by radiation. The appropriate temperature gradient, which determines the radiative flux, is very uncertain. It is parameterized here by a fraction (typically %) of that given by the Ledoux criterion for convection in the presence of a gradient in mean molecular weight (e.g., Equations (4) and (5) of Bodenheimer et al., 2018). The suppression of convection would tend to trap heat in the region of the planet interior to the composition gradient, and lead to a situation where the rate of energy deposition by the incoming planetesimals is considerably greater than the energy radiated by the planet. However, the significance of this effect depends on where the planetesimals break up and deposit their energy relative to the location of the composition gradient. If the energy is deposited primarily exterior to the gradient, there is practically no effect.
2.4 Assumed Parameters
The parameters of the calculation are similar to those used in Pollack et al. (1996) and Lissauer et al. (2009). Jupiter forms at in a nebula whose initial solid surface density is at heliocentric distance . The rock/ice planetesimals all have a radius of , and they accrete on to the planet at the rate given by Safronov’s (1972) equation (e.g., Bodenheimer et al., 2018, Equation (2)), applying the gravitational enhancement factor of Greenzweig & Lissauer (1992). The assumption of a fixed size is of course a crude approximation and doubtless has some effect on the results, though the tendency for the atmosphere to supersaturate and rain out the excess heavy elements should occur irrespective of this assumption.
During Phases I-III of formation, the outer boundary condition on the planet assumes a nebular temperature of and a density of . The outer radius of the planet is set, for almost all of the formation phase, to , where is the planet’s Hill radius, as determined by three-dimensional hydrodynamic simulations (Lissauer et al., 2009). If the Bondi radius , where is the sound speed in the disk (at ) and is the planet mass, is smaller than , then . During Phases I through III, the gas accretion rate is determined by the requirement that (so increases as grows). However, once disk-limited accretion (Phase IV) is reached, contracts within and the planet “detaches” from the disk. The temperature and density at are determined, approximately, by the procedure of Bodenheimer et al. (2000), which takes into account the shock that forms at the outer boundary of the hydrostatic planet. Gas and solid accretion rates during this phase are calculated according to the method described in D’Angelo et al. (2021), and additional details are provided below.
The planet does not migrate through the disk and reaches Jupiter’s mass () at the time of the dissipation of the disk at Jupiter’s orbital radius, years in the model, or at the end of Phase V, if applicable. The gas dissipation time depends on the applied disk model during Phase IV.
During the ensuing evolution phase, the planet contracts and cools as a quasi-isolated object, apart from accreting planetesimals at the rate of for the first ten million years. This additional accretion is added to our model in order to account for collisions with small solid bodies that continued to approach the planet subsequent to the dissipation of the gaseous disk and to attempt to explain the observed heavy-element enrichment of the atmosphere. Heating from the central Sun is included in the radiative boundary condition according to Equations (2) through (5) of D’Angelo & Bodenheimer (2016). The equilibrium temperature is set to either , based upon Pioneer and Voyager 1 data (Hanel et al., 2003) or , based on more recent Cassini data (Li et al., 2018). As discussed in the previous section, composition gradients in the planet’s interior are maintained during this phase.
2.5 Accretion of Solids During Phase IV
As the planet evolves through Phase II and III, accretion of solids tends to deplete a region, the “feeding zone”, of half-width along its orbit, so that the amount of heavy elements in the planet is and is between and . This estimate assumes that there is no significant re-supply of solids to the region and that depletion only takes place because of accretion on the planet. However, other processes, such as gravitational scattering, drag forces, and interactions among the solids can affect the delivery of solids.
Once the planet mass exceeds , it is assumed that grows only through the expansion of the feeding zone into an undepleted swarm of planetesimals. Therefore, the accretion rate of solids is tied to the total accretion rate of the planet
| (3) |
where . The effects of nearby planets and competing embryos, which can reduce the supply of solids, are not taken into account. It should be noted that, according to Equation (3), the ratio of the accretion of heavy to light elements decreases as increases:
| (4) |
The ratio is linear in the quantity , which is not generally a constant but it may depend on several factors, including planet mass and gas drag (e.g., solids’ size, see D’Angelo & Podolak, 2015).
In applying Equation (3), the rate of accretion can be connected to that calculated in the prior stages of evolution by using the ratio computed in the model (at ).
2.6 Gas Accretion During Phase IV
Observations of pre-main sequence stars indicate that -old, stars accrete gas at rates on order of a few to several times , or (e.g., De Marchi et al., 2017, and references therein). During Phase III, rapid contraction of the planet may lead to accretion rates in excess of these values. Therefore, may become limited by disk supply.
In a steady-state accretion disk the rate of accretion is (Pringle, 1981), where is the surface mass density of the gaseous component of the protoplanetary disk. For an aged system, one million or more years old, would correspond to a kinematic viscosity characterized by a turbulence parameter . Density perturbations caused by the planet’s gravity would become substantial for . During Phase IV, since is less than what envelope contraction would dictate, the planet detaches from the disk, quickly evolving to the point where is much smaller than , where refers to the shock layer bounding the hydrostatic planet.
The accretion rate during Phase IV depends on both disk evolution and tidal interactions between the planet and the surrounding gas. To model these processes, we follow the approach described in D’Angelo et al. (2021). The disk evolution is driven by viscous diffusion, photo-evaporation (i.e., winds from the surface), and accretion on the planet. The disk lifetime is mainly determined by the initial surface density of the gas, the turbulence parameter , and the photo-evaporation rate (here assumed to be a constant, ). Applying the gas surface density at the planet’s location, obtained from the disk evolution calculation, the limiting gas accretion rate of the planet as a function of and is derived from three-dimensional, high-resolution hydrodynamics calculations of disk-planet interactions (Lissauer et al., 2009; Bodenheimer et al., 2013). The accretion rates of solids and gas as a function of are delivered to the planet formation code in the form of a table. Phase IV starts when equals the limiting rate. At the beginning of this phase, may still be positive (typically if the tidal gap is not too deep), but in these models declines as increases (see, e.g., Lissauer et al., 2009; Bodenheimer et al., 2013). Both beginning and end of Phase IV depend on disk evolution.
For the determination of the initial surface density of the gas, , these disk models do not assume that planetesimals formed in situ, i.e., that the ratio around the planet’s orbit is equal to the initial dust-to-gas mass ratio at that location. Rather, they assume that planetesimals assembled from smaller bodies (formed out of dust) as they drifted inward from a range of distances in the disk.
2.7 Accretion of Solids During Phase V
As the impact of the fragments Comet D/Shoemaker-Levy 9 into Jupiter’s atmosphere in 1994 demonstrated, Jupiter continues to accrete solid material at the present epoch. The current accretion rate is exceedingly small, but solids were likely accreted at a much larger rate early in Solar System history, even after gas accretion ceased. This has not been accounted for in our previous Jupiter formation simulations because solids were assumed to sink to the condensed core, slightly increasing the planet’s but not changing gas accretion, the computation of which was the focus of those studies.
Here we are also concerned with the distribution of materials within the planet. The detailed calculation of solids accretion rates subsequent to the dispersal of the gaseous disk around the planet is beyond the scope of this work. Nonetheless, as this process is likely to have operated, we prescribed the accretion of an additional of planetesimals in the following the cessation of gas accretion to qualitatively account for this late addition of heavy elements.
Late accretion of solid bodies may have been the cause of the atmospheric enrichment. Alternatively, enrichment might be explained by convective transport from deeper regions. This possibility is not consistent with our models. It is also discussed and discarded by Helled et al. (2022), but it must be acknowledged that our understanding of convection in the presence of a compositional gradient is imperfect. These uncertainties could affect the evolution through the isolation phase which follows the cessation of accretion, but not significantly on the formation processes in Phases I through V, as detailed in the next section.
3 Results
Our formation models lead to a region that is almost pure heavy elements () near the center; that region consists of two parts. The “inner” core is small and represents material that arrived essentially unaltered because it never underwent disruption and only marginally vaporized in its passage through the overlying gas. The composition is % SiO2 and % H2O. The “outer” core is more massive and consists of material of about the same composition that arrived as droplets because the overlying gas became supersaturated in those constituents. It is effectively although it can (and does) contain small amounts of hydrogen and helium. By construction (and in reality) it cannot have a sharp upper boundary since there is no phase separation of this heavy material from the adjacent “gas”, which is hot, partially degenerate metallic fluid.
In the following, the “inner” core, of mass , refers to that part of the planet represented by an equation of state, which is used to determine its radius from , but which is not directly modeled. The inner core only contains heavy elements (although solids are % H2O by mass, i.e., , we assume for simplicity) in the same proportions as accreted solids, and represents the primitive body that initiated planet formation; it grows as long as incoming solids can impact on it.
The rest of the planet (“outer” core and above) is modeled in full detail. Since the outer core lacks a sharp upper boundary, we tabulate the “envelope” mass fractions including the outer core component. We note that this issue of how to define core and envelope is pervasive in the gravity modeling of Juno data as well and has no agreed resolution. Accordingly, we designate the “envelope”, of mass , as the part of the planet surrounding the inner core and whose structure is computed (see Section 2). It contains both heavy and light elements, and includes the “outer” core, defined as the envelope region with composition (; H atoms in H2O are classified as belonging to ). The inner plus outer cores constitute the planet’s “core”. We indicate with and , respectively, the heavy-element mass and hydrogen/helium mass of the envelope. The total heavy-element mass of the planet is , whereas its total light-element mass is .
| time | ||||||||||||
|---|---|---|---|---|---|---|---|---|---|---|---|---|
| (Myr) | () | () | () | () | () | () | () | () | ||||
| Start | ||||||||||||
| Max. of | ||||||||||||
| Max. of | ||||||||||||
| End of Phase I | ||||||||||||
| End of Phase II | ||||||||||||
| End of Phase III | ||||||||||||
| End of Phase IV | ||||||||||||
| End of Phase V | ||||||||||||
| Final model | ||||||||||||
Note. — Temperature and density refer to the values at the boundary between inner core and envelope, that is, the inner edge of the outer core. After achieves its maximum, planetesimals dissolve in the envelope. The end of Phase II occurs when . Phase IV ends when gas around the planet’s orbit disperses (i.e., ).
The calculation, referred to as the “standard model”, starts with an inner core mass of with and an envelope mass of ; as stated above, the envelope defines the computational domain. The envelope is composed mostly of light elements, with a small amount of heavy elements from the ablation of planetesimals, as they fall through the tenuous envelope and join the inner core. The starting time, years, is an estimate of the time required to form a heavy-element core of that mass (D’Angelo et al., 2014).
3.1 Evolution Through Phases I and II
The formation and evolution of the planet through all phases is summarized in Table 1. The columns provide the time, the inner core mass (), the mass of heavy elements in the envelope (), the mass of H-He in the envelope (), the temperature at the inner edge of the envelope (), the density at the same location (), the radiated luminosity (), the mass accretion rate of planetesimals (), the mass accretion rate of H-He (), the outer radius (), and the total mass (). In the earliest phases the planetesimals hit the inner core. Once the core mass reaches (; ), the planetesimals break up in the envelope and remain there (by assumption); the inner core mass remains constant from then on. For the remainder of Phase I, breakup occurs at envelope temperatures large enough for H2O and SiO2 to evaporate. Thus, an outer core is formed with mass partitions of the accreted solids.
During Phase I, the accretion rate increases to a maximum at . The maximum in the radiated luminosity occurs roughly contemporaneously.
There are differences in our models compared to those obtained in previous calculations (see, e.g., Lissauer et al., 2009) in which the solids are assumed to eventually sink to the core. One such difference here is that almost all of the added heavy-element material remains in the envelope. At the maximum in , , which is only a very small fraction of the total envelope mass . The mean molecular weights are higher than those in a H-He envelope and therefore, in order to maintain hydrostatic equilibrium, the internal temperatures and densities must be higher. The higher densities result in a larger capture cross section for the planetesimals’ accretion, so the maximum is larger than that in previous calculations. For example, in Lissauer et al. (2009), the corresponding value is , and in Movshovitz et al. (2010, their case ) it is . Also, the internal temperature in the Movshovitz et al. model at the same total mass () is about a factor smaller than the value given in Table 1. The maximum luminosity is lower by about an order of magnitude than those in the comparison cases. This difference is caused in part by planetesimals not sinking to the core but breaking up and vaporizing near , rather than sinking to as in previous cases. Also, some of the accreted energy is prevented from escaping through the composition gradient.
The structure at consists of a region (silicates and water) from the inner core radius to , where . The silicate mass fraction decreases from % to % between that radius and and temperature . A nearly pure water layer extends out to , where , and is formed by ablation of the planetesimals. Between that radius and , where , the water vapor mass fraction decreases from % to %. The outer radius is . The breakup of planetesimals occurs around , at temperatures high enough so that both water and silicates can vaporize and mix with the ambient gas. This layer is at the outer edge of the region with , so that there is some suppression of energy transport in the overlying region with a gradient in the silicate fraction. The radiated luminosity entering that region from below is a factor larger than that exiting at the top of the region. Farther out, the gradient in the water fraction does not contribute to heat trapping or suppression of convection, because it is in a radiative region.
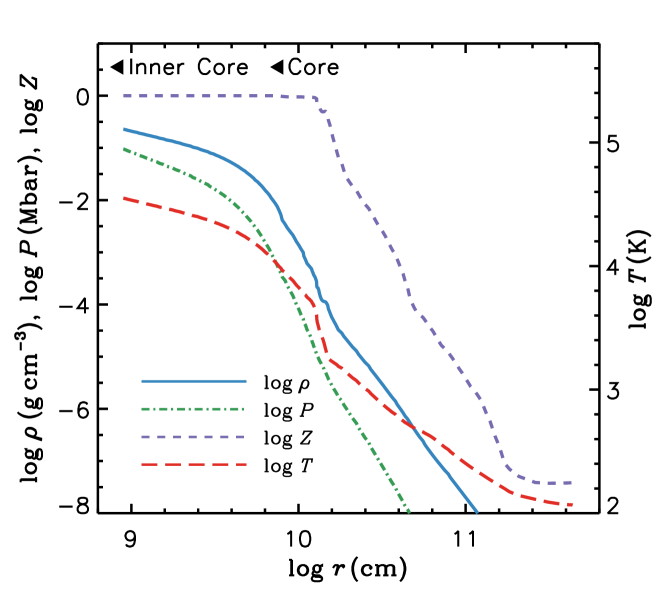
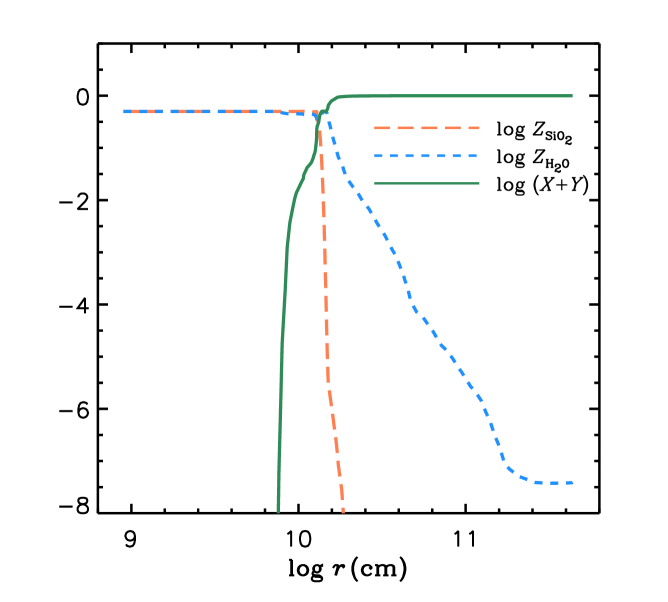
The value of then steadily declines with time as the mass of solids available to accrete onto the planet is gradually depleted. At , when , exceeds , signalling the end of Phase I. This mass is about the same as the corresponding mass in Lissauer et al. (2009) and Movshovitz et al. (2010), but the time is shorter than that found by Lissauer et al. (2009), . A different value for () was obtained by D’Angelo et al. (2014), who used a more sophisticated and much more computationally-intensive prescription for the calculations of . The planet structure is still dominated by the heavy elements, whose total mass is . The inner region with extends out to and and includes about . The gradient in silicate vapor extends from there down to and out to . The gradient in water vapor extends down to , where . Outside that point, very little planetesimal material has been accreted. Most of the deposition of mass and energy by planetesimals occurs at around , about and near the outer edge of the layer with a silicate composition gradient, that is, at about 1.1 times the radius of the outer core. Thus, there is a negligible amount of suppression of energy transfer because of the gradient. The layers with a gradient in the water mass fraction also do not suppress energy transfer, and there is no mixing of material there, because energy transfer is by radiation from out to the surface, at . The radiated luminosity is again a factor lower than in Lissauer et al. (2009), although the values of are similar. The temperature at the inner core-envelope boundary is . Figure 1 shows the structure variables (left) and the distribution of the silicate, water, and H-He constituents (right) somewhat after the beginning of Phase II.
Phase II evolves on a longer timescale. At , the masses in H-He and heavy elements are, respectively, and . At this time, , and , a ratio of about . Accretion continues with a gradually increasing ratio up to , when , the crossover point. The value of the crossover mass, , is almost exactly the same as that in Lissauer et al. (2009) and Movshovitz et al. (2010). The value of is about % longer than in Lissauer et al. (2009), and much longer than in Movshovitz et al. (2010), who obtained a value of only . The short time in the latter work is most likely a result of their calculation of grain settling and coagulation in the envelope, which results in a significant reduction in opacity. Note, however, that D’Angelo et al. (2021) also include the grain settling and coagulation as well as a detailed calculation of the dynamics of the planetesimal swarm, with a large range of planetesimal sizes. They obtain and . The sharp reduction in opacity due to grain settling and coagulation does not occur, because the small planetesimals ( in radius) ablate in the outer regions of the envelope and resupply the population of small grains.
During Phase II, the envelope density increases to the point at which planetesimal breakup occurs where envelope temperatures are large enough for H2O to fully evaporate and remain around the breakup layer. Silicates, however, do not evaporate completely and sink, forming a layer in which the gradients of and differ. Farther out, is dominated by H2O.
In the present calculation, at , the outer core region with extends to a radius and includes a mass of about . Farther out, decreases to a value of % at . By comparison, the core radius in Lissauer et al. (2009) and Movshovitz et al. (2010) is , bounding a mass of . Thus, in our case, there is a centrally condensed “core” component, but the distribution of heavy elements is much more extended in radius than in the comparison cases. Another point of comparison is the temperature at the inner core-envelope boundary. In our case, at ( times the radius of the outer core), , while in the comparison cases, at the same radius, .
3.2 Evolution Through Phases III and IV
Crossover () marks the end of Phase II. During Phase III, the value of increases by a factor of , while the rate also increases significantly, by a factor of (see Table 1). The mass grows from to , while grows from to . This phase includes what is generally referred to as the “runaway accretion” phase, which is defined by a decreasing growth timescale, , as the planet mass increases, e.g., with . In the standard model discussed herein, proper runaway accretion starts after Phase III begins and ends together with Phase III. In the model, the planet acquires about ten percent of its final mass during runaway accretion.
For an assumed disk viscosity parameter , exceeds the maximum rate at which the disk can supply gas to the planet at , when . At this time, the planetesimals break up at about , at the outer edge of the layer with the composition gradient. The radiated luminosity, , arises primarily from gravitational contraction rather than from energy deposition by planetesimals. The planet has reached its maximum size, with .
In Phase IV, consistent with the assumption regarding during Phases I–III, the parameter (see Section 2.5) is set to . It refers to the half-width, in Hill radii, of the region from which the solids can accrete onto the planet. The value of is obtained as described in that section. The value of versus time is discussed in Section 2.6. Gas accretion increases somewhat in the beginning but it then decreases with time because of gap opening by tidal torques, as also illustrated in Figure 2 of Bodenheimer et al. (2013), and gas dispersal. About % of the planet’s final mass is acquired during this phase, in a non-runaway fashion. The planet contracts rapidly as soon as this phase sets in; at the maximum of , . Temperatures at , which refers to the layer just interior to the shock, depend on , , and and are typically a few hundred kelvins. The radiated luminosity during this phase consists of two components: the internal luminosity primarily from contraction, and the accretion luminosity , arising from the infall of gas onto the planet. The maximum of occurs at about , when , , and . At maximum power output, , of which % is contributed by . Phase IV ends at with , , and . At this time, the accretion rate of heavy elements is . As mentioned in Section 2.5, the rate of solids accretion declines relative to during this phase, from about % at the beginning to about % toward the end.
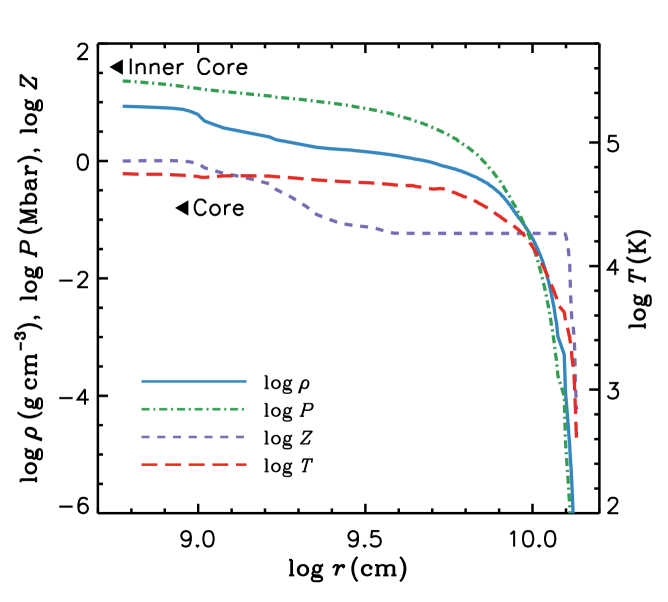
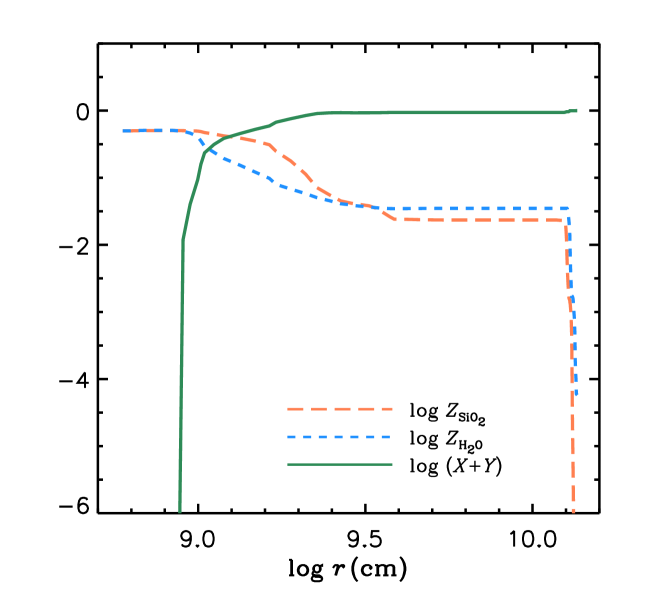
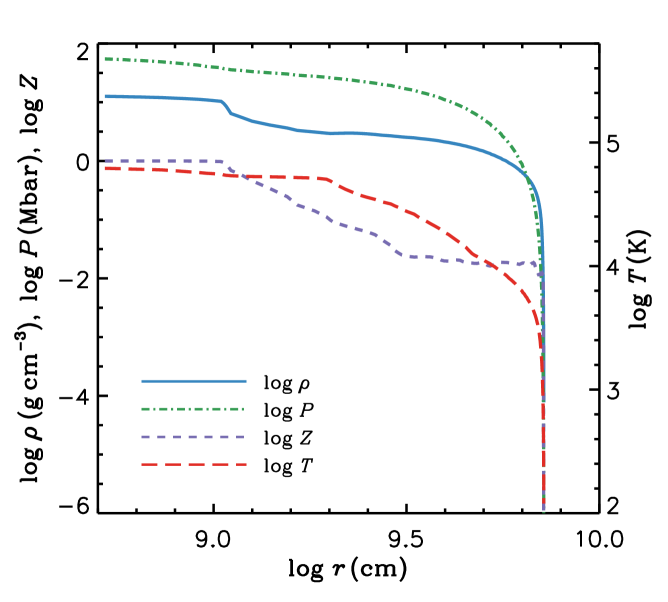
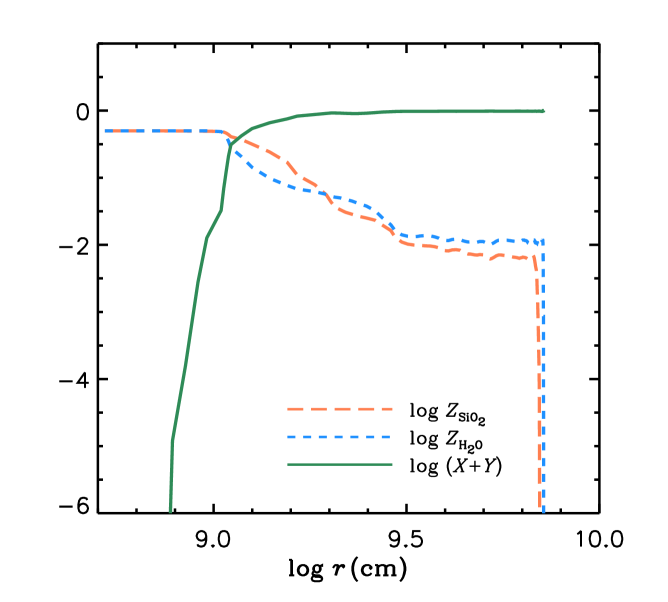
The structure of the planet () at the end of gas accretion is shown in Figure 2 (left panel), which gives, as a function of radius, the density, pressure, temperature, and composition. The core region has a mass of several times . Outside that region, the composition gradient extends out to and a temperature of . The energy transport is by ordinary convection beyond that radius, and the composition is uniform with in the region with water and silicates, and in the overlying region with just water. Note that the mass fraction of water exceeds that of silicates in the uniform region, while the silicates dominate in the gradient region (see Figure 2, right). The total mass of silicates equals that of water throughout the evolution (because of the assumed composition of accreted solids). The convection zone extends out to , where the temperature is . Beyond this point, the silicate vapor condenses and is removed via rain-out. In the outer layers, energy transport is by radiation. In the very outermost layers, the water vapor mass fraction drops off not because of condensation ( K), but because little material landed there by ablation during Phase IV. The total luminosity of comes primarily from the accretion luminosity of the last remaining infalling gas onto the planet, which is re-radiated from behind the accretion shock. The internal luminosity, generated primarily from contraction, is .
3.3 Phase V
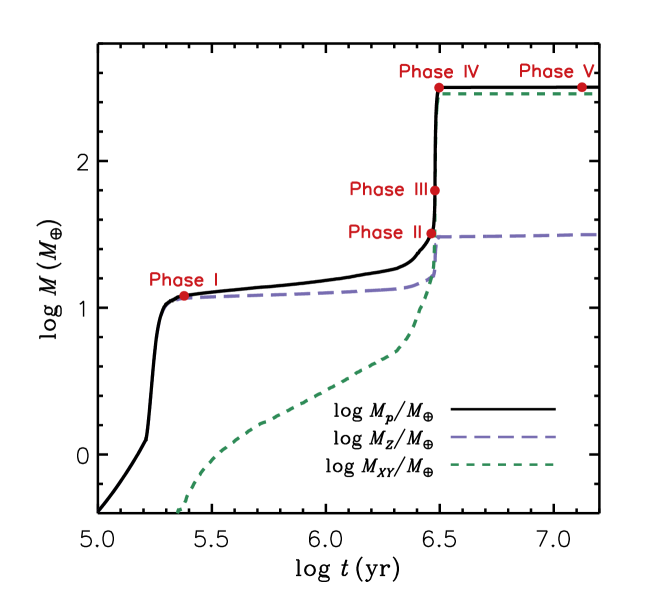
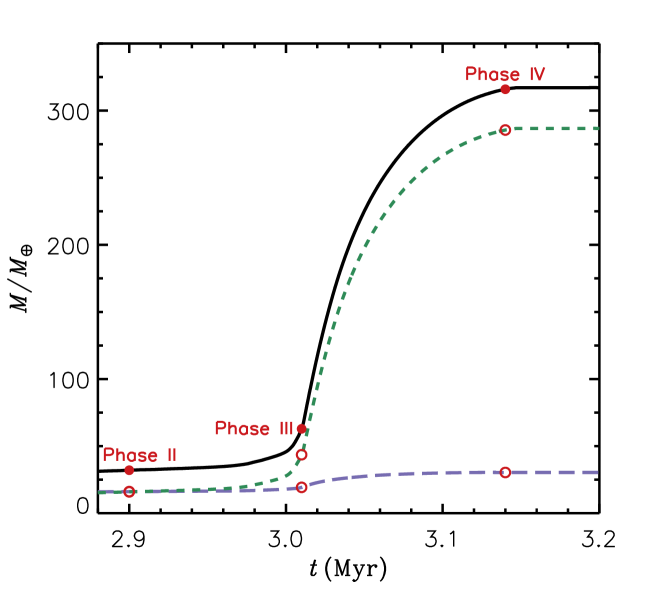
At the beginning of Phase V the planet radius , where . Accretion of solids from residual planetesimals is assumed to continue after gas accretion stops, at an arbitrary rate of for a time of years. The final mass is , of which is heavy elements. At this time, , the contraction has led to slight adiabatic heating of the inner regions; later on the cooling phase sets in. The outer region of the planet is low (i.e., primarily H and He); thus the added heavy-element material produces a Rayleigh-Taylor instability. Mixing of material results in uniform composition in the region from the outer edge of the composition gradient out to where the silicates condense, at . Outside that point, a region of water vapor with exists out to the surface, at . Figure 3 shows the temporal evolution of , , and , up to just beyond this point in time (left panel). The positions at which the transition between two Phases occurs are marked by circles. The right panel of the Figure shows the mass evolution during Phases III and IV. At the transition between Phases II and III, when , the gas accretion rate does not vary sensibly, and increases significantly only later in Phase III. The H-He mass curve also indicates that decreases during Phase IV, as the planet acquires most of its mass.
3.4 Post-formation Evolution
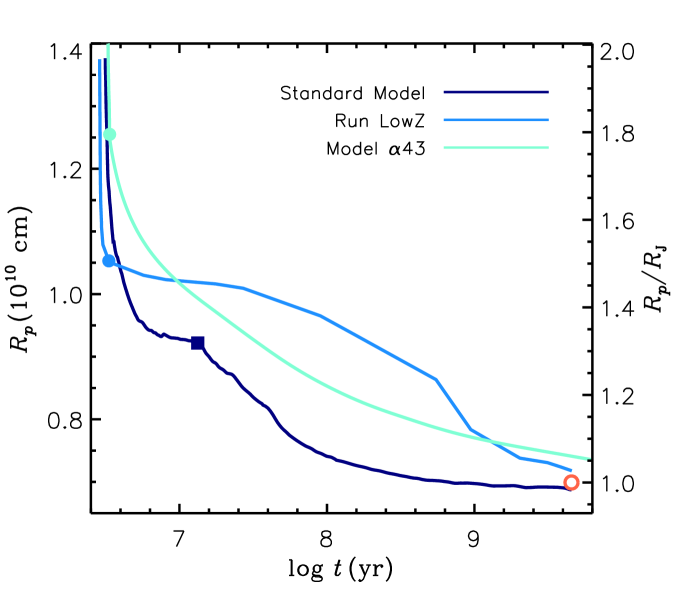
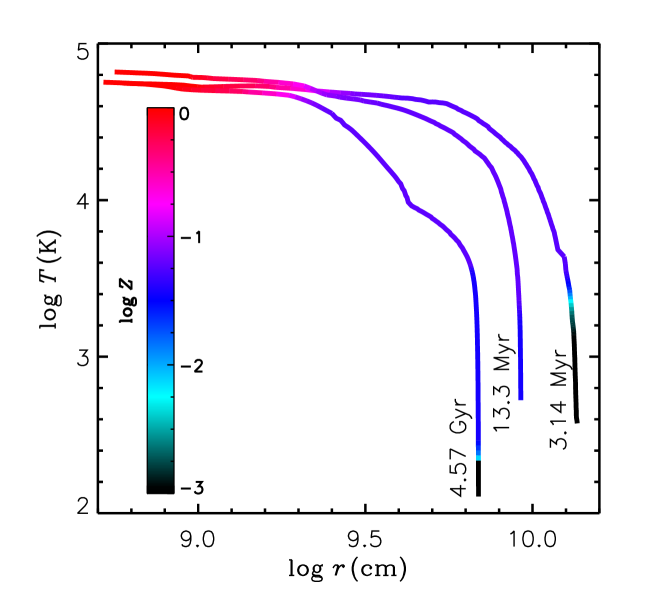
Further evolution involves no additional accretion. The value of declines, as shown in Figure 4, ending at (the age of the solar system) about % below the actual (volumetric mean) radius . For comparison, the Figure also reports the radius obtained from another model with final , discussed in Section 3.5, and from a model in which the heavy elements sink to a compressible core (see D’Angelo et al., 2021). The internal luminosity (neglecting the re-radiated solar energy) declines by three orders of magnitude, to end at , in very good accord with recent measurements of this quantity, (Li et al., 2018). In the outer layers of the final model, at a pressure of , the temperature is . Note that the standard adiabat for calculation of Jupiter interior models starts at a temperature of at pressure (e.g., Stevenson, 2020). The temperature distribution agrees with data within a few percent, down to (Seiff et al., 1998). These results are modestly affected by the assumed value of the equilibrium temperature, which depends on the measured albedo. The temperature as a function of radius in the models at three different epochs is shown in Figure 5, in which uniform colors on the curves represent envelope layers of uniform composition.
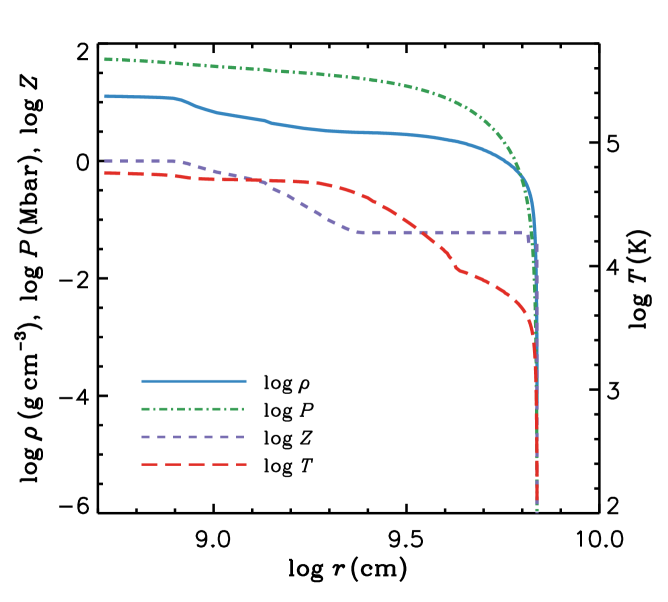
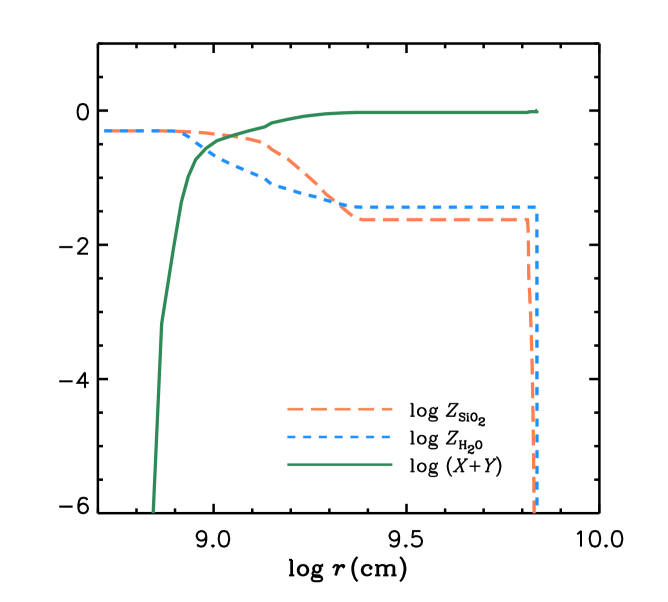
Figure 6 shows the structure at the current age, in the same format as in Figure 2. The pressure at the inner core-envelope interface is . The outer core region with extends to and includes a mass of about . The layers with a gradient in composition extend out to , about % of the planet’s radius, . The relative mass fractions of silicates and water, as a function of radius, exhibit a similar behavior to that shown in Figure 2. From that radius out to the composition is uniform in both silicates and water with . Beyond that point the silicates condense, and the water layer has uniform out to and . In the very outer layers, where the temperature drops to about , the water condenses and rains out. The region of uniform composition, between and , is marked by a uniform color () in Figure 5.
Figure 2 (right) and Figure 6 (right) display the effect of the very different evaporation temperatures for ice and rock: the rock is deeper and the ice is shallower. This “differentiation” is not directly due to density (except that it is gravitationally stable) but to the thermodynamics of vaporization. It implies that the relative abundances of rock and ice in the region towards the surface (yet deeper than current cloud formation) should be different from what was originally accreted, with the rock being less abundant. Unfortunately, this important prediction is difficult to test with current models of the giant planets. It may however be a very important conclusion of relevance to the so-called ice giants such as Uranus and Neptune, or exoplanets (sub-Neptunes), since this effect is then more likely to be expressed in the heat flow and perhaps even the gravity field.
3.5 Simulations with Alternative Prescriptions for Late-Stage Solids Accretion
A modification to this calculation (Run NoFive) was made in which no solid accretion was postulated after the end of gas accretion (), i.e., no Phase V. The evolution up to this time is the same as given in Table 1. The model beyond this point has total heavy-element mass of out of the total mass of . At the final time of , the radius is less than half a percent larger than , and the internal luminosity is , very close to that of the standard model. The temperature at pressure again is . The values of and are, respectively, and . The water vapor abundance in the outer layers (above the condensation temperature) is , only slightly lower than that in the standard case. The reason for this small difference is that the of added heavy elements in the standard model is mixed through the outer convective envelope, which includes times that mass. Furthermore, the silicate component of added material is supersaturated and rains out to a layer where the temperature is . To make a significant difference in the abundance of the surface layers, say %, would have to be added during Phase V. It remains to be determined whether such a process is feasible.
A second modification (Run LowZ) tests the effects of the parameter in Equation (3), the half-width of the region from which the planet can collect solid material. The value of (taken from Kary & Lissauer, 1994) used above is changed to , the value derived from detailed calculations of the evolution and accretion of the planetesimal swarm surrounding the forming planet (D’Angelo et al., 2014, 2021). Details on the procedure for the calculation of and during Phase IV are reported in the latter paper. The rates are based on a disk model whose initial mass is about and whose initial gas surface density is about , consistent with the assumption used in the present calculations. The viscosity parameter, as above, is .
The evolution up to the onset of disk-limited accretion is the same as that given in Table 1. The gas accretion rate during Phase IV is the same as above, with the same maximum rate, but the values for are lower than before. The end of accretion of gas and solids occurs at , with , , , and , all in units of . The value of at the end of accretion is , considerably lower than the value of obtained in the standard model. At this time, , , , and . Shortly before the end of gas accretion, the effective temperature (defined by ) is , compared with in the standard case.
The evolution into the isolation phase has no added accretion of solids (no Phase V), reaching with about % higher than , , and . The central core with includes , and the composition gradient extends out to , about % of . The deep uniform-composition region of the envelope, with , extends out to , where the silicates start to condense and rain out. Farther out, the water layer has , except in the very outer layers where water condenses. These values are lower than in the standard model. The structure and composition are illustrated in Figure 7.
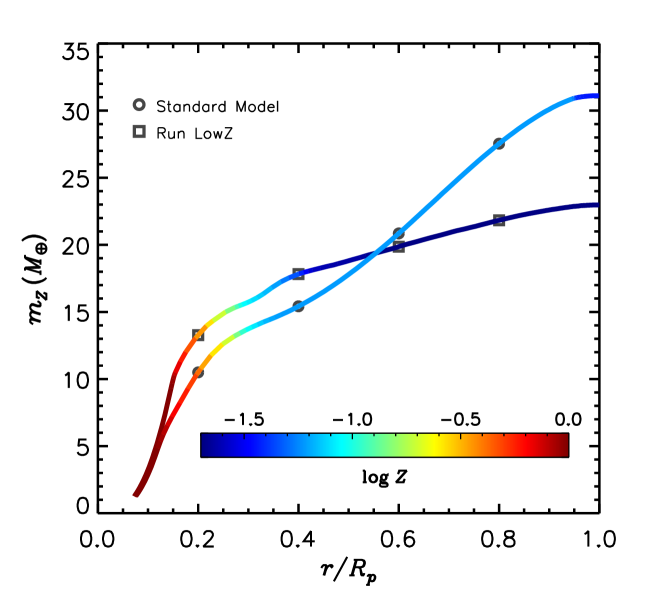
The distribution of heavy elements in Run LowZ is compared to that of the standard model, at the current epoch, in Figure 8. Note that the two models have comparable cores () and both have of heavy elements within half of the planet radius.
4 Discussion
The interior structures of the three cases presented here (Standard, NoFive and LowZ), after , are similar. All have a central core () where the radius of the outer core ranges from to (% to % of the planet radius ), enclosing masses between and . Outside this region, a composition gradient exists, with , extending out to radii between % to % of . Outside the gradient layer, the composition is nearly uniform in the convective envelope. In this region the values of range from to %. The values of in the H2O layer near the outer edge of the envelope, where the silicates have condensed, range from to %.
4.1 Previous Formation and Evolution Models
Ormel et al. (2021) calculated models through Phase II, based on accretion and dissolution of dust and pebbles in the H-He atmosphere; they also found a gradient in composition. In calculations at , with particles in the size range –, the somewhat diluted core has values in the range to .
A model similar to that considered herein, in which Jupiter’s evolution is followed through the isolation phase, starting from an assumed heavy-element distribution, is presented by Vazan et al. (2016, their case ) under simpler physical assumptions. At the current age, decreases from at the center to at mass fraction (radius fraction ); farther out is constant. Convection is suppressed in the gradient layer. Similar calculations through the isolation phase are reported by Vazan et al. (2018).
Lozovsky et al. (2017) calculated the deposition of heavy elements in the envelope during the formation phase. At the end of Phase IV, the mass fraction of heavy elements decreases from at the center to about at mass fraction . They also find, as we do, that interior temperatures are much higher than temperatures would be for a homogeneous, isentropic H-He envelope. Starting with assumed distributions of at the onset of Phase IV, (motivated by Lozovsky et al. results) Müller et al. (2020) perform calculations up to the present day. The results at the final time show that the region enriched in extends to no more than mass fraction (% of the radius). Note that our present calculations make no assumption regarding the initial distribution other than that accretion starts with a heavy-element core () of .
An alternative calculation of the full formation and evolution of Jupiter has been published by D’Angelo et al. (2014, 2021). In that calculation, the accretion rate of solids is based on a detailed statistical calculation of the evolution and accretion of a planetesimal swarm surrounding the forming planet, with a considerable range of planetesimal sizes. The present calculations do not include this (very time-consuming) effect, but use the simpler accretion rates of Greenzweig & Lissauer (1992) with a single planetesimal radius of . The typical planetesimal size that provides the bulk of the heavy-element mass accreted in the D’Angelo et al. calculations is around . Another effect included in those calculations is the coagulation and settling of the small grains, which enter the planet along with the nebular gas and those released by ablating planetesimals, and the resulting effects on the opacity in the outer radiative zone that is found during formation. The present calculations do not include this effect, but instead use a fixed opacity table as a function of temperature, density, and composition. The computed opacities in radiative zones in our calculations and in the calculation by D’Angelo et al. (2014, 2021) are not markedly different (D’Angelo et al., 2014, their Figure 11). The major effect that is not included in the D’Angelo et al. calculations is the deposition of the heavy elements within the planet, and the resulting change in envelope composition. The D’Angelo et al. calculation assumes that all accreted heavy elements sink to the core. The final core mass turns out to be about . It is planned in the future to improve the present calculations to account for the solid accretion rates of D’Angelo et al. (2014, 2021), including a range of planetesimal sizes.
4.2 Observationally-Constrained Models of Jupiter’s Interior
There are still small but significant unresolved differences in the modeling efforts to explain gravity data obtained by the Juno mission. One such effort, led by B. Militzer, follows from the pioneering effort of Wahl et al. (2017). Another, led by Y. Miguel, follows from the pioneering work of Guillot (2005). Interior models are inevitably non-unique because they are designed to fit a small number of observable quantities (e.g., radius, , , and , which may be affected by differential rotation). As a consequence, some features of interior models such as a core may be indeterminate if it is small enough (e.g., a few at most). Interior modeling also requires good understanding of the equation of state of hydrogen, and errors of a percent or two in density at a specified pressure are possible and can affect estimates of . Some of Jupiter’s gravity-based models include the effect of helium immiscibility interior to % of and a change in abundance at that point. This effect was not included in our calculations, as it is not likely to be of importance to the issues we seek to address. Nonetheless, differences in the gravity-based models are probably smaller than the differences between those models and our formation models.
The key difference is that our formation models tend to produce a much more centrally concentrated distribution of heavy elements, even though they no longer have a sharp boundary between a central core, with , and an overlying envelope, with . The main aspects of this difference can be appreciated by describing some published interior models that fit the Juno data.
The preferred model from Debras & Chabrier (2019) has the following layers: i) a possible central core out to % of the radius, ii) a diluted core with at % of the radius, decreasing to at to % of the radius; iii) a convection zone with uniform out to -% of the radius, iv) a layer in which increases outward to the surface value of , and v) an outer convection zone with uniform . Thus, the dilute core is considerably more extended in radius than the dilute region in our models. A central, core is permitted in their models but not required by gravity data (F. Debras, 2021, personal communication).
The work of Wahl et al. (2017) considers models with a dilute core of constant extending outward from the center to –% of . The cores contain to of heavy elements and is relatively low; thus the core region consists mainly of H-He. Outside the core there are two layers with different , both significantly smaller than the core value. This structure is not consistent with the physical assumptions and results of our models. It requires post-formation erosion of the primitive region and upward mixing of the heavy elements in the H-He gas. Alternatively, a much larger ratio is required during Phases I and II, which seems difficult to achieve within the core accretion scenario.
Both Debras & Chabrier (2019) and Wahl et al. (2017) (as well as more recent work) have difficulties matching the threefold enhancement, relative to solar, of the heavy elements in the envelope’s outer layers, as measured by the Galileo probe. Since we have no reason to doubt the probe results (or older estimates of methane enrichment in the atmosphere), this discrepancy raises the possibility of equation of state errors. It is not known whether such an error would only affect the determination of in the outer region or might even affect the issue of deep structure that is our focus here. Helled et al. (2022) discuss the discrepancies between gravity-based models and the present interior models based on formation and evolution. The possible sources of this discrepancy are enumerated at the end of the summary below.
5 Summary and Conclusions
This paper describes calculations that follow the formation and evolution of Jupiter, starting from a small core of heavy elements, continuing through the phases of concurrent accretion of solids (planetesimals) and nebular gas, and ending at the age of the solar system. The calculations presented herein depart from the historical assumption that all accreted heavy elements sink to a condensed core and that all the gas outside the core has nebular composition. Here we calculate the dissolution of the planetesimals, composed of silicates and ice, in the gaseous envelope. The end result is a central region of % heavy elements with a mass of several , outside of which is a layer of steadily decreasing mass fraction of heavy elements. The layer with a composition gradient () extends outward to –% of the planet radius (); above it is a layer of nearly uniform composition with a few percent of heavy elements by mass. The central region and the outer layers with nearly uniform composition are separate convection zones with different specific entropy.
The calculations are self-consistent in the sense that once the distribution of heavy elements in the envelope is determined at a given time step, the resulting structure is obtained through a full solution of the planetary structure equations, taking into account the effects of the heavy elements on the equation of state and opacity. The resulting structure is hot enough that most of the accreted solids vaporize and mix with H-He. However, this flux of accreted material is high enough that the gas tends to oversaturate, with the excess heavy elements sinking as droplets toward a region, which may be supercritical. The region with the composition gradient is stable against ordinary convection, so that transfer of energy and material through this region is strongly suppressed. This effect, along with that of the mean molecular weight in the equation of state, results in a considerably hotter interior than that found in most previous calculations. The temperature gradient in the region with the composition gradient is uncertain and must be considered in a more detailed manner in the future. Because of considerably different evaporation temperatures, silicates and H2O have quite different radial distributions through most of the formation phases.
In the standard model presented herein, the accretion era of the planet separates into five phases. Phase I is dominated by accretion of solids, much of which forms a core. The phase differs from that in previous calculations (e.g., Lissauer et al., 2009; Movshovitz et al., 2010) in that is noticeably higher, the luminosity is lower, and the duration of the phase is shorter (see Section 3.1). Phase I ends when , with at years. Phase II takes an order of magnitude longer than Phase I and is characterized by relatively low but increasing and . The ratio increases with time. This Phase ends when (crossover), at and , the same as in Lissauer et al. (2009) and Movshovitz et al. (2010). The structure at this time is different, however, with higher internal temperatures and with about half of in a core, the remaining portion residing in a region with a composition gradient, extending out to ten core radii.
Phase III, with , starts at crossover and ends at . The gas accretion rate increases rapidly, to . At this stage, the contraction of the planet is so rapid that the demand on to satisfy the boundary condition cannot be satisfied by the disk, signalling the start of Phase IV, when .
The planet then begins to contract, and the boundary condition shifts from nebular values to shock conditions at the boundary between the infalling gas and the hydrostatic planet. The disk-limited gas accretion rates are based on three-dimensional hydrodynamic simulations of a planet embedded in a disk (Lissauer et al., 2009; Bodenheimer et al., 2013). The solids still accrete during this phase, but at a much lower rate than the gas. The value of is somewhat uncertain, as it depends on the size of the feeding zone, from whose edges the solids are assumed to originate. Two cases are considered in this paper. The first (standard) case assumes that the half-width of the feeding zone is . At the end of Phase IV, the total heavy-element mass is . In the second case (Run LowZ), based on the detailed calculations of the evolution of the planetesimal swarm (D’Angelo et al., 2021), the half-width is and the final . Phase IV ends at the time of disk dissipation, in the standard case and in Run LowZ.
The new Phase V is introduced in the standard case. It has been hypothesized that the enhanced abundances of heavy elements, compared to solar values, in Jupiter’s outer layers can be caused by the addition of solid material to the planet after gas accretion ends. During the first years following disk dispersal, the planet is assumed to accrete of planetesimals. As the planet has contracted substantially and the scale height in the upper envelope is far smaller than during earlier phases, these planetesimals break up high in the envelope, locally adding heavy elements. The high density in those layers results in a Rayleigh-Taylor instability and mixing of material into the outer convection zone. The is diluted in the entire mass of that zone, . The water abundance in the outer layers hardly differs from the case with no added solids (i.e., Run NoFive). Considerably more material would have to be added to make a difference. However, the total added to the planet in Phase IV does have an effect on the water abundance in the outer layers, which turns out to be about % in the standard case () versus % in the alternate case (Run LowZ, ).
As mentioned at the beginning of this section, the final models at have a central (inner plus outer) core with that has less mass than in previous calculations in which all added solid material sinks to the core. Additional material is spread out in a layer with a gradient in composition, , extending out to at most % of . Models of present Jupiter (e.g., Wahl et al., 2017; Debras & Chabrier, 2019), which provide reasonable fits to the gravitational moments determined by Juno (Iess et al., 2018), typically have no core with but, instead, regions with low extending out to large radius fractions. The formation pathway for such a structure is unclear. Our formation models do not provide a solution to this dilemma, but it should be pointed out that models with a central core of a few , which fit Juno data, are not ruled out (Guillot et al., 2018; Debras & Chabrier, 2019). Current modeling effort led by Y. Miguel (Miguel et al., 2022) and B. Militzer (2022, personal communication) also suggest that a central core of a few Earth masses is possible.
These formation models fail to explain the extent of dilution heavy-element suggested by interior models based on gravity data. There are four possible reasons for this discrepancy: i) The accretion model is wrong; ii) The equation of state is wrong (i.e., current static models that fit gravity are wrong); iii) one or more giant impacts occurred to stir up the core; iv) Post-formation mixing by convection created the dilute core. All of these have been discussed above but we here offer a summary. Concerning the first, it is possible that the delivery of solids was different than in our picture. Concerning the second, the inability to explain the current atmosphere suggests problems, and the current thermodynamic descriptions being used disagree with each other at a level that is small but could change the models, suggesting the need for more laboratory work. Concerning the third, giant impacts are not yet adequately modeled, and the one published example showing extensive upward mixing of a core was based on a head-on collision that is unlikely relative to multiple oblique collisions. Concerning the fourth, there is currently no sufficiently high resolution, low viscosity convection simulation that determines the consequences of Reynolds stress (turbulence, effectively) in upward mixing arising from cooling from above (the dominant mechanism for Jupiter’s luminosity). All four possible explanations suggest that there is much scope for future work in several directions.
References
- Alibert et al. (2018) Alibert, Y., Venturini, J., Helled, R., et al. 2018, Nature Astronomy, 2, 873, doi: 10.1038/s41550-018-0557-2
- Bodenheimer et al. (2013) Bodenheimer, P., D’Angelo, G., Lissauer, J. J., Fortney, J. J., & Saumon, D. 2013, ApJ, 770, 120, doi: 10.1088/0004-637X/770/2/120
- Bodenheimer et al. (2000) Bodenheimer, P., Hubickyj, O., & Lissauer, J. J. 2000, Icarus, 143, 2, doi: 10.1006/icar.1999.6246
- Bodenheimer & Pollack (1986) Bodenheimer, P., & Pollack, J. B. 1986, Icarus, 67, 391, doi: 10.1016/0019-1035(86)90122-3
- Bodenheimer et al. (2018) Bodenheimer, P., Stevenson, D. J., Lissauer, J. J., & D’Angelo, G. 2018, ApJ, 868, 138, doi: 10.3847/1538-4357/aae928
- Boss (2019) Boss, A. P. 2019, ApJ, 884, 56, doi: 10.3847/1538-4357/ab40a4
- D’Angelo & Bodenheimer (2013) D’Angelo, G., & Bodenheimer, P. 2013, ApJ, 778, 77, doi: 10.1088/0004-637X/778/1/77
- D’Angelo & Bodenheimer (2016) —. 2016, ApJ, 828, 33, doi: 10.3847/0004-637X/828/1/33
- D’Angelo & Podolak (2015) D’Angelo, G., & Podolak, M. 2015, ApJ, 806, 203, doi: 10.1088/0004-637X/806/2/203
- D’Angelo et al. (2014) D’Angelo, G., Weidenschilling, S. J., Lissauer, J. J., & Bodenheimer, P. 2014, Icarus, 241, 298, doi: 10.1016/j.icarus.2014.06.029
- D’Angelo et al. (2021) —. 2021, Icarus, 355, 114087, doi: 10.1016/j.icarus.2020.114087
- De Marchi et al. (2017) De Marchi, G., Panagia, N., & Beccari, G. 2017, ApJ, 846, 110, doi: 10.3847/1538-4357/aa85e9
- Debras & Chabrier (2019) Debras, F., & Chabrier, G. 2019, ApJ, 872, 100, doi: 10.3847/1538-4357/aaff65
- Freedman et al. (2014) Freedman, R. S., Lustig-Yaeger, J., Fortney, J. J., et al. 2014, ApJS, 214, 25, doi: 10.1088/0067-0049/214/2/25
- Greenzweig & Lissauer (1992) Greenzweig, Y., & Lissauer, J. J. 1992, Icarus, 100, 440, doi: 10.1016/0019-1035(92)90110-S
- Guillot (2005) Guillot, T. 2005, Annual Review of Earth and Planetary Sciences, 33, 493, doi: 10.1146/annurev.earth.32.101802.120325
- Guillot et al. (2018) Guillot, T., Miguel, Y., Militzer, B., et al. 2018, Nature, 555, 227, doi: 10.1038/nature25775
- Hanel et al. (2003) Hanel, R. A., Conrath, B. J., Jennings, D. E., & Samuelson, R. E. 2003, Interpretation of results, 2nd edn. (Exploration of the Solar System by Infrared Remote Sensing. Cambridge, UK: Cambridge University Press), 405–464, doi: 10.1017/CBO9780511536106.011
- Helled & Stevenson (2017) Helled, R., & Stevenson, D. 2017, ApJ, 840, L4, doi: 10.3847/2041-8213/aa6d08
- Henyey et al. (1964) Henyey, L. G., Forbes, J. E., & Gould, N. L. 1964, ApJ, 139, 306, doi: 10.1086/147754
- Iaroslavitz & Podolak (2007) Iaroslavitz, E., & Podolak, M. 2007, Icarus, 187, 600, doi: 10.1016/j.icarus.2006.10.008
- Iess et al. (2018) Iess, L., Folkner, W. M., Durante, D., et al. 2018, Nature, 555, 220, doi: 10.1038/nature25776
- Kary & Lissauer (1994) Kary, D. M., & Lissauer, J. J. 1994, Numerical simulations of planetary growth., 364
- Kippenhahn & Weigert (1990) Kippenhahn, R., & Weigert, A. 1990, Stellar Structure and Evolution (468 pp. 192 figs. Springer-Verlag Berlin Heidelberg New York.)
- Kruijer et al. (2017) Kruijer, T. S., Burkhardt, C., Budde, G., & Kleine, T. 2017, Proceedings of the National Academy of Science, 114, 6712, doi: 10.1073/pnas.1704461114
- Leconte & Chabrier (2012) Leconte, J., & Chabrier, G. 2012, A&A, 540, A20, doi: 10.1051/0004-6361/201117595
- Li et al. (2018) Li, L., Jiang, X., West, R. A., et al. 2018, Nature Communications, 9, 3709, doi: 10.1038/s41467-018-06107-2
- Lissauer et al. (2009) Lissauer, J. J., Hubickyj, O., D’Angelo, G., & Bodenheimer, P. 2009, Icarus, 199, 338, doi: 10.1016/j.icarus.2008.10.004
- Liu et al. (2019) Liu, S.-F., Hori, Y., Müller, S., et al. 2019, Nature, 572, 355, doi: 10.1038/s41586-019-1470-2
- Lozovsky et al. (2017) Lozovsky, M., Helled, R., Rosenberg, E. D., & Bodenheimer, P. 2017, ApJ, 836, 227, doi: 10.3847/1538-4357/836/2/227
- Mankovich & Fuller (2021) Mankovich, C. R., & Fuller, J. 2021, Nature Astronomy, 5, 1103, doi: 10.1038/s41550-021-01448-3
- Melosh (2007) Melosh, H. J. 2007, Meteoritics & Planetary Science, 42, 2079, doi: 10.1111/j.1945-5100.2007.tb01009.x
- Miguel et al. (2022) Miguel, Y., Bazot, M., Guillot, T., et al. 2022, arXiv e-prints, arXiv:2203.01866. https://arxiv.org/abs/2203.01866
- Mizuno (1980) Mizuno, H. 1980, Progress of Theoretical Physics, 64, 544, doi: 10.1143/PTP.64.544
- More et al. (1988) More, R. M., Warren, K. H., Young, D. A., & Zimmerman, G. B. 1988, Physics of Fluids, 31, 3059, doi: 10.1063/1.866963
- Movshovitz et al. (2010) Movshovitz, N., Bodenheimer, P., Podolak, M., & Lissauer, J. J. 2010, Icarus, 209, 616, doi: 10.1016/j.icarus.2010.06.009
- Müller et al. (2020) Müller, S., Helled, R., & Cumming, A. 2020, A&A, 638, A121, doi: 10.1051/0004-6361/201937376
- Ormel et al. (2021) Ormel, C. W., Vazan, A., & Brouwers, M. G. 2021, A&A, 647, A175, doi: 10.1051/0004-6361/202039706
- Owen & Encrenaz (2003) Owen, T., & Encrenaz, T. 2003, Space Sci. Rev., 106, 121, doi: 10.1023/A:1024633603624
- Perri & Cameron (1974) Perri, F., & Cameron, A. G. W. 1974, Icarus, 22, 416, doi: 10.1016/0019-1035(74)90074-8
- Pollack et al. (1996) Pollack, J. B., Hubickyj, O., Bodenheimer, P., et al. 1996, Icarus, 124, 62, doi: 10.1006/icar.1996.0190
- Pollack et al. (1986) Pollack, J. B., Podolak, M., Bodenheimer, P., & Christofferson, B. 1986, Icarus, 67, 409, doi: 10.1016/0019-1035(86)90123-5
- Pringle (1981) Pringle, J. E. 1981, ARA&A, 19, 137, doi: 10.1146/annurev.aa.19.090181.001033
- Safronov (1972) Safronov, V. S. 1972, Evolution of the protoplanetary cloud and formation of the earth and planets. (Translated from Russian. Israel Program for Scientific Translations, 212 p. Keter Publishing House, Jerusalem)
- Saumon et al. (1995) Saumon, D., Chabrier, G., & van Horn, H. M. 1995, ApJS, 99, 713, doi: 10.1086/192204
- Seiff et al. (1998) Seiff, A., Kirk, D. B., Knight, T. C. D., et al. 1998, Journal of Geophysical Research: Planets, 103, 22857, doi: 10.1029/98JE01766
- Stevenson (1982) Stevenson, D. J. 1982, Planet. Space Sci., 30, 755, doi: 10.1016/0032-0633(82)90108-8
- Stevenson (1990) —. 1990, Origin of the Earth (Oxford University Press , New York), 231–249
- Stevenson (2020) —. 2020, Annual Review of Earth and Planetary Sciences, 48, 465, doi: 10.1146/annurev-earth-081619-052855
- Vazan et al. (2018) Vazan, A., Helled, R., & Guillot, T. 2018, A&A, 610, L14, doi: 10.1051/0004-6361/201732522
- Vazan et al. (2016) Vazan, A., Helled, R., Podolak, M., & Kovetz, A. 2016, ApJ, 829, 118, doi: 10.3847/0004-637X/829/2/118
- Vazan et al. (2013) Vazan, A., Kovetz, A., Podolak, M., & Helled, R. 2013, MNRAS, 434, 3283, doi: 10.1093/mnras/stt1248
- Wahl et al. (2017) Wahl, S. M., Hubbard, W. B., Militzer, B., et al. 2017, Geophys. Res. Lett., 44, 4649, doi: 10.1002/2017GL073160
- Wilson & Militzer (2012) Wilson, H. F., & Militzer, B. 2012, Phys. Rev. Lett., 108, 111101, doi: 10.1103/PhysRevLett.108.111101
- Wuchterl (1993) Wuchterl, G. 1993, Icarus, 106, 323, doi: 10.1006/icar.1993.1174