Exploring the physical properties of lensed star-forming clumps at
Abstract
We study the physical properties (size, stellar mass, luminosity, star formation rate) and scaling relations for a sample of 166 star-forming clumps with redshift . They are magnified by the Hubble Frontier Field galaxy cluster MACS J0416 and have robust lensing magnification () computed by using our high-precision lens model, based on 182 multiple images. Our sample extends by times the number of spectroscopically-confirmed lensed clumps at . We identify clumps in ultraviolet continuum images and find that, whenever the effective spatial resolution (enhanced by gravitational lensing) increases, they fragment into smaller entities, likely reflecting the hierarchically-organized nature of star formation. Kpc-scale clumps, most commonly observed in field, are not found in our sample. The physical properties of our sample extend the parameter space typically probed by field observations and simulations, by populating the low mass (M M⊙), low star formation rate (SFR M⊙ yr-1), and small size (R pc) regime. The new domain probed by our study approaches the regime of compact stellar complexes and star clusters. In the mass-size plane, our sample spans the region between galaxies and globular clusters, with a few clumps in the region populated by young star clusters and globular-clusters. For the bulk of our sample, we measure star-formation rates which are higher than those observed locally in compact stellar systems, indicating different conditions for star formation at high redshift than in the local Universe.
keywords:
galaxies:star clusters – galaxies:formation – galaxies:evolution – galaxies:high-redshift1 Introduction
Investigating galaxies at sub-kpc scales is an essential step to understand the mechanisms that drive galaxy formation and evolution in the early Universe. Currently, resolving structures at sub-kpc scales at high redshift is hardly achievable with deep ground-based adaptive optics (AO) or space-based observations. Conversely, the combination of deep, high-resolution imaging and spectroscopic observations performed on gravitationally lensed targets enhances the resolving power and enables us to reveal sub-kpc structures and their physical properties at cosmological distances (e.g., Livermore et al., 2012; Adamo et al., 2013; Livermore et al., 2015; Vanzella et al., 2016, 2017a; Rigby et al., 2017; Dessauges-Zavadsky et al., 2017; Johnson et al., 2017; Cava et al., 2018; Dessauges-Zavadsky et al., 2019; Rivera-Thorsen et al., 2019; Vanzella et al., 2019, 2021b; Bouwens et al., 2021; Iani et al., 2021).
In the last few decades, different studies revealed that high-redshift star-forming galaxies (SFGs, ) have a clumpy morphology, which differs from the spiral-like structure of most star-forming galaxies in the local Universe (e.g Cowie et al., 1995; Elmegreen et al., 2005, 2007; Conselice, 2014). High-redshift clumps have masses , sizes , and usually they are characterized by a high star-formation rate (e.g., Elmegreen et al., 2009; Jones et al., 2010; Genzel et al., 2011; Guo et al., 2012; Murata et al., 2014; Zanella et al., 2015; Shibuya et al., 2015; Guo et al., 2018; Zanella et al., 2019). Currently, the clumpy morphology of high-redshift galaxies has been explained with two formation scenarios: a) in situ, the galaxy gas-rich disc fragments due to gravitational instability giving rise to massive star-forming regions (e.g., Noguchi, 1999; Bournaud et al., 2008; Dekel et al., 2009; Hinojosa-Goñi et al., 2016) or, b) ex situ, galaxies undergo a merger process during which the satellite is stripped and its nucleus appears as a massive clump (e.g Somerville et al., 2000; Hopkins et al., 2008; Puech, 2010; Straughn et al., 2015; Ribeiro et al., 2017).
However, it is still unclear what is the relative contribution of these two channels to clumpy star formation. The number of galaxies with clumpy morphology is higher than the expected merger rate among systems at high redshift, which makes it difficult to justify the formation of clumps through merging scenario alone (e.g Dekel et al., 2009; Hopkins et al., 2010). Furthermore, some clumps with young ages () have been reported (Förster Schreiber et al., 2011; Zanella et al., 2015), as expected for clumps originating from disk fragmentation (Bournaud, 2016). Observational studies targeting galaxies suggests that % of clumps have an in-situ origin, whereas the remaining ones have older ages and larger sizes and masses, consistent with being remnants of stripped satellites (Zanella et al., 2019).
Also the fate of clumps is still unclear and the results from simulations are highly dependent on the adopted assumptions (e.g., initial gas fraction of the disks, feedback recipes, Fensch & Bournaud 2021). Hydrodynamical simulations presented in e.g. Murray et al. (2010); Genel et al. (2012); Tamburello et al. (2015); Oklopčić et al. (2017); Buck et al. (2017) suggest that massive clumps have a lifetime of , as stellar feedback quickly disrupts them, while less massive clumps tend to merge with more massive ones. Conversely, Bournaud et al. (2014); Ceverino et al. (2010); Mandelker et al. (2014, 2017) predict that massive clumps can survive a few hundred Myr, until they merge with the galaxy bulge.
Simulations predict that the kpc-size clumps, which are typically observed in blank fields, have substructures which are blended and remains undetected due to the lack of resolution (e.g Meng & Gnedin, 2020; Behrendt et al., 2016; Tamburello et al., 2015). Indeed, recent observations of strongly lensed systems at reveal the existence of clumps with sizes of (Livermore et al., 2012, 2015; Cava et al., 2018), down to (Rigby et al., 2017; Johnson et al., 2017) in some extremely magnified cases. Our previous studies (Vanzella et al., 2017b, 2019, 2020, 2021a; Calura et al., 2021) have further extended this work to spectroscopically confirmed compact stellar structures, with sizes down to , which are interpreted as young massive clusters and/or globular cluster precursors at (see also Bouwens et al. 2021). This demonstrates the importance of gravitational lensing to explore compact stellar structures considered as building blocks of high-redshift star-forming galaxies.
Global relations among different physical properties (e.g., effective radius, stellar mass, star-formation rate (SFR)), as well as their redshift evolution, are widely used to understand the nature and evolution of galaxies and smaller stellar systems (i.e Kormendy, 1977; Bender et al., 1992; Bernardi et al., 2003; Kormendy et al., 2009; Misgeld & Hilker, 2011; Norris et al., 2014; Shibuya et al., 2015).
In this work, we analyze the physical properties and scaling relations of clumps hosted by galaxies , which are gravitationally lensed by the Hubble Frontier Field (HFF) galaxy cluster MACS J0416.1-2403 (hereafter MACS J0416). The paper is organized as follows: Section 2 describes the data used in this work and the methodology used to select lensed clumps. Section 3 explains how structural and photometric parameters are measured and physical properties of the clumps are inferred. Section 4 compares the physical properties of the MACS J0416 sample with results from previous observations and simulations. In Section 5, we present the mass - SFR, size - SFR and mass - stellar surface density relations for our clumps sample. Finally in Section 6, we summarize our results and conclusions. Throughout the paper we adopt a flat CDM cosmology with , , and . All magnitudes are AB magnitudes (Oke, 1974), we adopt a Salpeter (1955) stellar initial mass function and all measured physical parameters for our sample are corrected for lensing magnification unless differently stated.
2 Data set and sample selection
2.1 Data and lens model
Deep, multi-wavelength observations are publicly available in the MACS J0416 field. This work is mainly based on HST/ACS F814W and HST/WFC3 F105W 30mas images (Lotz et al., 2017; Koekemoer et al., 2014) used for measuring structural parameters and ASTRODEEP PSF matched images HST/ACS F435W, F606W, F814W and HST/WFC3 F105W, F125W, F140W, F160W (Merlin et al., 2016a), used for photometry and VLT-HAWKI/Ks imaging (Brammer et al., 2016).
Excellent spectroscopic coverage of this field, which is a critical component of this work since it affects the accuracy and precision of the lens model, is based on deep VLT/MUSE integral field spectroscopic observations. Details on the MUSE observations and data reduction are described in Vanzella et al. 2021b (V21). Building on and extending the previous study of Caminha et al. 2017; Richard et al. 2021, V21 also presented redshift measurements by identifying 48 background galaxies at , which are lensed into 182 bona-fide multiple images. The positions of these lensed sources, all spectroscopically confirmed, were used to constrain the strong lensing model in this work, which is described in Bergamini et al. 2021 (B21). Such an unprecedented large number of bona-fide multiple images, combined with a highly complete sample of cluster galaxies (80% of which are spectrosopically confirmed) and MUSE-based measurements of the internal velocity dispersion of 64 cluster galaxies (down to 5 magnitudes fainter than the BCG), led to an accurate reconstruction of the mass distribution of MACS J0416. The lens model is characterized by an r.m.s. displacement between the 182 observed and model-predicted image positions of only 0.40″. The accurate magnification values which can be derived with the B21 lens model, with quantifiable statistical errors in different magnification regimes, particularly in the vicinity of critical lines (see B21), are used in this work to infer robust intrinsic properties of high-z lensed sources.
The average magnification () of each clump presented in this work is evaluated from magnification maps, derived with the B21 lens model. The is calculated using a small aperture of pixels (since our sources are compact), where the evaluated is compatible with the magnification of a point-like source.
2.2 Clumps identification
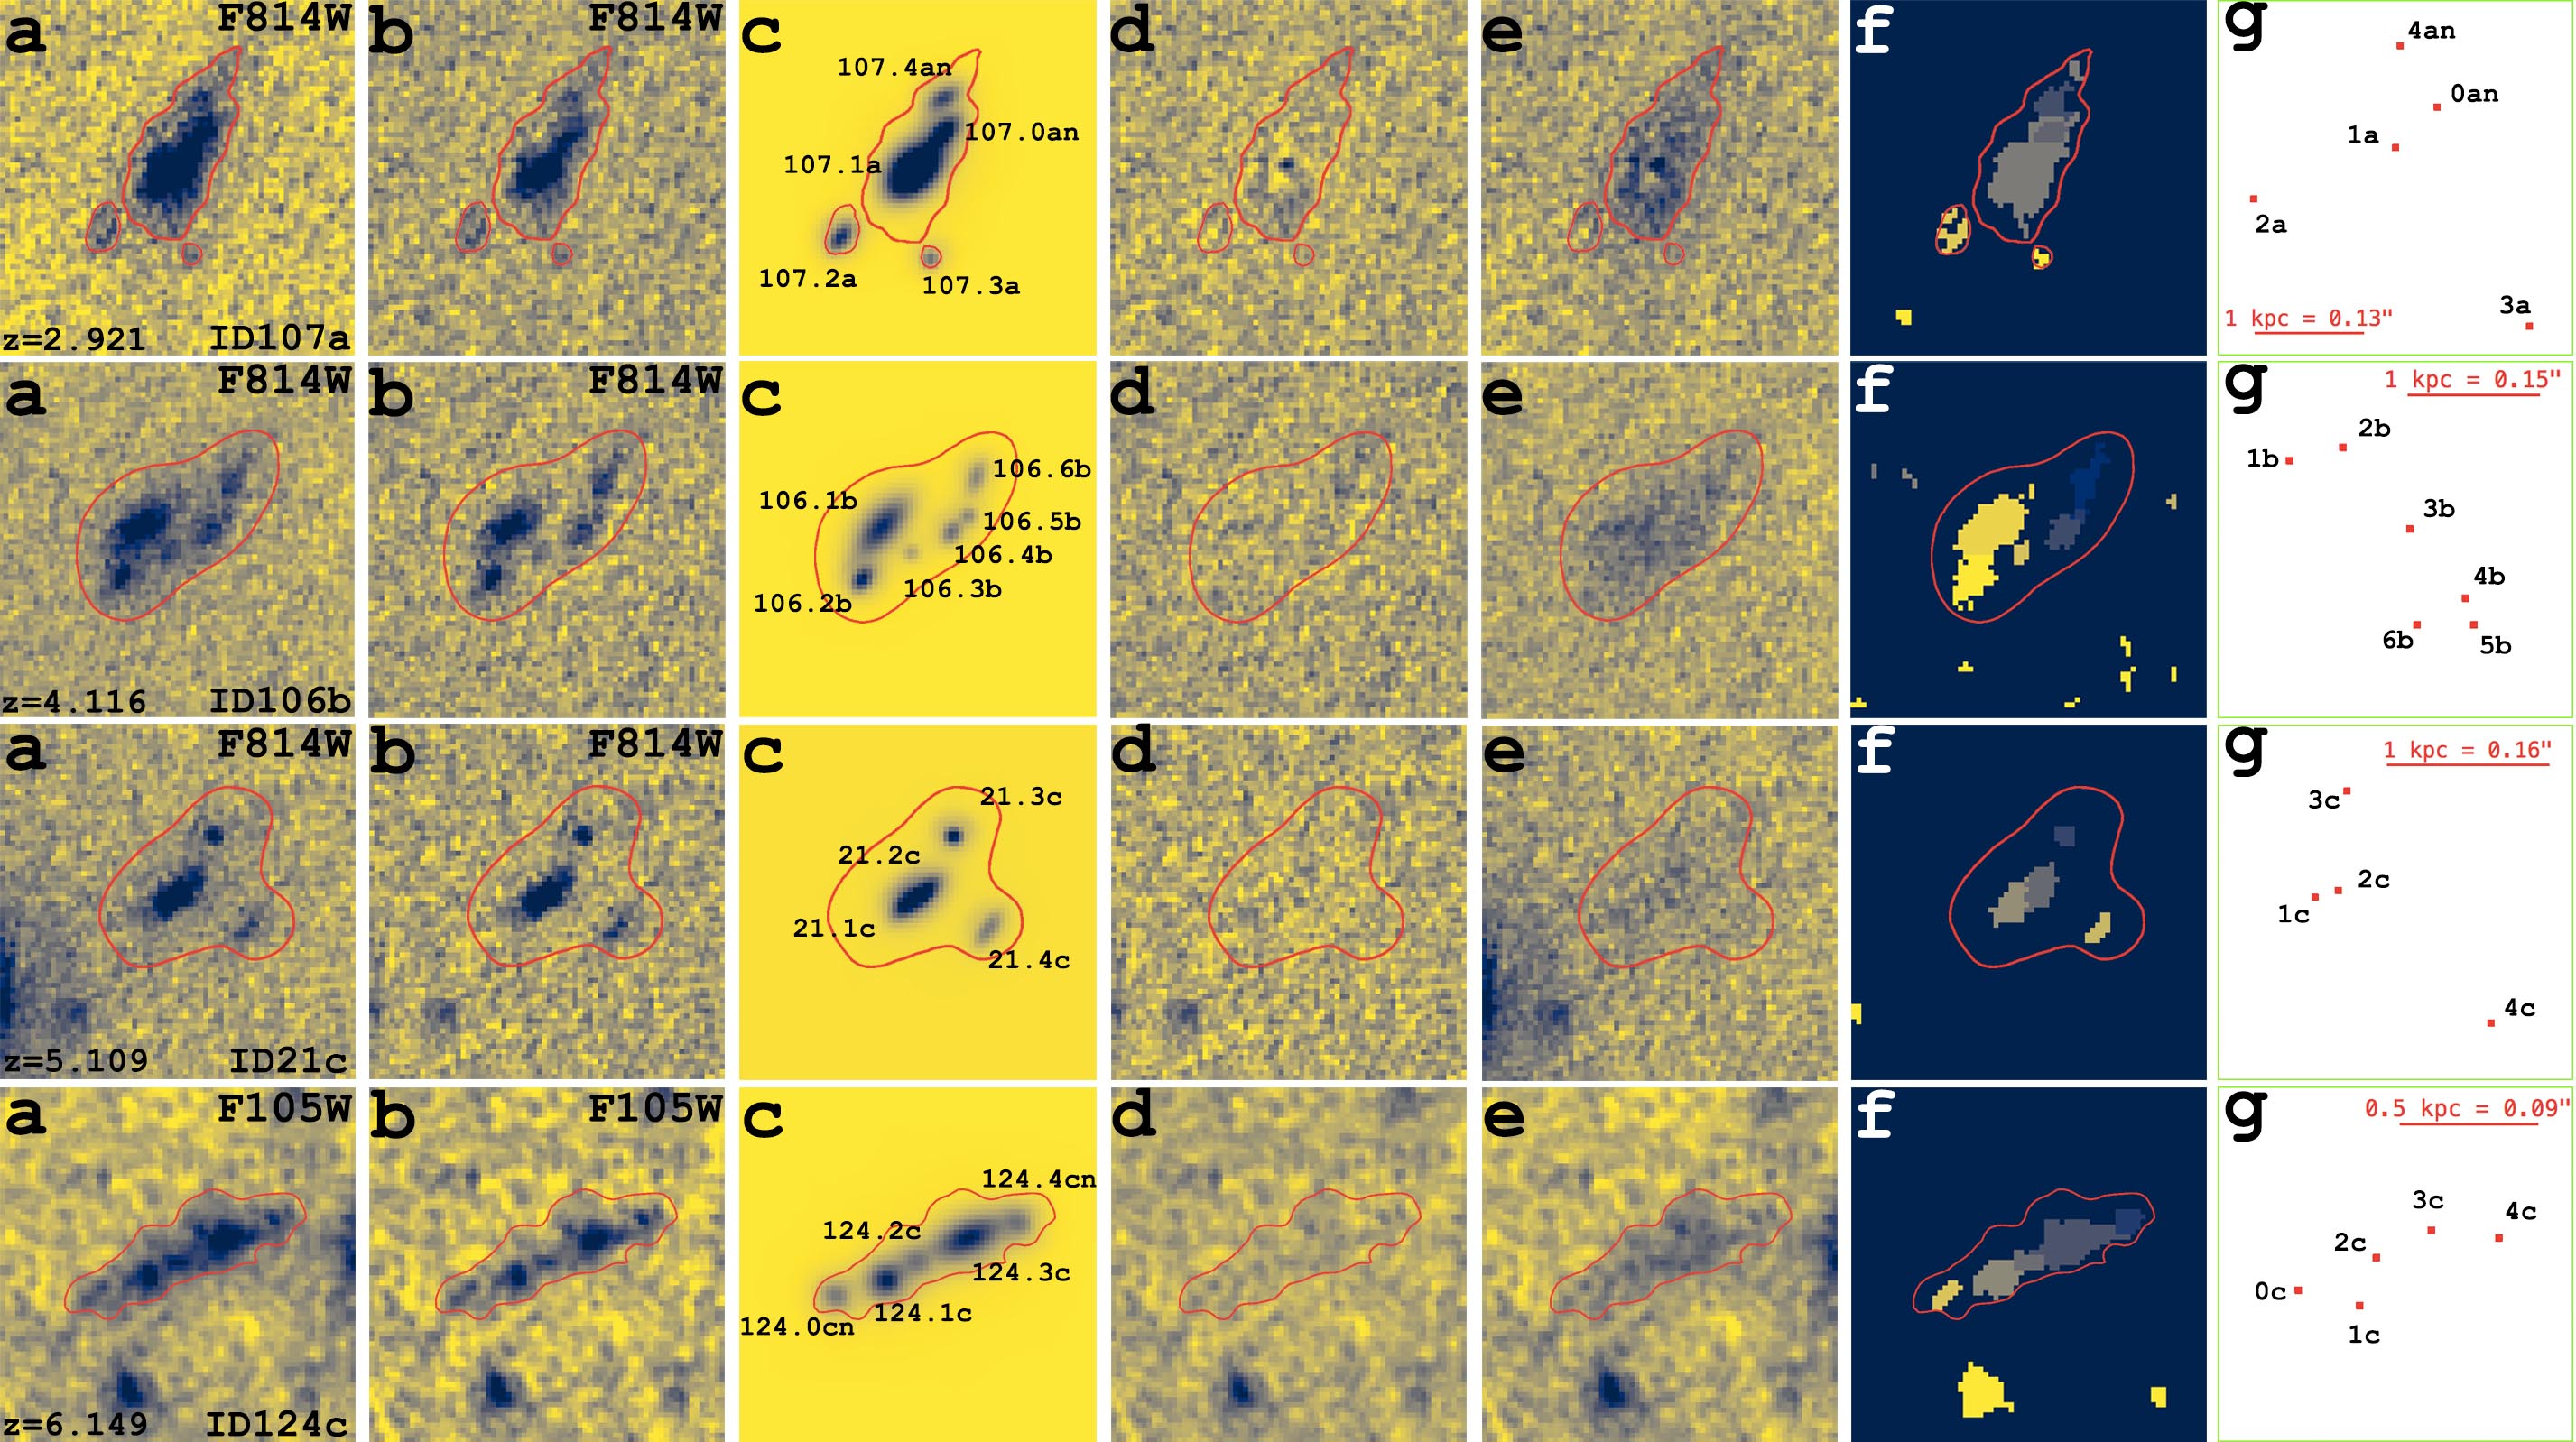
We applied the following procedure to identify clumps and deblend their emission from that of the underlying diffuse host galaxy, as well as the contamination from nearby bright objects and intracluster light. We considered cutouts of , centered on each of the sources reported in the catalogue by Vanzella et al. (2021b). With the IRAF (Tody, 1986) task MEDIAN, we smooth each image with a boxcar filter. We subtract the smooth image from the original cutout to obtain a contrast enhanced image. We then use these new cutouts to detect clumps both visually and automatically with SExtractor (v2.24) (SE, Bertin & Arnouts, 1996). During this process, it is key to select the appropriate smoothing box size, as the host light will be over-subtracted or under-subtracted if the box is too small or too large, respectively. For our purposes, a good compromise was achieved with box sizes times larger than each source. In most cases, the smoothing box size was 21 – 31 pixels111An example of such a light removal procedure is shown in Figure 3 (e).. Such a procedure has been used in the literature to study clumps in field galaxies (Guo et al., 2015) as well as to remove the contamination of the host galaxy halo before modelling ultra-compact dwarfs (Norris & Kannappan, 2011).
2.3 Final clumps sample
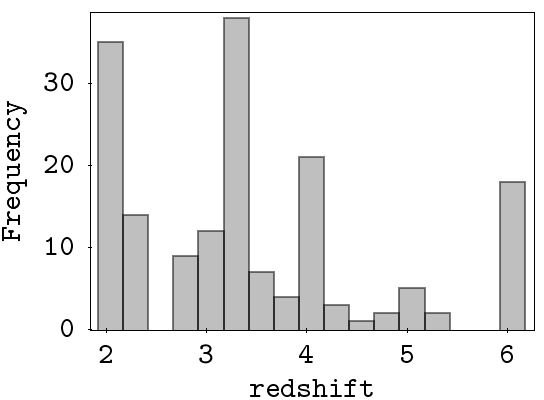
Our final sample consists of 67 systems (48 of them showing multiple images), and in total 166 clumps have been detected. We define a "clump" as any compact source detected in the contrast images described in Section 2.2. All the clumps in our sample have spectroscopic redshifts based on MUSE deep observations (Caminha et al., 2017; Vanzella et al., 2021b; Richard et al., 2021) and spans the redshift range .
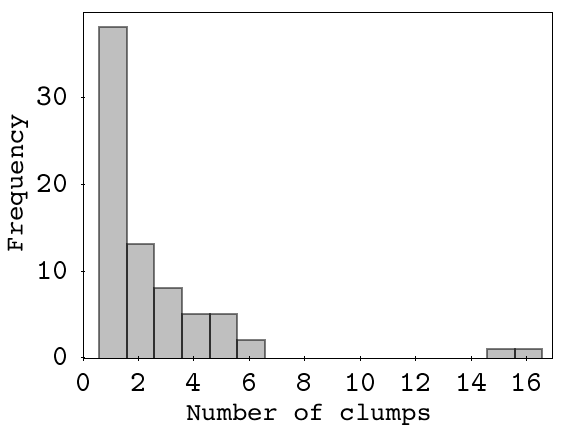
In Figure 1, we show the redshift distribution of all clumps and the number of detected clumps per system. The peaks visible in Figure 1 (upper panel) at and 6 are the combination of two effects: (1) multiple clumps have the same redshift because hosted in the same galaxy; (2) there are galaxies at the same redshift possibly belonging to a physical larger structure. However, the limited sky coverage currently provided by MUSE ( FoV) in combination with a reduced effective area probed in the gravitational lens field (lensing cross section) is not sufficient to characterize possible Mpc-scale structure associated to the selected clumps.
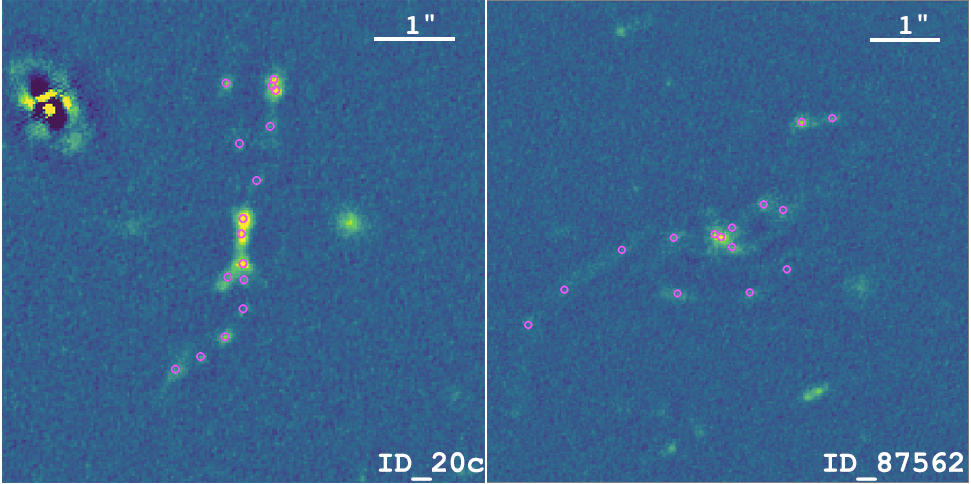
We find in most of the cases 1–2 clumps per system as shown in Figure 1 (bottom panel). In our sample there are also two systems hosting 15 and 16 clumps. The system ID20c with the highest number of detected clumps (16), at , has an irregular shape, with five clumps located in the central region (Figure 2 left). While the other system, ID87562, is a face-on spiral galaxy with 15 detected clumps at redshift . The majority of the clumps are presumably star-forming regions located in the spiral arms of the hosting galaxy (Figure 2 right).
3 Measuring clump properties
3.1 Clump structural parameters
To measure the structural properties of clumps, we use the HST F814W and F105W bands, as they offer the best compromise in terms of spatial resolution (FWHM PSF (F814W) and (F105W), pixel scale 0.03 arcsec/pixel) and depth (limiting AB magnitude ). Such images probe rest-frame Å at . In particular, we use the F105W-band for sources at , where the Ly-break (Å) enters the F814W filter.
We run SExtractor (SE, Bertin & Arnouts, 1996) on the contrast enhanced images (as mentioned in Section 2.2) to create a segmentation map, to identify the clumps and to obtain initial guesses of their structural parameters (e.g. coordinates, half-light radius, ISO magnitude, AUTO magnitude, circular aperture magnitude, as well as related uncertainties). We use these values as initial guesses for the two-dimensional modelling of the clump light profiles that we perform with the GALFIT (v3.0.7) tool (Peng et al., 2002, 2010). When multiple clumps in a single galaxy are present, we model them one at a time, using the segmentation to unmask the clump of interest. When clumps are faint and/or positioned near other bright sources, SExtractor is not converging to a reasonable segmentation image and therefore we provide manually the initial parameters for the GALFIT modelling, after visual inspection. This happened for clumps (9% of the sample). Such a procedure produces good results and convergence. We consider a fit as successful when the residual two-dimensional map (obtained by subtracting the model from the input image) is smooth (i.e., no structures are detectable) and the normalized residuals (obtained by normalizing the residuals map by the input image) are smaller than 20% on average. An example of SExtractor segmentation and GALFIT modeling is shown in Figure 3, where we also show (in panel g) the predicted positions of each clump on the source plane obtained from our lens model. By converting angular separation among the clumps into physical distances, we note that some clumps are less than 100pc apart, while their parent systems extend over 1-2 kpc.
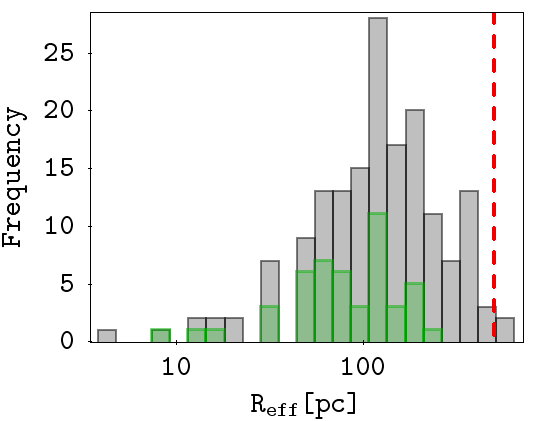
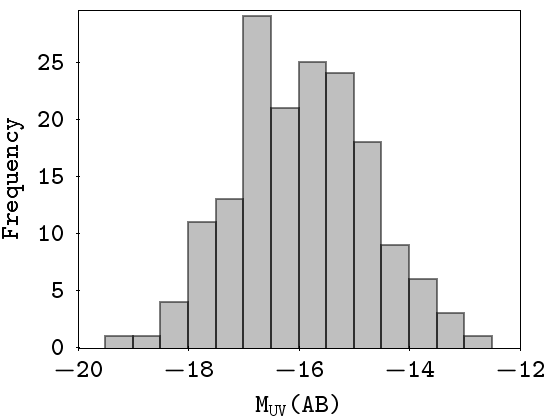
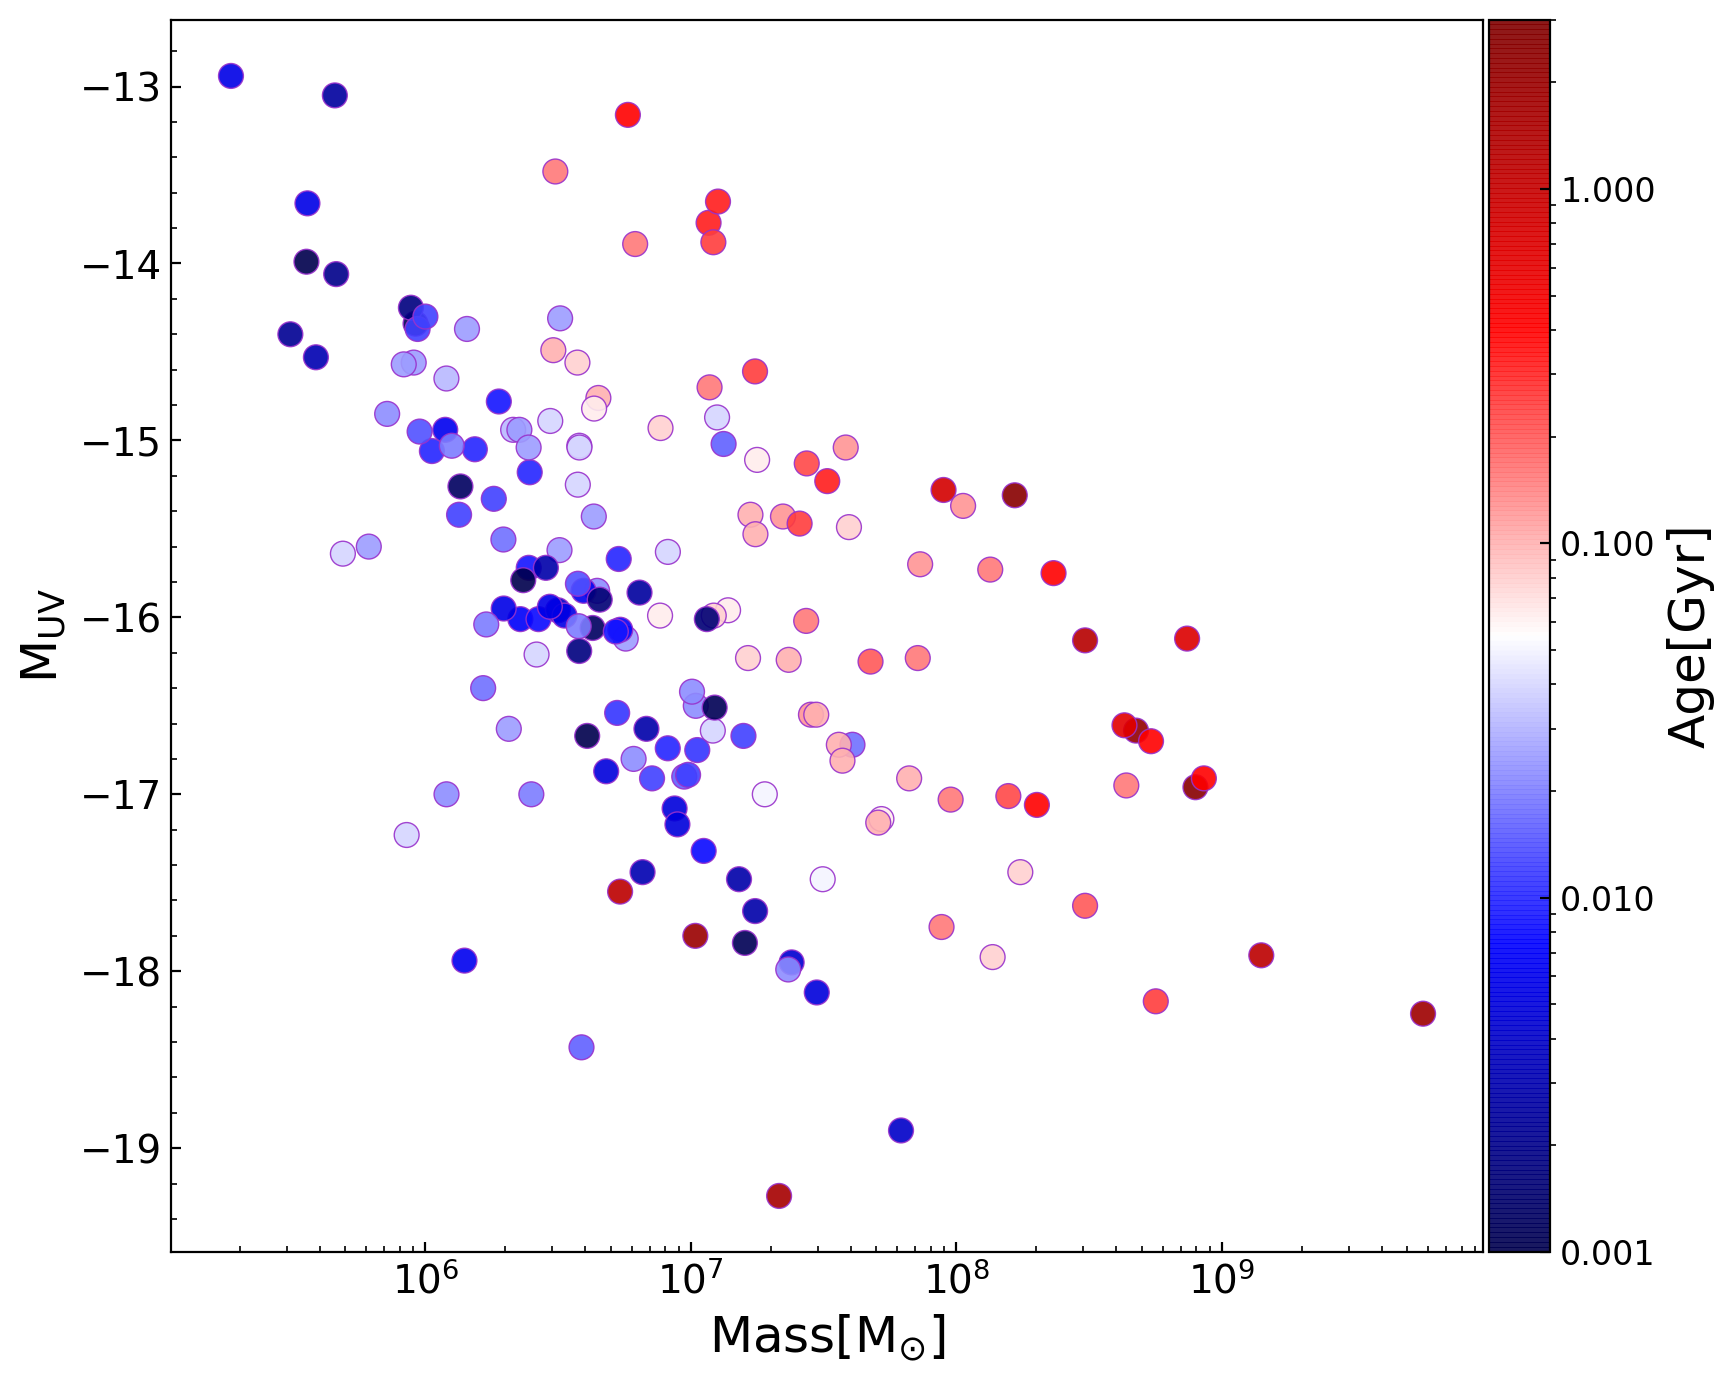
To model the surface brightness of the clumps, we consider Sérsic profiles with indexes (Gaussian profile) or 1 (exponential profile)222Higher values of do not change the resulting solution significantly and leaving as a free parameter for faint knots typically weaken the convergence of the process. Either index value is used based on the quality of residual image produced by GALFIT. In 28 cases GALFIT modelling could not converge and we used a PSF profile instead. This happened for faint, compact clumps. In the cases where the PSF model was used, we set an upper limit on the effective radius equal to the half-width-half-maximum of the PSF. Finally, when the Gaussian or exponential model provide a solution with pixel, the clump effective radius is considered as an upper limit and set to 1 pixel (corresponding to 30 mas). The distribution of effective radii and rest-frame absolute UV magnitudes (MUV) for the entire sample are presented in Figure 4.
3.2 Photometric measurements
Photometric measurements on confirmed clumps were performed using the data reduced by the ASTRODEEP collaboration (Merlin et al., 2016a; Castellano et al., 2016), where the intracluster light and the brightest cluster members are subtracted and all images are PSF-matched, and then the photometric tool A-PHOT (Merlin et al., 2019) is utilized. Specifically, first, we identify the subsample of clumps in common with the ASTRODEEP published catalog (Merlin et al., 2016a; Castellano et al., 2016), in particular those showing a clean detection, not contaminated by nearby sources (37 objects). We refer to this sample as category 1 and rely on the public photometric catalog for what concerns their SEDs. For this category, SEDs have multi-band coverage including VLT-HAWKI/Ks and IRAC channels 1 and 2. The remaining objects in our sample are not present in the ASTRODEEP catalog, because they are too faint or not individually detected on larger images. For these cases we perform our own photometric extraction, including the HAWKI/Ks band (excluding the IRAC photometry, whose PSF is too large). For the HST photometric measurements, we use previously PSF-matched images (Merlin et al., 2016a) observed in seven HST broadband filters F435W, F606W, F814W, F105W, F125W, F140W, F160W. We perform circular aperture photometry for all clumps of the sample with an aperture of in diameter, which is slightly larger than the PSF FWHM of PSF-matched images () but small enough to still capture the clumps analysed in this work. In this way the colors are preserved. Subsequently, each SED is aperture-corrected (AC) by rescaling it to the total GALFIT magnitude in the same reference band. AC values spans the interval , depending on the compactness of the object (the more compact the smaller the correction).
To include the HAWKI/Ks band, the sample is further split into two categories: a sample of clumps for which no A-PHOT signal is detected in the Ks band within an aperture of diameter, SNR5 (dubbed as category 2, 78 objects) and the remaining subset with a Ks-band detection, SNR5 (dubbed as category 3, 51 objects). In case of category 2, upper limits are used for the Ks band, whereas for category 3 an estimate of the total Ks magnitude is obtained with GALFIT after fixing all the structural parameters (except the magnitude) previously defined in the reference band for the same clump. This procedure is similar to the one adopted by Merlin et al. (2016a) with the T-PHOT tool, (Merlin et al., 2015, 2016b) which uses analytical models as priors.
Summarizing, category 1 benefits from the available ASTRODEEP photometry. Categories 2 and 3 include those clumps not detected in ASTRODEEP, which are respectively undetected or detected in the Ks band.
3.3 Clump physical properties
The physical properties (star-formation rate, mass, age) of the sample are derived by using the SED-fitting technique described in Castellano et al. (2016), however in our case we allow for ages as young as 1 Myr, extending the original ASTRODEEP analysis. The most relevant physical properties for this work are shown in Table 1 (full version is available in electronic form).
In brief, the physical properties of the clumps are computed by fitting Bruzual &
Charlot (2003) (BC03) templates with the zphot.exe code (Fontana
et al., 2000) at the spectroscopic redshift.
In the BC03 fit, we assume exponentially declining star-formation histories with e-folding time 0.1 15.0Myr, a Salpeter (1955) initial mass function and we use both Calzetti et al. (2000) and Small Magellanic Cloud (Prevot et al., 1984) extinction laws.
Absorption by the intergalactic medium (IGM) is modeled following Fan et al. (2006).
We consider the following range of physical parameters: , Age Myr (defined as the onset of the star-formation episode), metallicity .
We fit all the sources including the contribution from nebular continuum and line emission following Schaerer & de
Barros (2009) under the assumption of an escape fraction of ionizing photons (see also Castellano
et al., 2014, for details).
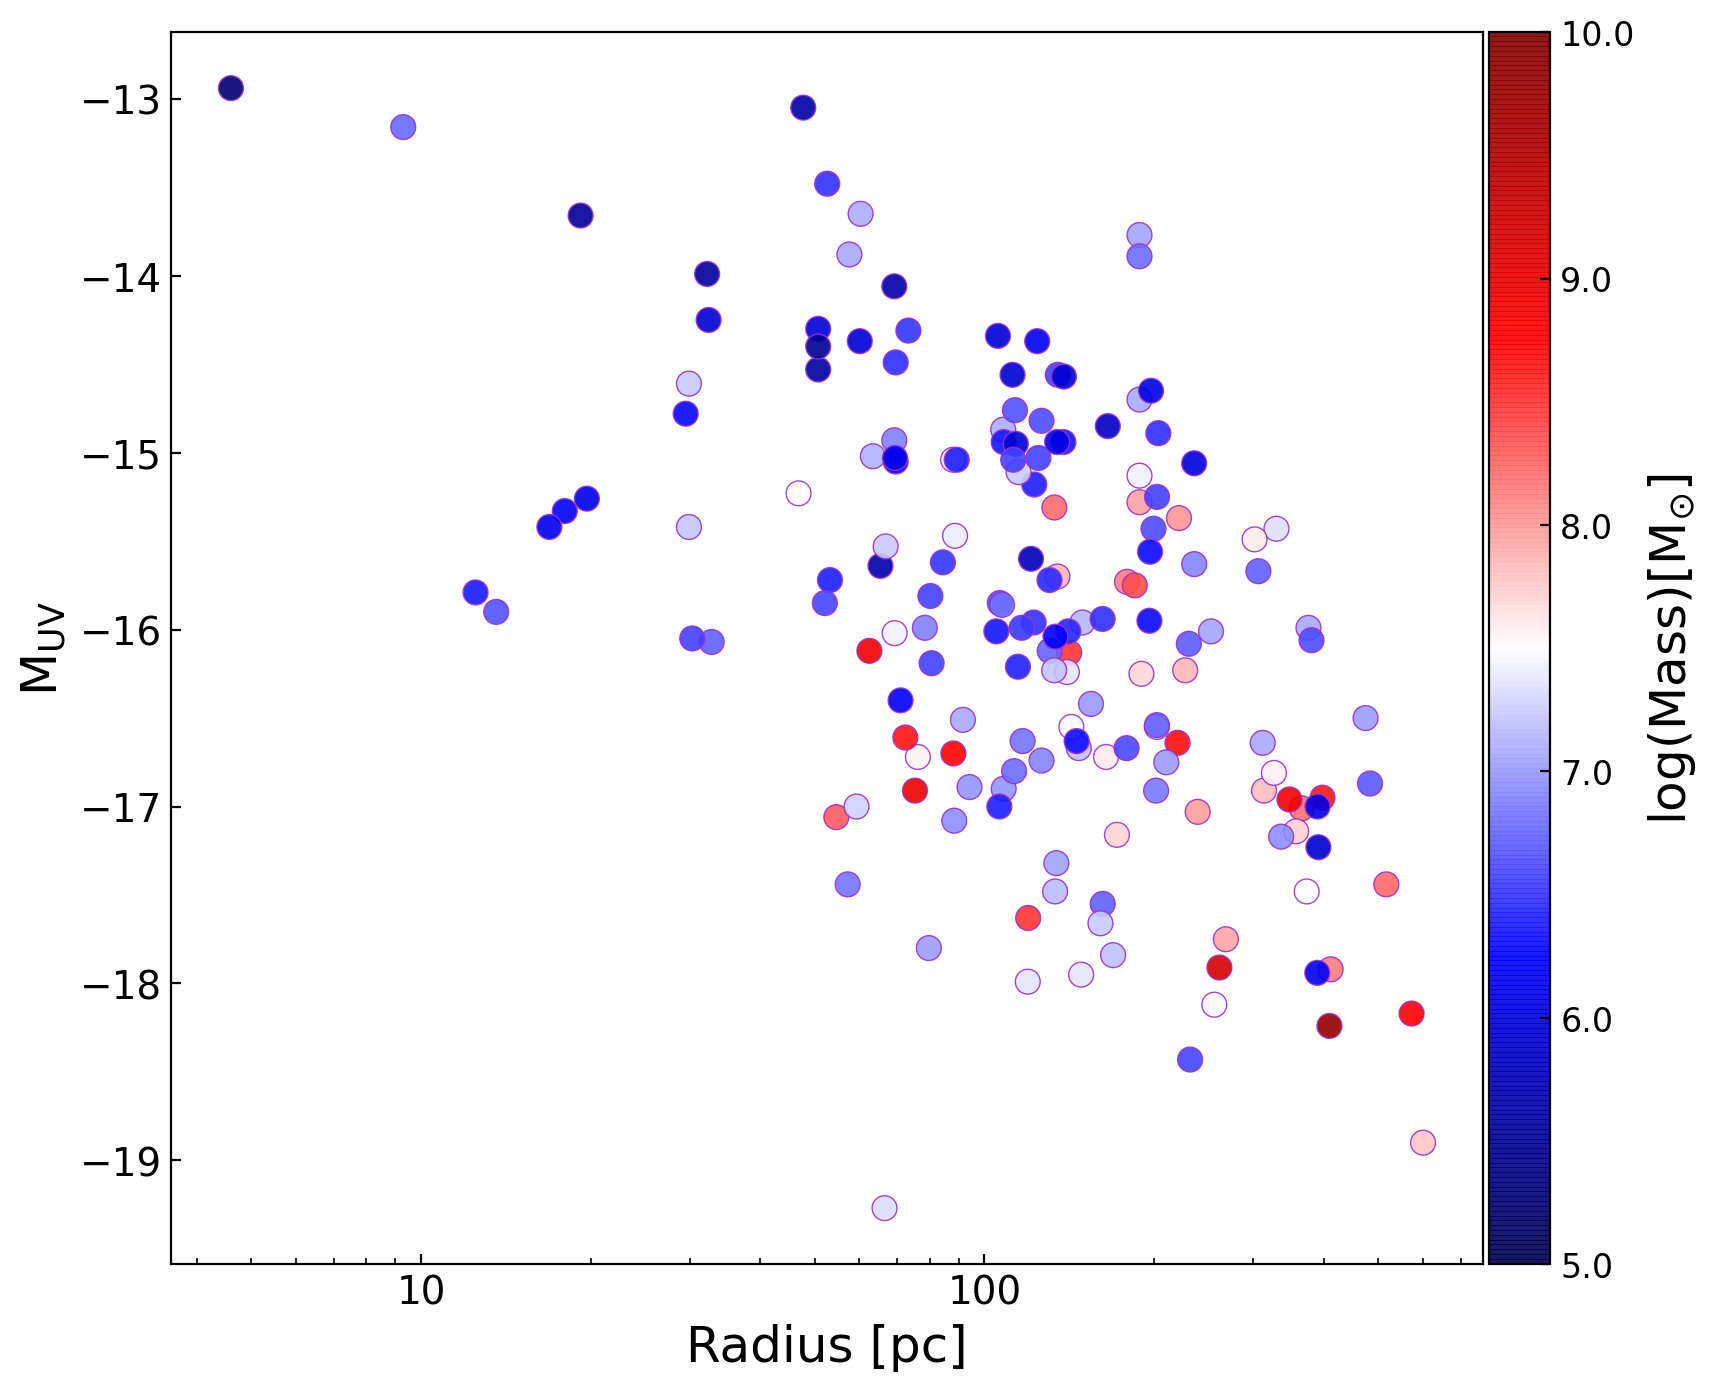
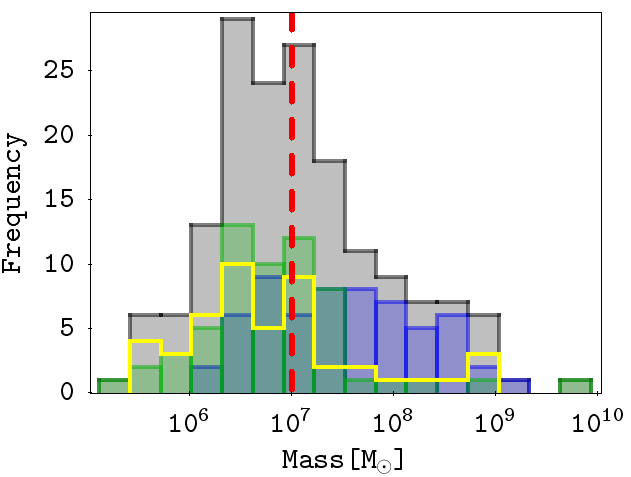
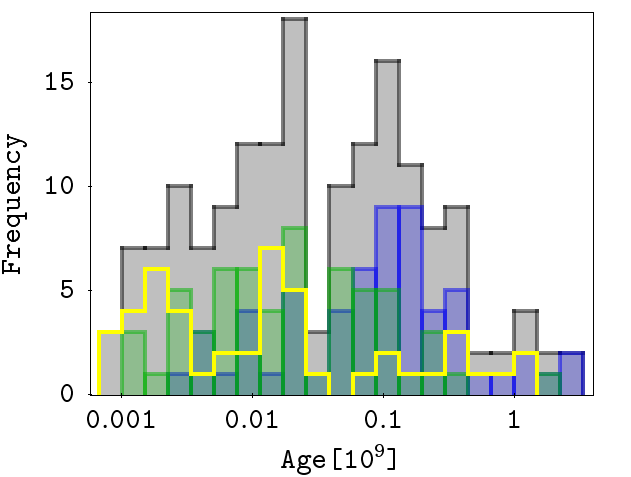
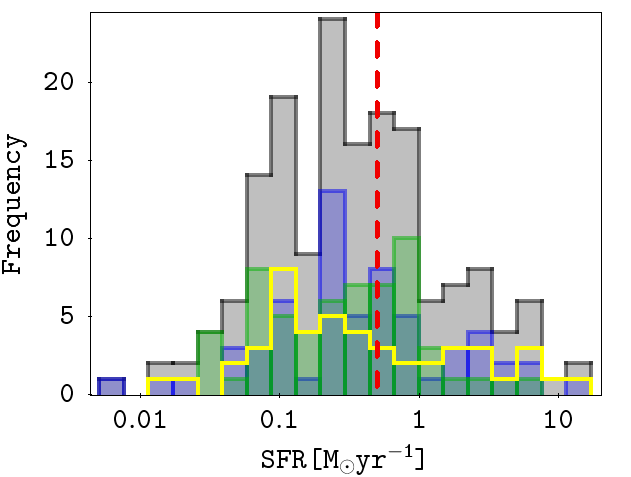
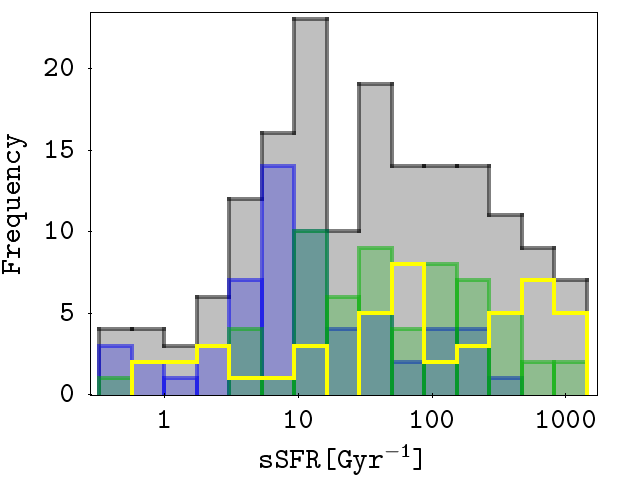
The physical properties derived by SED fitting are summarized in Figure 5 and 6. The clumps in our sample have stellar masses in the range M⊙, star formation rates SFR yr-1, ages 1 Myr - 2.6 Gyr, and specific star formation rate sSFR Gyr-1. Clumps in the lowest redshift bin () seem to be on average dex more massive and dex older than higher redshift clumps. They also have a dex lower sSFR. No clear evolution of SFR with redshift is observed (Figure 6).
| ID1 |
|
|
|
|
|
|
6 | 7 | Category8 | |||||||||||||
|---|---|---|---|---|---|---|---|---|---|---|---|---|---|---|---|---|---|---|---|---|---|---|
| 9.1a (1485) | 64.04511 | -24.07235 | 3.290 | -17.7 | 161 | 4.2 | 2.8 | 1 | ||||||||||||||
| 31.1c | 64.02341 | -24.07609 | 4.125 | -17.2 | 172 | 3.5 | 2.5 | 2 | ||||||||||||||
| 36.1c | 64.02408 | -24.08090 | 1.963 | -17.1 | <55 | 6.0 | 4.6 | 3 | ||||||||||||||
| … | … | … | … | … | … | … | … | … | … | … |
Notes: All physical parameters and uncertainties in the table are corrected for lensing magnification , adopting the magnification reported in column #9 and in column #10 for the Size (column #6) . The full Table is available in electronic form.
1 Clump ID, for clumps from category 1 ASTRODEEP ID is in the brackets.
2 Absolute UV rest-frame magnitude.
3 Half light radius, Reff.
4 Stellar mass derived from SED fitting. Quoted uncertainties are 16 and 84 percentile range from SED fitting.
5 Star formation rate derived from SED fitting. Quoted uncertainties are 16 and 84 percentile range from SED fitting.
6 Average magnification (Bergamini et al., 2021).
7 Tangential magnification (Bergamini et al., 2021).
8 Category of the clump (see the text for explanation).
3.4 From observed to intrinsic properties and error propagation
In order to investigate the intrinsic properties of a lensed objects (in our case clumpy structures located in galaxies), it is crucial to have a robust cluster lens model and spectroscopic redshifts. Only in this case we can properly correct for lensing magnification the measured properties (i.e. magnitudes, size, SFR, masses).
In this work, after measuring the half-light radius (Reff) for each clump in pixels (as described in 3.1), the given values are translated to physical sizes (in parsec) and corrected for magnification. In this case, we use the tangential component of the magnification, , since images near the tangential critical line are mostly elongated tangentially. On the other hand, the observed magnitudes, measured with GALFIT, are corrected for the average magnification to obtain the intrinsic magnitudes , and further converted to absolute magnitudes (rest frame). Other physical properties (mass and SFR), discussed in this work are derived from SED fitting and their values and associated uncertainties are corrected for the average magnification. The uncertainties on the magnification (adopted from Bergamini et al., 2021) and from SED fitting are added in quadrature to obtain the total uncertainties.
To evaluate the robustness of the measured sizes and magnitudes and their uncertaintieswe adopted an approach similar to the one described in (APPENDIX A, Vanzella et al., 2017b). We use the routines from the SkyLens package (Meneghetti et al., 2008, 2017; Plazas et al., 2019) implemented in the new Forward Modeling (FM, Bergamini et al., 2021; Meneghetti, 2021) python code to create mock HST observations of stellar clumps of different sizes and intrinsic magnitudes. The simulated images also include a noise level (assumed to be Poisson-like) mimicking the real observations in F105W band.
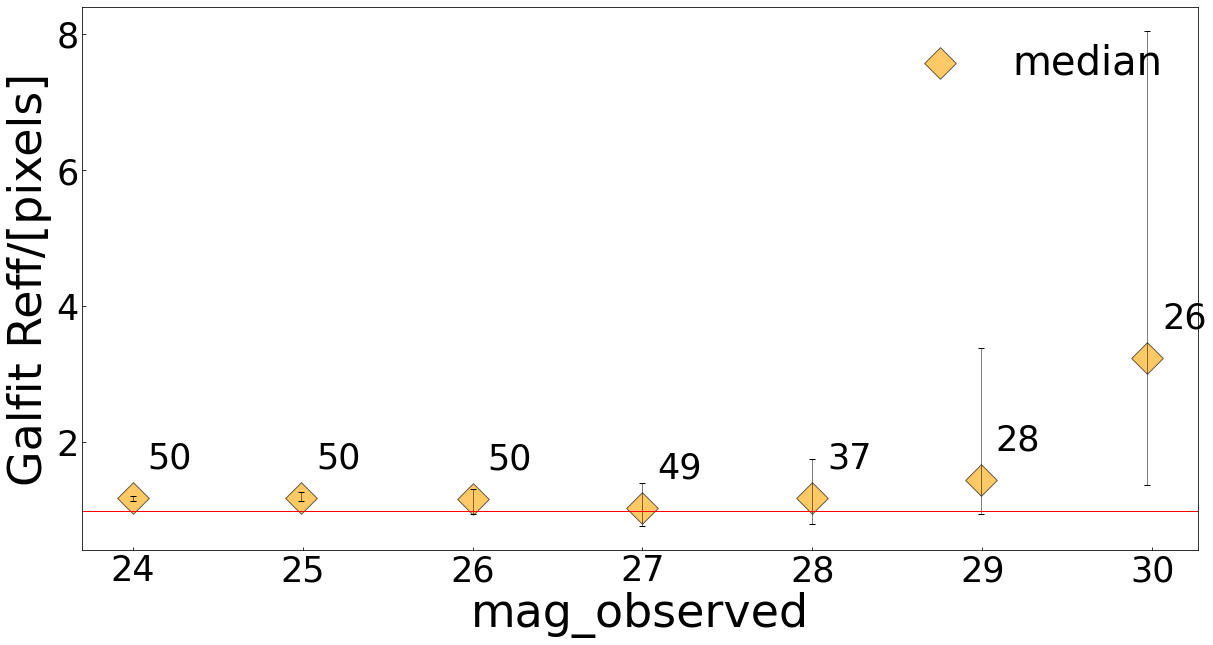
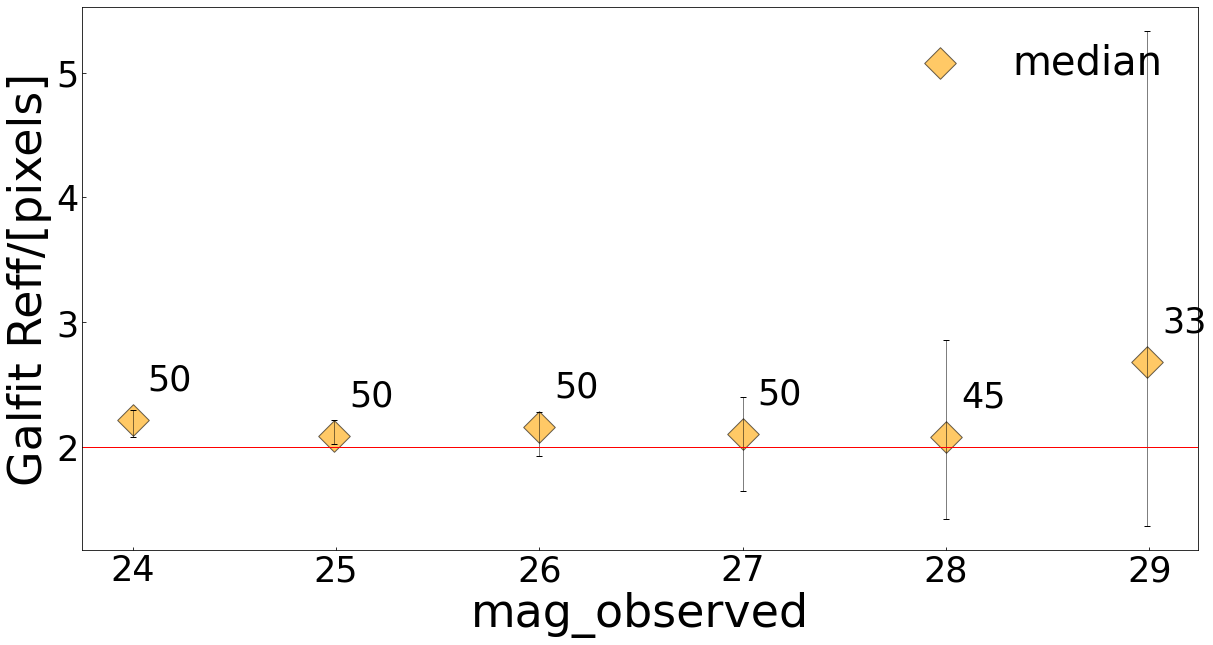
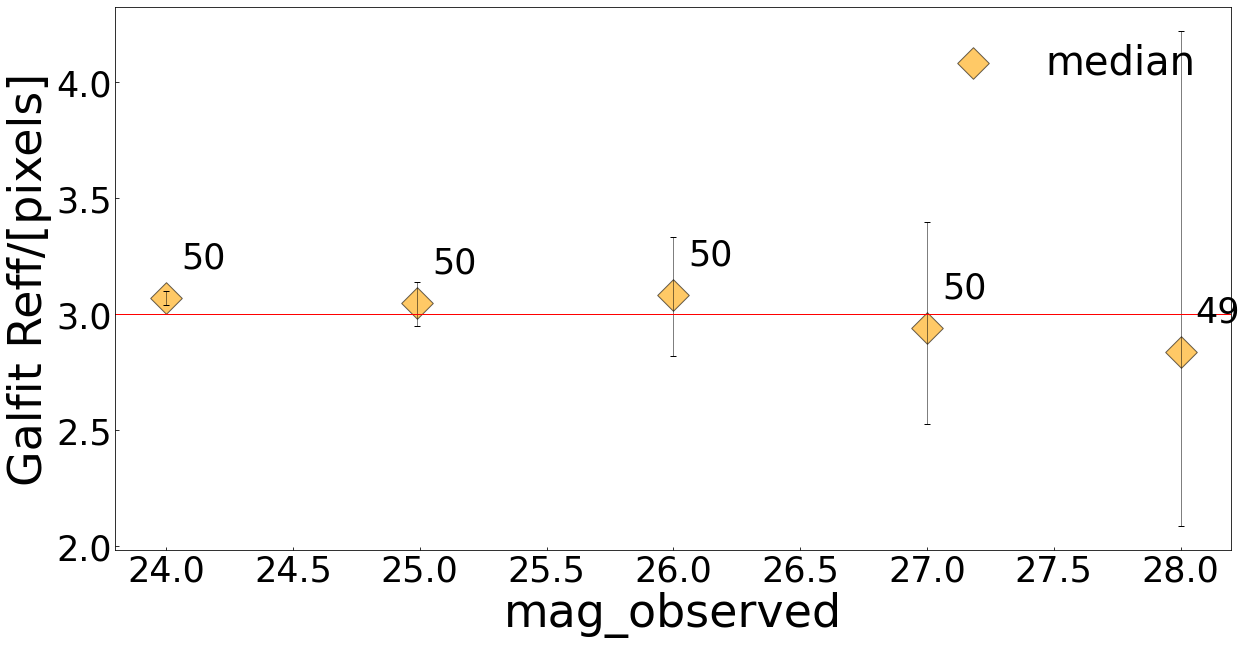
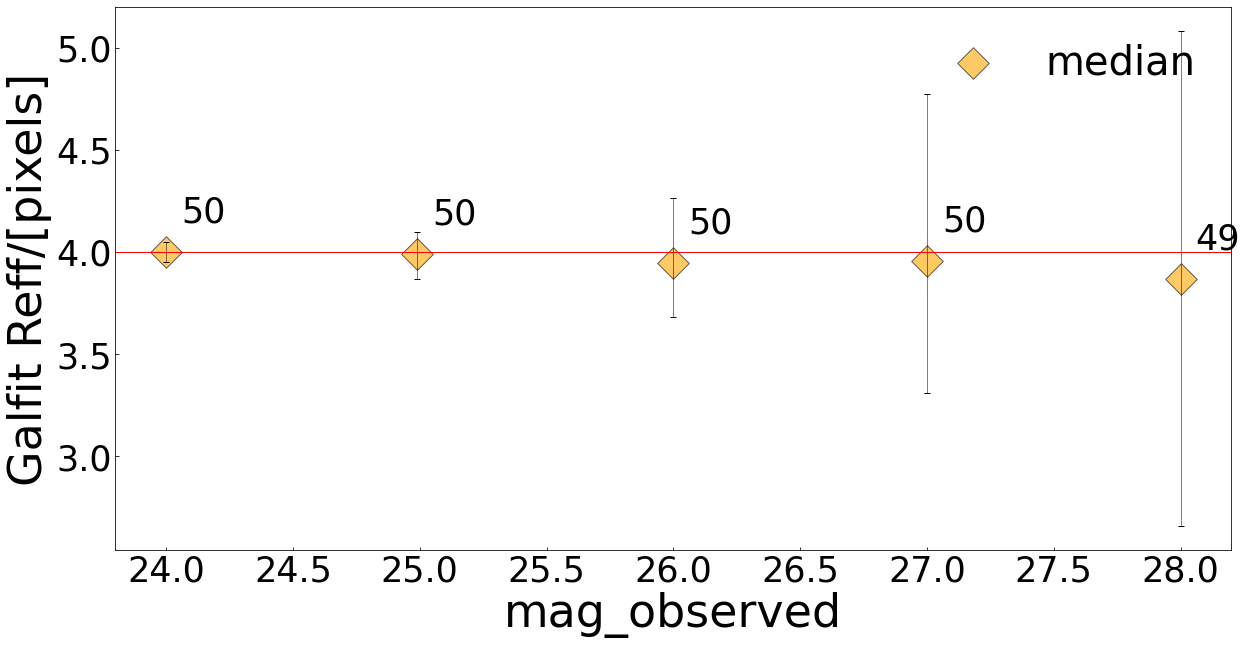
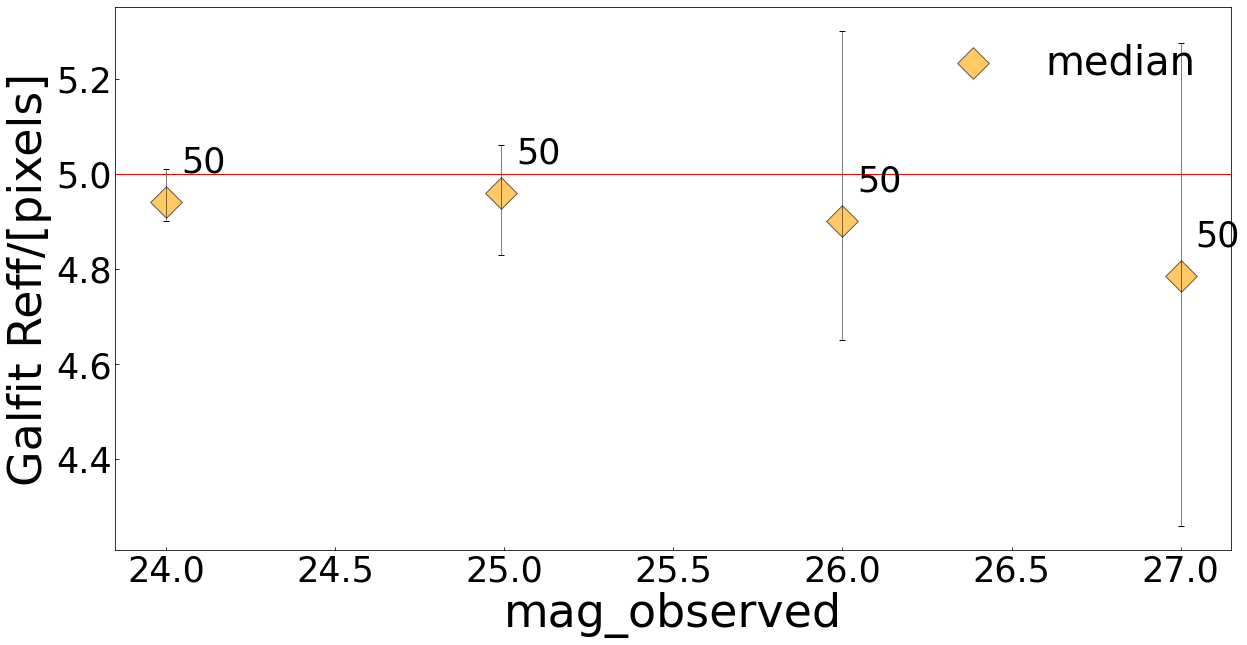
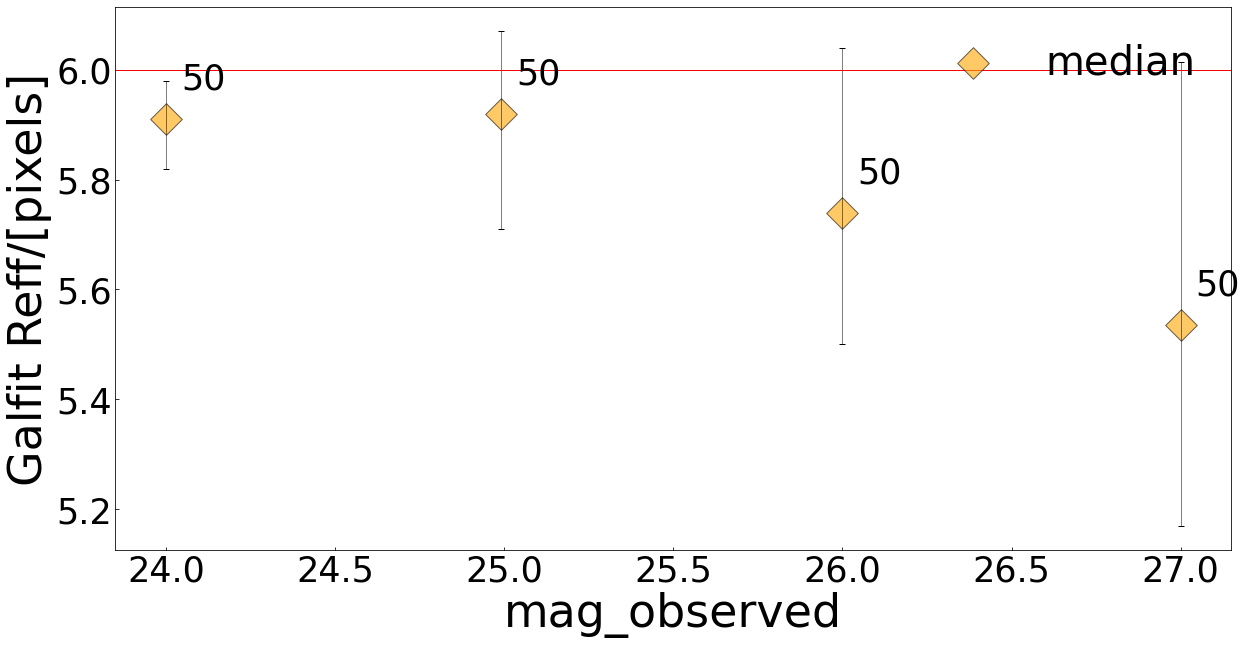
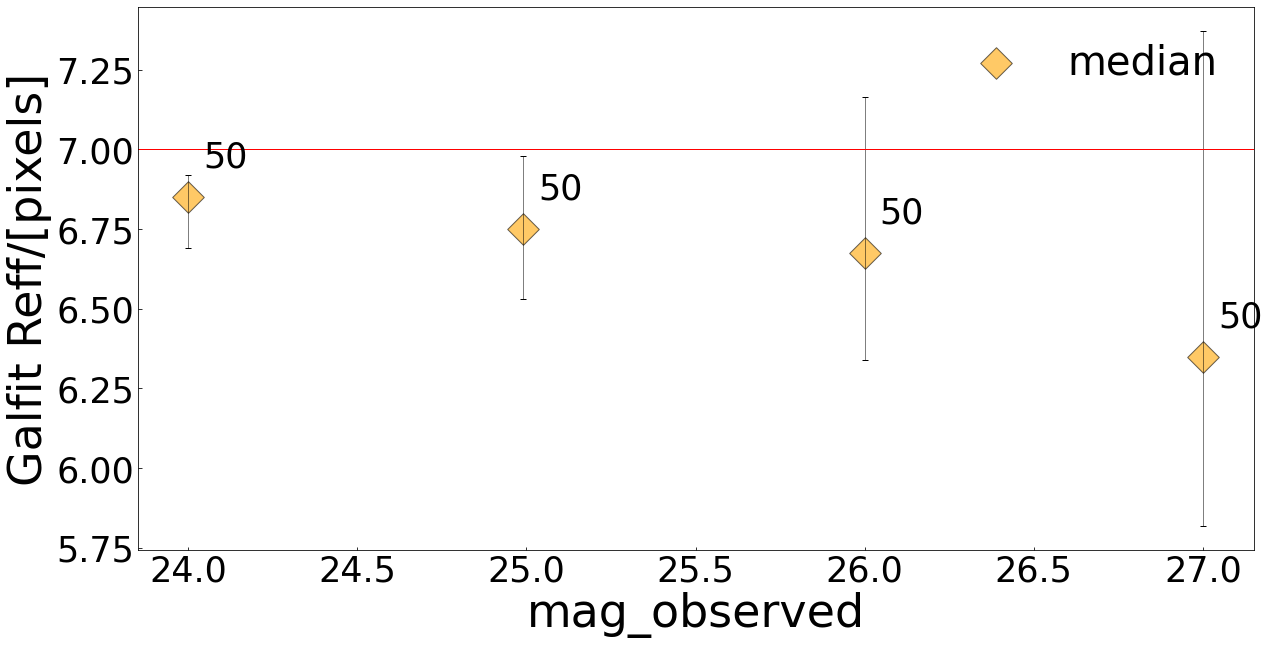
First, we test how robustly we can measure Reff of lensed sources by running GALFIT with a Monte Carlo approach. The range of intrinsic input magnitudes and sizes in the simulations is chosen to best describe the properties of the clumps in our sample: and pixels. Table 2 summarizes the adopted magnitude-size pairs simulated with FM. The pairs marked with ’’ are cases which are not present in our sample. We create 50 lensed mock images of the same source (at the position of clump 2b at z=6.14, where and ) varying the magnitude and size in the source plane as mentioned above, and fixing the Sersic index n=1. The emerging image in the lens (observed) plane is properly magnified by the FM procedure, in which random Poisson noise is also computed for each realization mimicking the real depth of the F105W image. GALFIT has therefore been run 50 times for each magnitude-size pair leaving all parameters free to vary in the fitting procedure (X, Y positions, position angle – PA, elipticity – b/a, magnitude and n). The same has been done after fixing a few of them (X, Y positions, PA, b/a and n), especially in the faint domain (mag > 27). Both approaches (leaving free all parameters or fixing some of them to the actual values) allow us to recover the input values (magnitude, sizes) with compatible medians and uncertainties in the bright magnitude regime (mag). For the faintest and most compact cases, as expected, the convergence is not always guaranteed and, as we did for the real clumps, it is useful to fix some of the input parameters. Indeed, in the real sample of clumps, GALFIT fitting has been performed in a semi-automatic way for the faint regime (mag > 27), after fixing n, PA and b/a quantities and visually inspecting each model and residual map produced by GALFIT. Similarly, in the MC simulations we verified that when fixing Sersic to Gaussian (n=0.5) or exponential (n=1) for the faint and/or compact cases GALFIT produces results consistent with the exponential case (n=1, the profile set in the source plane). Also the position angle is not relevant in the cases of circular symmetric shapes, which is frequent among the faint and compact clumps. For the elongated ones, such parameter is properly retrieved in the bright regime, whereas it is inferred manually and after visual inspection for the faint and extended ones. We did not simulate such an user-dependent process, therefore for the faint regime of the MC simulations we fix the position and Sersic to the right values and leave the rest free. For each set of 50 MC GALFIT runs we compute the median and the 16th and 84th percentiles of the resulting distributions of sizes and magnitudes. We report the obtained values in Table 2.
As an additional test, we run GALFIT manually on 51 simulated cases belonging to the faint regime (mag) and inserting radii in the range pixel without knowing the input parameters (performed blindly among the authors) and applying the same methodology used for the real clumps. The relevant quantities, i.e. magnitude and effective radii, have been recovered with uncertainties consistent to those inferred from simulations: magnitudes are recovered with a global error of mag independently from the radius and magnitude, while the radius has been recovered with and error in the range 27mag28, and at fainter magnitudes ().
| 1 | 2 | 3 | 4 | 5 | 6 | 7 | |
|---|---|---|---|---|---|---|---|
| 30 | |||||||
| 29 | |||||||
| 28 | |||||||
| 27 | |||||||
| 26 | |||||||
| 25 | |||||||
| 24 |
Notes: Recovered Reff are median values and lower and upper limits are 16th and 84th percentiles.
1 Input observed magnitudes.
2 Input half light radius in pixels
In a second step, we test the accuracy and precision of the magnitude measurements after removing the host light. To this goal, we add an additional light component (diffuse light) with Rpix to the simulated clump. The amount of added diffuse light is equivalent to , where numbers in brackets are telling how many times the host is brighter than the clump. In all cases, we assume R and for the clump component. For each host magnitude and given clump properties (R and , n=1), we create 50 mock lensed images. For each of them, we remove the host light in the same way as we are doing for real images (described in 2.2). Then, we use GALFIT to recover the clump magnitude. As done earlier, we compute the median and the 16th and 84th percentiles of the measurement distributions for each clump magnitude (after host removal procedure) and report the results in Table 3. The results show the error on the measured clump magnitude of mag. Such uncertainty can affect applied AC correction and further mass and SFR estimates derived by SED fitting. In other words, the host light-removing procedure in the most extreme cases can change the presented mass and SFR predictions by not more than . This is within the 16th and 84th percentile range given from SED fitting (reported uncertainties).
| 26.8 | 26.0 | 25.6 | |
|---|---|---|---|
| 26.8 |
Notes: Recovered magnitudes are median values and lower and upper limits are 16th and 84th percentiles.
1 Clump input magnitudes.
2 Magnitude of the host
4 Comparison with simulations
4.1 Simulations
We compare observational results with high-resolution hydrodynamic simulations of clumpy galaxies from the literature. In particular, we consider the following samples:
-
•
the simulations by Tamburello et al. (2017) have a resolution of 100 pc. They simulate clumpy galaxies and in mock H maps they identify clumps with sizes R pc and stellar mass M M⊙;
-
•
the simulation by Faure et al. (2021) is focused on clumpy galaxies at redshift which are gas-rich and disc-dominated. The stellar masses of the simulated galaxies are M⊙ and the resolution of the simulations are 500 and 12.2 pc per pixel. In their simulations, the identified clumps spans the stellar mass range ;
-
•
the simulation by Bournaud et al. (2014) detailed evolution of giant clumps in four high redshift discs () is modeled. The resolution of the simulation is 3.5–7 pc with initial masses of the galaxies from .
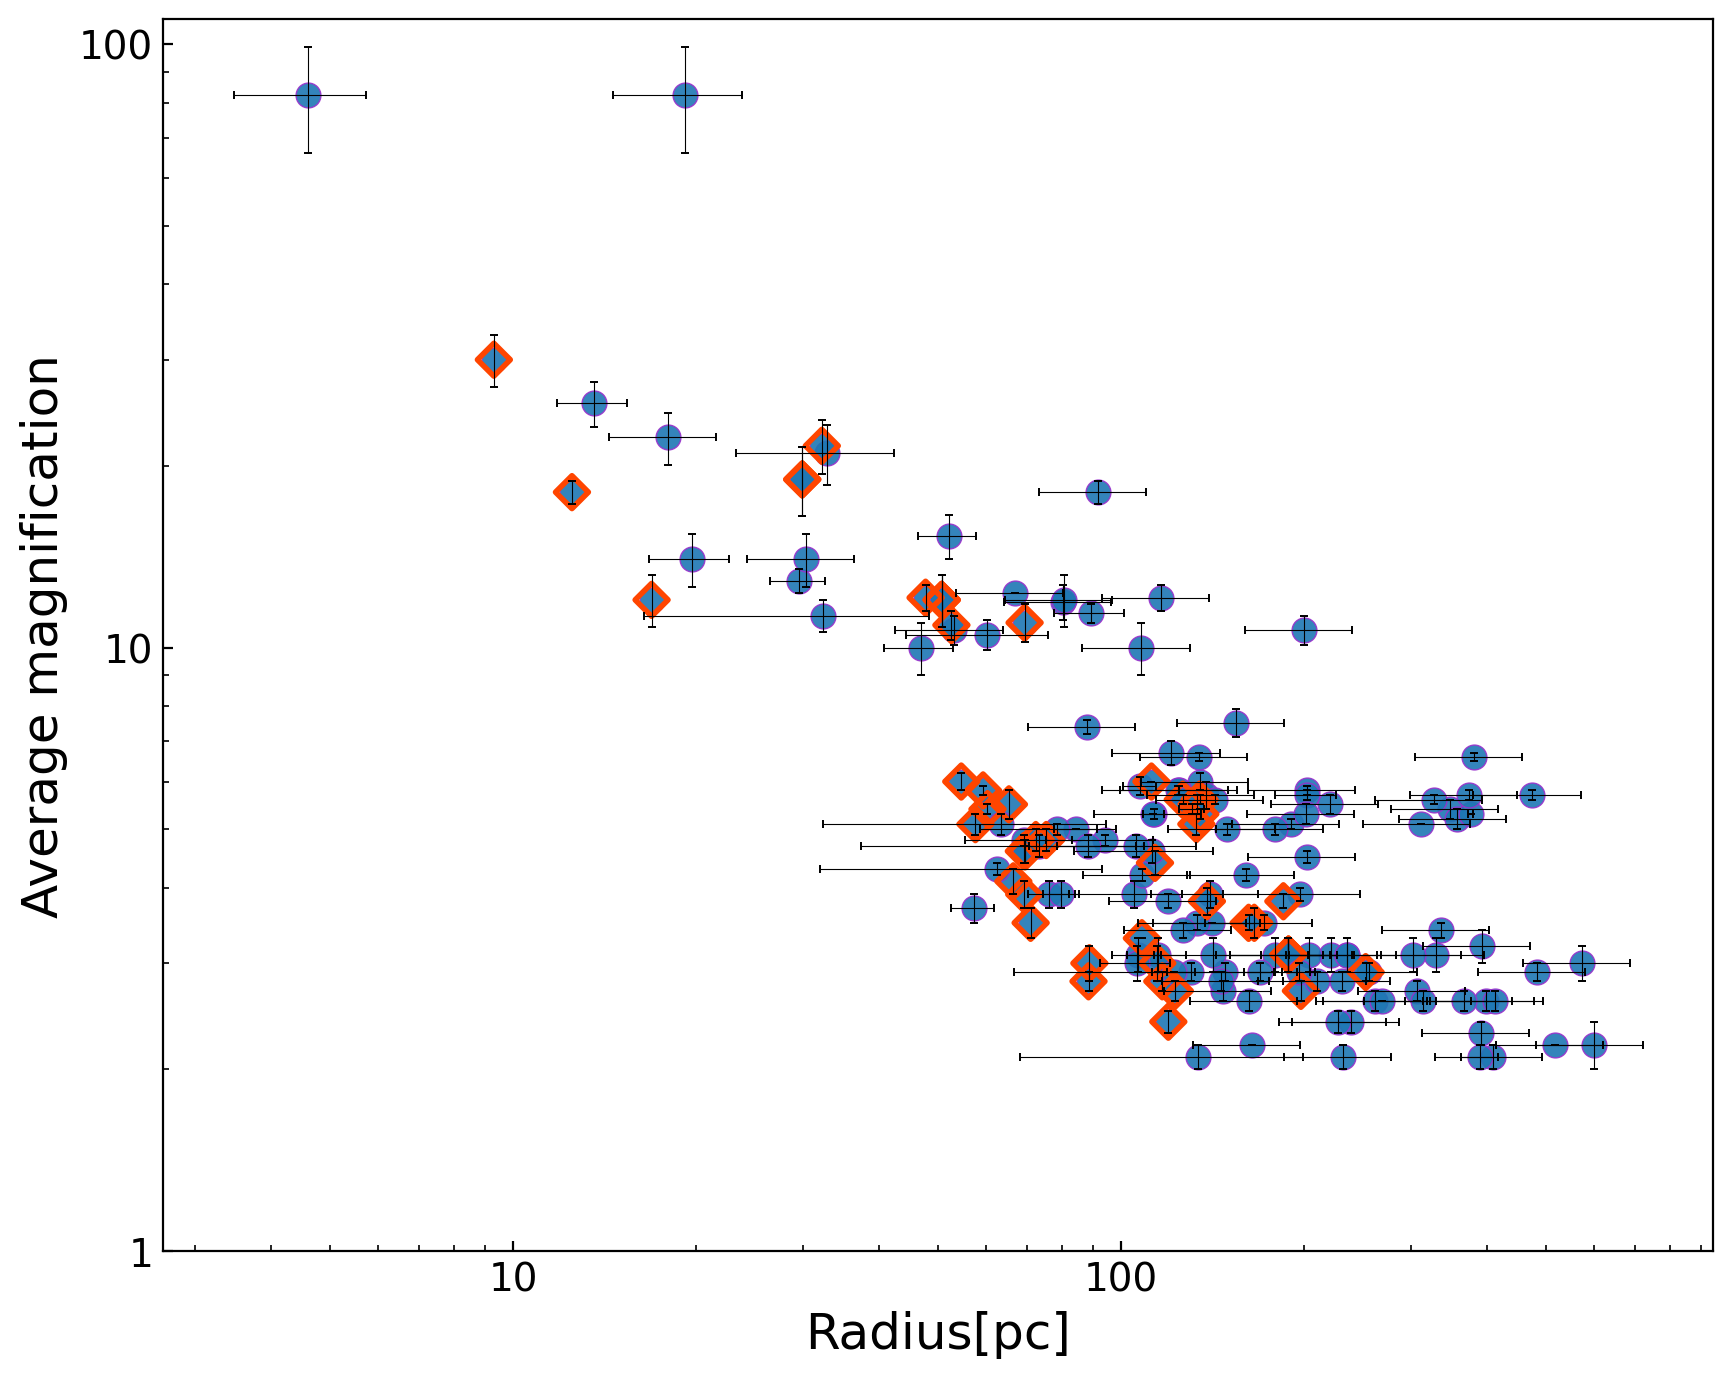
Results from hydrodynamic simulations suggest that measured clump sizes depend on the spatial resolution of the observation (e.g. Tamburello et al., 2015; Tamburello et al., 2017; Faure et al., 2021). This is consistent with our results: the sizes of clumps detected in MACS J0416 decrease as lensing magnification increases and the number of detected clumps increase with magnification, Figure 7. In the most extreme cases where is reached, intrinsic sizes of 5 pc are measured, see Figure 5. Clumps with sizes of tens of parsecs are also reported in the literature, for example Vanzella et al. (2021a); Calura et al. (2021) observed lensed clumps with sizes of few parsecs at , and Vanzella et al. (2019) measured sizes of a few tens of parsecs at (the magnification is in both cases). In field instead (e.g ), where the spatial resolution of the observations is coarser, objects have sizes kpc (Förster Schreiber et al., 2018).
The median size of clumps in our sample is 126 pc, with a standard deviation 117 pc. This is comparable with the median size of clumps found in simulations (Tamburello et al., 2017), although our sample extends to even smaller sizes (e.g., R pc). Simulations with higher resolution than currently available are likely needed to compare with our highest magnification clumps. On the other hand, in our sample of the clumps have effective radii pc. Such clumps have magnification and are resolved. These large clumps are completely missing in the simulations by Tamburello et al. (2017), possibly due to the relatively low initial molecular gas fraction of the host galaxy (%) and strong feedback recipe used in the simulations (Fensch & Bournaud, 2021). Large clumps are instead found in simulations adopting larger molecular gas fractions (%) and moderate feedback recipes (Bournaud et al., 2014). This indicates that to have a proper comparison between observations and simulations, spatial resolution, as well as the initial conditions (e.g., molecular gas fraction, feedback) for simulations are key.
In state-of-the art cosmological hydrodynamic simulations performed at very high resolution (i.e. dark matter particle mass resolution of and, in some cases, pc-scale softening length for baryons, Ma et al., 2020), bound and dense clumps in gas-rich high-redshift galaxies have been identified, with sizes and masses below 100 pc, consistent with the typical values of star clusters (Kim et al., 2018; Phipps et al., 2020) and with the values measured in our sample. A systematic comparison between the properties of our clumps and the ones of current state-of-the art simulations is deferred to a future work.
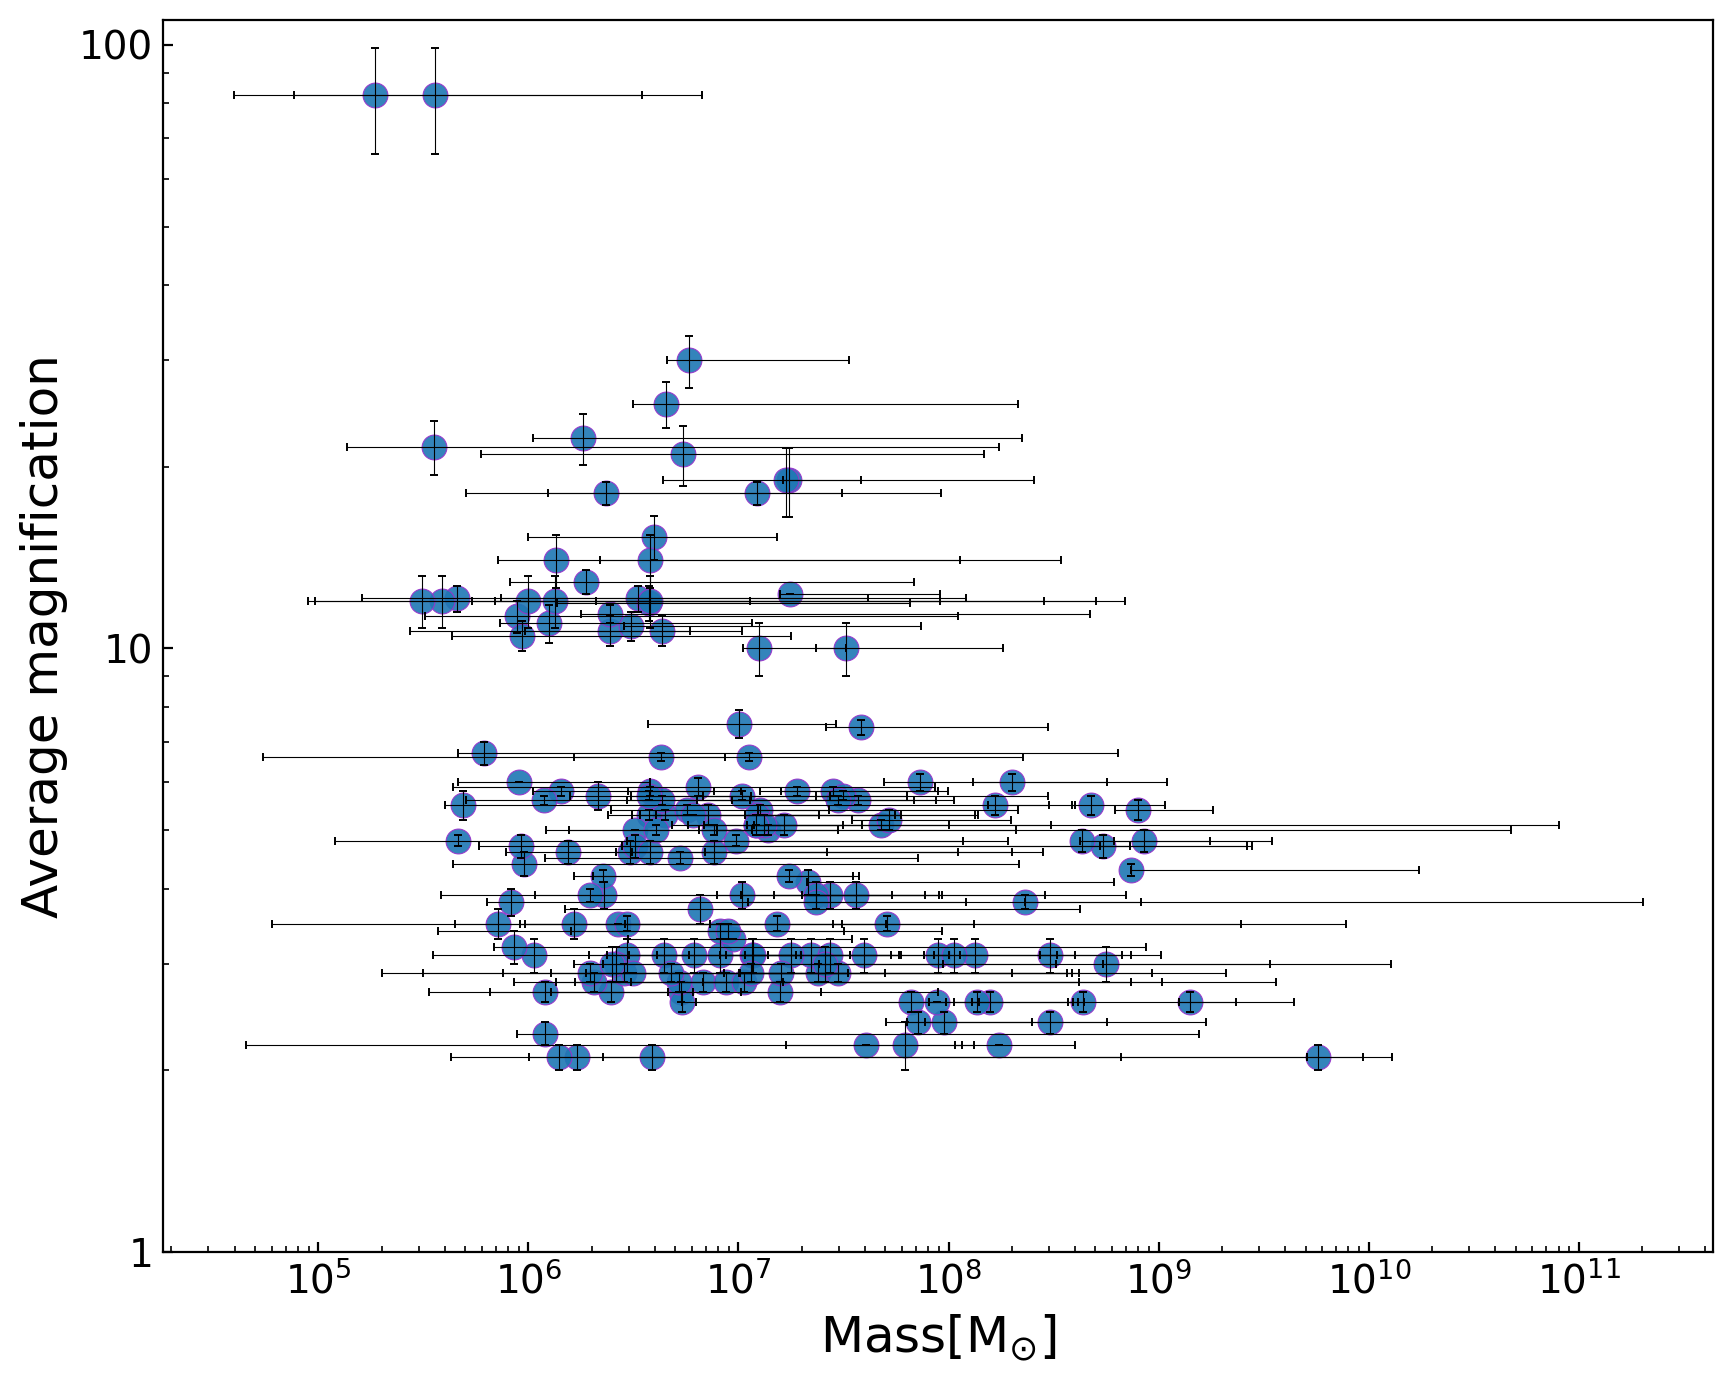
While the measured size of clumps clearly depends on the resolution of the observations, their stellar mass estimates seem to rather depend on the depth and detection threshold of the data (Dessauges-Zavadsky et al., 2017). We show in Figure 5 the relation between the stellar masses of the clumps and their magnification. We only find a weak correlation (evaluated Pearson coefficient ). The trends that we are observing between the measured properties (mass, size) and the observational resolution and sensitivity are also consistent with results from simulations (Tamburello et al., 2017). In fact, Tamburello et al. (2017) report that when changing resolution from 100 pc to 1 kpc, at a fixed detection threshold, the estimated stellar masses are a factor larger. Instead when increasing the sensitivity by a factor 10 the measured stellar masses change by one order of magnitude.
5 Scaling relations
Various fundamental scaling relations have been used to unveil and understand relations between physical properties (e.g. between mass and size), of various dynamically evolved stellar systems (i.e. Misgeld & Hilker, 2011; Norris et al., 2014). However, the majority of such studies focus on stellar systems located in the nearby Universe, especially when faint and small sources are targeted. Thanks to lensing, we can extend scaling relations populating the low-mass, low-SFR, and small size portion of the parameter space with high redshift () objects.
5.1 Mass – stellar surface mass density relation
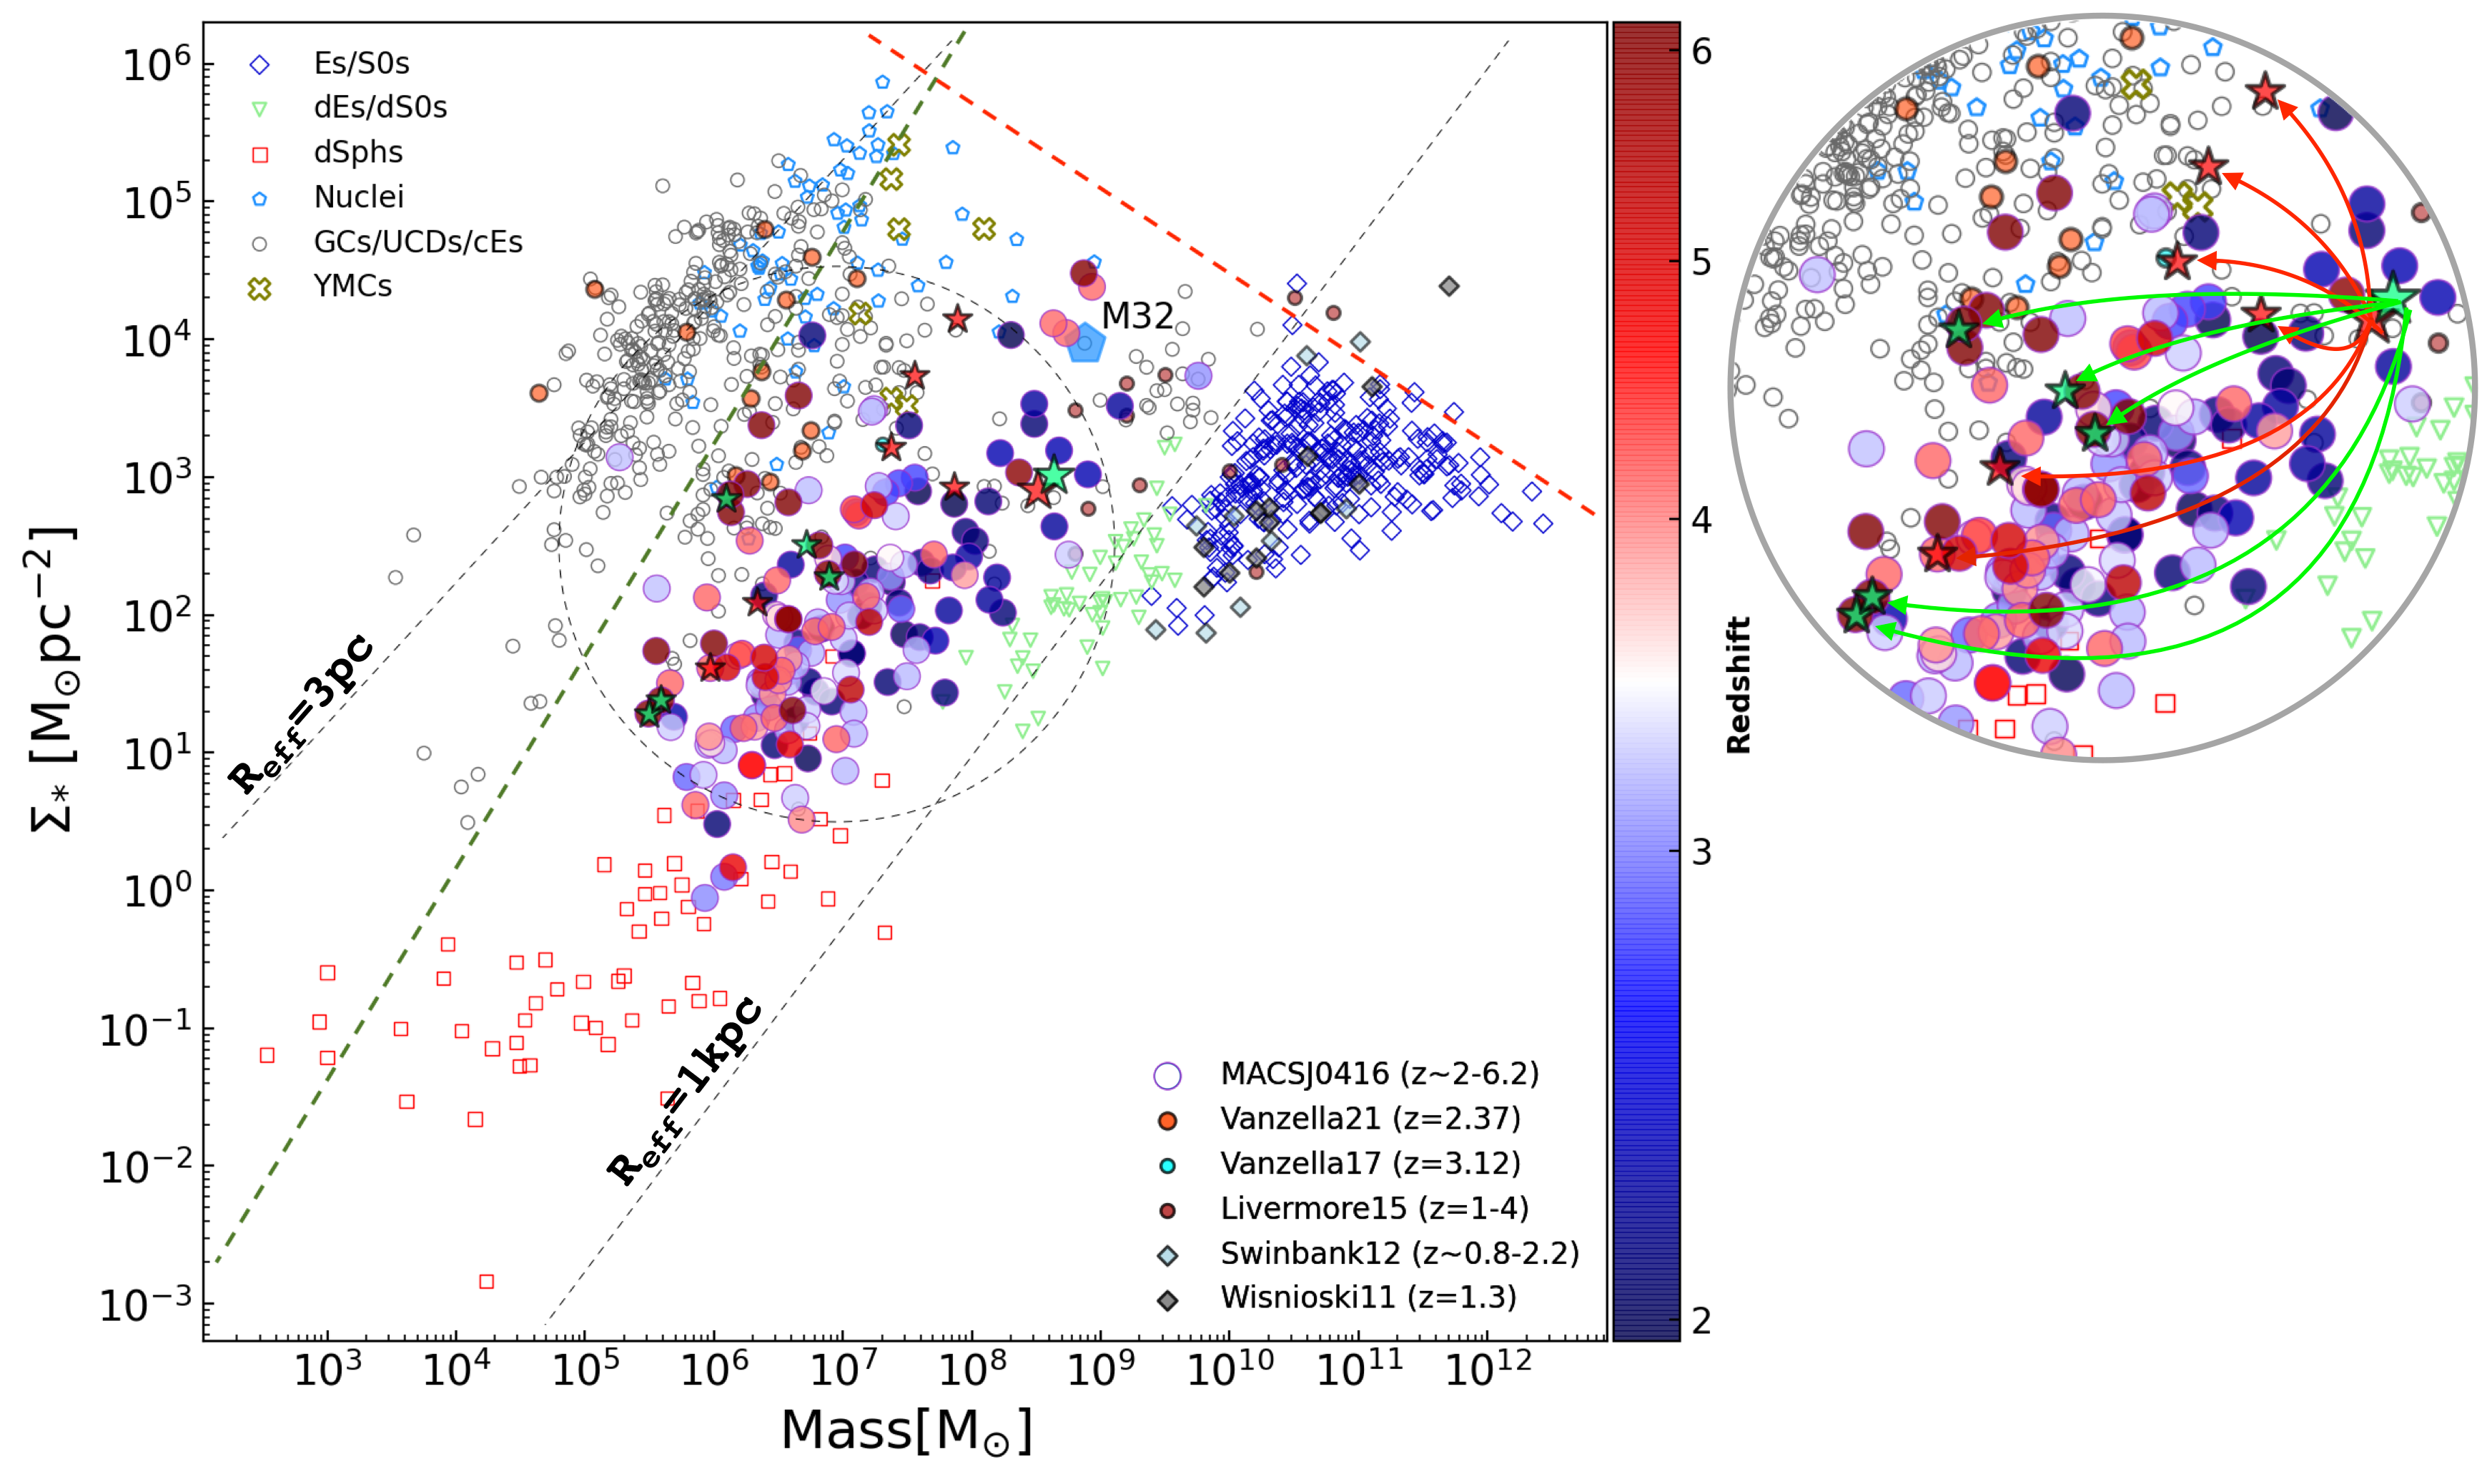
Our sample of clumps is particularly suited to examine the stellar-mass vs mass-surface density plane at high redshift (Figure 8), where the variation among different stellar systems is even more evident than on the stellar-mass vs size plane shown in APPENDIX A. In this plane, two sequences have already been discussed in the literature. One is populated by sources with large mass (M M⊙) and M⊙ pc-2, such as Es/S0s and dEs/dS0s galaxies. The other is instead populated by sources with smaller mass (M M⊙) and larger stellar mass surface density ( M⊙ pc-2). In between those two sequences, there is a region sparsely populated, with only a few nuclear star clusters (Nuclei) and the M32 galaxy nuclei. The bulk of the clumps of our sample is located in an intermediate region. Simulations (i.e Pfeffer & Baumgardt, 2013) and local observations (Norris et al., 2014) suggest that stellar systems located in this portion of the parameter space may possibly undergo stripping processes, during which their outskirts are removed, leaving only a dense core. In the process of the stripping, galaxies are expected to migrate from the sequence populated by dES/dS0s to the region occupied by compact and dense stellar systems. This scenario could potentially explain the position of some clumps from our sample, particularly those systems where two or more clumps are detected.
Another possible explanation for the specific location of our clumps is that we may not be resolving clumps into individual stellar systems, despite the high magnification, so that they could rather be star-forming regions where small star clusters are blended due to insufficient resolution. With increasing resolution, we indeed expect them to be placed in the region occupied by local GCs, UCDs, and cEs. An exemplification of this effect is illustrated in Figure 8 with two examples: system ID106b and ID124c, with delensed total stellar mass M and M (non delensed stellar masses are adopted from the ASTRODEEP catalogue, where both sources are treated as a single object, Merlin et al. 2016a).
Stellar masses and effective radii are measured as described in Section 3. For ID106b and ID124c, we obtaine delensed values of R pc and 257 pc respectively. When considering the full-resolution image (i.e., without smoothing), we detect 6 (5) clumps within ID106b (ID124c) owing to the high-magnification (, see Figure 3). In this way, we notice from Figure 8 that the location of the individual clumps hosted by ID106b and ID124c is closer to the region occupied by local GCs and nuclei, when compared to the location of their hosting systems. If we reasonably assume that such a resolution effect affects the majority of our clumps, this would explain why our sample occupies a sparsely populated region in between GCs/UCDs/cEs, YMCs, Nuclei, and Es/S0s, dEs/dS0s stellar systems.
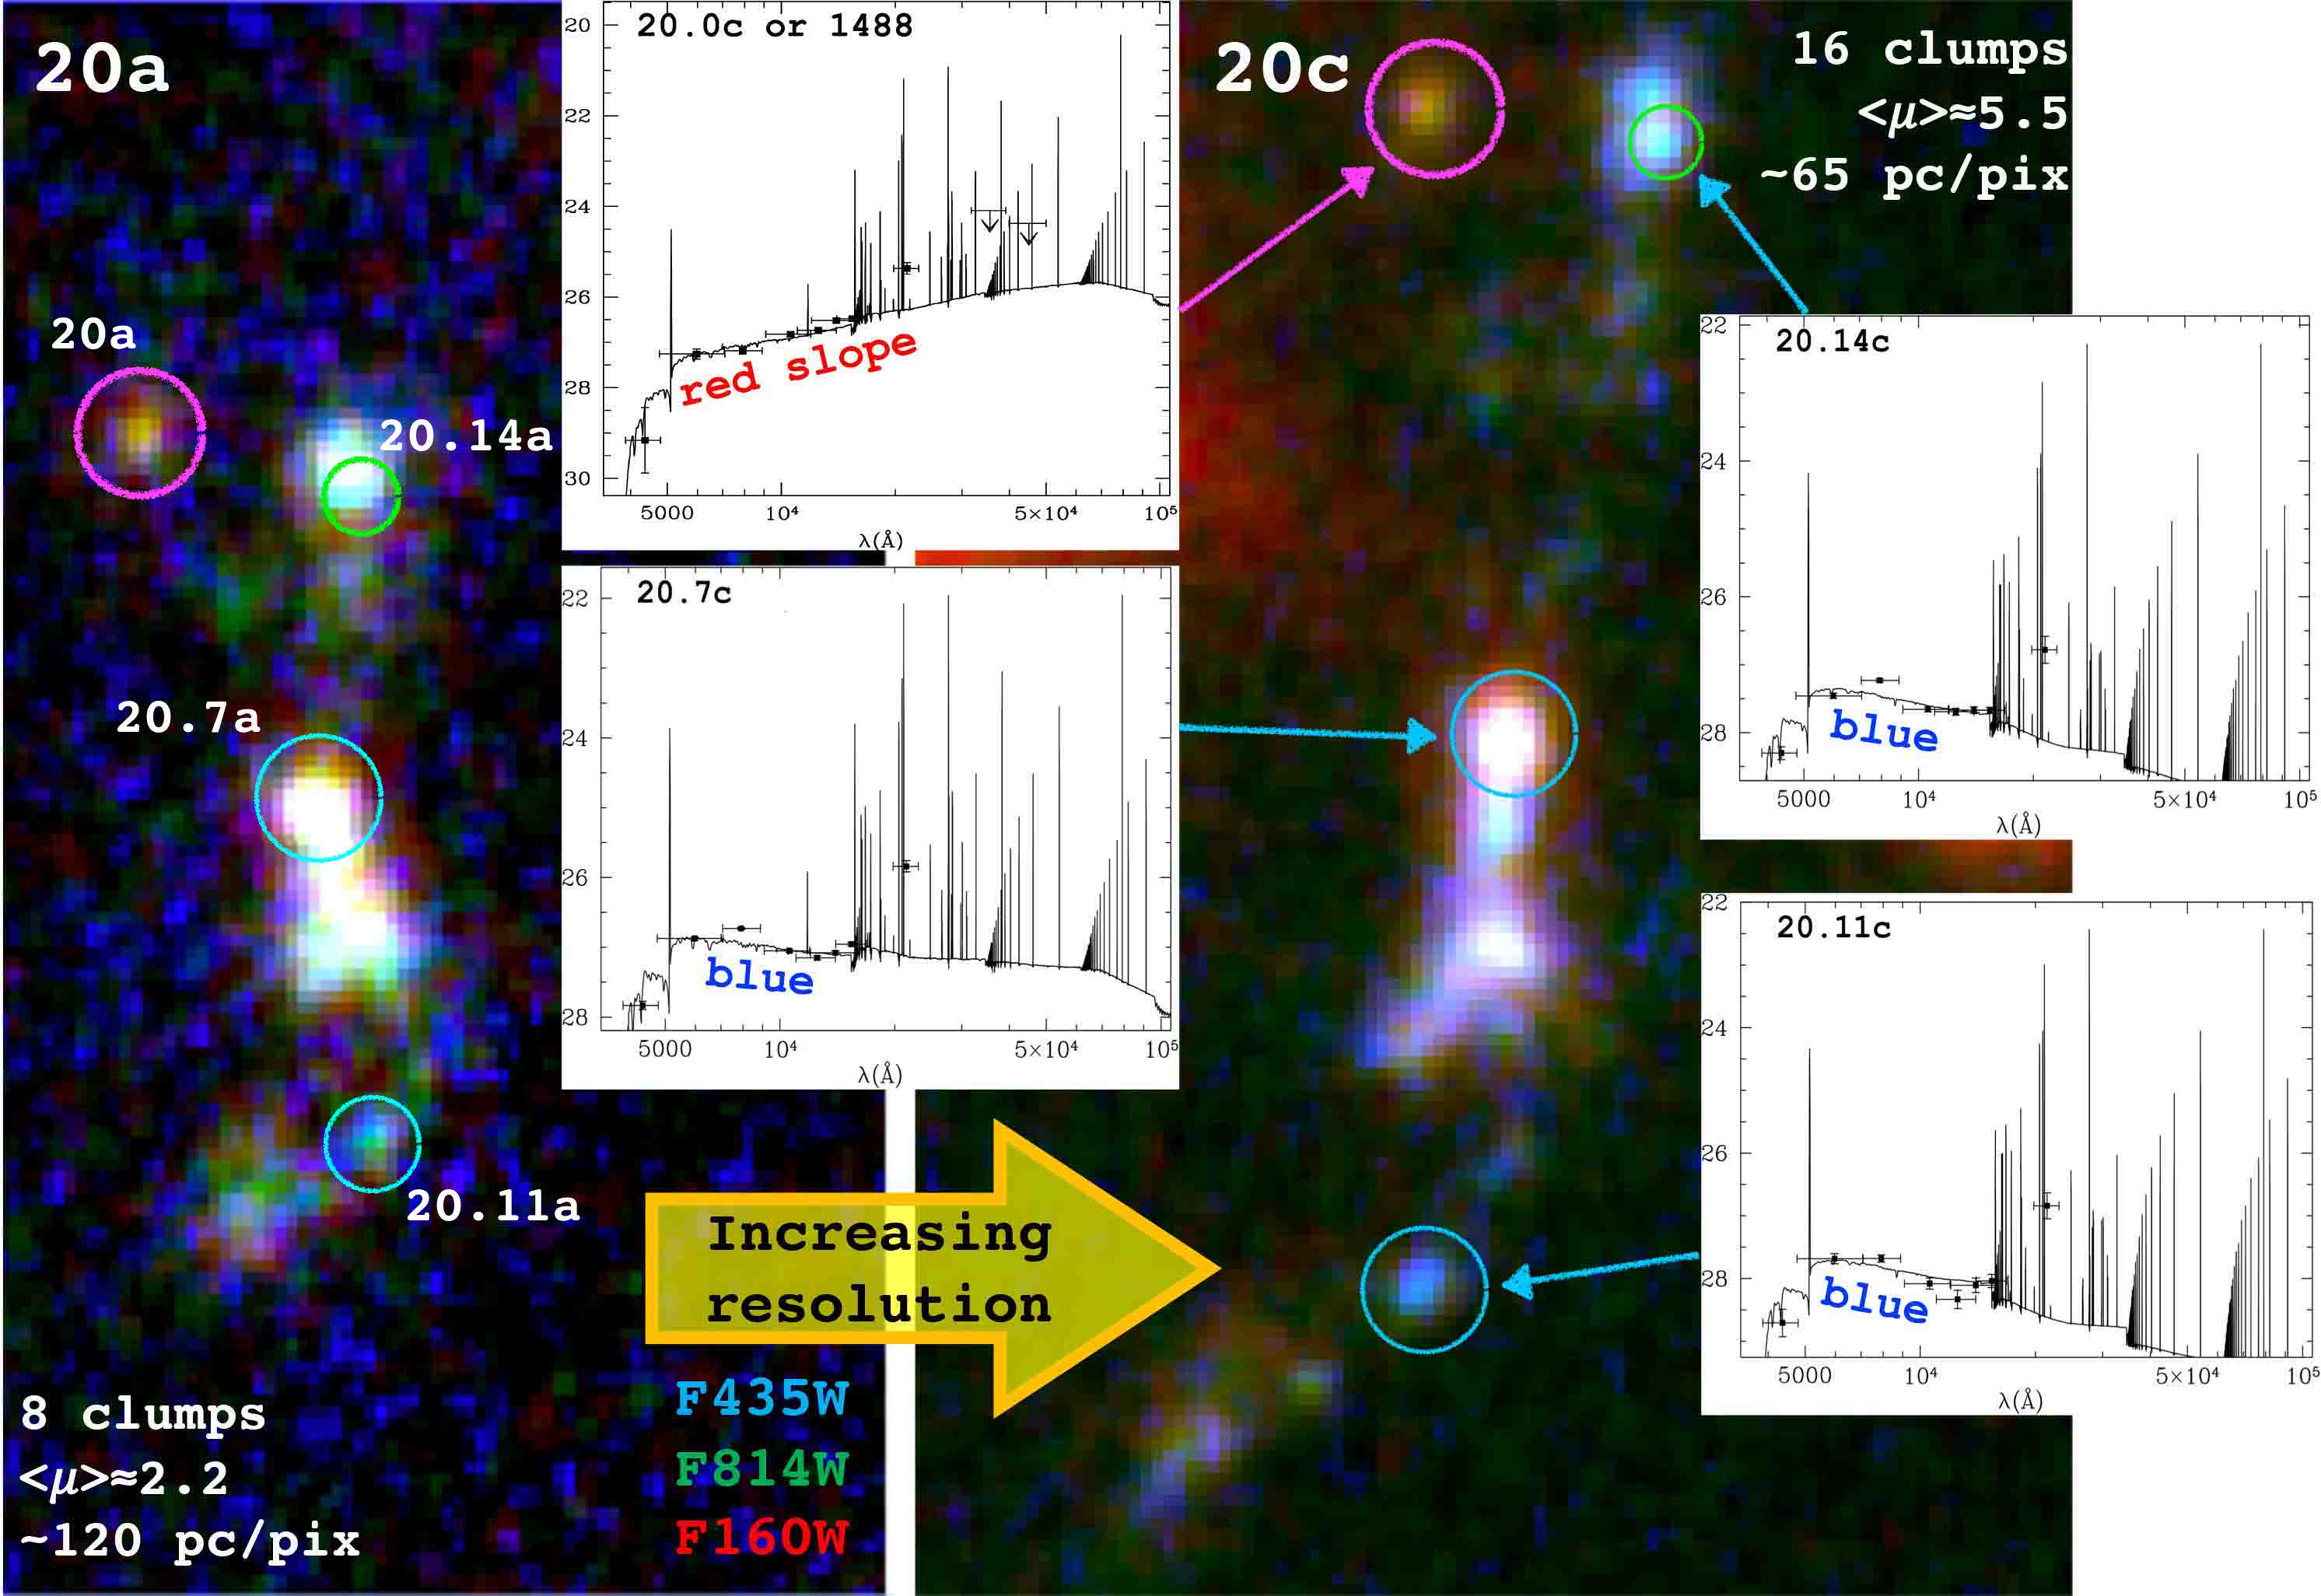
Interestingly, even though the clumps in our sample might have unresolved substructure, some of them could be gravitationally bound and considered as individual and stable star-forming regions that survive and potentially evolve over time. An example is the clump 20.0c shown in Figure 7. Such an object shows two multiple images with mean magnifications of 2 and 5.5. Both images show a nucleated morphology, with the most amplified being barely resolved and providing an estimated intrinsic effective radius of 100 pc. Differently from the other clumps populating the same system 20, clump 20.0c shows a smoothly red continuum with associated physical quantities compatible with being a relatively evolved and massive object, with an age of Myr and a de-lensed stellar mass of M⊙. After including 68% uncertainties, such values correspond to a relatively large stellar surface density M⊙ pc-2, with a dynamical age (with defined as the ratio of the age and crossing time, see e.g., Vanzella et al. 2021b), suggesting 20.0c could be a gravitationally bound object.
5.2 Mass – SFR relation
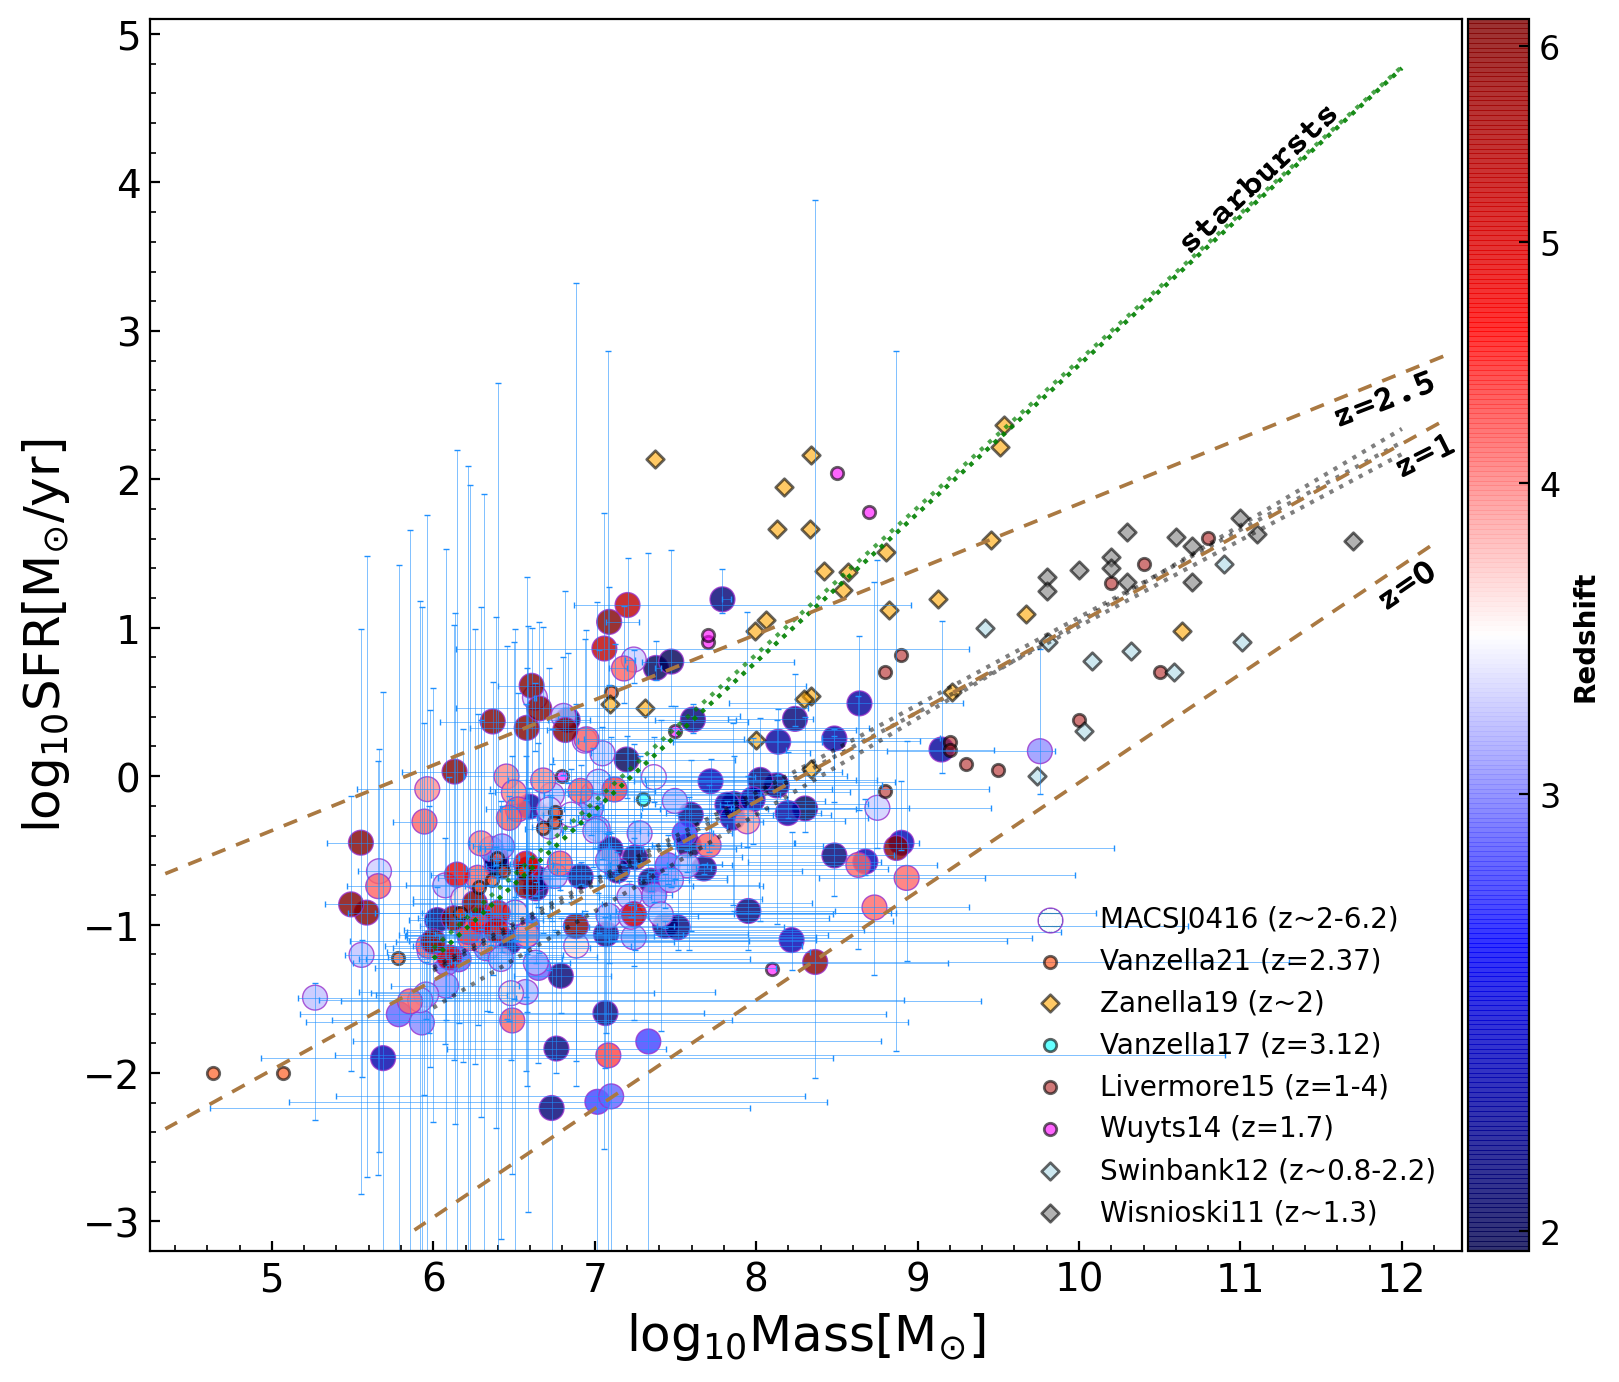
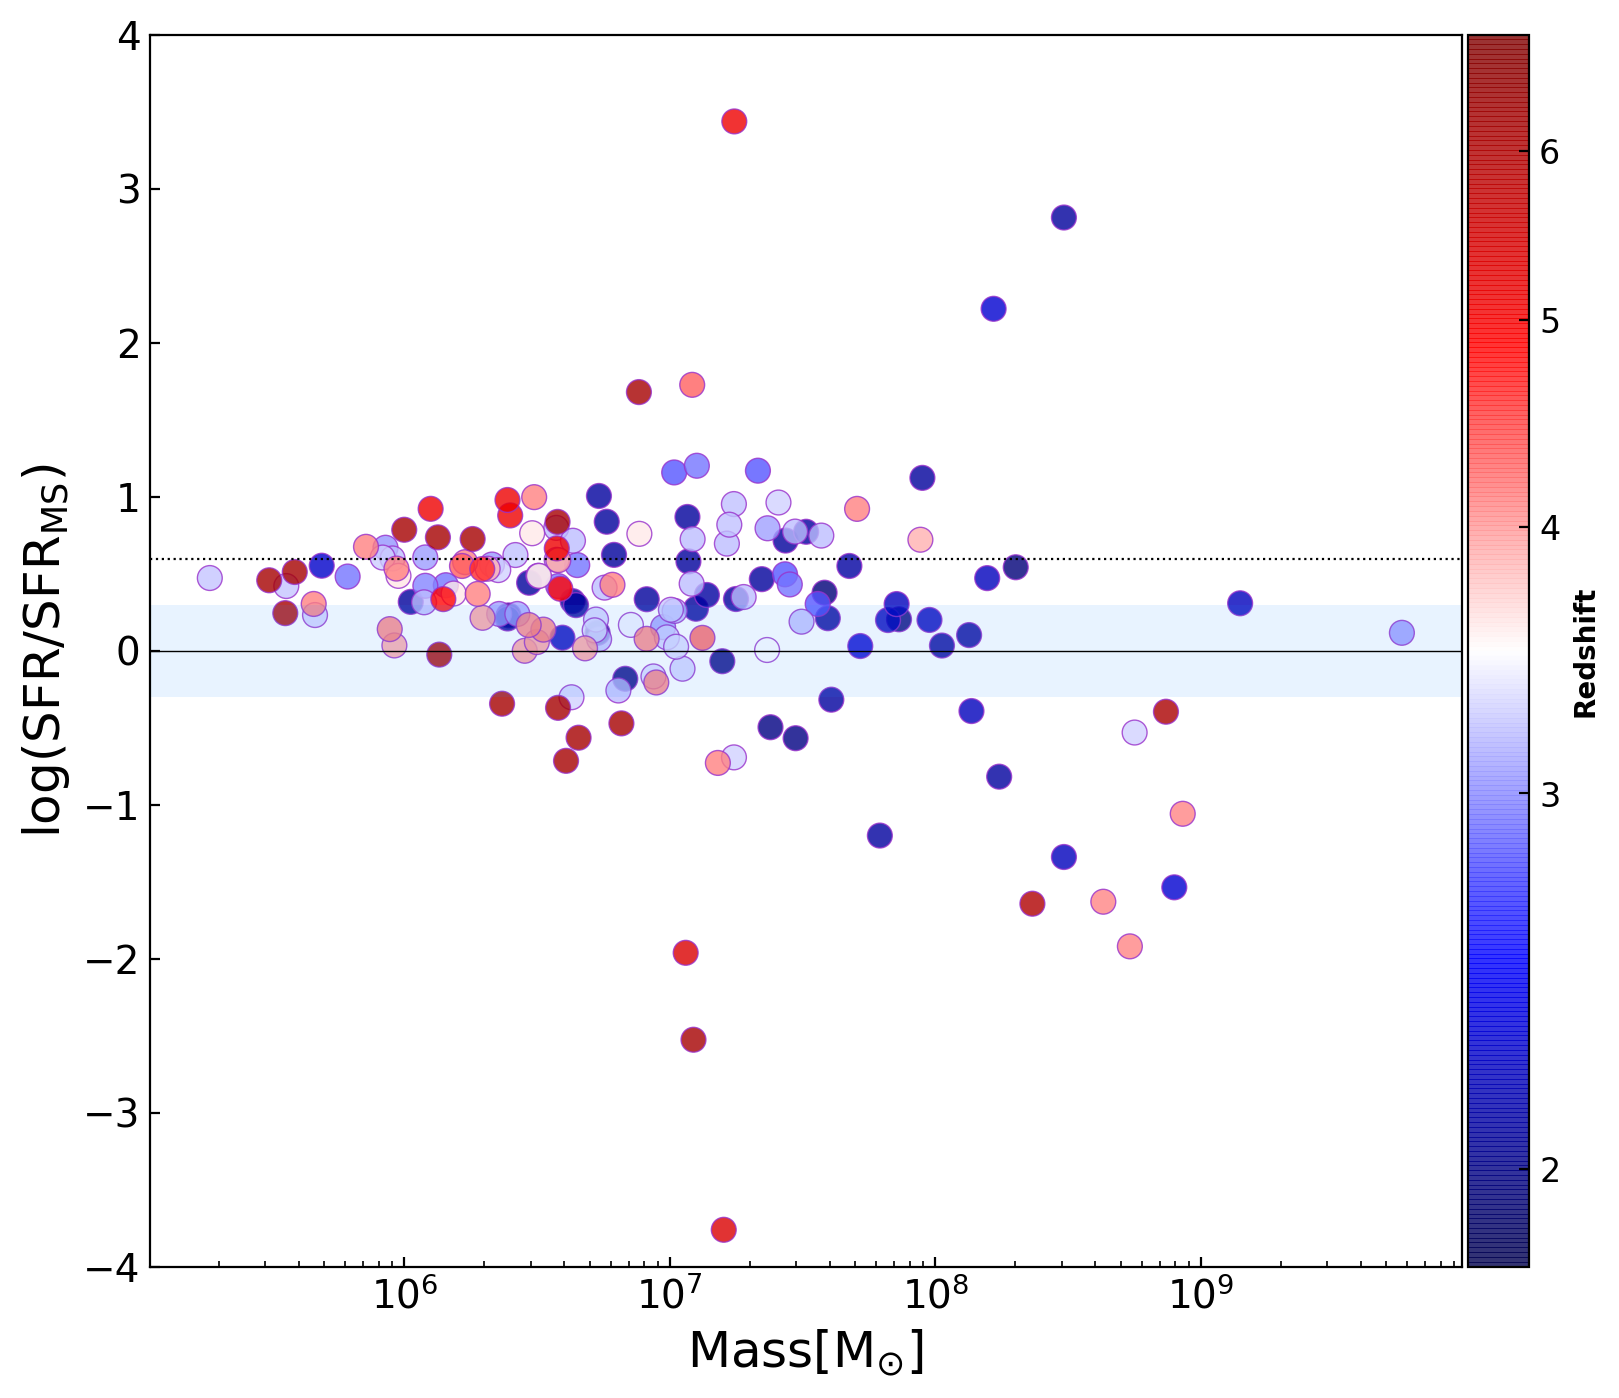
We stress that unlike other studies of the main-sequence high-redshift galaxies lensed by MACS J0416 (e.g., Rinaldi et al. 2021), we do not consider integrated galaxies, but rather make an effort to deblend clumps from their host galaxies to investigate the star formation mode of individual star-forming regions at high-. A tight correlation between the SFR and M⋆ exists for local and high-redshift star-forming galaxies, the so-called "main-sequence" (e.g Brinchmann et al., 2004; Noeske et al., 2007; Rodighiero et al., 2010; Sparre et al., 2015; Santini et al., 2017). In Figure 9, we show the location of our sample of individual clumps in the SFR-M⋆ plane and compare it with the other published samples. Thanks to lensing magnification, our sample probes the low-SFR and low-M⋆ region, down to M, where only a few other lensed sources from the literature are located (e.g., the Sunburst clumps at , Vanzella et al. 2021a).
In Figure 9, we also show the normalized SFR () versus the stellar mass, obtained after dividing the SFR by the expected main-sequence SFR ()333The main sequence star-formation rate is adopted from (Santini et al., 2017) and it has been derived only for the systems with stellar masses . at the redshift of each clump. For this purpose, we adopt the main-sequence determination at varying redshifts by Santini et al. 2017, which was determined for stellar masses . We note that of the sample lies above the main-sequence, with 30% of the clumps having SFR dex higher than SFRMS, a region commonly populated by highly starbursting galaxies (Rodighiero et al., 2010). This is generally consistent with previous findings in the literature (e.g., Guo et al. 2012, Wuyts et al. 2012, Zanella et al. 2015, Karman et al. 2017, Cibinel et al. 2017, Zanella et al. 2019).
5.3 Radius – SFR relation
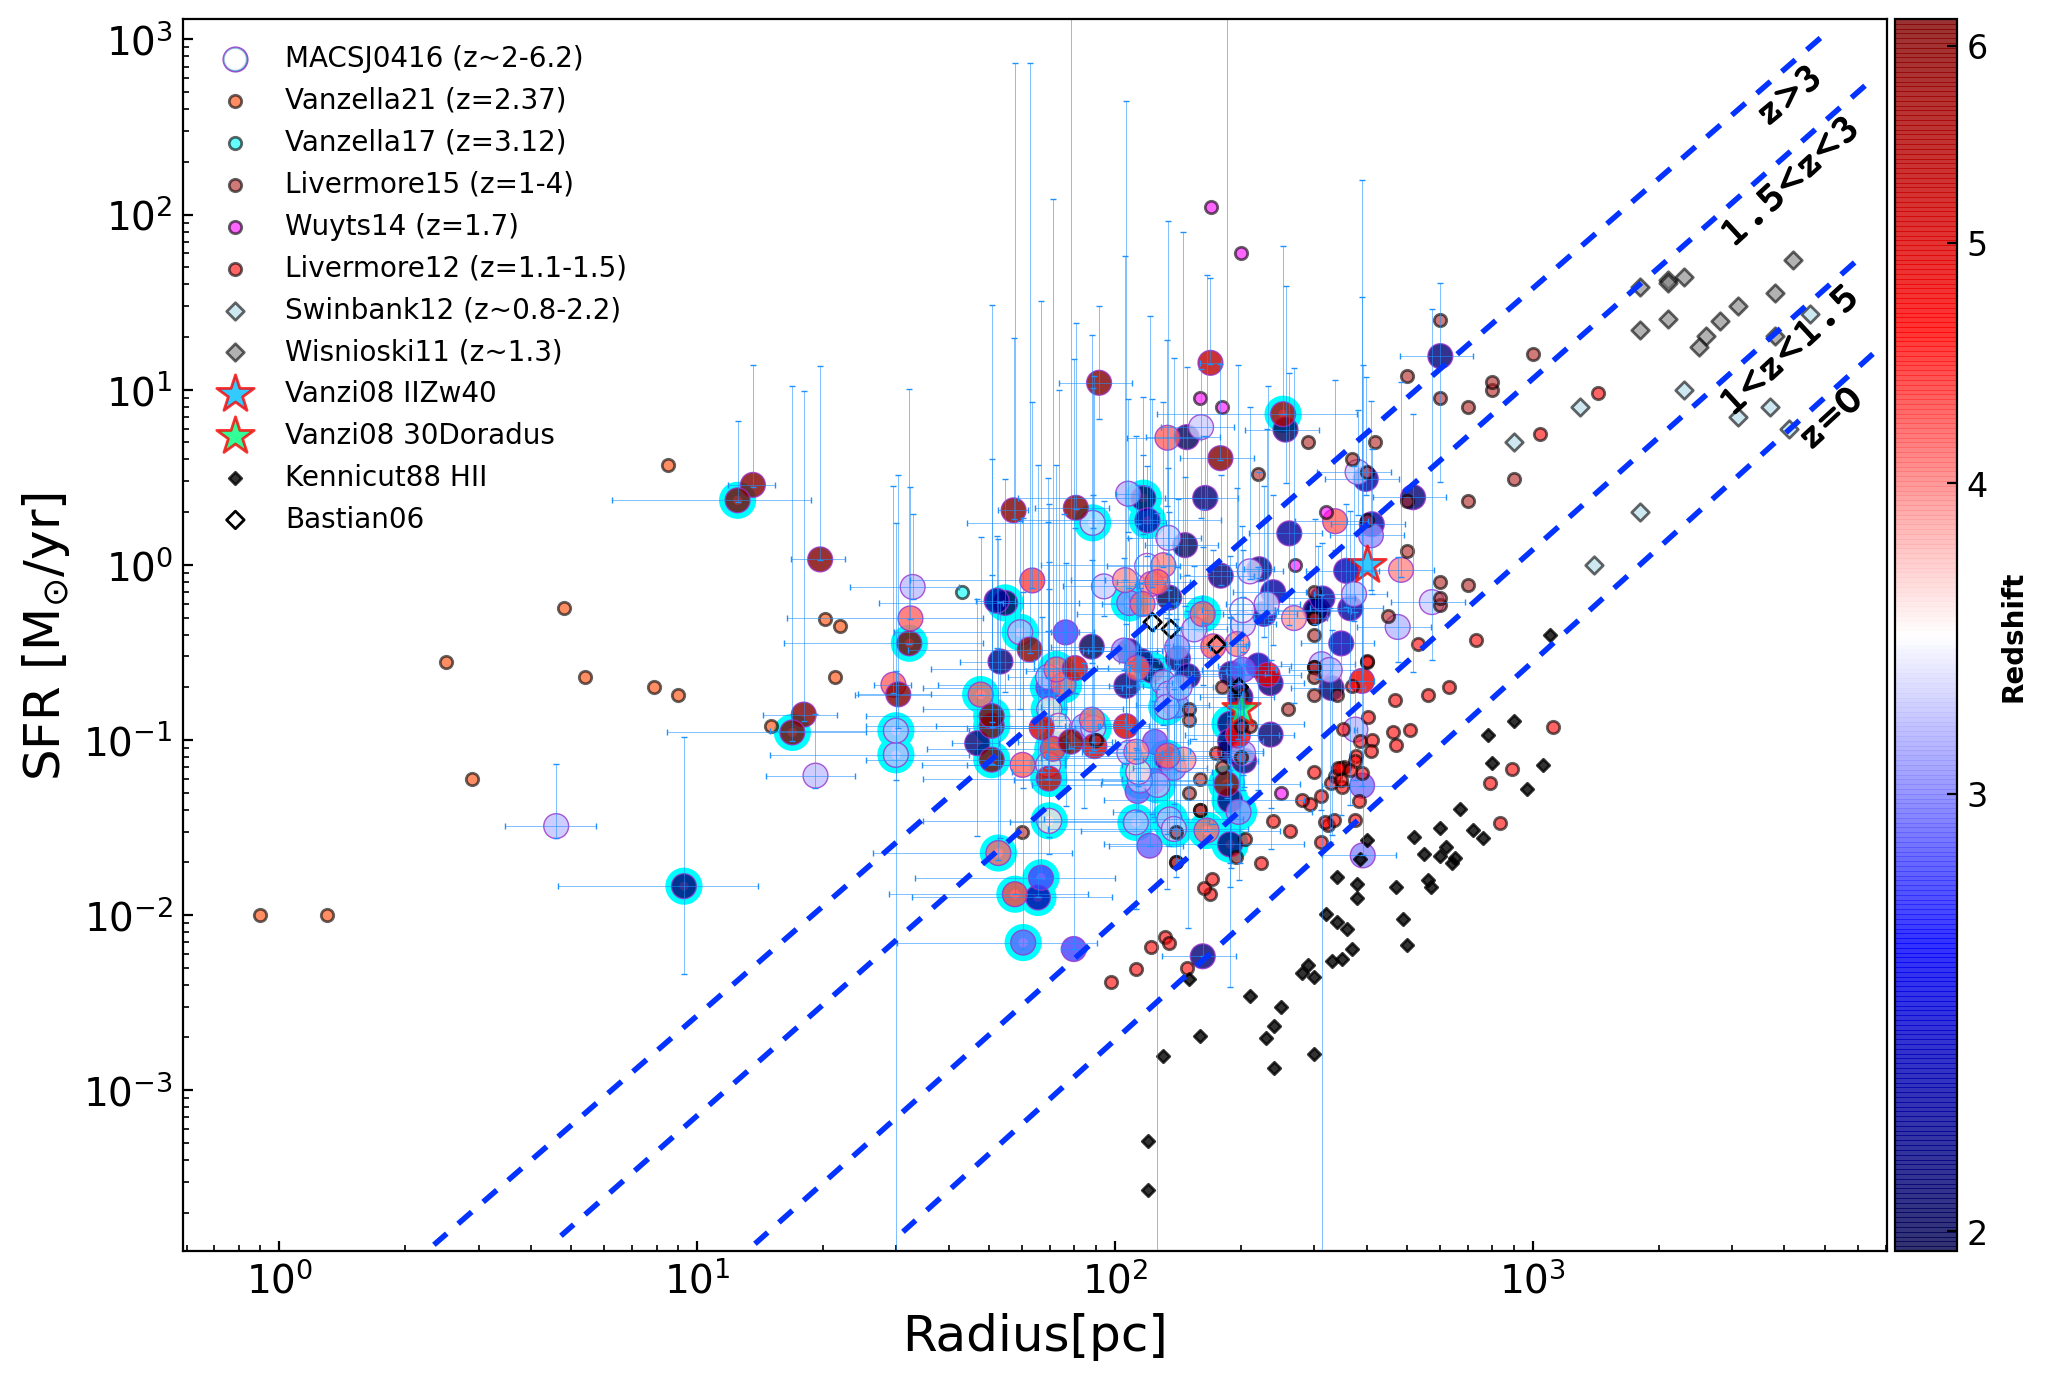
The size-SFR relation has been already well defined in the local Universe investigating HII regions in nearby spiral and irregular galaxies by Kennicutt (1988). On the other hand, outliers are mainly hosted by interacting systems as shown in the case of the Antennae galaxy (Bastian et al., 2006), and have been thoroughly investigated on a larger samples with DYNAMO (Green et al., 2013) and LARS (Messa et al., 2019). In Figure 10, we show the relation between the size and star-formation rate of clumps, including samples across different redshifts (Swinbank et al., 2009; Jones et al., 2010; Swinbank et al., 2012; Livermore et al., 2012, 2015; Johnson et al., 2017). We consider samples where SFRs was estimated through SED fitting (as for our sample) or from H, using the prescription by Kennicutt (1988). Our sample and the Sunburst clumps (Vanzella et al., 2021a), despite being at , have sizes comparable to local HII regions and GCs (Jones et al., 2010; Swinbank et al., 2009; Livermore et al., 2012; Johnson et al., 2017), but they have SFRs times higher. They also have SFRs times higher than clumps from Wuyts et al. (2014) and Livermore et al. (2015), which are part of a sample of lensed systems at . In particular, we compare our sample with two well-known HII regions from the local Universe: 30 Doradus and II Zw40 (Vanzi et al., 2008). One possible explanation for the high SFR measured in our sample is enhanced interactions, or larger gas reservoirs at high redshift. Similar cases have been observed in the local Universe, for example, the Antennae galaxy which is a local merging system hosting six star-forming complexes whose SFR ranges from 0.2–1.4 M⊙ yr-1, significantly higher than other local star-forming regions. Three of those complexes show signatures of Wolf-Rayet stars, implying young ages of (Bastian et al., 2006). Similar properties are observed in the Sunburst 5.1 knot presented in detail in Vanzella et al. (2021a) and in some of our clumps shown in Figure D.1 of Vanzella et al. (2021b). Other scenarios, such as the fragmentation of gas-rich discs, are potentially responsible for the observed high SFR among high redshift clumpy structures (Noguchi, 1999; Dekel et al., 2009). During this process, cold gas cools becoming unstable and the galactic disc starts to fragments and forms clumpy structures. Further on, such newly formed structures lead to the increased SFR as discussed in i.e. Immeli et al. (2004).
6 Summary and Conclusions
In this paper, we have presented a sample of 166 gravitationally lensed clumps spanning the spectroscopic redshift interval , magnified by a factor and located behind the cosmic lens HFF MACS J0416 field. This is the largest sample of lensed clumps currently available at these redshifts for which we have measured physical sizes and stellar masses, which critically benefits from spectroscopic observations of the MUSE Deep Lensed Field (Vanzella et al., 2021b). We carefully derived the effective radius for each clump and total magnitude in the reference filter (UV rest-frame) and inferred physical properties through SED fitting over seven HST bands, including the ground-based VLT/HAWKI Ks. To this end, we take advantage of our high-precision cluster lens model, which is based on currently the largest number of spectroscopic multiple images, thus deriving intrinsic sizes, luminosities, SFR, and stellar masses. Owing to lensing magnification and magnification, we probe stellar masses of clumps down to M⊙ and physical scales as small as pc.
We investigate the mass-SFR, mass-, and size-SFR scaling relations and compare them with several spectroscopic low and high-redshift samples from the literature (from lensed systems and field). The main results of our work are summarized as follows:
-
i)
Gravitational lensing allows us to probe sizes in the range pc and stellar masses in the range . As expected, a linear - relation is observed, with the most magnified clumps being also the smallest. The properties (, M⋆) of our observed clumps are comparable to those of high-resolution simulations, although they cover spatial resolutions that such simulations do not achieve (e.g. of tens of pc). Stellar ages estimated for our clumps spans from 1 Myr to 2.6 Gyr, suggesting that clumps could survive longer than estimated by current simulations.
-
ii)
Statistically, at the given angular resolution provided by HST, whenever magnification increases (the effective resolution increases), new individual star-forming clumps emerge. This is observed specifically on multiple images of the same system experiencing different magnifications. AO-assisted instrumentation achieving better spatial resolution is needed to understand whether such a trend continues down to single star clusters scale ( pc).
-
iii)
No clumps with radii R pc (or kpc size clumps) are observed in our sample, while such clumps are usually observed in field which cover larger survey volumes.
-
iv)
In the stellar mass surface density - stellar mass plane our clumps occupy the region between galaxies and GCs (), where only few sources have been found so far (e.g. M32 nuclei, Norris et al., 2014). While this may indicate a population of objects that bridge galaxies with GCs, it could also be an effect of resolution, as higher magnified clumps tend to lie closer to the GCs region.
-
v)
We stress that the study of Santini et al. (2017) probes masses M, while our sample have masses down to . However, it appears that after comparing our results with those from Santini et al. (2017) we notice that clumps in our sample are active sites of star formation, with 30% of them being starbursting (i.e. they are located on average dex above the main-sequence at their redshift). Therefore, it appears that the SFR of the clumps are higher when compared with local star-forming regions of higher masses.
-
vi)
Currently, available simulations are unable to reproduce clumps with small sizes and masses at high redshifts as observed in our sample.
The physical properties of the high-redshift clumps remain relatively unexplored, and their role in the formation and evolution of the galaxies is not clear. Shortly, the JWST telescope will help us to better constrain and understand the physical parameters of the clumpy formation detected in the distant galaxies by extending the probed wavelength range in the optical rest-frame (redward of the K-band) with both imaging and spectroscopy, reaching with NIRCam an expected PSF FWHM smaller than up to 5.
Acknowledgements
We would like to thank anonymous referee for very useful comments which gave us a possibility to improve our work and address several issues that were initially overlooked. This project is partially funded by PRIM-MIUR 2017WSCC32 “Zooming into dark matter and proto-galaxies with massive lensing clusters”. We acknowledge funding from the INAF for “interventi aggiuntivi a sostegno della ricerca di main-stream” (1.05.01.86.31). We acknowledges support from PRIN INAF 1.05.01.85.01. GBC acknowledges the Max Planck Society for financial support through the Max Planck Research Group for S. H. Suyu and the academic support from the German Centre for Cosmological Lensing. We would like to thanks developers of the open-source packages for Python used in this work: Matplotlib (Hunter, 2007), Pandas (McKinney et al., 2010), NumPy (Harris et al., 2020). Also we would like to acknowledge TOPCAT (Taylor, 2005).
Data Availability
The data used in this study will be shared upon reasonable request to the corresponding author.
References
- Adamo et al. (2013) Adamo A., Östlin G., Bastian N., Zackrisson E., Livermore R. C., Guaita L., 2013, ApJ, 766, 105
- Bastian et al. (2006) Bastian N., Emsellem E., Kissler-Patig M., Maraston C., 2006, A&A, 445, 471
- Behrendt et al. (2016) Behrendt M., Burkert A., Schartmann M., 2016, ApJ, 819, L2
- Bender et al. (1992) Bender R., Burstein D., Faber S. M., 1992, ApJ, 399, 462
- Bergamini et al. (2021) Bergamini P., et al., 2021, A&A, 645, A140
- Bernardi et al. (2003) Bernardi M., et al., 2003, AJ, 125, 1866
- Bertin & Arnouts (1996) Bertin E., Arnouts S., 1996, A&AS, 117, 393
- Bournaud (2016) Bournaud F., 2016, in Discs in galaxies (Discs 2016). p. 1, doi:10.5281/zenodo.163061
- Bournaud et al. (2008) Bournaud F., et al., 2008, A&A, 486, 741
- Bournaud et al. (2014) Bournaud F., et al., 2014, ApJ, 780, 57
- Bouwens et al. (2021) Bouwens R. J., Illingworth G. D., van Dokkum P. G., Ribeiro B., Oesch P. A., Stefanon M., 2021, AJ, 162, 255
- Brammer et al. (2016) Brammer G. B., et al., 2016, ApJS, 226, 6
- Brinchmann et al. (2004) Brinchmann J., Charlot S., White S. D. M., Tremonti C., Kauffmann G., Heckman T., Brinkmann J., 2004, MNRAS, 351, 1151
- Bruzual & Charlot (2003) Bruzual G., Charlot S., 2003, MNRAS, 344, 1000
- Buck et al. (2017) Buck T., Macciò A. V., Obreja A., Dutton A. A., Domínguez-Tenreiro R., Granato G. L., 2017, MNRAS, 468, 3628
- Calura et al. (2021) Calura F., et al., 2021, MNRAS, 500, 3083
- Calzetti et al. (2000) Calzetti D., Armus L., Bohlin R. C., Kinney A. L., Koornneef J., Storchi-Bergmann T., 2000, ApJ, 533, 682
- Caminha et al. (2017) Caminha G. B., et al., 2017, A&A, 600, A90
- Castellano et al. (2014) Castellano M., et al., 2014, A&A, 566, A19
- Castellano et al. (2016) Castellano M., et al., 2016, A&A, 590, A31
- Cava et al. (2018) Cava A., Schaerer D., Richard J., Pérez-González P. G., Dessauges-Zavadsky M., Mayer L., Tamburello V., 2018, Nature Astronomy, 2, 76
- Ceverino et al. (2010) Ceverino D., Dekel A., Bournaud F., 2010, MNRAS, 404, 2151
- Cibinel et al. (2017) Cibinel A., et al., 2017, MNRAS, 469, 4683
- Conselice (2014) Conselice C. J., 2014, ARA&A, 52, 291
- Cowie et al. (1995) Cowie L. L., Hu E. M., Songaila A., 1995, AJ, 110, 1576
- Dabringhausen et al. (2008) Dabringhausen J., Hilker M., Kroupa P., 2008, MNRAS, 386, 864
- Dekel et al. (2009) Dekel A., Sari R., Ceverino D., 2009, ApJ, 703, 785
- Dessauges-Zavadsky et al. (2017) Dessauges-Zavadsky M., Schaerer D., Cava A., Mayer L., Tamburello V., 2017, ApJ, 836, L22
- Dessauges-Zavadsky et al. (2019) Dessauges-Zavadsky M., et al., 2019, Nature Astronomy, 3, 1115
- Elmegreen et al. (2005) Elmegreen D. M., Elmegreen B. G., Rubin D. S., Schaffer M. A., 2005, ApJ, 631, 85
- Elmegreen et al. (2007) Elmegreen D. M., Elmegreen B. G., Ravindranath S., Coe D. A., 2007, ApJ, 658, 763
- Elmegreen et al. (2009) Elmegreen B. G., Elmegreen D. M., Fernandez M. X., Lemonias J. J., 2009, ApJ, 692, 12
- Fan et al. (2006) Fan X., et al., 2006, AJ, 132, 117
- Faure et al. (2021) Faure B., Bournaud F., Fensch J., Daddi E., Behrendt M., Burkert A., Richard J., 2021, MNRAS, 502, 4641
- Fensch & Bournaud (2021) Fensch J., Bournaud F., 2021, MNRAS, 505, 3579
- Fontana et al. (2000) Fontana A., D’Odorico S., Poli F., Giallongo E., Arnouts S., Cristiani S., Moorwood A., Saracco P., 2000, AJ, 120, 2206
- Förster Schreiber et al. (2011) Förster Schreiber N. M., Shapley A. E., Erb D. K., Genzel R., Steidel C. C., Bouché N., Cresci G., Davies R., 2011, ApJ, 731, 65
- Förster Schreiber et al. (2018) Förster Schreiber N. M., et al., 2018, ApJS, 238, 21
- Genel et al. (2012) Genel S., et al., 2012, ApJ, 745, 11
- Genzel et al. (2011) Genzel R., et al., 2011, ApJ, 733, 101
- Green et al. (2013) Green A. W., et al., 2013, Monthly Notices of the Royal Astronomical Society, 437, 1070
- Guo et al. (2012) Guo Y., Giavalisco M., Ferguson H. C., Cassata P., Koekemoer A. M., 2012, ApJ, 757, 120
- Guo et al. (2015) Guo Y., et al., 2015, ApJ, 800, 39
- Guo et al. (2018) Guo Y., et al., 2018, ApJ, 853, 108
- Harris et al. (2020) Harris C. R., et al., 2020, Nature, 585, 357
- Hinojosa-Goñi et al. (2016) Hinojosa-Goñi R., Muñoz-Tuñón C., Méndez-Abreu J., 2016, A&A, 592, A122
- Hopkins et al. (2008) Hopkins P. F., Hernquist L., Cox T. J., Kereš D., 2008, ApJS, 175, 356
- Hopkins et al. (2010) Hopkins P. F., et al., 2010, ApJ, 724, 915
- Hunter (2007) Hunter J. D., 2007, Computing in Science & Engineering, 9, 90
- Iani et al. (2021) Iani E., et al., 2021, MNRAS, 507, 3830
- Immeli et al. (2004) Immeli A., Samland M., Gerhard O., Westera P., 2004, A&A, 413, 547
- Johnson et al. (2017) Johnson T. L., et al., 2017, ApJ, 843, L21
- Jones et al. (2010) Jones T. A., Swinbank A. M., Ellis R. S., Richard J., Stark D. P., 2010, MNRAS, 404, 1247
- Karman et al. (2017) Karman W., et al., 2017, A&A, 599, A28
- Kennicutt (1988) Kennicutt Robert C. J., 1988, ApJ, 334, 144
- Kennicutt (1998) Kennicutt Robert C. J., 1998, ARA&A, 36, 189
- Kim et al. (2018) Kim J.-h., et al., 2018, MNRAS, 474, 4232
- Koekemoer et al. (2014) Koekemoer A. M., et al., 2014, in American Astronomical Society Meeting Abstracts #223. p. 254.02
- Kormendy (1977) Kormendy J., 1977, ApJ, 218, 333
- Kormendy et al. (2009) Kormendy J., Fisher D. B., Cornell M. E., Bender R., 2009, ApJS, 182, 216
- Livermore et al. (2012) Livermore R. C., et al., 2012, MNRAS, 427, 688
- Livermore et al. (2015) Livermore R. C., et al., 2015, MNRAS, 450, 1812
- Lotz et al. (2017) Lotz J. M., et al., 2017, ApJ, 837, 97
- Ma et al. (2020) Ma X., et al., 2020, MNRAS, 493, 4315
- Mandelker et al. (2014) Mandelker N., Dekel A., Ceverino D., Tweed D., Moody C. E., Primack J., 2014, MNRAS, 443, 3675
- Mandelker et al. (2017) Mandelker N., Dekel A., Ceverino D., DeGraf C., Guo Y., Primack J., 2017, MNRAS, 464, 635
- McKinney et al. (2010) McKinney W., et al., 2010, in Proceedings of the 9th Python in Science Conference. pp 51–56
- Meneghetti (2021) Meneghetti M., 2021, Introduction to Gravitational Lensing: With Python Examples. Lecture Notes in Physics, Springer International Publishing, https://books.google.it/books?id=hBpFzgEACAAJ
- Meneghetti et al. (2008) Meneghetti M., et al., 2008, A&A, 482, 403
- Meneghetti et al. (2017) Meneghetti M., et al., 2017, MNRAS, 472, 3177
- Meng & Gnedin (2020) Meng X., Gnedin O. Y., 2020, MNRAS, 494, 1263
- Merlin et al. (2015) Merlin E., et al., 2015, A&A, 582, A15
- Merlin et al. (2016a) Merlin E., et al., 2016a, A&A, 590, A30
- Merlin et al. (2016b) Merlin E., et al., 2016b, A&A, 595, A97
- Merlin et al. (2019) Merlin E., Pilo S., Fontana A., Castellano M., Paris D., Roscani V., Santini P., Torelli M., 2019, A&A, 622, A169
- Messa et al. (2019) Messa M., Adamo A., Östlin G., Melinder J., Hayes M., Bridge J. S., Cannon J., 2019, MNRAS, 487, 4238
- Misgeld & Hilker (2011) Misgeld I., Hilker M., 2011, MNRAS, 414, 3699
- Murata et al. (2014) Murata K. L., et al., 2014, ApJ, 786, 15
- Murray et al. (2010) Murray N., Quataert E., Thompson T. A., 2010, ApJ, 709, 191
- Noeske et al. (2007) Noeske K. G., et al., 2007, ApJ, 660, L43
- Noguchi (1999) Noguchi M., 1999, ApJ, 514, 77
- Norris & Kannappan (2011) Norris M. A., Kannappan S. J., 2011, MNRAS, 414, 739
- Norris et al. (2014) Norris M. A., et al., 2014, MNRAS, 443, 1151
- Oke (1974) Oke J. B., 1974, ApJ, 189, L47
- Oklopčić et al. (2017) Oklopčić A., Hopkins P. F., Feldmann R., Kereš D., Faucher-Giguère C.-A., Murray N., 2017, MNRAS, 465, 952
- Peng et al. (2002) Peng C. Y., Ho L. C., Impey C. D., Rix H.-W., 2002, AJ, 124, 266
- Peng et al. (2010) Peng C. Y., Ho L. C., Impey C. D., Rix H.-W., 2010, AJ, 139, 2097
- Pfeffer & Baumgardt (2013) Pfeffer J., Baumgardt H., 2013, MNRAS, 433, 1997
- Phipps et al. (2020) Phipps F., Khochfar S., Varri A. L., Dalla Vecchia C., 2020, A&A, 641, A132
- Plazas et al. (2019) Plazas A. A., Meneghetti M., Maturi M., Rhodes J., 2019, MNRAS, 482, 2823
- Prevot et al. (1984) Prevot M. L., Lequeux J., Maurice E., Prevot L., Rocca-Volmerange B., 1984, A&A, 132, 389
- Puech (2010) Puech M., 2010, MNRAS, 406, 535
- Ribeiro et al. (2017) Ribeiro B., et al., 2017, A&A, 608, A16
- Richard et al. (2021) Richard J., et al., 2021, A&A, 646, A83
- Rigby et al. (2017) Rigby J. R., et al., 2017, TEMPLATES: Targeting Extremely Magnified Panchromatic Lensed Arcs and Their Extended Star Formation, JWST Proposal ID 1355. Cycle 0 Early Release Science
- Rinaldi et al. (2021) Rinaldi P., Caputi K. I., van Mierlo S., Ashby M. L. N., Caminha G. B., Iani E., 2021, arXiv e-prints, p. arXiv:2112.03935
- Rivera-Thorsen et al. (2019) Rivera-Thorsen T. E., et al., 2019, Science, 366, 738
- Rodighiero et al. (2010) Rodighiero G., et al., 2010, A&A, 518, L25
- Salpeter (1955) Salpeter E. E., 1955, ApJ, 121, 161
- Santini et al. (2017) Santini P., et al., 2017, ApJ, 847, 76
- Schaerer & de Barros (2009) Schaerer D., de Barros S., 2009, A&A, 502, 423
- Shibuya et al. (2015) Shibuya T., Ouchi M., Harikane Y., 2015, ApJS, 219, 15
- Somerville et al. (2000) Somerville R. S., Primack J. R., Faber S. M., 2000, arXiv e-prints, pp astro–ph/0006364
- Sparre et al. (2015) Sparre M., et al., 2015, MNRAS, 447, 3548
- Straughn et al. (2015) Straughn A. N., et al., 2015, ApJ, 814, 97
- Swinbank et al. (2009) Swinbank A. M., et al., 2009, MNRAS, 400, 1121
- Swinbank et al. (2012) Swinbank A. M., Smail I., Sobral D., Theuns T., Best P. N., Geach J. E., 2012, ApJ, 760, 130
- Tamburello et al. (2015) Tamburello V., Mayer L., Shen S., Wadsley J., 2015, MNRAS, 453, 2490
- Tamburello et al. (2017) Tamburello V., Rahmati A., Mayer L., Cava A., Dessauges-Zavadsky M., Schaerer D., 2017, MNRAS, 468, 4792
- Taylor (2005) Taylor M. B., 2005, in Shopbell P., Britton M., Ebert R., eds, Astronomical Society of the Pacific Conference Series Vol. 347, Astronomical Data Analysis Software and Systems XIV. p. 29
- Tody (1986) Tody D., 1986, in Crawford D. L., ed., Proc. SPIEVol. 627, Instrumentation in astronomy VI. p. 733, doi:10.1117/12.968154
- Vanzella et al. (2016) Vanzella E., et al., 2016, ApJ, 825, 41
- Vanzella et al. (2017a) Vanzella E., et al., 2017a, MNRAS, 467, 4304
- Vanzella et al. (2017b) Vanzella E., et al., 2017b, MNRAS, 467, 4304
- Vanzella et al. (2019) Vanzella E., et al., 2019, MNRAS, 483, 3618
- Vanzella et al. (2020) Vanzella E., et al., 2020, MNRAS, 491, 1093
- Vanzella et al. (2021a) Vanzella E., et al., 2021a, arXiv e-prints, p. arXiv:2106.10280
- Vanzella et al. (2021b) Vanzella E., et al., 2021b, A&A, 646, A57
- Vanzi et al. (2008) Vanzi L., Cresci G., Telles E., Melnick J., 2008, A&A, 486, 393
- Whitaker et al. (2012) Whitaker K. E., van Dokkum P. G., Brammer G., Franx M., 2012, ApJ, 754, L29
- Wisnioski et al. (2011) Wisnioski E., et al., 2011, MNRAS, 417, 2601
- Wuyts et al. (2012) Wuyts S., et al., 2012, ApJ, 753, 114
- Wuyts et al. (2014) Wuyts E., Rigby J. R., Gladders M. D., Sharon K., 2014, ApJ, 781, 61
- Zanella et al. (2015) Zanella A., et al., 2015, Nature, 521, 54
- Zanella et al. (2019) Zanella A., et al., 2019, MNRAS, 489, 2792
Appendix A Mass – size relation
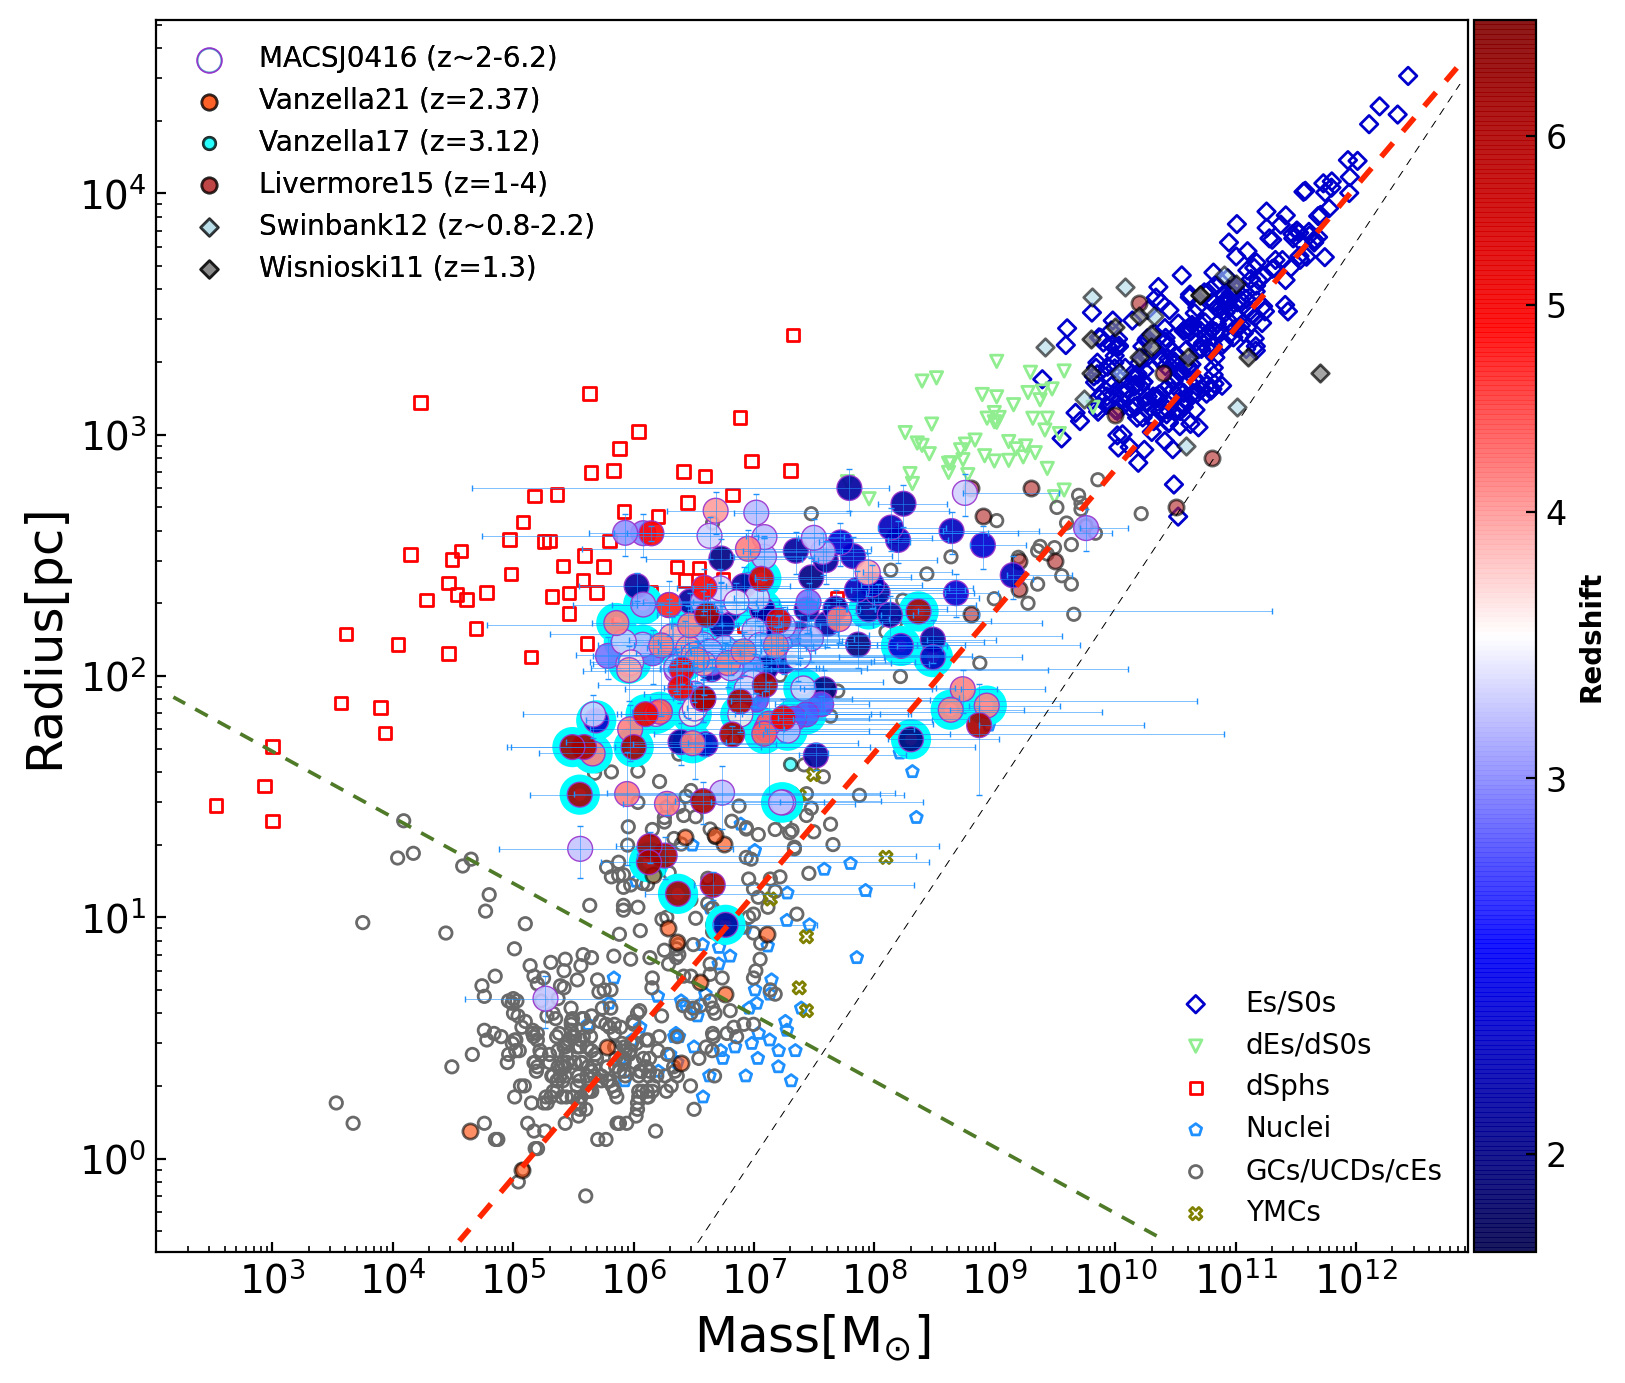
In Figure 11, we present the mass-size relation which includes samples from the literature observed in field and lensed systems. Recently, Bouwens et al. (2021) examined the same scaling relation focusing on low-luminosity objects with photometrically estimated redshifts at (333 sources in total) extracted from lensed fields. Our MACS J0416 sample is marked with big circles color-coded based on the redshift (right colorbar). Samples of clumps observed in lensed fields are marked with filled circles, while clumpy samples in field are marked with filled diamonds. The comparison sample of sources from the local Universe is represented by open symbols adopted from Norris et al. (2014). We note that MACS J0416 sample probe stellar structures at below and 100 pc, thus bridging the gap between the low mass-size objects in the local Universe and their counterparts at high redshifts. Recent studies have probed similar parameter space, (Vanzella et al. (2017b), Vanzella et al. (2021a), Vanzella et al. (2019)) by focusing on individual systems, whereas we present here a statistically representative sample of compact stellar structures, which complements studies in field and cover the upper right corner of the plot.
By comparing our spectroscopic sample with the one presented by Bouwens et al. (2021), who used different public lens models to estimate intrinsic properties, we conclude that both samples populate the region of star cluster complexes defined in Bouwens et al. (2021).
Two different groups of stellar systems can be distinguished from Figure 11, galaxy-like systems (Es/S0s, dEs/dS0s, dSphs) and star clusters YMCs, GCs, UCDs. The MACS J0416 lensed sample spans the and 10–600 pc ranges, with the majority located above (or left) from the mass-size relation line (red dashed line, Dabringhausen et al., 2008) filling a scarcely populated space in between dSphs and GCs, Nuclei, and YMCs. In addition, it can be noted that clumps with lower average magnification are located closer to the dSphs, while those with higher magnification are closer to GCs, Nuclei, and YMCs stellar systems, suggesting that some of the clumps are not resolved sufficiently enough, so they may appear larger and more massive than in reality. We also note that the most magnified systems in our MACS J0416 sample populate the region in which the majority of GCs and Nuclei reside, indicating that we are starting to probe globular cluster like objects (or globular clusters precursors) at high redshift.
The black dashed line in Figure 11 is the ’zone of avoidance’ corresponding to a limiting stellar mass for a given effective radius (Misgeld & Hilker, 2011). Interestingly, none of the clumps in our sample violate this limit, indicating that SF systems at high redshift follow the same relation. Furthermore, only a few clumps are found below the green dashed line, which corresponds to a relaxation time equal to the Hubble time. All objects below the green dashed line, a region populated by GCs and Nuclei, are collisional systems, while collisionless systems lie above the green line, which include various types of galaxies and compact stellar systems.
Lastly, as suggested in Misgeld & Hilker (2011), it appears from Figure 11 that the region in the mass interval divides stellar systems into two groups. Objects with low mass, (likely affected by dynamical evolution), do not seem to follow the mass-size relation , whereas massive systems do. However, low-mass systems are also the most magnified clumps in our sample suggesting that any observed trend my be significantly affected by observation sensitivity and magnification, as discussed in Section 4.1.
Appendix B Properties of the comparison sample from the literature
As shown in the main text, to better understand the physical properties of our sample and to put it in a broader context, we compare our results with other literature studies targeting clumps in the local Universe and at high redshift. In this work we focus only on spectroscopically-confirmed samples reported in the literature. They can be divided into three categories: clumps observed in field at , clumps observed in lensed fields at , and evolved stellar systems in the local Universe. In the following, we will briefly describe the other samples observed in field at considered here.
Comparison spectroscopic samples observed in field at :
-
•
the sample from Wisnioski et al. (2011) includes 13 star-forming galaxies at from the WiggleZ Dark Energy Survey, which was selected via ultraviolet and [OII] emission. Clumps have sizes R kpc, stellar masses , and SFR . Stellar mass and SFR are estimated through SED fitting;
-
•
the sample from Swinbank et al. (2012) includes 9 H-selected galaxies at . Clumps have sizes R 0.9 - 4.6kpc, stellar masses in the range M and H-derived SFR ;
-
•
the sample from Zanella et al. (2019) includes 53 star-forming galaxies at . We only consider the 25 clumps in this sample with 3 SFR estimates. They are unresolved (R pc), have stellar masses in the range M and SFR . Stellar mass were estimated through SED fitting, whereas the SFR considered here comes from dust-corrected rest-frame UV continuum estimates;
We also compare our sample with the the following spectroscopic samples drawn from lensed fields:
-
•
the sample from Livermore et al. (2012) which includes 8 gravitationally-lensed galaxies at , where 57 clumps are detected. They have sizes in the range R pc and Hα–based SFR ;
-
•
the sample from Wuyts et al. (2014) which includes one lensed young starburst galaxy at hosting 7 individual clumps with sizes R pc and SFR ;
-
•
the sample from Livermore et al. (2015) includes 17 gravitationally-lensed galaxies at . The size of the clumps is R kpc and their SFR is derived from H or H lines and ranges from 0.8 to . Their stellar masses are M;
-
•
from the sample presented in Vanzella et al. (2017b) we include one compact and extremely young ( Myr) clump at with measured pc, SFR and stellar mass of ;
-
•
the sample from Vanzella et al. (2021a) includes one strongly lensed galaxy at (dubbed "Sunburst") where 13 star-forming clumps are detected. They have sizes R pc, stellar masses in the range M and SFR from ;
Finally, the comparison samples of evolved stellar systems in the local Universe include:
-
•
elliptical and lenticular galaxies (Es/S0s), dwarf elliptical and lenticular galaxies (dEs/dS0s), dwarf spheroidals (dSphs), nuclear star clusters (Nuclei), globular clusters (GCs), ultra compact dwarfs (UCDs), compact ellipticals (cEs), young massive clusters (YMCs) and M32 nuclei. This entire sample is from Norris et al. (2014);
-
•
30Doradus and IIZw40 from Vanzi et al. 2008;
-
•
HII regions from Kennicutt (1988);
-
•
star clusters from the Antennae galaxy (Bastian et al., 2006).
Appendix C The MACS J0416 clumps
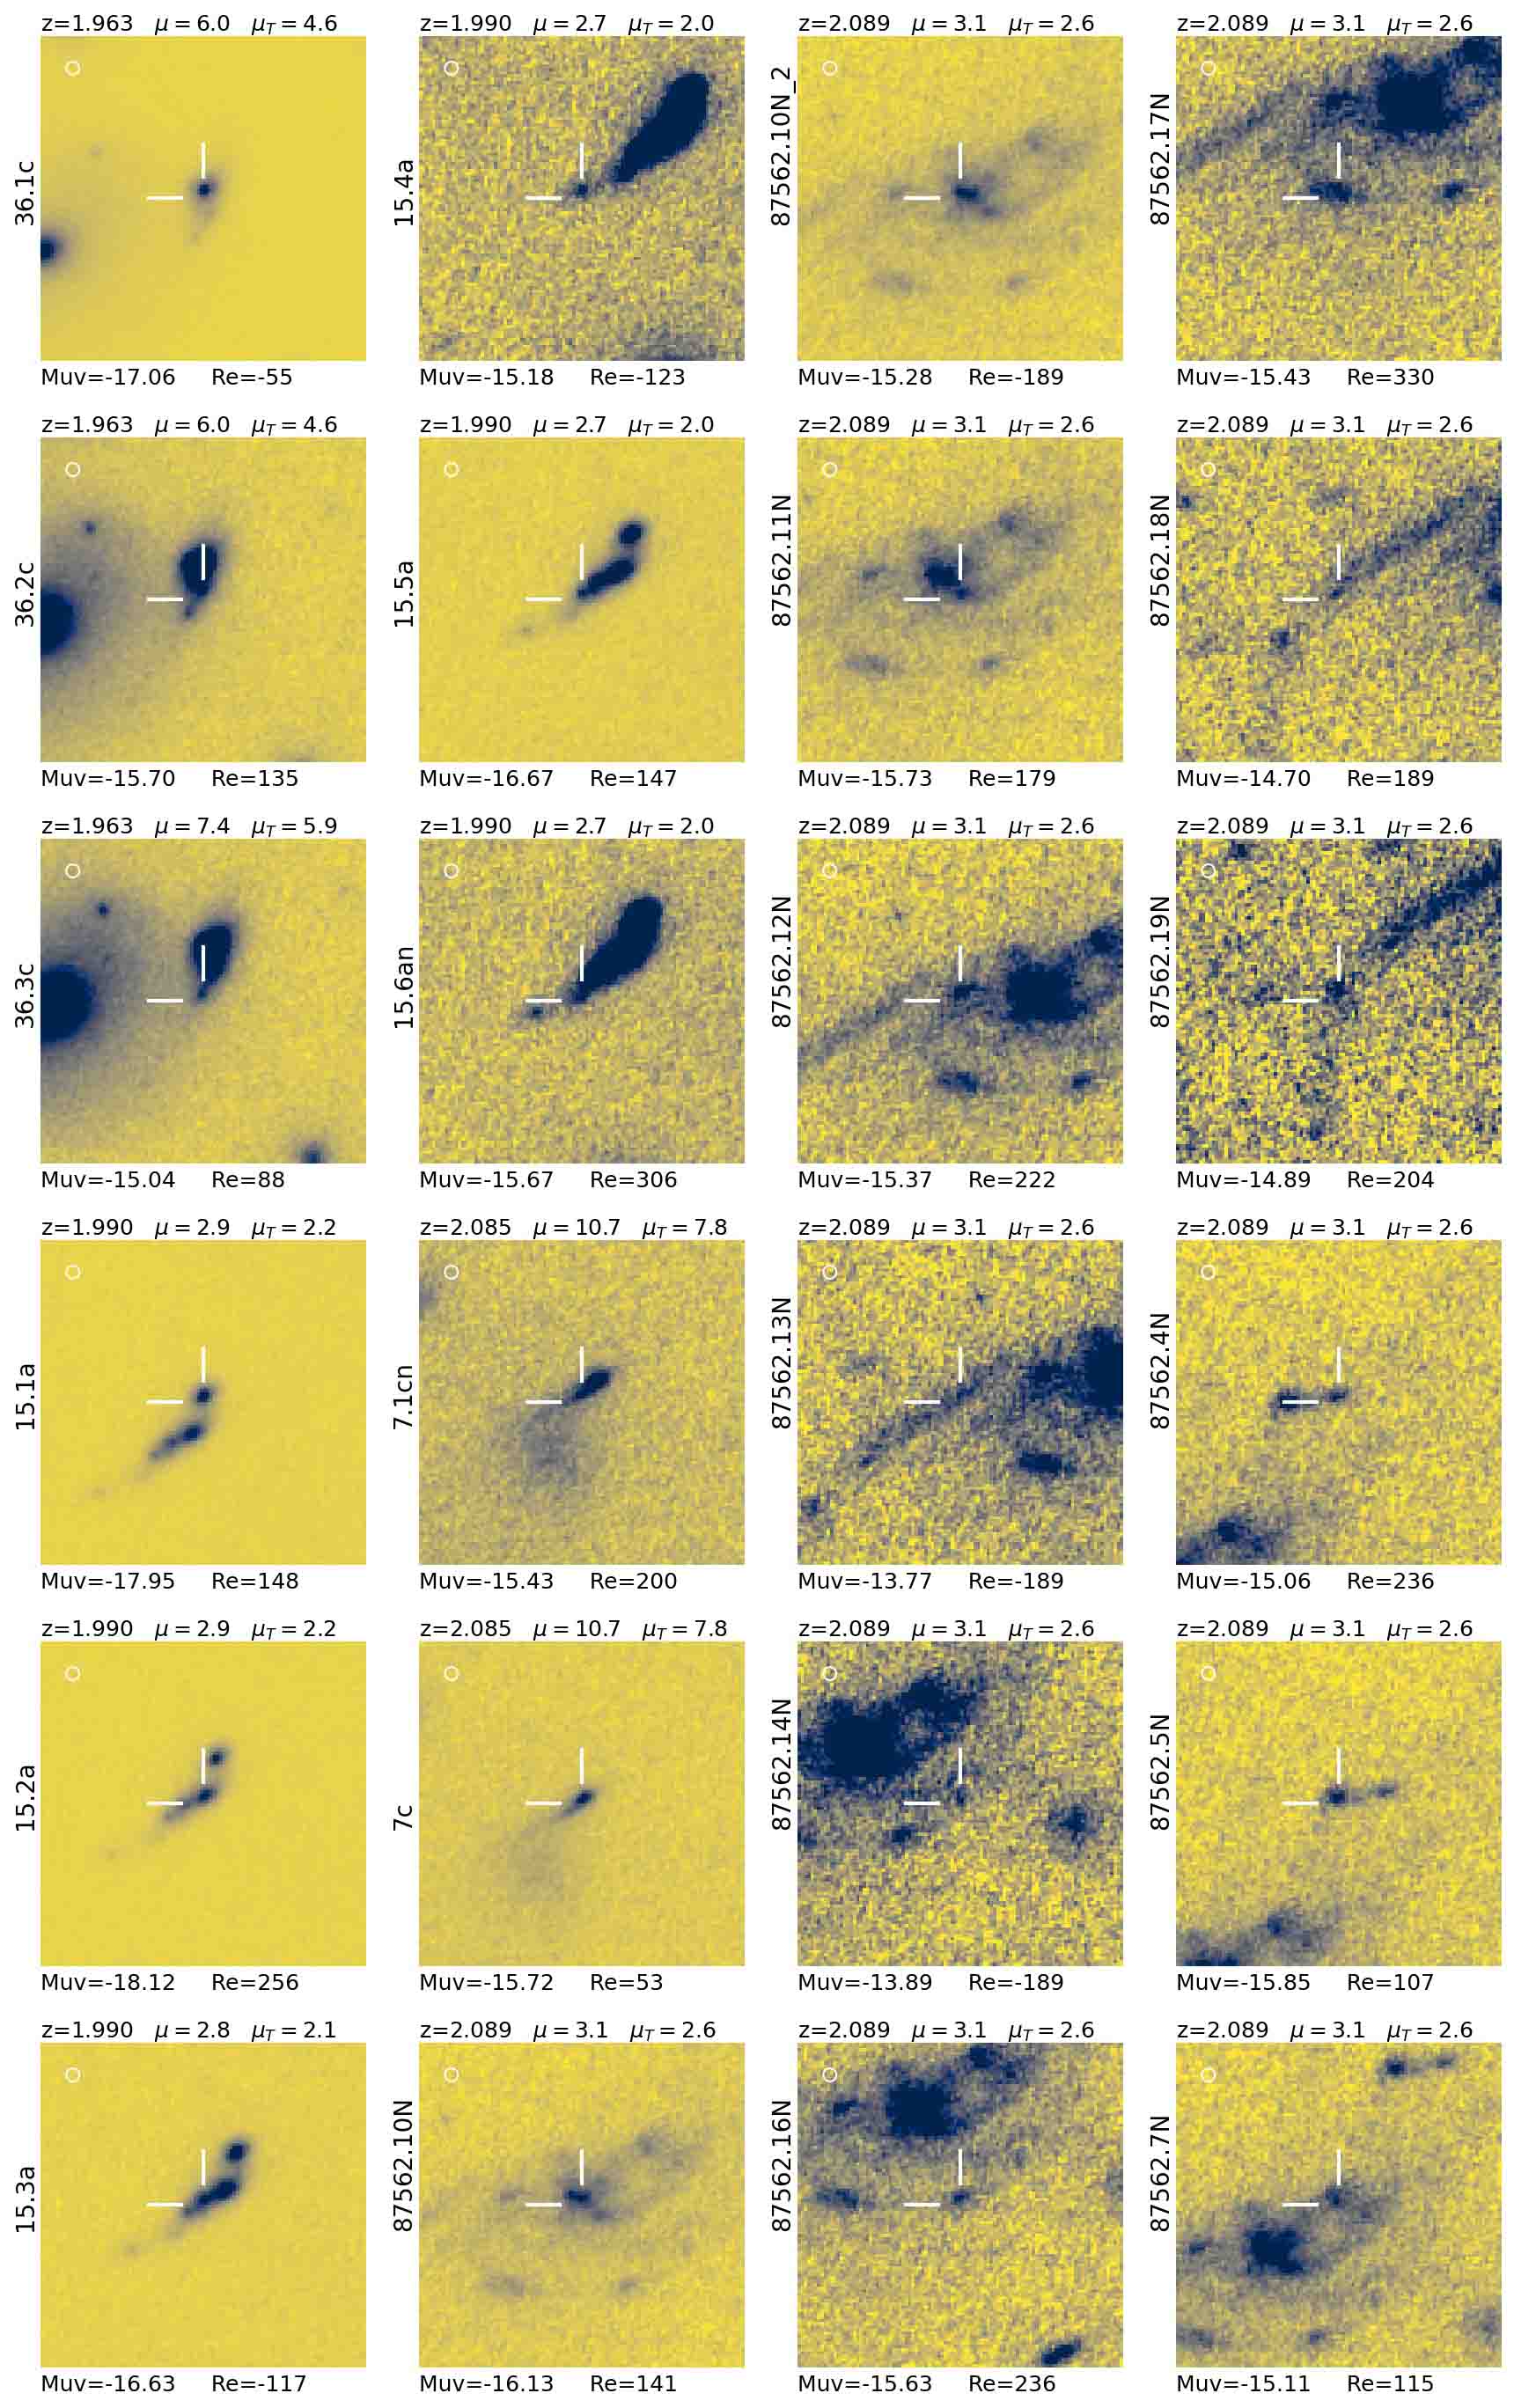
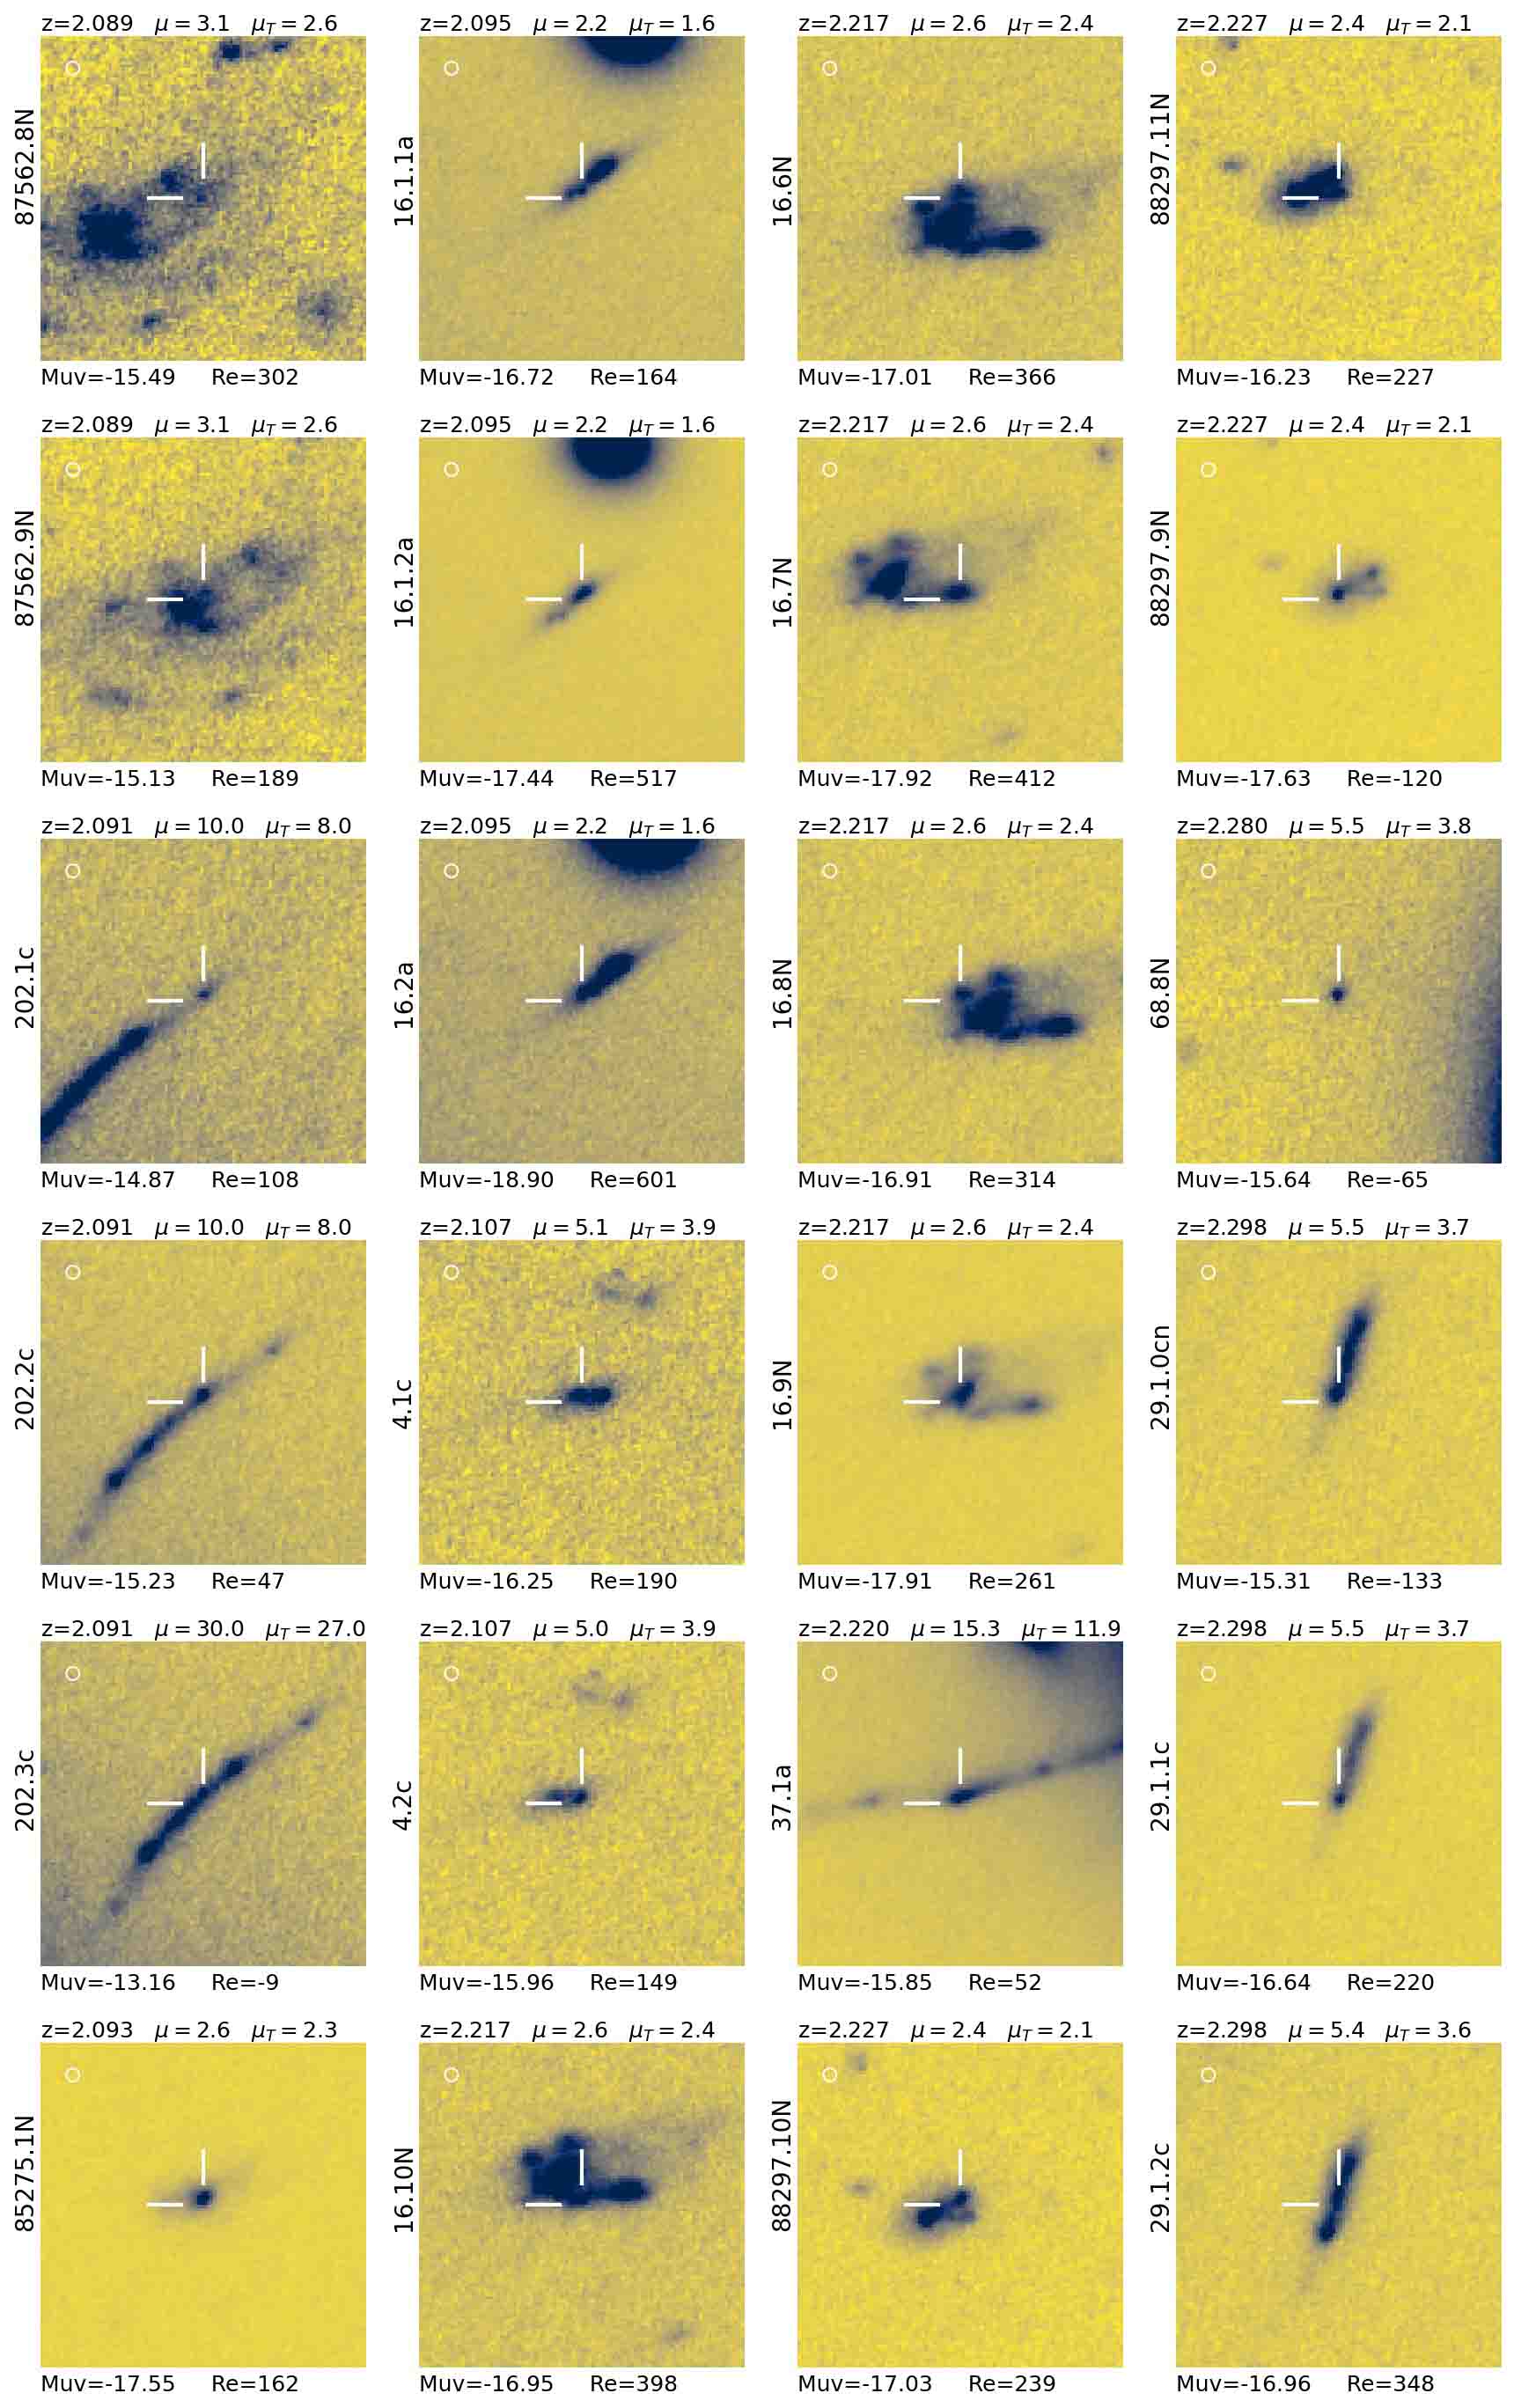
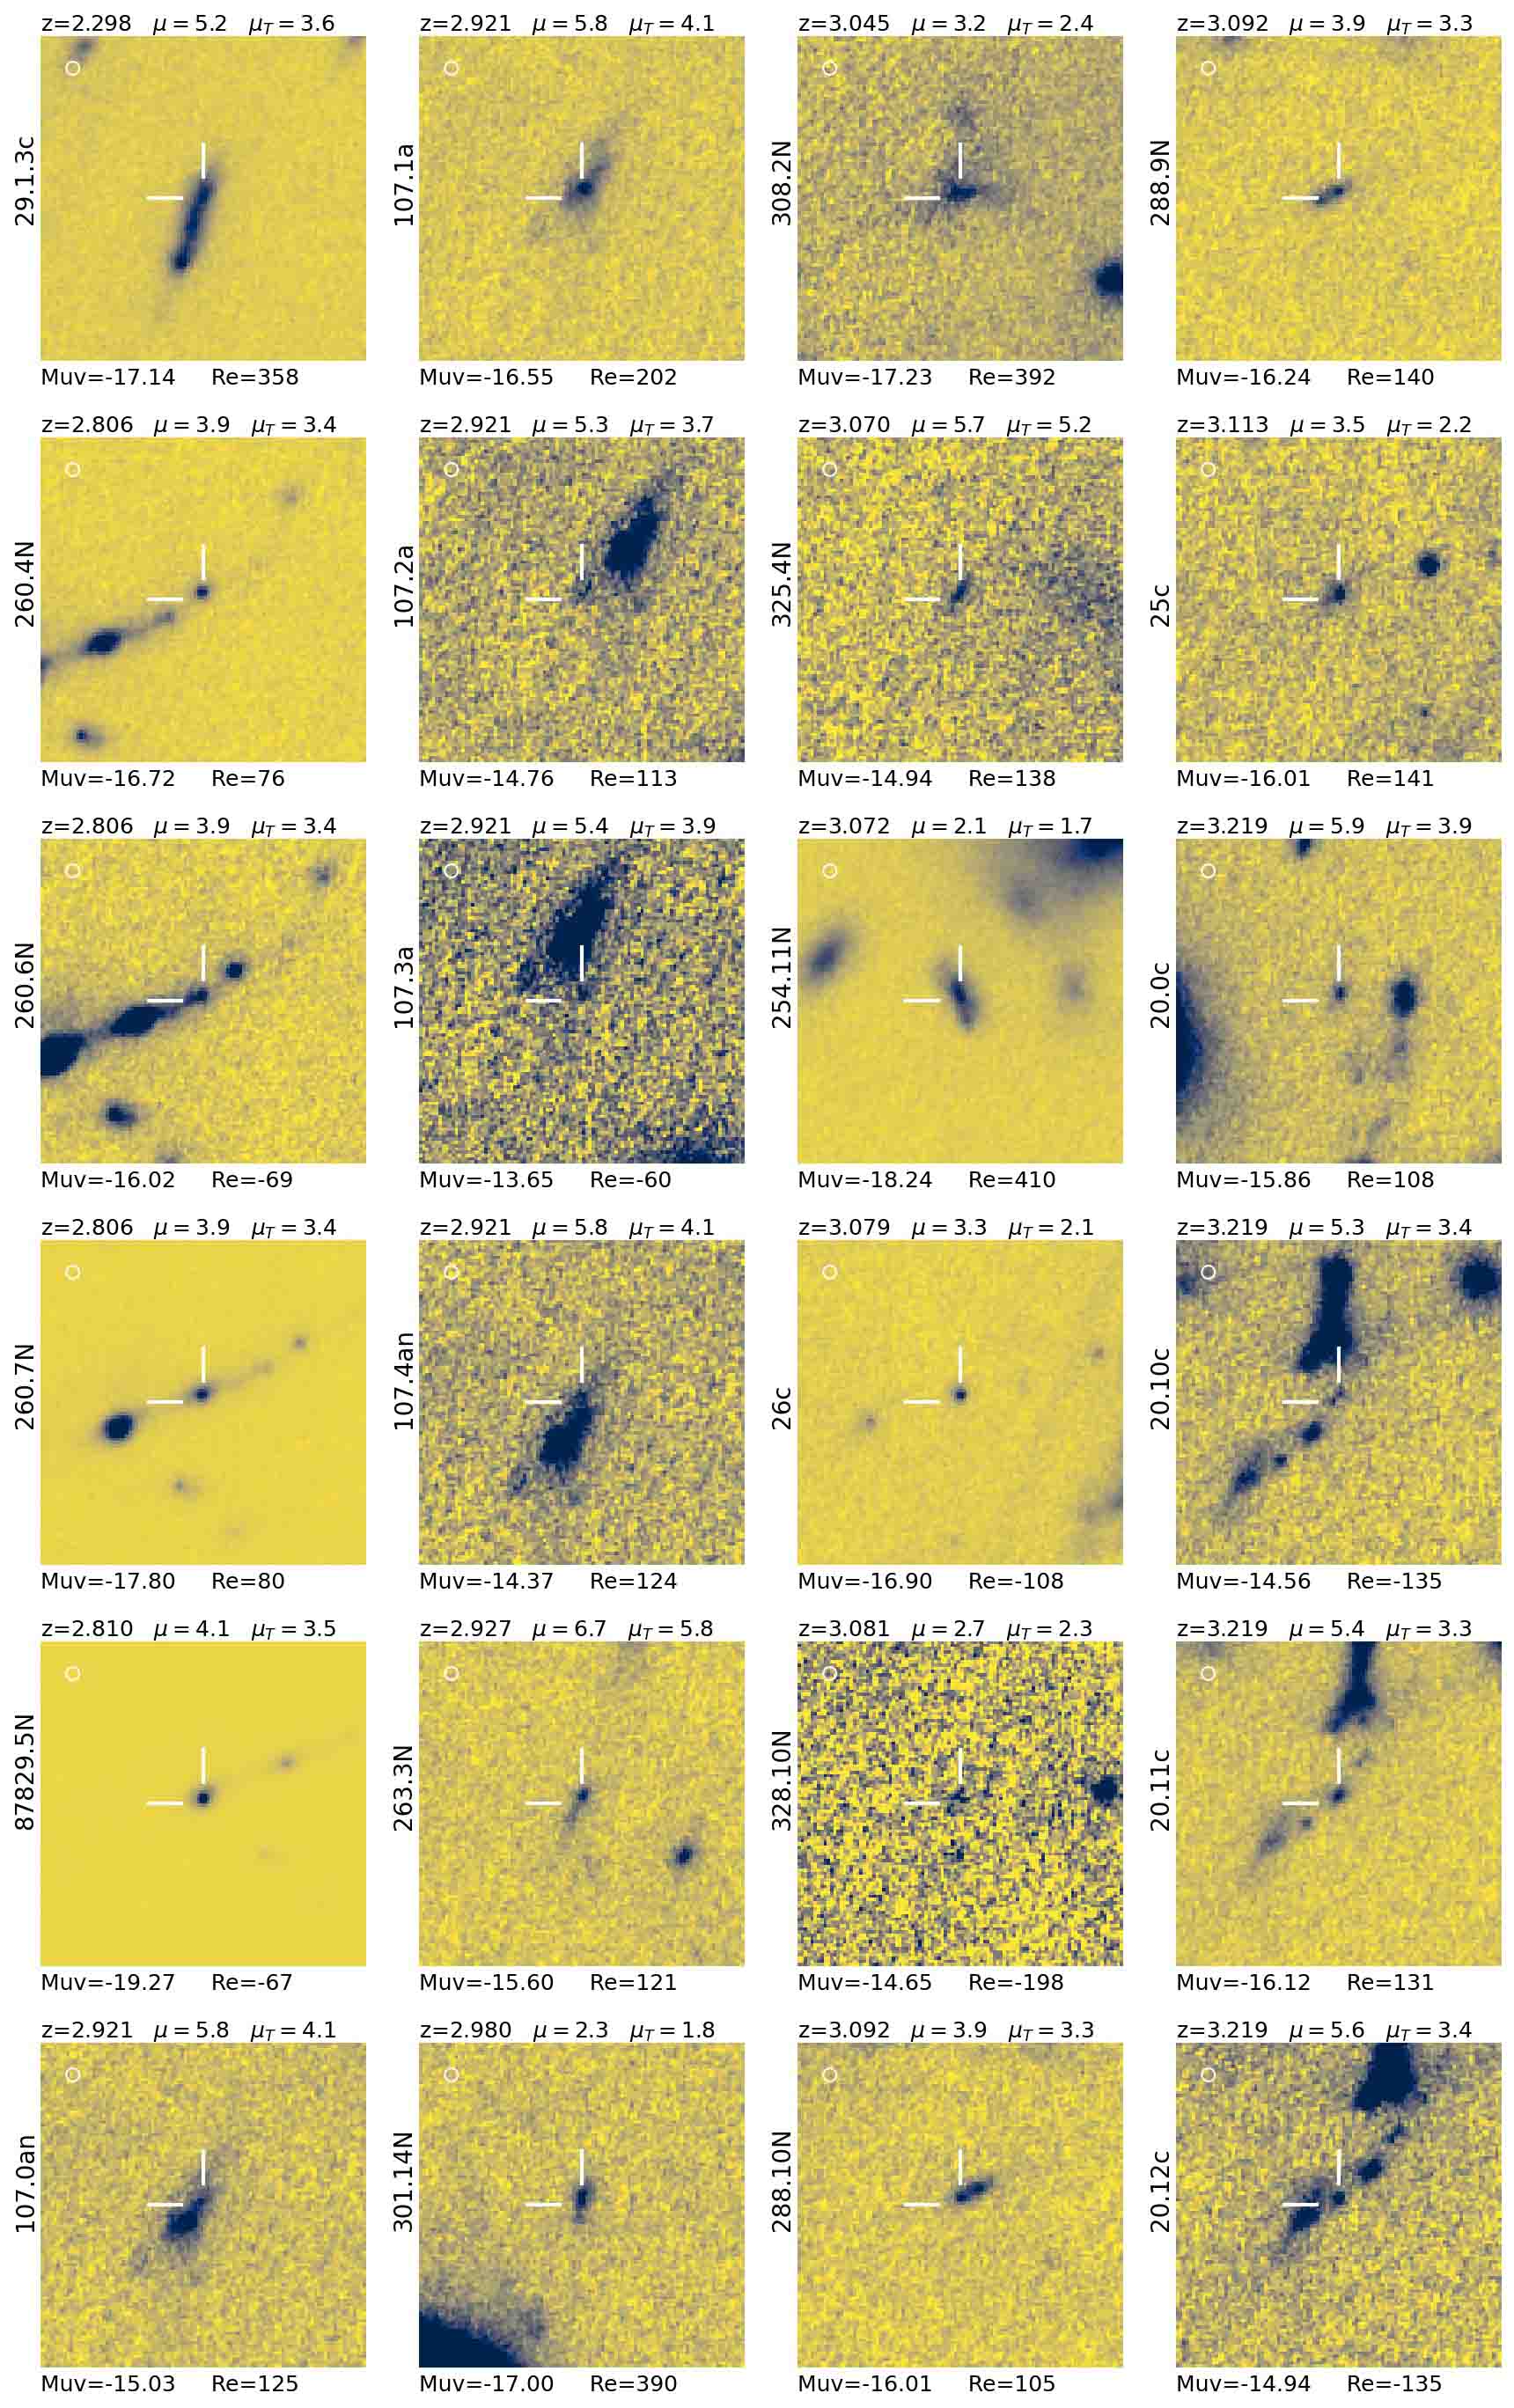
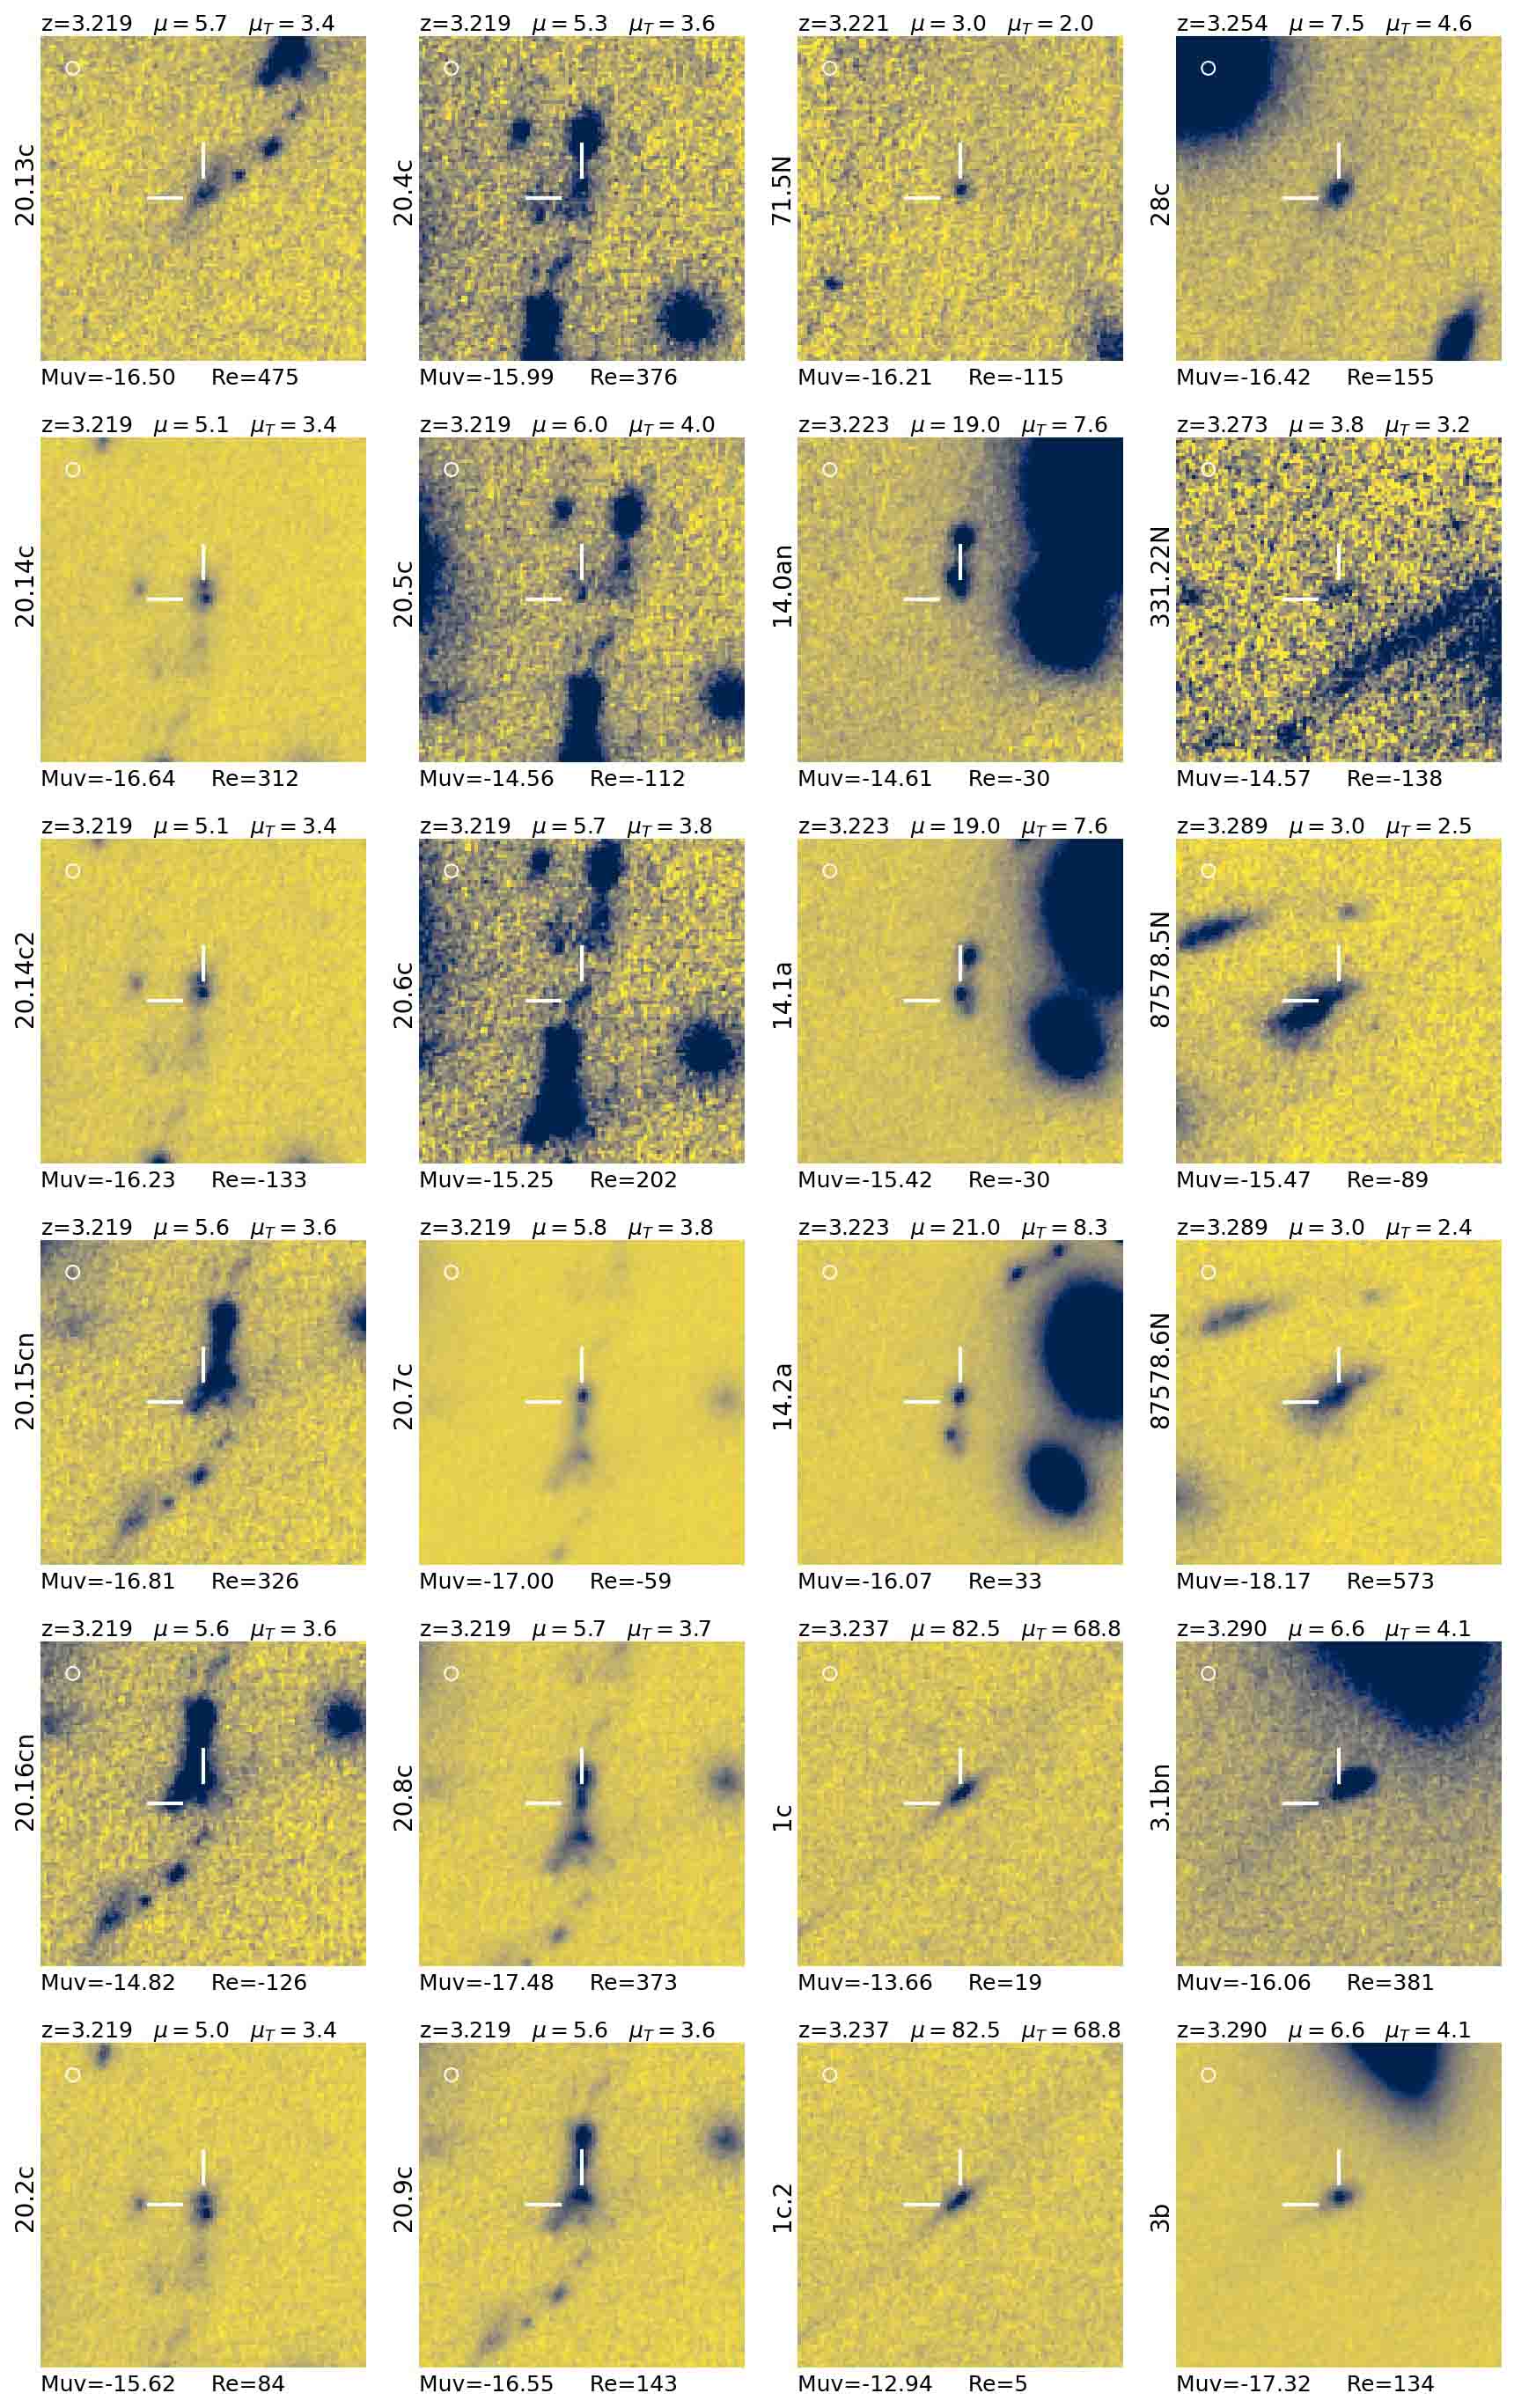
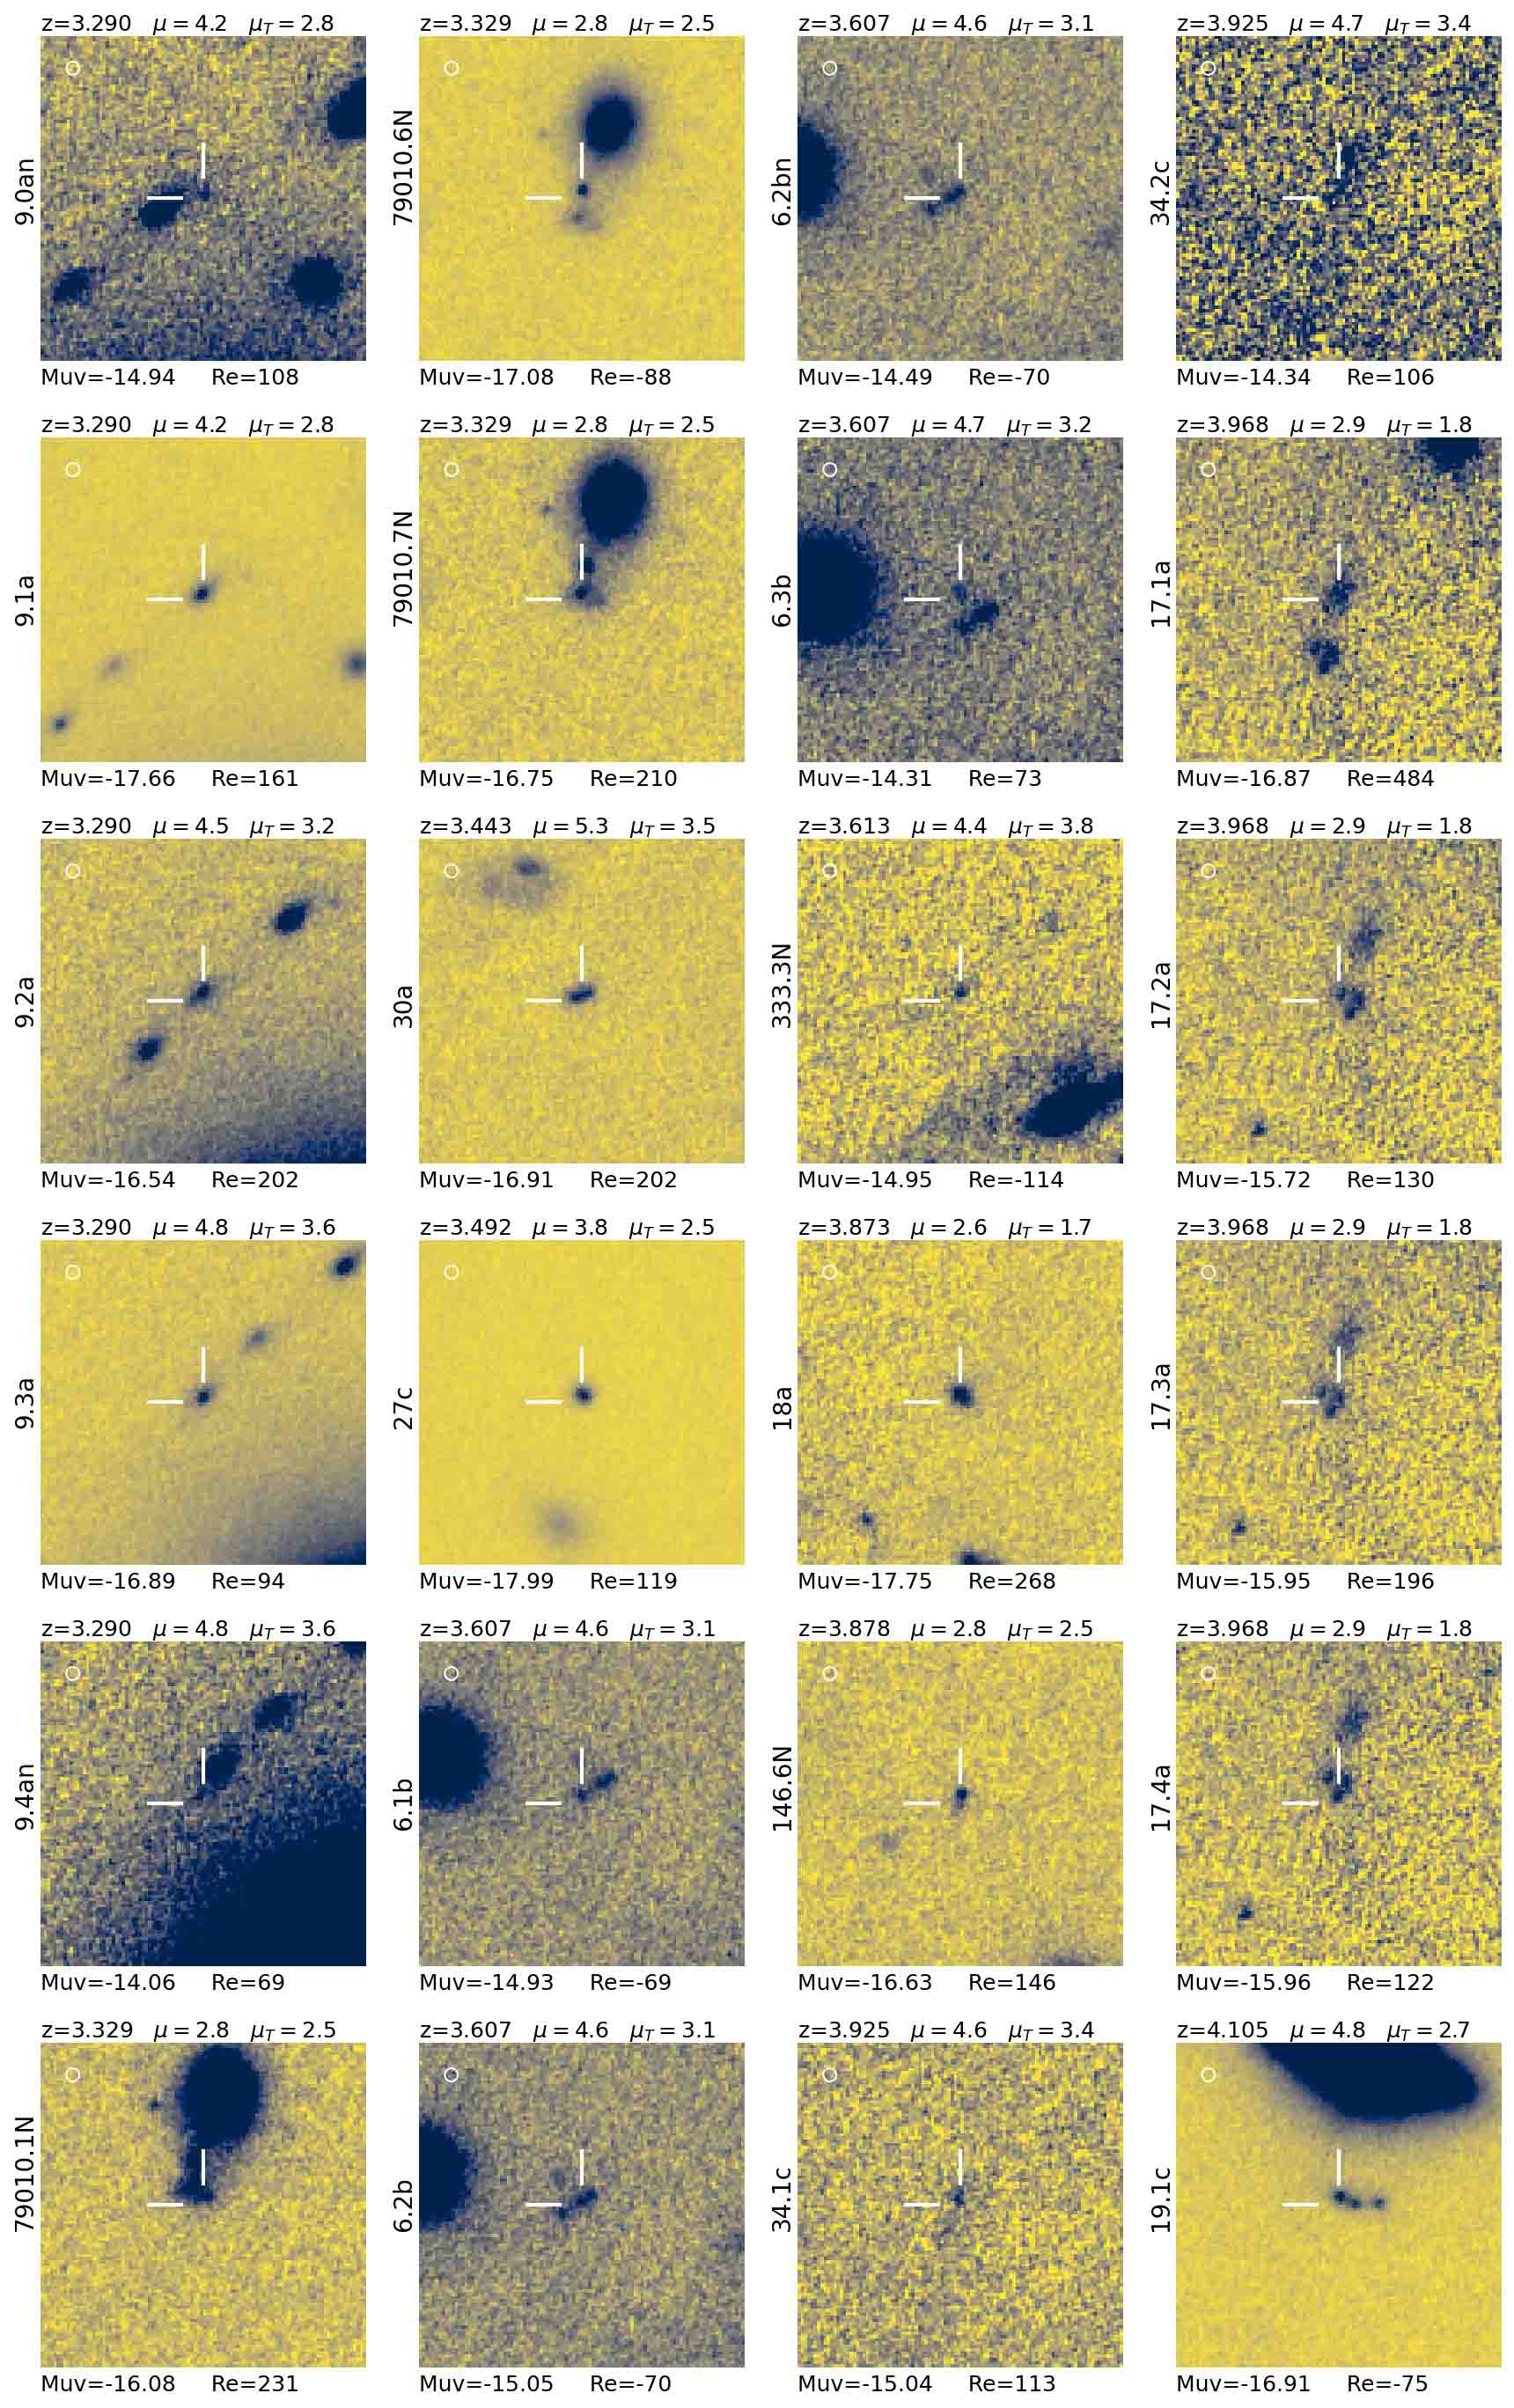
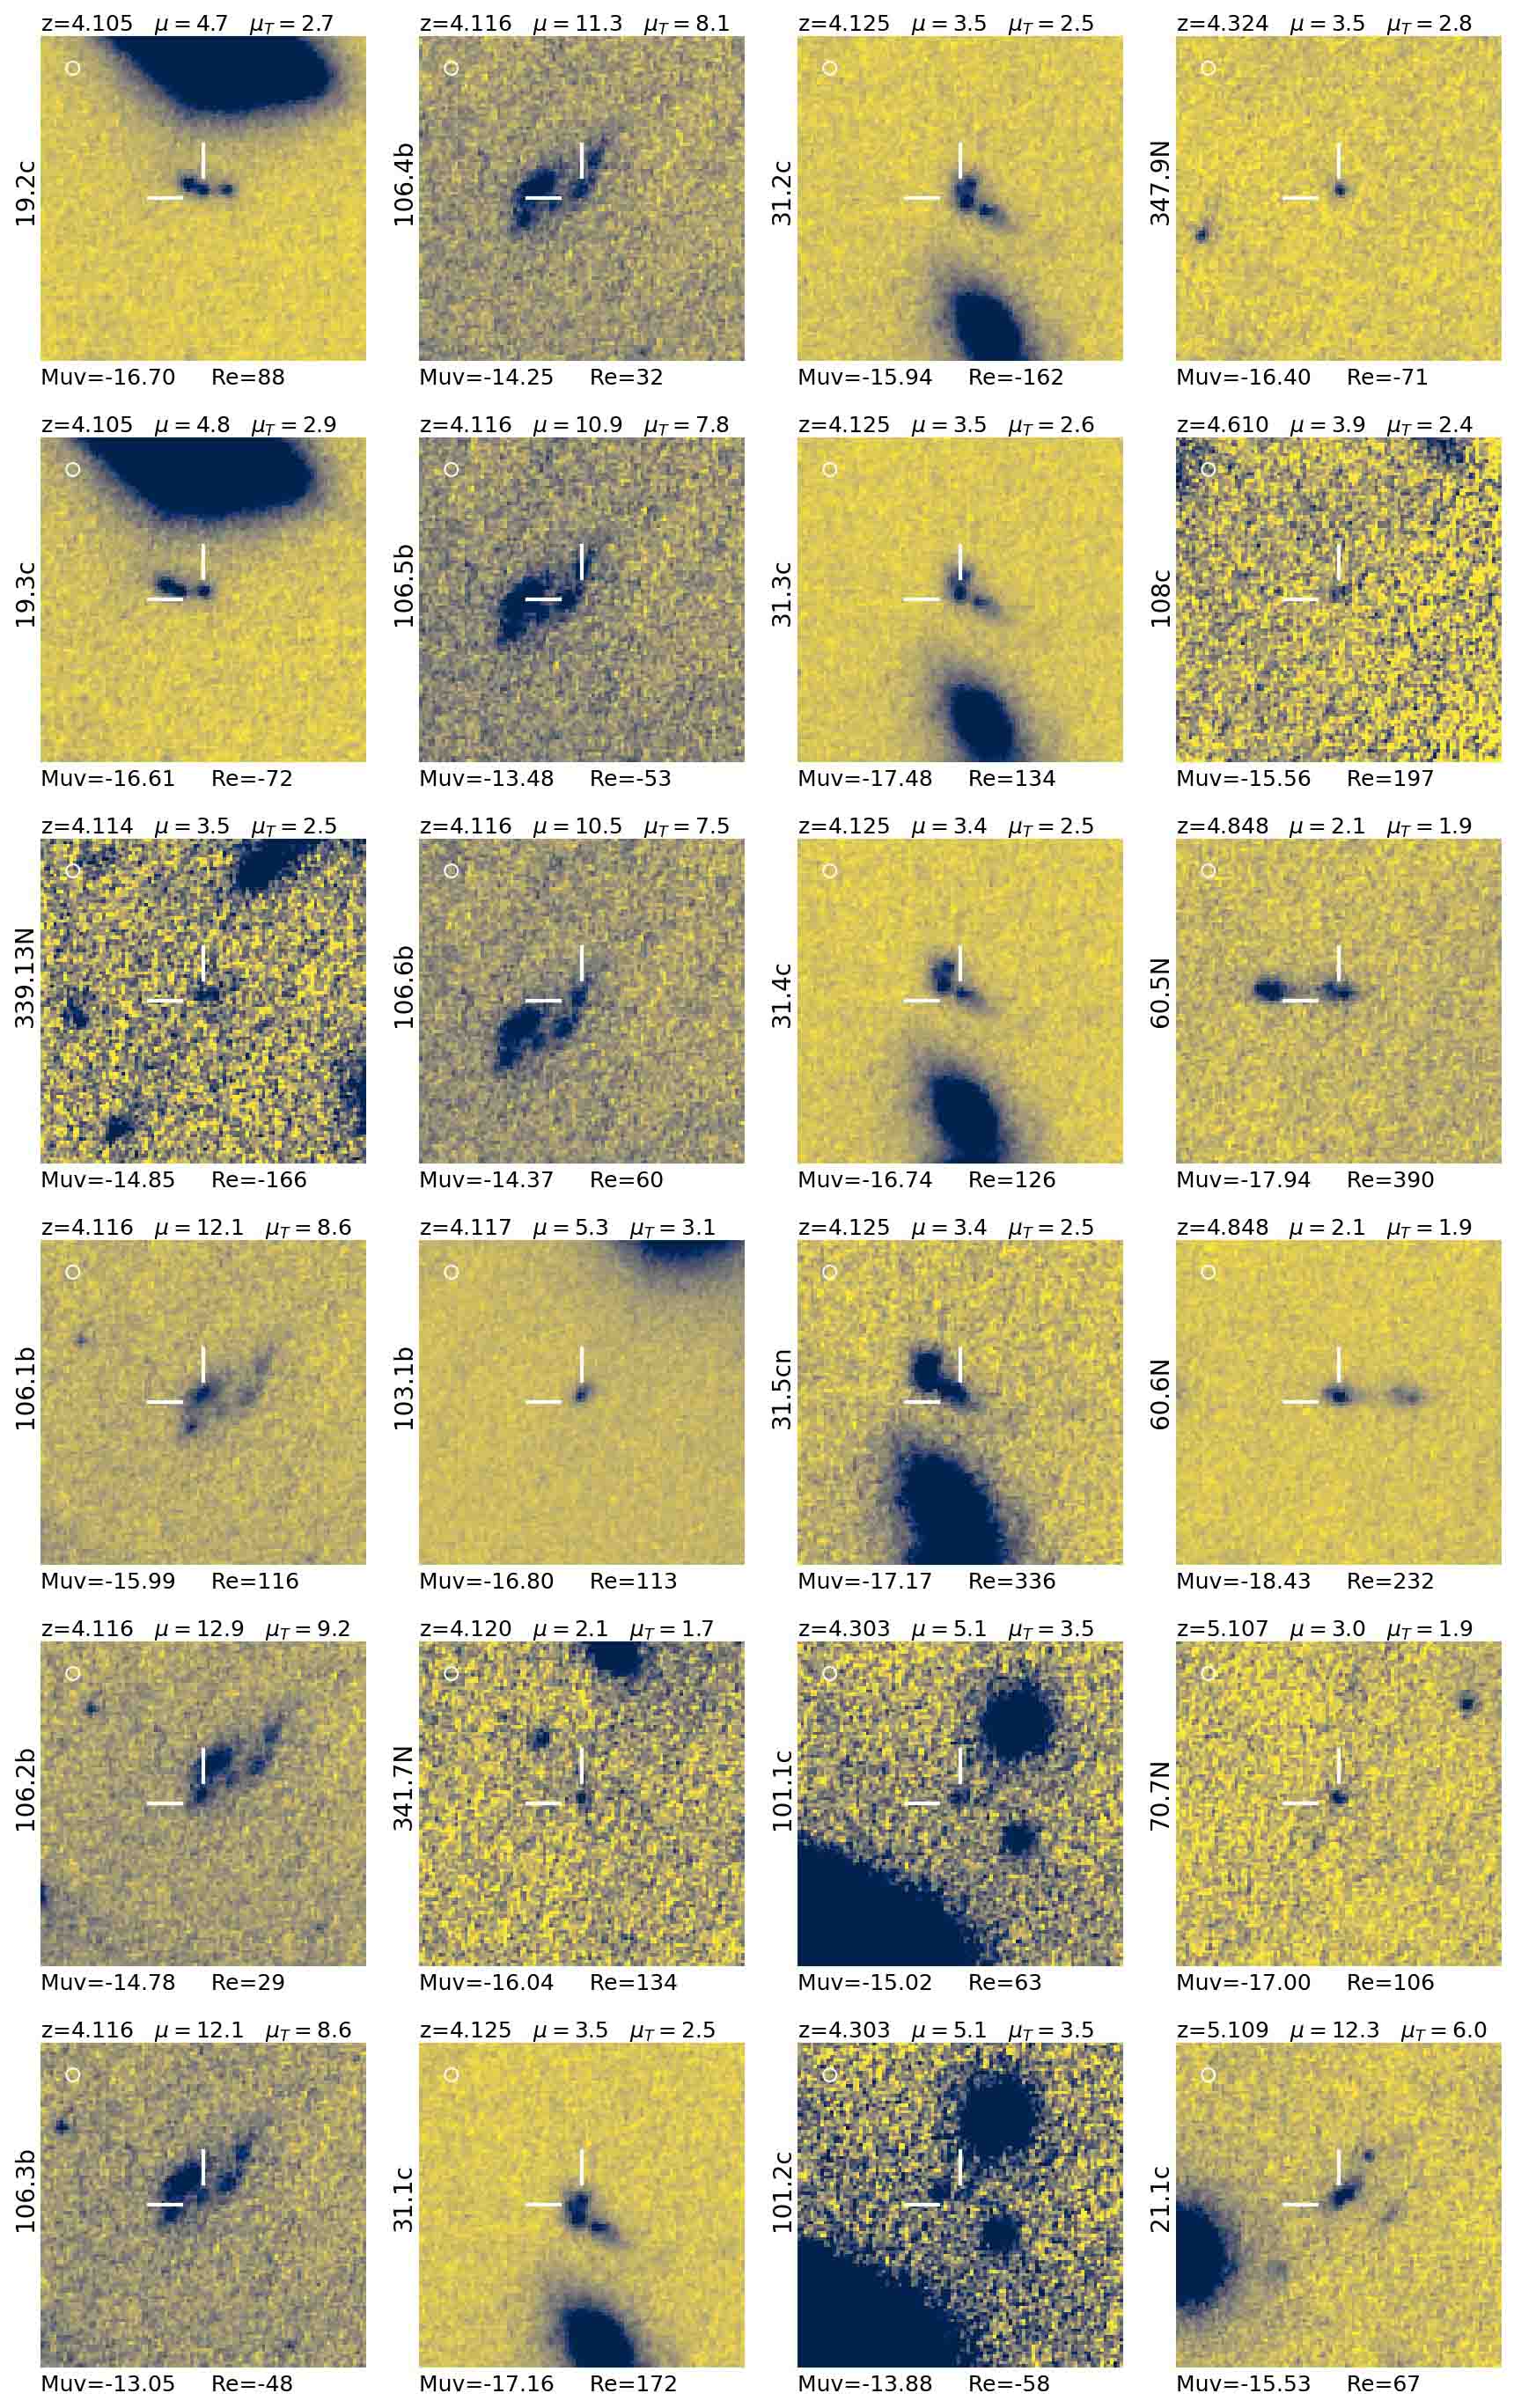
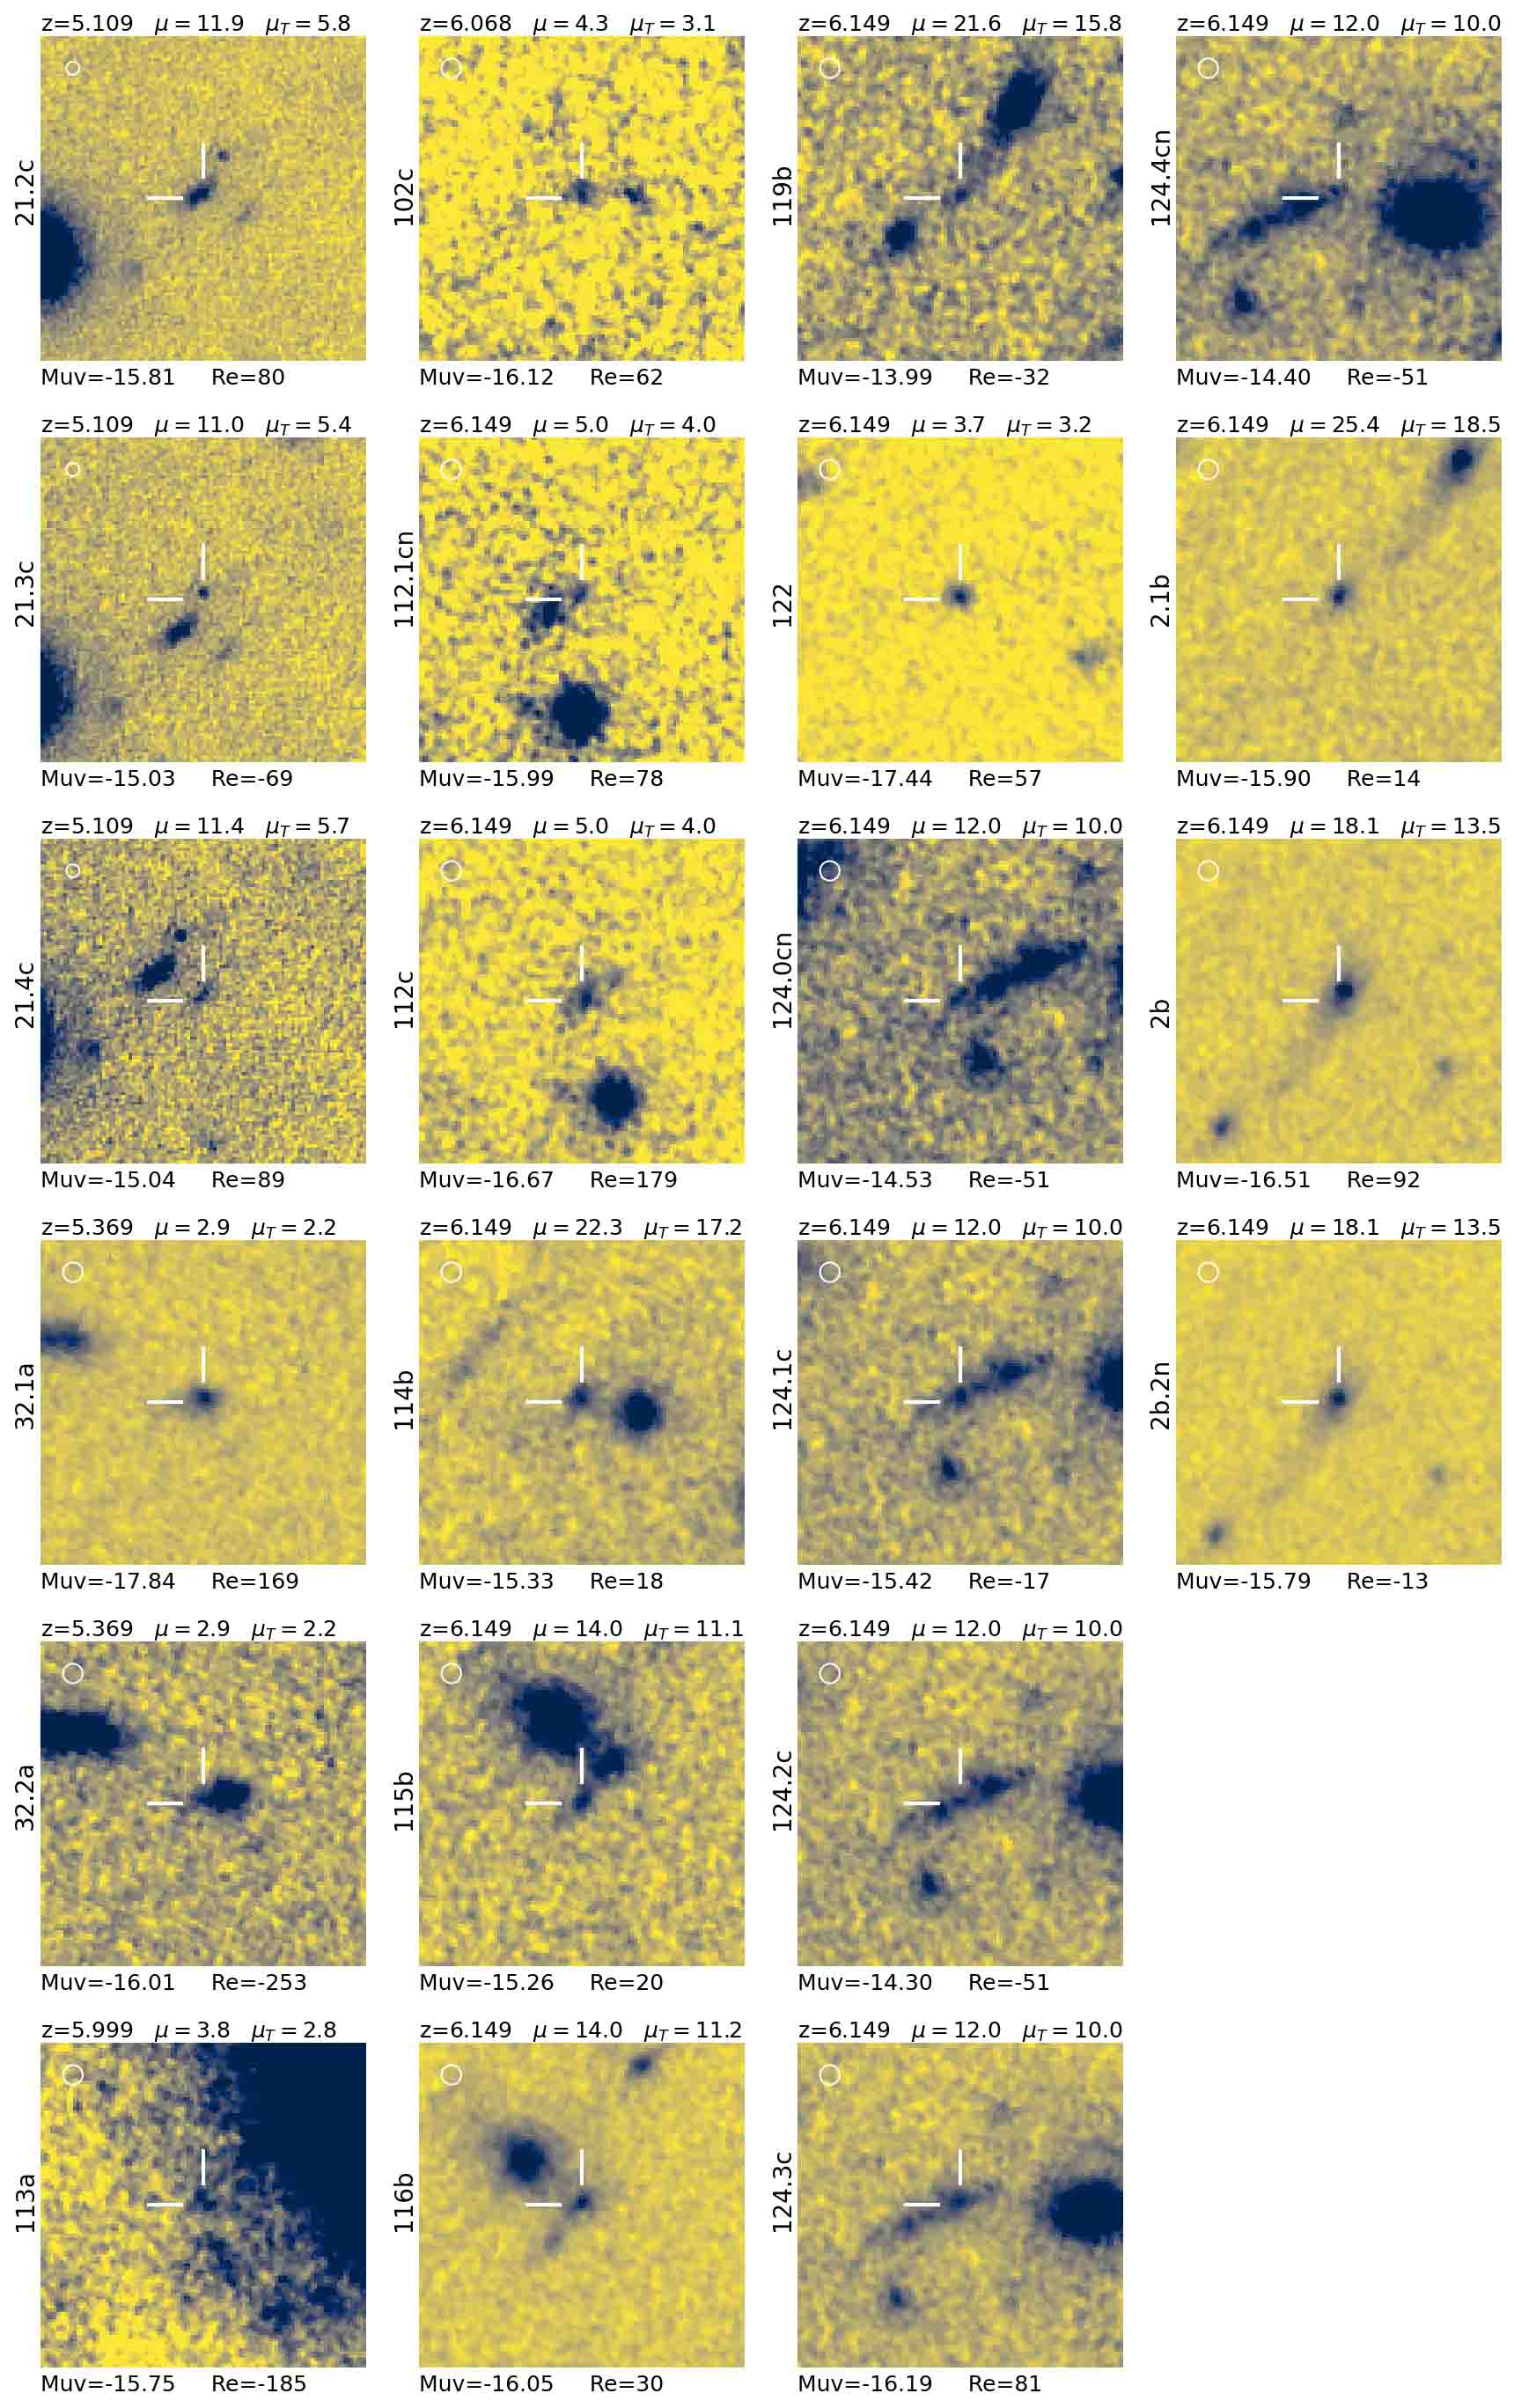
Figures 12, 13, 14, 15, 16, 17, 18 summarize the entire sample presented in this work by showing individual clumps as cutout image (see captions of 12 for more details).
Appendix D The robustness of the size measurement from GALFIT
Figures 19 and 20 summarize results from GALFIT runs on a lensed mock images created by FM where we are testing accuracy of the size measurements.
