SR investigation of the Fe-doped Ca3Ru2O7 polar metal
Abstract
Ca3Ru2O7 is a polar metal that belongs to the class of multiferroic magnetic materials. Here, tiny amounts of Fe doping in the Ru sites bring about dramatic changes in the electronic and magnetic properties and generate a complex - phase diagram. To date, not much is known about the ground state of such a system in the absence of magnetic field. By performing muon-spin spectroscopy (SR) measurements in 5% Fe-doped Ca3Ru2O7 single crystals, we investigate its electronic properties at a local level. Transverse-field SR results indicate a very sharp normal-to-antiferromagnetic transition at K, with a width of only 1 K. Zero-field SR measurements in the magnetically ordered state allow us to determine the local fields at the muon implantation sites. By symmetry, muons stopping close to the RuO2 planes detect only the weak nuclear dipolar fields, while those stopping next to apical oxygens sense magnetic fields as high as 150 mT. In remarkable agreement with the nominal Fe-doping, a % minority of the these muons feel slightly lower fields, reflecting a local magnetic frustration induced by iron ions. Finally, shows no significant changes across the metal-to-insulator transition, close to 40 K. We ascribe this surprising lack of sensitivity to the presence of crystal twinning.
keywords:
Polar metals , Muon-spin spectroscopy , - phase diagram , Ca3Ru2O71 Introduction
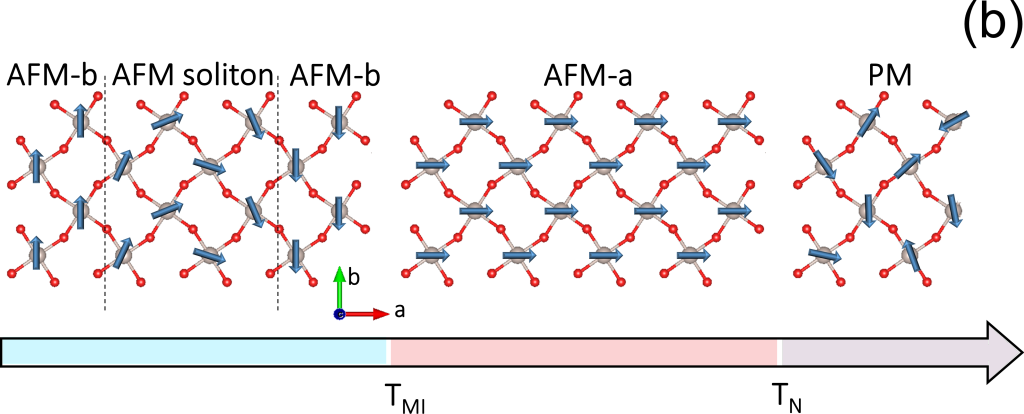
Multiferroic materials are characterized by two or more coexisting ferroic orderings, such as ferroelectricity, ferromagnetism, or ferroelasticity, which ideally can be mutually controlled and tuned. As a general feature, conventional multiferroics are electrically insulating. However, in rare cases, magnetic and polar orders can also coexist in metallic systems (despite the seemingly mutually exclusive properties of polar order and metallicity). Collectively such systems are referred to as “multiferroic magnetic materials” or “magnetic polar metals”, of which Ca3Ru2O7 is one the most renowned examples [1, 2, 3]. At high temperatures, Ca3Ru2O7 behaves as a paramagnetic (PM) metal. At low temperatures, a long-range antiferromagnetic order, with a Néel temperature K, sets in. In this case, Ru magnetic moments align ferromagnetically along the (easy) -axis, while the RuO2 bilayers stack antiferromagnetically along the -axis (AFM-). At K, the metal-to-insulator (MI) transition temperature, the resistivity starts to increase and the Ru moments align along the axis (AFM-), while preserving their -axis AFM stacking (see Fig. 7 in Ref. [4] and Fig. 2b further on). At low temperatures, the magnetic moment of Ru, as determined by neutron diffraction, is about 1.8 /Ru and it points along the axis [3].
A partial substitution of Ru with Fe (at only 5%) is able to induce several dramatic effects. First, it enhances the PM-to-AFM- transition temperature up to 86 K [5, 6, 7, 8]. Secondly, it lowers the temperature down to 40 K, corresponding to an isostructural transition [8]. Below 40 K, the coexistence of an incommensurate- (IC) and an AFM- order (IC + AFM-) sets in. Succinctly, one can portray the magnetic order within the RuO2 layers as the spatial repetition of a single unit, consisting of two antiparallel AFM domains (AFM-) and two magnetic solitons (AFM solitons) [8], so as to produce a zero total magnetic moment (see Fig. 2b). It was also proposed that, under a zero-magnetic field condition, a nearly degenerate spin configuration can occur. In this case, one of the two neighboring magnetic solitons in each perovskite layer could reverse its chirality, thus producing a nonzero magnetic moment along the axis, but not along the axis. The Zeeman energy, arising from the application of an external field, removes such degeneracy, which explains why, for , an incommensurate ferromagnetic spin structure is found. These nearly degenerate spin ground states were ascribed to the magnetic frustration due to the combined action of diluted Fe3+ ions and magnetocrystalline anisotropy [8].
In this work, we track down the temperature evolution of the electronic ground state of Fe-doped Ca3Ru2O7 under zero-applied field conditions (thus leaving the above mentioned degeneracy untouched). To achieve this, we rely on the unique capability of zero-field muon-spin spectroscopy, which can probe the local magnetic field at the muon implantation sites, even in the absence of an applied magnetic field. In this study, we show that, below , lies in the -planes. However, the measured shows no differences across the transition temperature. We ascribe this lack of sensitivity to the presence of twinned domains, which make it impossible to distinguish the local field direction.
2 Sample growth and characterization
Fe-doped Ca3Ru2O7 single crystals were grown using the floating-zone (FZ) method in a commercial infrared image furnace (Cannon Machinery SC2-MDH). The detailed procedures of FZ single-crystal growth of ruthenate materials were previously reported in Ref. [9]. The 5% Fe-doped Ca3Ru2O7 crystals used in this study were characterized via x-ray diffraction and confirmed to have the desired bilayer ruthenate phase. These crystals and those previously used for magnetization-, heat-capacity and neutron-scattering measurements (see Ref. [5]) were taken from the same batch. Prior experiments show the crystals from this batch to have a Néel temperature K, which coincides with that detected by the SR measurements reported below. This indicates that the crystals used in the current study have a similar quality to those employed in previous experiments [5].
3 SR spectroscopy results
The SR technique uses spin-polarized positive muons implanted homogeneously over the whole sample volume. Upon implantation, the incident muons loose their kinetic energy, yet preserve the initial spin direction (polarization). Therefore, once stopped, they start to precess coherently around the local magnetic field at the implantation site. The decay positrons, emitted preferentially along the muon-spin direction, carry the physical information in the form of precession frequency and relaxation rate. Here, we perform two kinds of experiments: (i) weak transverse-field- (wTF-SR), and (ii) zero-field (ZF-SR) muon spectroscopy measurements. The former was used to determine the temperature evolution of the magnetic volume fraction, while the latter allowed us to study the temperature evolution of the magnetically ordered phase.
3.1 Experimental setup
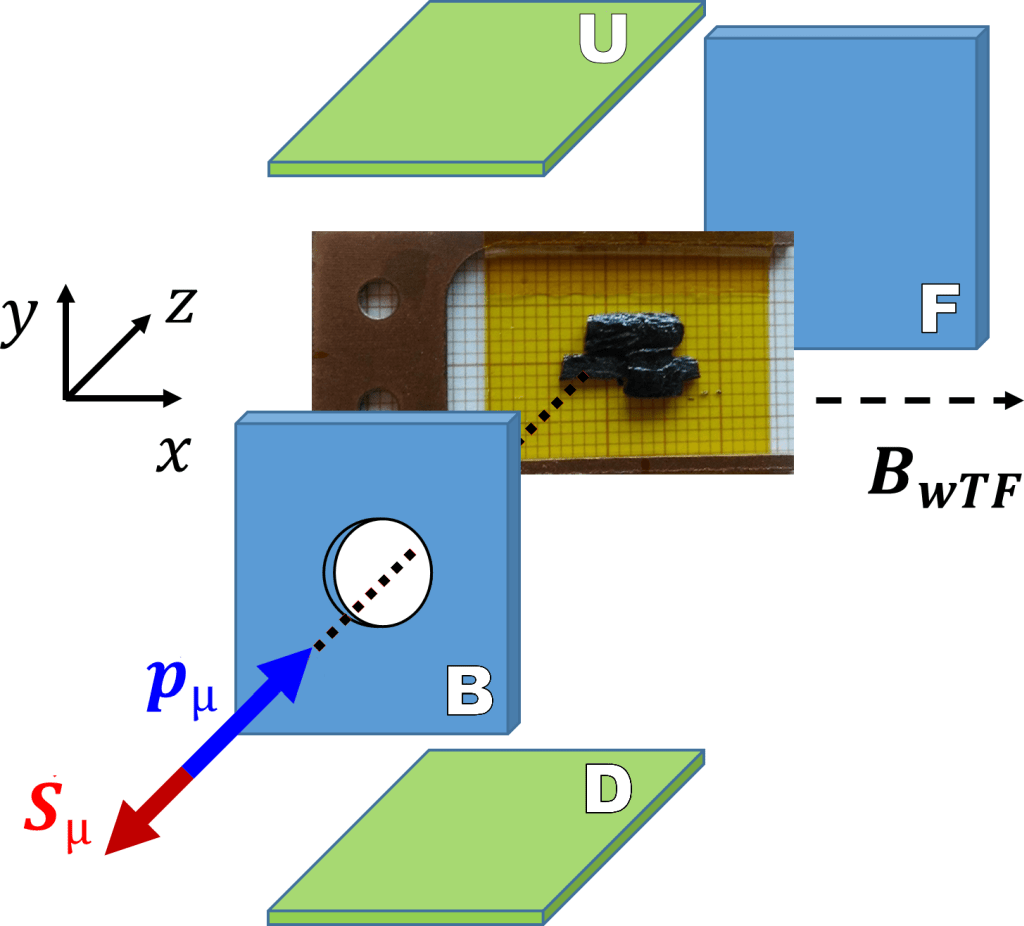
The SR experiments were carried out at the general-purpose spectrometer (GPS) at the M3 beam line of Paul Scherrer Institut (PSI), Villigen, Switzerland. A non-rotated muon-spin configuration was adopted during all the experiments. The investigated sample consisted of a mosaic of homogeneous single crystals positioned on a thin Kapton (polyimide) tape, with their axes parallel to the muon momentum . The shorter sample sides were oriented parallel to the vertical direction defined by the axis of the up–down (UD) detectors. The experimental setup, including the detectors and the sample orientation, is shown in Fig. 1. The relatively large sample thickness ( mm) and the use of veto counting (which considers only the muons effectively stopped in the sample) contributed to an improved signal-to-noise ratio.
3.2 Magnetic volume fraction determined via wTF-SR
The temperature evolution of the magnetic volume fraction was determined by means of a wTF-SR experiment, as detailed in A. In the PM-phase, all the implanted muons precess at the Larmor frequency. Once the temperature decreases below the magnetic transition , only those muons implanted in the gradually shrinking PM-phase still precess at the frequency of the applied field. In this case, the temperature evolution of the magnetic volume fraction can be derived from the equation:
| (1) |
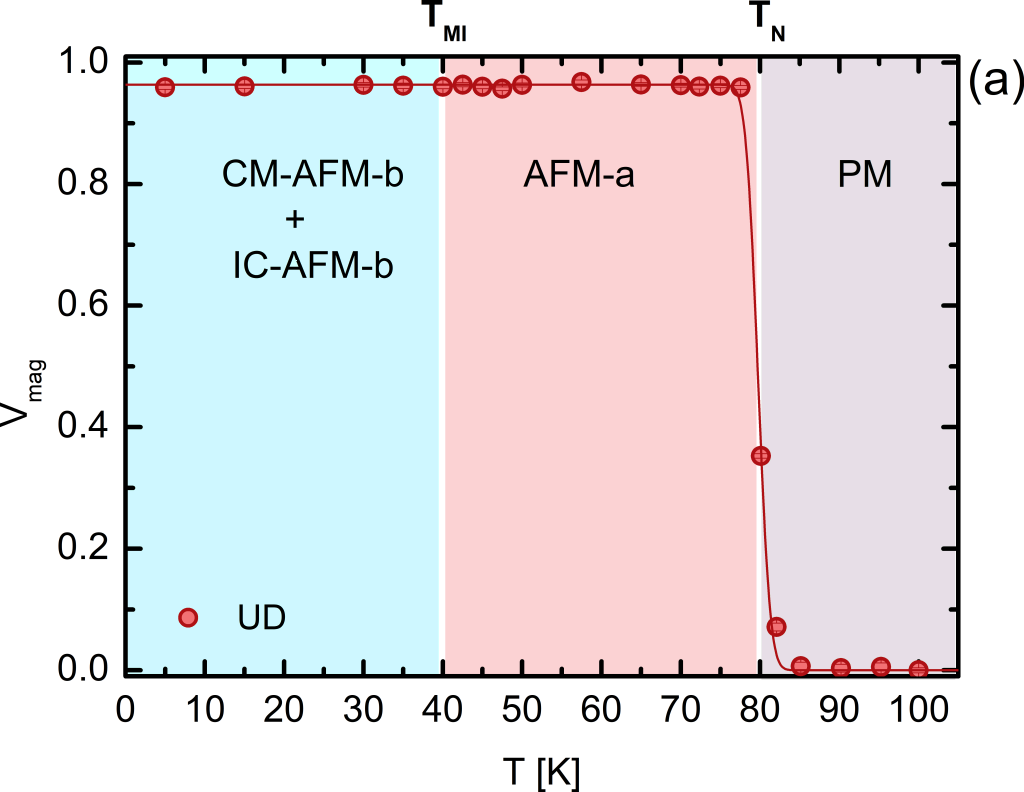
where is the maximum temperature attained during the experiment, here located in the PM state (), while the ratio represents the paramagnetic fraction, here determined from the muon-spin asymmetry. The temperature-dependent magnetic volume fraction, as measured by the UD detectors, is shown in Fig. 2a. It is worth noting that: (i) the magnetic transition is very sharp. This is confirmed by a fit of the experimental data with a Gaussian distribution of local transition temperatures around the average value :
| (2) |
Here, erf is the standard error function [10], is the width of such distribution, and is the zero-temperature limit of the magnetic volume fraction. The best fit gives K, with an average transition width K. (ii) Below , the volume fraction of the ordered phase is almost unity, , indicative of a very high sample quality.
3.3 ZF-SR: Properties of the magnetically ordered phase
3.3.1 Internal field direction in the magnetically ordered phase
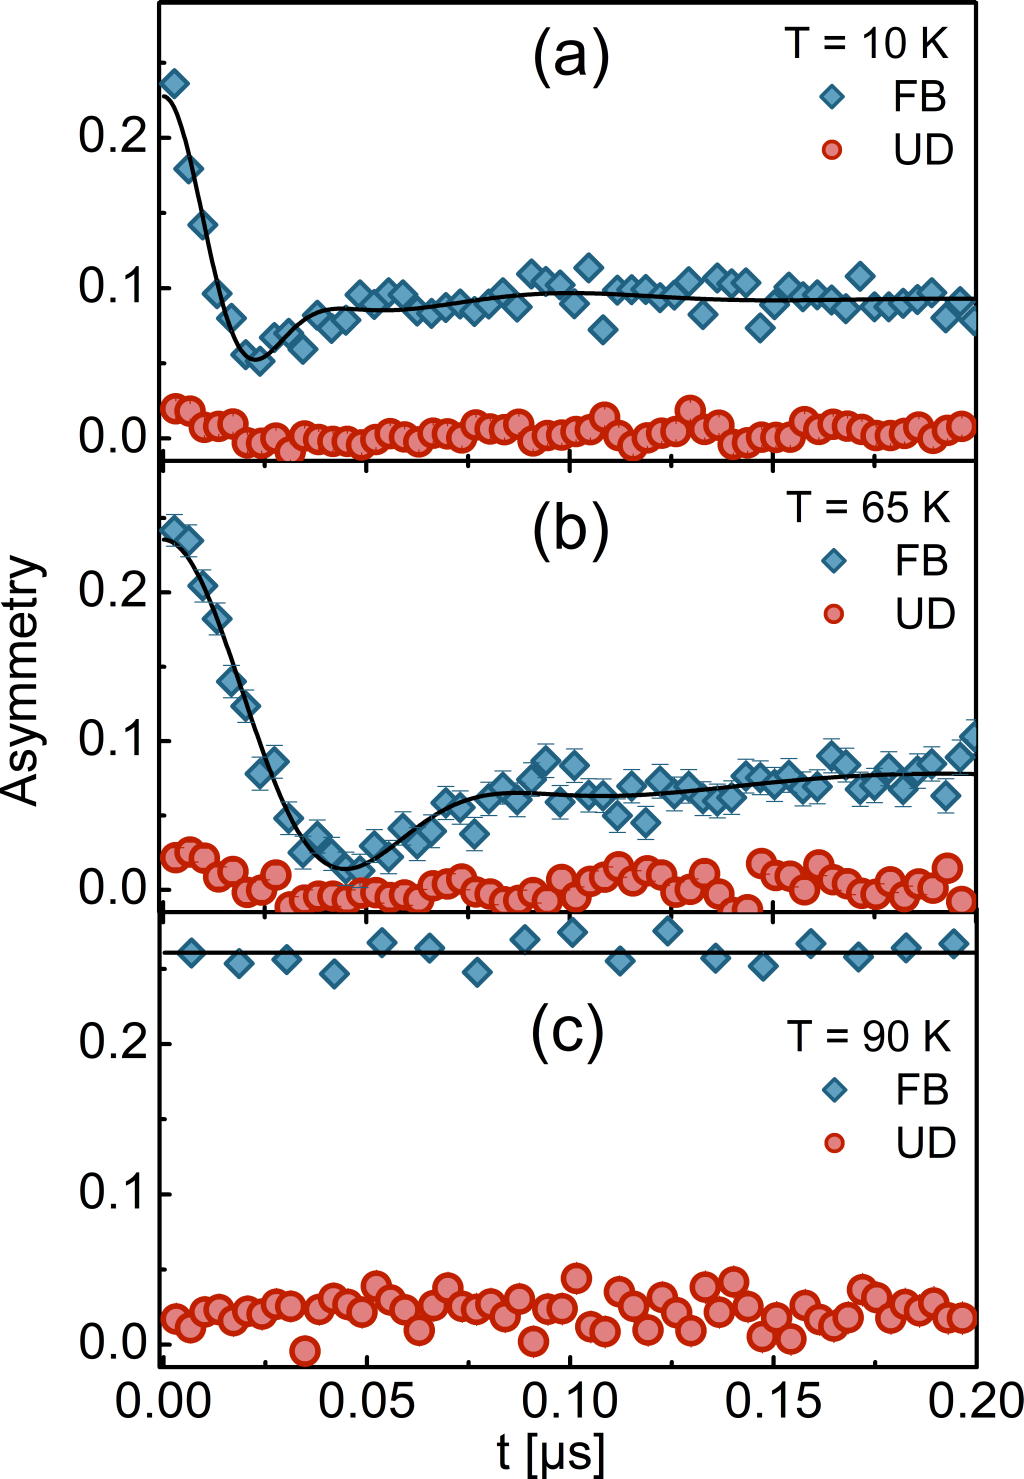
Figure 3 shows the ZF-SR results obtained in a non-rotated muon-spin configuration at three representative temperatures: 10 K, 65 K, and 90 K, i.e., below , at intermediate , and well above . In this configuration, by inspecting the asymmetry data as recorded in the forward-backward (FB) and up–down (UD) detector pairs, the direction of the internal magnetic field at the muon implantation sites can be inferred (see, e.g., Ref. [11]). The depicted datasets show two distinct features. The UD detectors exhibit an almost zero asymmetry [12], independent of temperature. The FB detectors, instead, show a nonzero temperature- and time-dependent asymmetry.
The absence of an UD asymmetry indicates that the internal magnetic field , as probed by the implanted muons, cannot be parallel to the crystal -axis. Indeed, this would have implied a zero- and a constant (nonzero) asymmetry in the UD and FB detector pairs, respectively. Since this is not the case, we conclude that the direction of the internal magnetic field at the muon implantation sites lies necessarily in the laboratory plane, here corresponding to the sample’s plane (see Fig. 1). Unfortunately, the Ca3Ru2O7 lattice parameters
( pm) and ( pm) are very close. This, and the additional presence of crystal twinning, makes the in-plane crystal orientation hard to establish, thus ruling out the possibility to determine the exact internal field direction within the -planes.
3.3.2 Temperature dependence of the staggered magnetization
The temperature dependence of the magnetic order parameter can be extracted from the FB asymmetry, with typical datasets being shown in Fig. 3. From these measurements one can distinguish two different temperature regimes: (a) a low-temperature regime (), characterized by highly damped oscillations (indicative of a magnetically ordered state) superimposed on a slow-decaying relaxation, observable only at long times; and (b) a high-temperature regime (), where only a slow-decaying relaxation is observed. To track these changes across the whole temperature range, the asymmetry data were fitted to the following function [13]:
| (3) |
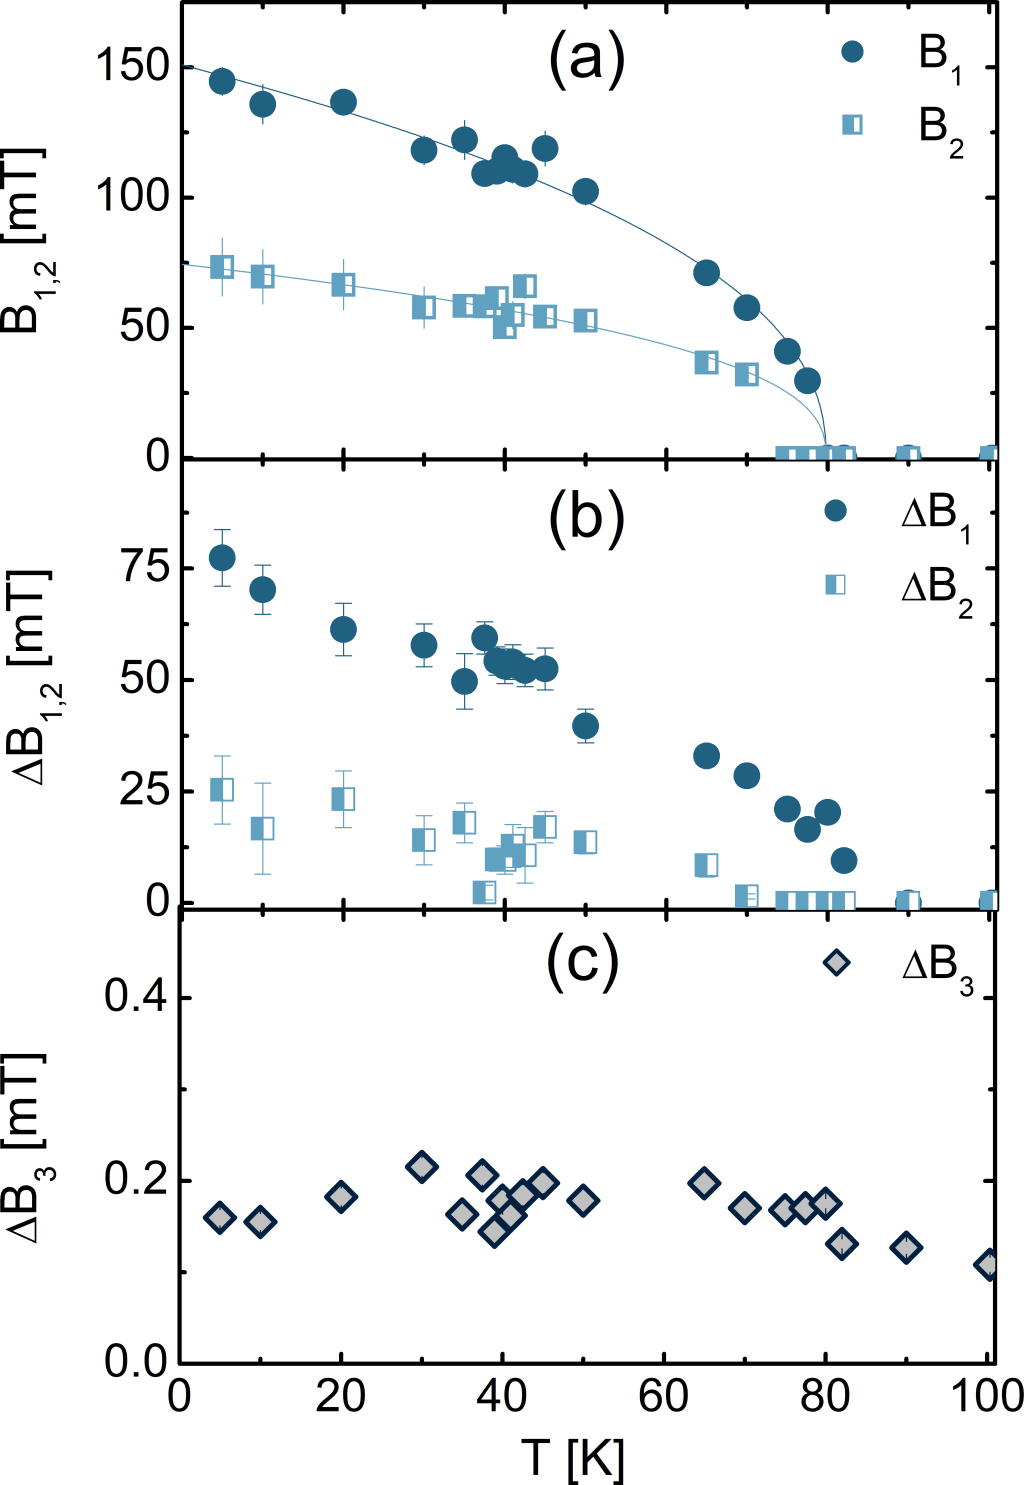
Here, the transverse (oscillating) component is represented by two cosine functions, with , and being the initial amplitude, local field, and damping rates, respectively. The longitudinal component was fitted to a relaxing Gaussian term, with and being the initial amplitude and the relaxation rate, respectively. This fit model suggests some important observations. There are three nonequivalent muon implantation sites (1, 2, and 3), with relative weights of 54(4), 6(1), and 40(1)%, respectively, mostly independent of temperature. Muons implanted in 1 and 2 probe a nonzero local field that, at 5 K, is as high as 150(5) and 73(11) mT, respectively. The highly damped oscillations at very short times, could be consistently fitted only by means of a cosine function (a fit with a zeroth-order Bessel function proved unsatisfactory). Muons implanted in the third site experience only the nuclear dipolar fields, since their long-time asymmetry data can only be fitted with a Gaussian-like decay, as detailed in B.
Figure 4 shows the temperature dependence of the fitted parameters. The top panel reports the behavior of the internal magnetic field values, , the middle panel the widths of the corresponding field distribution, , and the bottom panel the second moment of the field distribution sensed by the muons implanted in the third site, . We recall that, for local fields with a Gaussian distribution, the second moment is given by , with , 2, 3. It is worth noting several interesting features: (i) below , both and increase with decreasing temperature. (ii) the data are well fitted by a standard mean-field model. (iii) Interestingly, no significant changes could be detected across . (iv) is about 0.15 mT, irrespective of the temperature, as expected for nuclear dipolar-field contributions. We discuss the possible origin of the three local fields in the next section.
4 Discussion
Ca3Ru2O7 has a perovskite structure, similar to that of cuprates and manganites. By using similar arguments to those put forward in Ref. [14], we expect two main muon implantation sites. As observed in all perovskites, a first site corresponds to muons which bind themselves to the apical oxygen of the Ru-O tetrahedra (eight sites per unit cell). A second site is expected to lie in the RuO2 planes, at the center of a rhombus formed by four oxygen atoms (eight sites per unit cell). Therefore, at least two distinct precession frequencies, with a relative weight of 50%, are expected. For symmetry reasons, the field probed by the muons implanted in the RuO2 planes should be zero. As to the first site, by assuming the dipolar contribution to the local field as dominant, one can make a rough estimate of the expected local field (in this case, we consider copper-oxide compounds for a comparison [14]). Thus, by considering an ordered Ru moment of [3] and by scaling it to the magnetic moment of copper, the field sensed by muons bound to the apical oxygens is expected to be in the 90–120 mT range.
Our experimental results can be interpreted by assuming two distinct precession frequencies and a Gaussian relaxing component. Since the latter exhibits a temperature-independent behavior (with a relative weight of 40%), it accounts for the muons implanted in the RuO2 planes. Here, for symmetry reasons, the electronic dipolar contribution due to Ru ions is zero and, therefore, only the -independent Ru nuclear dipolar fields dominate. This is confirmed also by the wTF measurements, where small applied fields are sufficient to quench the tiny nuclear contribution (see A). By making an educated guess, the two precessing components of the recorded asymmetry can be associated with the muons bound to the apical oxygens. A minority of these muons, with a relative weight of 6%, show a lower frequency and most likely correspond to apical oxygens near the Fe-Ru substitutions ( 5%). Indeed, in this case, we expect a local frustration of the magnetic order, which lowers the local field. On the other hand, the higher frequency and larger weight of the other component is due to muons bound to the apical oxygens, far from Fe ions, which sense the original field of the unsubstituted Ru sites. This interpretation implies that, because of the Fe-Ru substitution, % of muon implantation sites are inequivalent to the rest. In addition, the electronic dipolar field at sites 1 and 2 lies in the plane, as confirmed by the absence of contributions to the UD asymmetry below . Unfortunately, because of the presence of crystal twinning, we cannot resolve the in-plane orientation of such field. This could also be the reason for the absence of visible changes in and across (at 48 K).
5 Conclusion
In summary, we investigated the temperature evolution of the zero-field electronic ground state of Ca3(FexRu1-x)2O7 by means of SR spectroscopy. First, by applying a weak transverse field, we confirm that this compound undergoes a very sharp magnetic transition from a paramagnetic metallic phase to an AFM- ordered state at 79.7(1) K. By means of ZF-SR spectroscopy we determine the local magnetic fields at two different implantation sites, corresponding to muons bound to apical oxygens and to those lying close to the RuO2 planes. In agreement with a nominal 5% iron doping, a minority of muons bound to apical oxygens exhibit lower precession frequencies, reflecting a local frustration of the magnetic order due to Fe-Ru substitutions. Unfortunately, the presence of crystal twinning hinders the detection of spin reordering, known to occur across the MI transition at 48 K. A future study, using uniaxial strain, should allow us to eliminate the twin domains and thus track the change in magnetic structure across .
6 Acknowledgments
Y.W. and Z.Q.M. acknowledge support from the Penn State 2D Crystal Consortium-Materials Innovation Platform (2DCC-MIP) funded by NSF (cooperative agreement DMR-1539916). T.Sh. was in part supported by the Swiss National Science Foundation under Grant No. 200021-169455.
Appendix A wTF-SR data analysis
In a standard wTF-SR experiment the magnetic field is applied perpendicular to the initial spin polarization. The term “weak” has two important meanings [15, 16, 17]: (i) the applied field should be small compared to the local field in the magnetically ordered phase. In our case, mT is smaller than mT, the typical local field normally observed in AFM-ordered compounds [17]. (ii) When the applied field is orthogonal also to the momentum (as in the present case), the field intensity must be sufficiently low to cause only a negligible displacement of the incoming muon beam. High transverse fields would deviate the muon beam too much, which, consequently, would miss the sample. In our case, the chosen value of implies a beam shift of less than 1 mm.
Several wTF-SR datasets were collected between 5 and 100 K in a rotated spin configuration. In a transverse configuration, in principle, one can use equivalently the FB or UB time-dependent asymmetries to determine the evolution of the PM fraction with temperature. Since for the local field is parallel to the -planes (see par. 3.3.1), this implies a null signal in the UD pair. Hence, the asymmetry data from such detectors are particularly meaningful for following the evolution of the PM fraction. Figure 5 shows the wTF UD asymmetry at selected temperatures. The data were analyzed by means of the function:
| (4) |
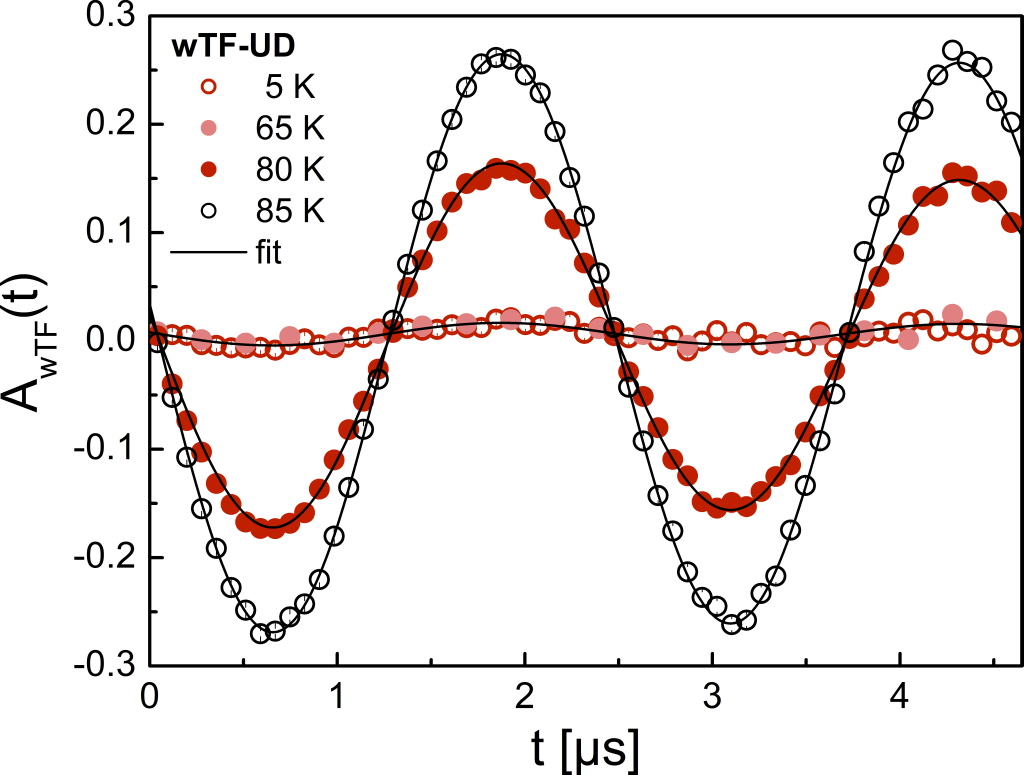
Here, is the time-dependent asymmetry, is the amplitude of the oscillating paramagnetic component, is the corresponding damping rate. Contrary to the ZF case (see B), here the nuclear dipole field is quenched by the applied field and, therefore, the relaxation is mainly Lorentzian. is the angular Larmor frequency in the applied field, is a phase offset, and MHz/T is the muon gyromagnetic ratio. The relaxing component accounts for a tiny nonzero offset in the AFM phase, possibly due to a small sample misalignment [12].
Appendix B Long-time ZF-SR asymmetry
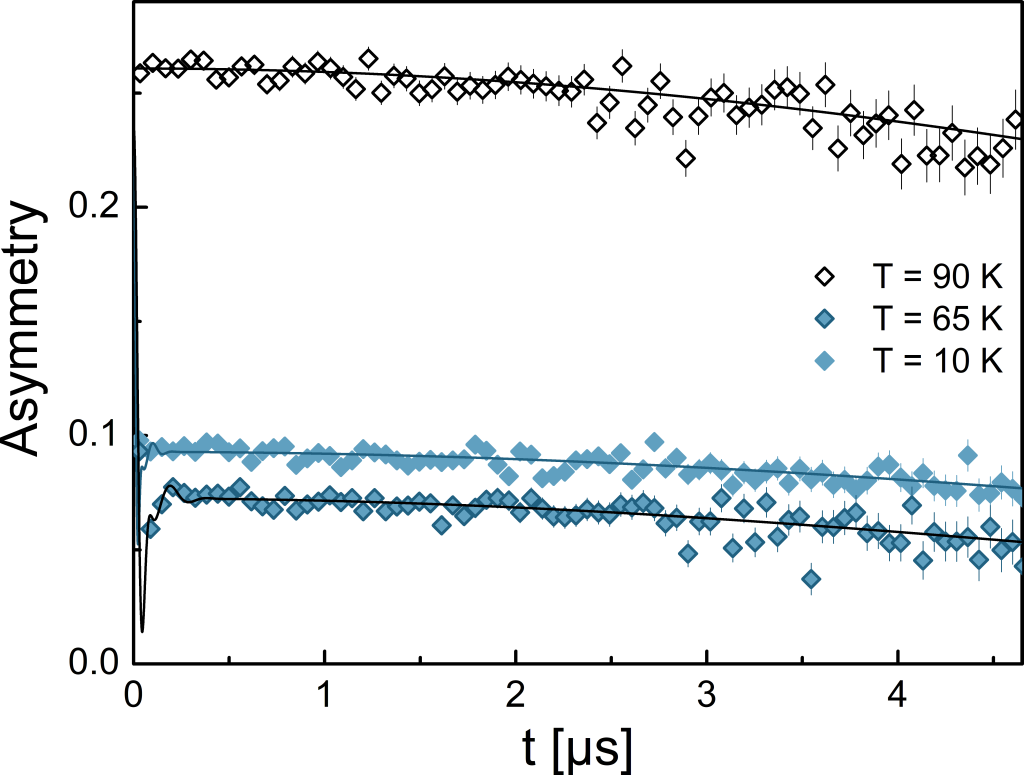
Figure 6 shows the long-time ZF-SR asymmetry at , 65, and 90 K, respectively, as recorded in the FB detectors. The asymmetry profile is compatible with a Gaussian-like relaxation, whose value is essentially independent of temperature, as expected for the muon-spin relaxation induced by nuclear dipolar fields.
References
- [1] G. Cao, S. McCall, J. E. Crow, R. P. Guertin, Observation of a metallic antiferromagnetic phase and metal to nonmetal transition in Ca3Ru2O7, Phys. Rev. Lett. 78 (1997) 1751–1754. doi:10.1103/PhysRevLett.78.1751.
- [2] G. Cao, K. Abboud, S. McCall, J. E. Crow, R. P. Guertin, Spin-charge coupling for dilute La-doped Ca3Ru2O7, Phys. Rev. B 62 (2000) 998–1003. doi:10.1103/PhysRevB.62.998.
- [3] W. Bao, Z. Q. Mao, Z. Qu, J. W. Lynn, Spin valve effect and magnetoresistivity in single crystalline Ca3Ru2O7, Phys. Rev. Lett. 100 (2008) 247203. doi:10.1103/PhysRevLett.100.247203.
- [4] Y. Yoshida, S.-I. Ikeda, H. Matsuhata, N. Shirakawa, C. H. Lee, S. Katano, Crystal and magnetic structure of Ca3Ru2O7, Phys. Rev. B 72 (2005) 054412. doi:10.1103/PhysRevB.72.054412.
- [5] X. Ke, J. Peng, W. Tian, T. Hong, M. Zhu, Z. Q. Mao, Commensurate-incommensurate magnetic phase transition in the Fe-doped bilayer ruthenate Ca3Ru2O7, Phys. Rev. B 89 (2014) 220407. doi:10.1103/PhysRevB.89.220407.
- [6] M. Zhu, T. Hong, J. Peng, T. Zou, Z. Q. Mao, X. Ke, Field-induced magnetic phase transitions and memory effect in bilayer ruthenate Ca3Ru2O7 with Fe substitution, J. Phys.: Condens. Matter 30 (2018) 075802. doi:10.1088/1361-648x/aaa626.
- [7] M. Zhu, J. Peng, T. Hong, K. Prokes, T. Zou, Z. Q. Mao, X. Ke, Field-induced metastability of the modulation wave vector in a magnetic soliton lattice, Phys. Rev. B 95 (2017) 134429. doi:10.1103/PhysRevB.95.134429.
- [8] S. Lei, S. Chikara, D. Puggioni, J. Peng, M. Zhu, M. Gu, W. Zhao, Y. Wang, Y. Yuan, H. Akamatsu, M. H. W. Chan, X. Ke, Z. Mao, J. M. Rondinelli, M. Jaime, J. Singleton, F. Weickert, V. S. Zapf, V. Gopalan, Comprehensive magnetic phase diagrams of the polar metal Ca3(Ru0.95Fe0.05)2O7, Phys. Rev. B 99 (2019) 224411. doi:10.1103/PhysRevB.99.224411.
- [9] Z. Mao, Y. Maeno, H. Fukazawa, Crystal growth of Sr2RuO4, Mater. Res. Bull. 35 (11) (2000) 1813–1824. doi:https://doi.org/10.1016/S0025-5408(00)00378-0.
- [10] .
- [11] L. M. Tran, M. Babij, L. Korosec, T. Shang, Z. Bukowski, T. Shiroka, Magnetic phase diagram of Ca-substituted EuFe2As2, Phys. Rev. B 98 (2018) 104412. doi:10.1103/PhysRevB.98.104412.
- [12] The tiny residual asymmetry observed in the UD detectors is most likely due to a small misalignment of the muon spin with respect to the -axis direction of the sample.
- [13] The chosen function shows a slightly lower with respect to a linear combination of two Kubo-Toyabe functions. Most importantly, it matches better the experimental data at short times. Other fitting models, such as a simple Kubo-Toyabe, or its linear combination with a Gaussian decay, largely miss the short-time asymmetry behavior, which demands the use of two oscillating functions, as evinced by two broad peaks at 70 and 136 mT in the Fourier transform (not shown).
- [14] F. Coneri, S. Sanna, K. Zheng, J. Lord, R. De Renzi, Magnetic states of lightly hole-doped cuprates in the clean limit as seen via zero-field muon spin spectroscopy, Phys. Rev. B 81 (2010) 104507. doi:10.1103/PhysRevB.81.104507.
- [15] R. Khasanov, Z. Guguchia, A. Maisuradze, D. Andreica, M. Elender, A. Raselli, Z. Shermadini, T. Goko, F. Knecht, E. Morenzoni, A. Amato, High pressure research using muons at the Paul Scherrer Institute, High Press. Res. 36 (2) (2016) 140–166. doi:10.1080/08957959.2016.1173690.
- [16] O. K. Forslund, D. Andreica, Y. Sassa, H. Nozaki, I. Umegaki, E. Nocerino, V. Jonsson, O. Tjernberg, Z. Guguchia, Z. Shermadini, R. Khasanov, M. Isobe, H. Takagi, Y. Ueda, J. Sugiyama, M. Månsson, Magnetic phase diagram of K2Cr8O16 clarified by high-pressure muon spin spectroscopy, Sci. Rep. 9 (2019) 1141. doi:10.1038/s41598-018-37844-5.
- [17] A. Yaouanc, P. Dalmas de Réotier, Muon Spin Rotation, Relaxation, and Resonance: Applications to Condensed Matter, Oxford University Press, Oxford, 2011.