Infant-phase reddening by surface Fe-peak elements in a normal Type Ia Supernova
Abstract
Type Ia Supernovae are thermonuclear explosions of white dwarf stars. They play a central role in the chemical evolution of the Universe and are an important measure of cosmological distances. However, outstanding questions remain about their origins. Despite extensive efforts to obtain natal information from their earliest signals, observations have thus far failed to identify how the majority of them explode. Here, we present infant-phase detections of SN 2018aoz from a brightness of 10.5 absolute AB magnitudes—the lowest luminosity early Type Ia signals ever detected—revealing a hitherto unseen plateau in the -band that results in a rapid redward color evolution between 1.0 and 12.4 hours after the estimated epoch of first light. The missing -band flux is best-explained by line-blanket absorption from Fe-peak elements in the outer 1% of the ejected mass. The observed color evolution of the SN also matches the prediction from an over-density of Fe-peak elements in the same outer 1% of the ejected mass, whereas bluer colors are expected from a purely monotonic distribution of Fe-peak elements. The presence of excess nucleosynthetic material in the extreme outer layers of the ejecta points to enhanced surface nuclear burning or extended sub-sonic mixing processes in some normal Type Ia SN explosions.
-
1
David A. Dunlap Department of Astronomy and Astrophysics, University of Toronto, Toronto, ON, Canada
-
2
The Observatories of the Carnegie Institution for Science, Pasadena, CA, USA
-
3
TAPIR, Walter Burke Institute for Theoretical Physics, Caltech, Pasadena, CA, USA
-
4
Department of Astronomy/Steward Observatory, University of Arizona, Tucson, AZ, USA
-
5
CENTRA-Centro de Astrofísica e Gravitação and Departamento de Física, Instituto Superior Técnico, Universidade de Lisboa, Avenida Rovisco Pais, Lisboa, Portugal
-
6
Korea Astronomy and Space Science Institute, Daejeon, Republic of Korea
-
7
Korea University of Science and Technology, Daejeon, Republic of Korea
-
8
Department of Astronomy and Space Science, Chungnam National University, Daejeon, Republic of Korea
-
9
Department of Physics, University of California, Santa Barbara, CA, USA
-
10
Las Cumbres Observatory, Goleta, CA, USA
-
11
Department of Physics and Astronomy, Texas A&M University, College Station, TX, USA
-
12
Lawrence Berkeley National Laboratory, Berkeley, CA, USA
-
13
Department of Astronomy, University of California, Berkeley, CA, USA
-
14
George P. and Cynthia Woods Mitchell Institute for Fundamental Physics & Astronomy, College Station, TX, USA
-
15
Institute of Space Sciences (ICE, CSIC), Campus Universitat Autònoma de Barcelona, Carrer de Can Magrans, Barcelona, Spain
-
16
Institut d’Estudis Espacials de Catalunya (IEEC), Barcelona, Spain.
-
17
Center for Astrophysics | Harvard & Smithsonian, Cambridge, MA, USA
-
18
The NSF AI Institute for Artificial Intelligence and Fundamental Interactions
-
19
Department of Physics and Astronomy, University of California, Davis, CA, USA
-
20
Institute of Astrophysics, FORTH, Department of Physics, University of Crete, Voutes, University Campus, Heraklion, Greece
-
21
Max-Planck-Institut für Radioastronomie, Bonn, DE
-
22
Argelander Institut für Astronomie, Bonn, DE
-
23
The School of Physics and Astronomy, Tel Aviv University, Tel Aviv, Israel
-
24
Canadian Institute for Advanced Research (CIFAR), Toronto, Ontario, Cana
-
25
Department of Astrophysical Sciences, Princeton University, Princeton, NJ, USA
-
26
DIRAC Institute, Department of Astronomy, University of Washington, Seattle, WA, USA
-
27
Astrophysics Science Division, NASA Goddard Space Flight Center, Greenbelt, MD, USA
-
28
Joint Space-Science Institute, University of Maryland, College Park, MD, USA
-
29
School of Space Research, Kyung Hee University, Yongin, Republic of Korea
-
30
Department of Particle Physics and Astrophysics, Weizmann Institute of Science, Rehovot, Israel
-
31
Department of Physics and Astronomy, University of North Carolina at Chapel Hill, Chapel Hill, NC, USA
-
32
Central (Pulkovo) Observatory of Russian Academy of Sciences, Saint Petersburg, Russia
-
33
Las Campanas Observatory, Carnegie Observatories, La Serena, Chile
-
34
Departamento de Ciencias Fisicas, Universidad Andres Bello, Santiago, Chile
-
35
Millennium Institute of Astrophysics (MAS), Providencia, Santiago, Chile
-
36
Department of Physics and Astronomy, Macquarie University, NSW, Australia
-
37
Macquarie University Research Centre for Astronomy, Astrophysics & Astrophotonics, Sydney, NSW, Australia
-
38
The Oskar Klein Centre, Department of Astronomy, Stockholm University, AlbaNova, Stockholm, Sweden
-
39
Hubble Fellow: Rachael L. Beaton
-
40
Carnegie-Princeton Fellow: Rachael L. Beaton
-
*
Correspondence should be addressed to D.-S.M. (email: moon@astro.utoronto.ca).
Type Ia Supernovae (SNe) are the main source of iron (Fe)-peak elements in the Universe[1] and their use in measuring extragalactic distances led to the discovery of the accelerated cosmological expansion and dark energy[2, 3]. Despite their fundamental importance, the explosion mechanisms of Type Ia SNe remain a matter of extensive debate[4], particularly for the “normal” events, comprising 70% of their population[5]. Normal Type Ia SNe may be ignited by nuclear burning in a white dwarf (WD) when binary accretion or merger causes its mass to reach the critical Chandrasekhar limit ( 1.4 ). Alternatively, recent studies have shown that they may also arise from sub-Chandrasekhar-mass WDs via a helium-shell double-detonation (He-shell DDet), wherein the detonation of a thin helium layer on the surface of the WD subsequently ignites carbon in the core[6, 7, 8]. Normal Type Ia SNe may arise from multiple explosion channels and it is uncertain what fraction of them are produced by different explosion channels. It has been suggested that He-shell DDets can potentially account for up to 40% of them[6].
Historically, most Type Ia SNe were discovered and monitored around the peak of their light curves 2–3 weeks post-explosion, when their emission is dominated by the decay of concentrated in the center of their ejecta. However, multiple explosion processes, such as sub-sonic mixing[9] and surface He burning[6, 10], predict over-densities of Fe-peak elements in the shallow outer layers of the ejecta, leading to excess emission and short-lived spectroscopic features in the faint and elusive “infant” phase within a few days post-explosion. Excess red emission identified between 1 and 5 days in at least two spectroscopically peculiar events was interpreted to be from the ashes of a He-shell detonation[11, 12, 13]. On the other hand, multiple events from the normal[14, 15, 16, 17] and overluminous[18, 19] subtypes have been observed with excess blue emission until 5 days. There are several possible interpretations for the blue emission, including excess heating from a over-density[20, 15]. For the vast majority of Type Ia SNe observed between 1 and 5 days, the rising parts of their light curves match simple power-law profiles[21, 22, 23, 24, 25, 26], consistent with a centrally concentrated and monotonic distribution of under the ejecta surface. Overall, observations to date have tightened constraints on the distribution of nucleosynthetic elements in normal Type Ia SNe, but how they explode still remains uncertain[13]. Deep multi-color observations covering the infant phase within 1 day post-explosion can shed new light on this longstanding problem.
Discovery and Follow-up Observations of SN 2018aoz
SN 2018aoz was first detected at 00h54m on 29 March 2018 Universal Time (UT) in a -band image taken by the Korea Microlensing Telescope Network[27, 28] (KMTNet) of a field containing the elliptical galaxy NGC 3923[29] at redshift (see Table 1). Unlike previous studies of Type Ia SNe, our observations were obtained in three bands () from the moment of first detection, at an average cadence of 4.7 hours. The first detections in the and bands followed 2 minutes and 2.4 hours later, respectively, while it was not detected in images from the previous night. The source was also identified by the Distance Less than 40 Mpc survey[30] 1.1 days after the first KMTNet detection, reported to the Transient Name Server at 07h25m on 2 April 2018 UT, and classified as a normal Type Ia SN with a spectrum obtained by the Las Cumbres Observatory[31] at 09h25m on 2 April 2018 UT. The discovery triggered an extensive follow-up campaign, in which ultra-violet (UV), optical, and near-infrared (NIR) imaging and spectroscopy were obtained.
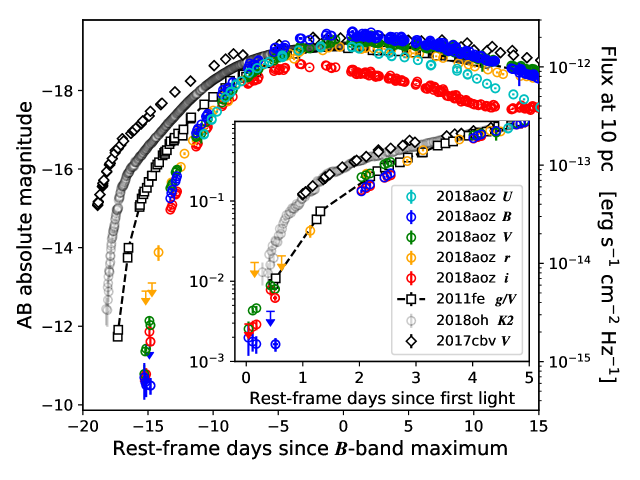
Figure 1 compares part of our high-cadence light curves of SN 2018aoz (see Supplementary Information for the full UV to NIR light curves) with early light curves of other normal Type Ia SNe after Galactic extinction correction (Methods). Note that the KMTNet -band observations are calibrated to the nearest American Association of Variable Star Observers (AAVSO) standard filters (; see Methods). The -band light curve peak absolute magnitude, = 19.32 mag, and decline rate over the first 15 days post-peak, = 1.12 mag—two parameters commonly used to classify Type Ia SNe[32]—identify SN 2018aoz as a normal Type Ia. The early light curves of SN 2018aoz rise faster than most normal events such as SNe 2011fe[21, 33], 2018oh[34, 17], and 2017cbv[15, 20], which have similar and values as SN 2018aoz, though the total rest-frame rise time of SN 2018aoz from its onset to -band maximum (15.32 days) is consistent with events near the lower extreme of the rise time distribution of the normal population (ranging in 15–22 days[26]).
Earliest Observations: -band Plateau and Excess Emission
The onset of the light curve (or “epoch of first light”) is estimated to be 23h54m on 28 March 2018 UT (MJD 58205.9958), or 1.0 0.5 hours before the first detection (see below), making it the earliest 3- detection for any Type Ia SN. Figure 1 (inset) compares the earliest observations of SN 2018aoz to those of other normal Type Ia SNe in filters nearest to the band. The observations of SN 2018aoz over the first 0.5 days constitute the lowest luminosity signals ever detected from an early Type Ia SN—up to a factor of 3 below the first detected luminosity of SN 2011fe[21]. In this unexplored “infant” phase and depth, the -band fluxes are nearly constant (the “-band plateau”) while the bands rise rapidly at a rate of 2 mags/day, resulting in an abrupt redward evolution of the color by 1.5 mags between 1.0 and 12.4 hours after first light (Figure 2). These features have never been identified in any Type Ia SN to date.
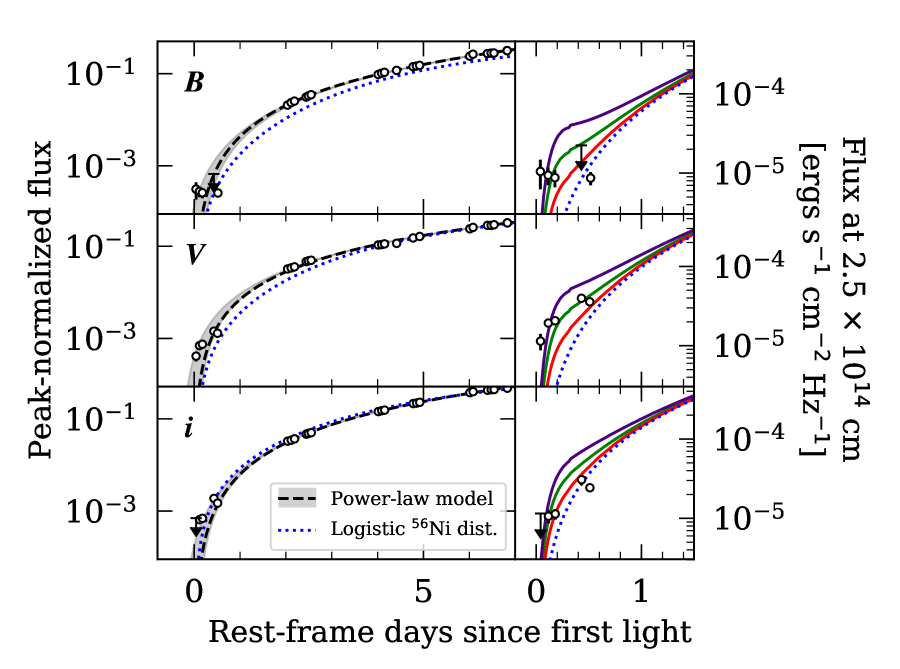
In order to estimate the epoch of first light, we fit a power-law model to the rising light curves of SN 2018aoz (Supplementary Section 1), as typically adopted in the analysis of Type Ia SNe[21, 22, 35, 23, 24, 11, 25, 17, 26]. The -band light curve during 0–0.5 days was omitted from the fitting to avoid the uncertainty associated with the -band plateau. Figure 3 (left panels) compares the best-fit power-law to the observed light curves of the SN over the fitting interval (0–7 days). In the infant phase of 0–0.5 days, faint excess emission over the simple power-law fit is evident in the and bands, simultaneous with the -band plateau. In subsequent epochs, the power-law provides an acceptable fit to the rising light curves, consistent with the vast majority of Type Ia SNe such as 2011fe (Figure 1), while there is no evidence for excess emission in SN 2018aoz at the brightness level of the excess emission observed in SNe 2018oh and 2017cbv during 1–5 days.
Origin of Infant-Phase Emission in the Extreme Outer Ejecta
The appearance of a short-duration -band plateau and simultaneous excess emission over the power-law emission almost immediately following the SN explosion would localize the mechanisms responsible for these features to the extreme outer ejecta where the optical depth is lower. However, the short 15.3-day rise time of SN 2018aoz compared to the 18.9-day average for normal Type Ia SNe could, in principle, indicate a long “dark phase” between the epochs of explosion and first light due to the time delay for radioactive photons to diffuse out of the ejecta[36]. To examine the presence of such a dark phase in SN 2018aoz, we estimate the explosion epoch, , by fitting its photospheric velocity evolution traced by the Si II 6355 Å absorption feature with a power-law model that has provided a good fit to other Type Ia SNe[15, 37] (Supplementary Section 2), obtaining = MJD 58205.6 0.7 (0.4 days prior to first light). Since this method is independent of the distribution of radioactive photons, it is also dark-phase independent. The difference between the epochs of explosion and first light constrains the dark phase in SN 2018aoz to be 1 day, disfavouring the dark phase explanation for its short rise time among normal events. Instead, the shorter rise time can be attributed to a smaller effective ejecta mass along the line of sight, or a smaller total ejecta mass assuming spherically symmetric ejecta (Supplementary Section 4).
The mass of material in the outer ejecta that is visible via photon diffusion at time post-explosion, , can be estimated via the following equation derived from a polytropic (n = 3) ejecta profile expected for an exploding WD undergoing homologous expansion[36].
| (1) |
where and are the mass and kinetic energy of the SN ejecta, respectively, and 0.1 cm2 g-1 is expected for -dominated opacity[38]. The equation can be re-written compactly in terms of the parameter , the geometric mean of the diffusion and expansion timescales:
| (2) |
Adopting = 9.5 from modelling the observed bolometric luminosity of the SN (Supplementary Sections 3 and 4), this locates the origin of the infant-phase features of SN 2018aoz visible 1 day post-explosion within the outer 2% of the SN-ejected mass along the line of sight.
Origin of the Infant-Phase -band Plateau and Red Color
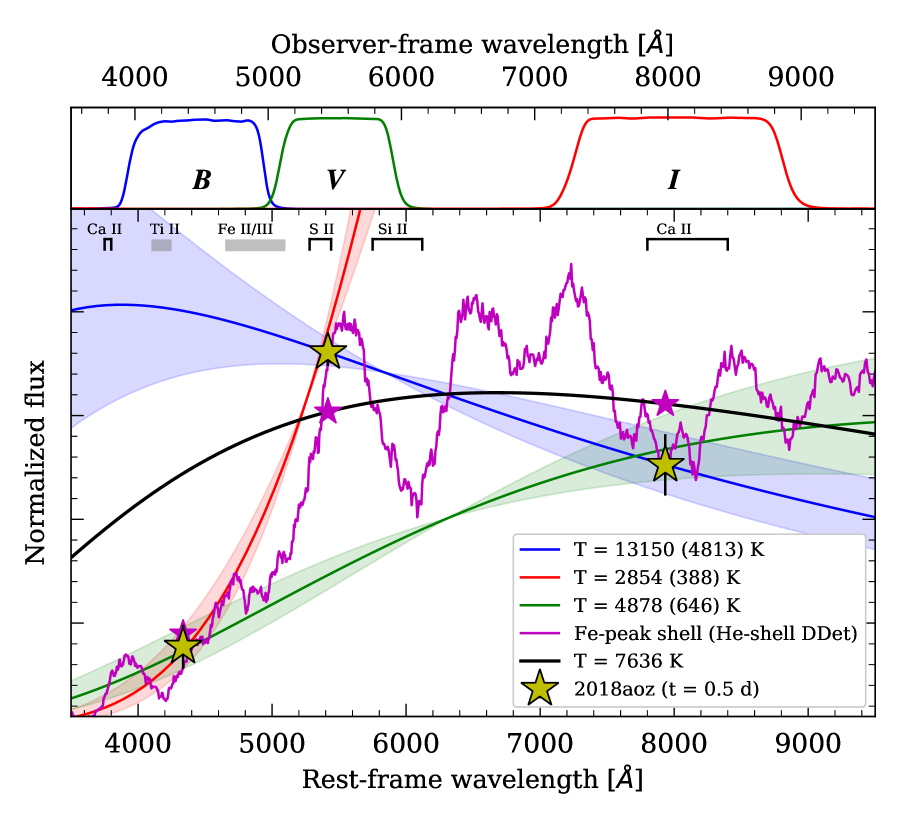
We examine whether the infant-phase -band plateau and redward color evolution are consistent with blackbody emission from cooling shock interactions that can be readily expected in early Type Ia SNe (e.g., ejecta collision with a companion[39]). Figure 4 compares the observed spectral energy distribution (SED) of SN 2018aoz in filters at 0.5 days, when the color peaks, to those of various blackbodies. Clearly, it is impossible to fit all three bands at this epoch with a single blackbody distribution. The -band fluxes alone are consistent with a 13000 5000 K blackbody, which is within the expectations for shock-heated SN ejecta[40, 39]. However, accommodating the low -band flux level requires either unreasonably cold temperatures for early Type Ia SNe or a break in the spectrum between the and bands ( 5000 Å) with 70% flux suppression bluewards of the break (Supplementary Section 6). This indicates that while the underlying emission may be thermal in origin, a suppression of the -band flux relative to the blackbody distribution is required to reproduce the observed SED of SN 2018aoz during the infant phase. Note that continuous extinction (e.g., by circumstellar dust) is unable to explain the suppression, even for the case of extreme dust extinction (Supplementary Section 6). For a photosphere radius of 2.5 1014 cm at 0.9 days post-explosion—estimated by adopting a polytropic (n = 3) ejecta profile[36] with = 9.5 and the observed Si II velocity near peak (see Table 1) as the characteristic ejecta velocity—the amount of -band flux suppression needed to explain the observed SED at 0.5 days is (3.2 0.6) 10-5 ergs s-1 cm-2 Hz-1 for a 13000 5000 K blackbody source, corresponding to an isotropic -band energy deficit of (2.5 0.5) 1025 ergs s-1 Hz-1.
Such a selective suppression of flux can only be from line absorption. Fe-peak and associated nucleosynthetic elements, including , , , , and their decay products, are the elements expected in Type Ia SNe that can significantly suppress flux in the vicinity of 5000 Å. While H and He lines can blanket 4000 Å[41, 42], they are not generally expected in Type Ia SNe and most of the -band flux would not be significantly affected. We find that a distribution of Fe-peak elements near the ejecta surface can reproduce the -band suppression, offering the best explanation for the infant-phase -band plateau and red color of SN 2018aoz. In Figure 4, the observed SED at 0.5 days ( 0.9 days post-explosion) is compared to the modelled spectrum of a Type Ia SN with an excess of Fe-peak elements in the outer 1% of the SN-ejected mass at a nearly identical phase (1.05 days post-explosion), obtained by fitting the early light curves of SN 2018aoz with a grid of He-shell DDet simulations (see below). Indeed, the model predicts a 5000 Å spectroscopic break with significant flux suppression bluewards of the break caused by Fe-line blanketing. Estimating the amount of suppression by performing photometry on the modelled spectrum using the KMTNet filters (Figure 4, top panel), we obtain an isotropic -band energy deficit of 2.1 1025 ergs s-1 Hz-1 relative to the -band continuum of the model, consistent with what is required to explain the infant-phase SED of SN 2018aoz.
Distribution of Fe-peak Elements in the Extreme Outer Ejecta
To understand the origin of Fe-peak elements near the ejecta surface in SN 2018aoz, we investigate if the elements are part of the centrally-concentrated and monotonic main distribution of in the ejecta or if they constitute a distinct radial over-density in a shell (or clump, depending on the 3D distribution). We find that the early light curves of the SN accommodate the presence of a radioactive shell/clump as follows. Figure 3 compares the observed early light curves to those predicted by blackbody models powered by four distributions: a logistic function[37] peaked at the ejecta core fitted to the SN light curves during 0–10 days (Supplementary Section 5), representing the main distribution, and the same function with total mass in the outer 0.31% of the SN-ejected mass increased to (0.9, 1.8, and 3.6) 10-4 . During 1–7 days, the logistic model follows similar rising behavior as the SN luminosity, confirming that the distribution is mainly centrally-concentrated and monotonic under the ejecta surface. In the infant phase between 0 and 1 days, however, the pure logistic model under-predicts the observed luminosity in all three bands. Excess radioactive materials is one possible explanation for the luminosity difference, as shown by the models with increased fractions.
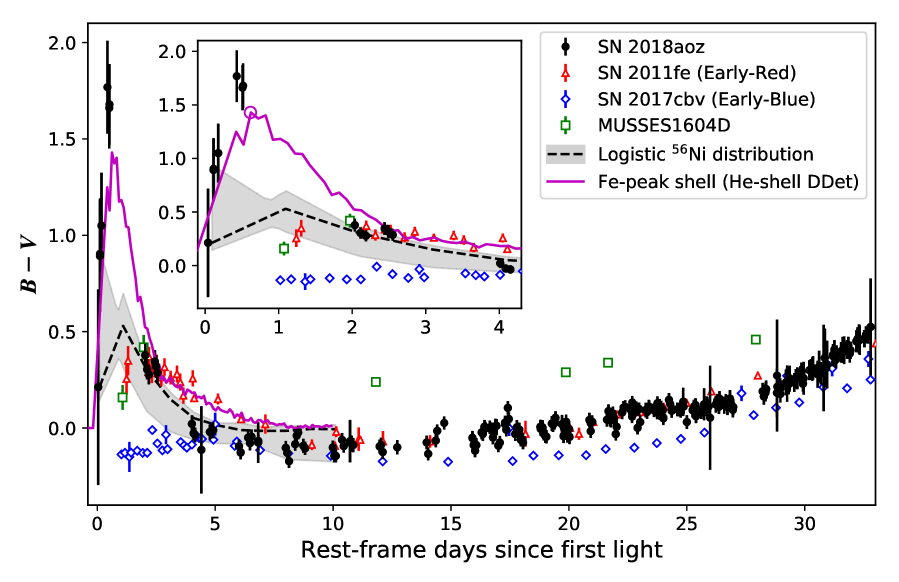
The stratification of Fe-peak elements in the ejecta also affects the color of the SN[43, 6] as their absorption features (Figure 4) evolve over time. Figure 2 shows that the color evolution of SN 2018aoz is best-explained if the ejecta possesses an over-density of surface Fe-peak elements in addition to a centrally-concentrated and monotonic distribution. The observed color curve is compared to those predicted by radiative transfer calculations of two different ejecta profiles: (1) a purely logistic distribution[43] fitted to the light curves of SN 2018aoz during 1–10 days (Supplementary Section 7.2) and (2) a logistic-like distribution with a shell of Fe-peak elements in the outer 1% of the ejected mass from the best-fit He-shell DDet simulation (see below). The model with an Fe-peak shell provides a much better fit to the observed color evolution from the infant phase to later epochs than the one with a logistic distribution alone, though both models are consistent with the observed color evolution after 2 days.
Nature of SN 2018aoz and Implications for Type Ia SN Origins
The presence of an Fe-peak shell/clump near the ejecta surface, as found in SN 2018aoz, has critical implications for the normal Type Ia explosion mechanism. Simulations of Type Ia SNe have shown that over-densities of Fe-peak elements in the extreme outer ejecta can result from either mixing during a sub-sonic explosion process or surface nuclear burning during the explosion. The former is predicted by some Chandrasekhar-mass explosion models, where a WD initially deflagrates sub-sonically before transitioning into a detonation[9]. When the explosion is spherically symmetric, the deflagration phase is usually limited to the inner ejecta while a detonation is required to traverse the low-density outer ejecta[44], a process that is not expected to produce surface Fe-peak clumps[45]. However, some simulations have found that asymmetric explosions resulting from off-center deflagrations can produce surface Fe-peak clumps that are visible from a limited set of favourable viewing angles[45, 46], which could be one possible explanation for the distribution of Fe-peak elements in SN 2018aoz. Separately, a gravitationally confined detonation, where the off-center deflagration plume rises buoyantly to the progenitor surface, is another scenario that produces a spherical shell of Fe-peak elements near the ejecta surface, though recent simulations have shown that this produces peculiar explosions that are incompatible with normal Type Ia SNe[47].
Sub-Chandrasekhar-mass He-shell DDets offer another way to produce Fe-peak elements in the outer ejecta. In the case of the spectroscopically peculiar Type Ia SN MUSSES1604D[11], the detonation of a 0.054 He-shell was invoked to explain its redward color evolution during 1–2 days post-explosion (Figure 2). To investigate if this scenario can explain a redward color evolution with a much shorter timescale and larger amplitude, as observed in SN 2018aoz, we perform a grid of He-shell DDet Type Ia SN simulations with a range of WD and He-shell masses (Supplementary Section 7.1), fitting the observed light curves during 0–8 days. We obtain the best-fit with a small He-shell mass of on a WD, which also provides the best match to the near-peak light curves and spectroscopic features. As shown above, this model can indeed explain the -band suppression (Figure 4, magenta spectrum) and color evolution (Figure 2, magenta curve) of SN 2018aoz. If He-shell DDet is the origin of surface Fe-peak elements in SN 2018aoz, it would imply that detonations of He-shells as thin as 0.01 can successfully initiate normal Type Ia SNe, consistent with the predictions of our simulations and other recent simulations[48, 7]. In our best-fit He-shell DDet model for SN 2018aoz, 12.9% of the outer 1% of the ejecta by mass is composed of , , and . Although this is comparable to the amount of radioactive material needed to reproduce the infant-phase excess emission in SN 2018aoz (see section “Distribution of Fe-peak Elements in the Extreme Outer Ejecta”), the He-shell DDet model under-predicts the emission 0.5 days (Supplementary Section 7.1), indicating that either the current He-shell DDet models do not fully capture radioactive heating at early times or another source of emission is also required (e.g., ejecta collision with a companion[49]). Future modelling is necessary to ascertain how the inclusion of more detailed effects would influence the inferred mass of surface Fe-peak elements in SN 2018aoz.
No other Type Ia SN has been detected in multiple bands at early enough epochs and sufficient depth to identify the remarkable -band plateau and extreme redward color evolution observed during the first 1 day post-explosion in SN 2018aoz. Thus, such features could be present in many normal Type Ia SNe, but likely not all of them. Observationally, based on the color evolution in later epochs (2–5 days; see Figure 2), SN 2018aoz appears to belong to the “early-red” population of Type Ia[19] comprising just over half of the normal events, although whether the reported “early-red/blue” dichotomy of Type Ia SNe truly represents separate populations is still uncertain[19, 50, 13]. Theoretically, we note that two of the three Type Ia SN explosion mechanisms described above that can accommodate the presence of surface Fe-peak elements can only account for some fractions of the entire normal Type Ia population in current models: He-shell DDets leave almost no unburnt carbon, incompatible with 40% of Type Ia SNe[51], and the strong asymmetry of the gravitationally confined detonation scenario only leaves a small (if existent) set of compatible viewing angles for normal events[47]. SN 2018aoz provides the first evidence that surface Fe-peak elements are required in at least a fraction of normal Type Ia SN explosions.
Methods
0.1 Discovery and Photometric Observations of SN 2018aoz.
SN 2018aoz was identified by both the KMTNet Supernova Program[27, 52, 53] (KSP) and Distance Less Than 40 Mpc Survey[30] (DLT40). KSP uses the three 1.6m telescopes of the KMTNet in Chile, South Africa, and Australia in order to conduct a survey optimized for detecting and continuously monitoring infant SNe in multiple colors. Each telescope of the network is equipped with an identical wide-field CCD camera with 4 square degree field-of-view and multiple filters. Between 2018 February and July, we conducted high-cadence monitoring of a 2∘ 2∘ field containing the nearby elliptical galaxy NGC 3923. We obtained 700 images of the field with 60-s exposure times at a mean cadence of 4.7 hours in each of the bands. (Note that the -band observations are calibrated to AAVSO -band magnitudes as described in section “Photometric Calibration” below.) The typical limiting magnitude for a point source in these images is 2122 mag at a signal-to-noise ratio (S/N) of 3. DLT40 utilizes the 0.4m PROMPT5 telescope[54] at Cerro Tololo Observatory in Chile to conduct a daily cadence survey of nearby galaxies, also optimized for detecting SNe at an early phase. The survey observations are unfiltered with a typical single-epoch depth of 1920 mag.
The earliest detections (S/N 3) of SN 2018aoz were made by KSP at 00h54m on 29 March 2018 UT (MJD 58206.0378) in the and bands obtained with the Chilean KMTNet telescope at the coordinate (RA, decl.) = (, ∘ ′ ′′) (J2000), 3.72′ away from the center of NGC 3923 in the northern direction. Supplementary Figure 1 (column 2) shows the first -band images, taken within 4 minutes of each other, obtaining S/N of 3.5, 4.3, and 1.9, respectively, at the source position. The apparent magnitudes of the source in the images were measured to be 21.570.44, 21.260.25, and 21.970.58 mag, respectively, where the error includes contributions from background noise at the source position, photometric calibration, and -band S-correction (see below). The source was not detected in -, -, or -band images obtained 1.1 days before the first detection. DLT40 detected the source 1.1 days later and made the discovery report at 07h25m on 2 April 2018 UT (MJD 58210.4158)[55, 56].
In addition to observations made by KSP and DLT40, we conducted optical photometric observations of SN 2018aoz using 1m telescopes of the Las Cumbres Observatory (LCO) network of robotic telescopes in conjunction with the Global SN Project between 4.4 and 64 days since first light.[31] These observations are supplemented by UV observations acquired by the Neil Gehrels Swift Observatory[57] Ultra-Violet Optical Telescope[58] (UVOT), and NIR observations from the ANDICAM[59] instrument on the SMARTS 1.3m telescope at Cerro Tololo Observatory. The Swift-UVOT and ANDICAM observations were carried out during the periods of 5.559 and 9.1110 days since first light, respectively.
0.2 Photometric Calibration.
Point-spread function (PSF) photometry of SN 2018aoz on KSP images was performed using the SuperNova Analysis Package (SNAP; Code Availability), a custom python-based pipeline for SN photometry and analysis. A local PSF was obtained by fitting a Moffat function[60, 61] to nearby reference stars and simultaneously fitting sky background emission with a first-order polynomial function. The fluxes of SN 2018aoz were obtained by fitting the local PSF near the source location, and the detection S/N is equal to the best-fit flux divided by its 1- uncertainty. Photometric flux calibration was performed against 6–9 standard reference stars within 10′ of the source from the AAVSO Photometric All-Sky Survey[62] database whose apparent magnitudes are in the range of 15–16 mag; the observations in the KMTNet filters were calibrated against reference stars in the nearest AAVSO filters (Johnson , and Sloan ; or ).
The KSP instrumental magnitudes for the AAVSO reference stars were transformed to standard magnitudes using the equations from Park et al. (2017)[63]. However, the spectra of SNe, particularly after the peak, are significantly different from the AAVSO standard stars used to derive the transformation equations. In order to account for this, we applied spectrophotometric (S)–corrections, which are magnitude corrections between instrument and standard filters derived by performing synthetic photometry on spectra obtained at the same epoch[64]. We applied interpolated S–corrections to observations following the first spectrum taken at UT 09h22m on April 2 (MJD 58210.39), 4.4 days since first light. At epochs observed before 4.4 days, we applied the Park et al. (2017) transformation equations to the source in lieu of S–corrections under the assumption that the spectrum of SN 2018aoz in the early phase is dominated by continuum emission, which is supported by the small magnitude of S–corrections before the peak.
We searched for faint background sources around the location of the SN by using 300 individual pre-SN images in each of the bands to create deep stacked images shown in Supplementary Figure 2 (right panels). As seen in the figure, we identified a background source 0.8′′ north-east of the SN position with apparent -band magnitudes of 24.900.27, 24.020.20, and 22.390.08 mag, respectively. (See section “Host, Distance, and Extinction” below for the discussion of the nature of this source). In the and bands, the brightness of the source is significantly below the 1- detection limits of the earliest images within 0.5 days—22.9 and 22.7 mag for - and -band detection images, respectively—and much smaller than that of the SN at any epoch ( 21.8 mag for band and 21.3 mag for band). Therefore, we ignore the background source in the - and -band photometry as it is incapable of meaningfully affecting the PSF photometry of SN 2018aoz. For the -band photometry, we remove the background source when the SN brightness is 100 times that of the background source (which is only for epochs before 0.5 days) by measuring the SN flux using a Kron aperture containing both sources and subtracting the known flux of the background source.
Unfiltered observations obtained with the DLT40 survey were template subtracted and then calibrated to APASS -band observations of field stars. Additional optical observations with the LCO 1-m telescopes were carrried out in the , , , , , and bands. Photometric reduction for the LCO images was accomplished using lcogtsnpipe[65], a PyRAF-based pipeline. Zeropoints for images in Landolt filters were calculated from Landolt standard field images taken by the telescopes on the same nights as the observations. Zeropoints for images in Sloan filters were calculated using APASS stars in the same field-of-view as SN 2018aoz.
Observations with the Neil Gehrels Swift Observatory were triggered under the Swift Guest Investigator key project Swift Response to Nearby Supernovae. Swift observations began at 13h57m on 3 April 2018 UT (MJD 58211.5811), and used all six medium band filters–, , , , , and . Coaddition of same-day images and photometry were done using the pipeline of the Swift Optical Ultraviolet Supernova Archive[66] (SOUSA) and the photometry is calibrated to the UVOT Vega system[67]. The Swift/UVOT photometric reduction includes the subtraction of the host galaxy count rates using images obtained August 2019. The UVOT photometry uses the September 2020 update to the time-dependent sensitivity correction[68].
Seventeen epochs of -, -, and/or -band observations of SN 2018aoz were obtained with ANDICAM mounted to the 1.3m telescope at the Cerro Tololo Inter-American Observatory (CTIO) and operated by the SMARTS Consortium under programme NOAO-18A-0047. For each epoch, a set of 10 individual 20s images were taken per band, with a hexagonal 7-position dithering of around 20 arcsec. The dithered frames were stacked to produce the final co-added images for each epoch. PSF photometry was performed on the SN and nearby field stars using standard daophot packages within the Image Reduction and Analysis Facility (IRAF) software and absolute calibration was performed using Two Micron All Sky Survey[69] (2MASS) magnitudes.
The light curves of the SN from all the photometric observations are shown in Supplementary Figure 3 and provided in Supplementary Table 1. The photometry will also be publicly available on the Open SN Catalog[70].
0.3 Robustness of Infant-phase KSP Photometry.
Supplementary Figure 1 presents the - , -, and -band stamp images (rows 2–4) showing the detection of the source at the epoch of the first detection (column 2), three following epochs during its infant phase ( 0.5 days since first light; columns 3–5), and one epoch immediately before and after the infant phase (columns 1 and 6, respectively), as well as a table (row 1) showing the time and moon position at each observation. The moon was nearly full and at 25–45∘ elevation during the epochs, contributing to the background noise in the images. We find -band 3- detection limits of 20.8–21.9 mag in single-epoch images from 0–0.5 days, consistent with typical limiting magnitudes for the KMTNet[71] and significantly deeper than the -band plateau at multiple epochs in the phase, despite the moon brightness. Note that these limiting magnitudes are estimated in a conservative way from background pixel variations, which gives limits that are slightly shallower than the depths detectable using PSF photometry in our data. Supplementary Figure 1 provides the measured S/N at the SN position in the bottom-right corner of each stamp image, showing the robust (S/N 5) detection of the SN in all three bands at 0.11, 0.18, and 0.51 days during its -band plateau and redward color evolution.
We confirm the detection of the infant-phase -band suppression as follows. Supplementary Figure 1 (column 5) shows stamp images of the SN at 0.51 days, when its -band flux was lowest compared to the and bands and its color reached maximum. The images were obtained by binning 2–3 adjacent images within 1.5 hours of each other for higher S/N. Each of the -, -, and -band images robustly detected the SN with S/N 7. In these images, we measure magnitudes of the SN to be 21.78 0.21, 20.02 0.04, and 20.33 0.08 mag, respectively, corresponding to a -band flux that is 3.7 0.7 times lower than the average of the and bands, after applying extinction correction. The detection of the -band suppression is also confirmed with synchronous fluxes of the SN at 0.5 days (Figure 4, yellow stars) obtained via Gaussian process light curve interpolation (see below), which show a -band flux that is 4.4 1.2 times lower than the average of the and bands. We note that it is impossible to reconcile this difference with a modification to the flux of the background source located 0.8′′ from the position of SN 2018aoz. The background source is 18 times dimmer than the SN at this epoch in -band and incapable of affecting the SN brightness significantly even if it vanished. Conversely, the background source brightness would have needed to increase by factors of 31 and 5.5 in the and bands, respectively, relative to its brightness in our deep stacked images—without a corresponding increase in the band—in order to lower the inferred - and -band fluxes of the SN at this epoch to that of the band. This is not supported by the centroids of the - and -band SN detections at this epoch, which are aligned with the SN position ( 0.04′′ away). We therefore conclude that the measured suppression of the -band flux relative to that of the and bands is robust.
0.4 Spectroscopy of SN 2018aoz.
We obtained 25 low-resolution optical spectra of SN 2018aoz spanning 4.4–136.3 days since first light with a combination of the Gemini Multi-Object Spectrograph[72] (GMOS) on the 8.1m Gemini-South telescope, the Wide-Field CCD (WFCCD) on the 2.5m du Pont telescope at Las Camapanas Observatory, and the FLOYDS spectrographs located on the 2m Faulkes telescopes of the Las Cumbres Observatory in Siding Spring and Haleakala[31]. Two moderate-resolution spectra were obtained near maximum light in the region around Na I D with the Blue Channel Spectrograph[73] on the MMT Telescope. The spectroscopic observations are summarized in Supplementary Table 2.
Spectra from the du Pont and MMT Telescopes were reduced using standard tasks within IRAF. Bias and flat-field corrections were performed on the two-dimensional frames, one-dimensional spectra were extracted, and wavelength calibration was performed using calibration lamps taken immediately after target exposures. Flux calibration and telluric corrections were peformed with a set of custom IDL scripts[74, 5] using spectrophotometric standards observed on the same night. GMOS spectra were reduced in a similar manner, but using the custom gmos suite of IRAF tasks. Initial flux calibration for GMOS spectra was performed using the IRAF tasks standard and calibrate, and final scaling was performed based on matching to observed photometry.
A selection of our best low resolution spectra are presented in Supplementary Figure 4 (left panel), as well as the two moderate resolution spectra. (The full set of spectra obtained will be available on the Open SN Catalog[70] and WISeREP[75]). As seen in the figure, the spectra of SN 2018aoz are dominated by high-velocity absorption features of Ca II, Fe II/III, S II, and Si II at early times. In particular, the presence of silicon features and the absence of hydrogen features confirm its Type Ia SN nature. Supplementary Figure 4 (top-right panel) shows that the spectrum of the SN near peak is nearly identical to normal Type Ia SNe 1994D[76] and 2002dj[77].
0.5 Host, Distance, and Extinction.
The host galaxy of SN 2018aoz is NGC 3923, an elliptical galaxy (Supplementary Figure 2, left panel), as confirmed below by their matching redshifts and distance moduli. Using SNID[78], we find a best-fit spectral template to the maximum light spectra of SN 2018aoz with a spectroscopic redshift of = 0.0058 0.0007, which matches the known redshift of the galaxy[29], = 0.00580 0.00003. Using NED[79], we determine a distance modulus (DM) of 31.75 0.15 mag to the SN based on Hubble flow in the cosmology of Riess et al. (2016)[80] with corrections for peculiar velocities due to the Virgo Supercluster, Great Attractor, and Shapley Supercluster[81]. This value is consistent with redshift independent distances to NGC 3923 based on surface brightness fluctuations (DM = 31.64 0.14 mag)[82], and to SN 2018aoz based on Type Ia SN template fitting (DM = 31.75 0.08 mag; see next section). The luminosity distance to the SN based on the Type Ia SN template DM is 22.4 0.8 Mpc. The location of the SN 3.72′ north of the galaxy center (Supplementary Figure 2), corresponding to a projected distance of 24.0 0.9 kpc, places it in the stellar halo of the galaxy.
SN 2018aoz suffers from relatively little Galactic extinction since it is located near the Galactic south pole with = 0.093 0.001 mag in its direction according to the extinction model of Schlafly & Finkbeiner (S&F 2011)[83], corresponding to extinction correction of 0.40, 0.29, and 0.18 mag for the , , and bands, respectively, for an = 3.1 Fitzpatrick (1999) reddening law[84]. For the spectra and spectral energy distribution of the SN (Supplementary Information), we adopted Galactic extinction corrections based on the updated reddening law of Fitzpatrick & Massa (F&M 2007)[85], which is slightly better in the UV regime. Given the halo environment of SN 2018aoz, little extragalactic extinction from NGC 3923 is expected. This is confirmed by the lack of observed Na I doublet (Na I D; 5890 and 5896 Å) absorption features at the redshift of the SN in two moderate resolution MMT spectra (Supplementary Figure 2, inset). We confirm the Galactic extinction to the source by fitting the equivalent widths of the Na I D in the observer frame using a Voigt doublet profile in each of the two MMT spectra[86]. The mean of the measurements is = 0.07 0.01 mag, consistent with the value from S&F 2011. The non-detection of Na I D in the rest-frame of the SN in these spectra constrains the host galaxy extinction to be significantly below this value. By scaling the measured Voigt profiles of the Galactic Na I D to the MMT spectra at = 0.0058, we estimate a 3- upper limit on the equivalent width of Na I D to be 0.11 Å, corresponding to 0.02 for the host galaxy, assuming a Milky-Way-like correlation between Na I D and dust extinction[86].
The nature of the background source located 0.8′′ north-east and underlying the position of SN 2018aoz in KSP images (Supplementary Figure 2) is uncertain, though we consider several possibilities below. It can be a source at the redshift of the SN, in which case the low -band luminosity (7.7 mag) and red color (1.6 mag) of the source are consistent with it being a dwarf galaxy or globular cluster in NGC 3923[87, 88, 89]. The projected distance of 86 pc between the SN and the source in the rest frame opens the possibility for association between the two, though the source apparently does not provide a dusty host environment, as evidenced by the lack of Na I D lines in the rest frame (see above). Alternatively, the source can be a spatially coincident foreground star or background galaxy. Additional observations with higher spatial resolution are required to determine whether the source is separated from the SN or truly underlying.
0.6 Light Curve Parameters.
The light curves of SN 2018aoz (Supplementary Figure 3) display two post-peak decay timescales, consistent with SNe powered by and radioactive decay. As typically found in normal Type Ia SNe, each of the NIR -band light curves reach a primary peak before the and bands, followed by a secondary peak associated with the recombination of iron group elements in the ejecta[49]. The light curves of normal Type Ia SNe in the photospheric phase from 10 to 15 days since peak are also known to form a family of functions parameterized by the Phillips parameter, , which measures the post-peak decline rate in the -band light curve[90]. To effectively include some peculiar Type Ia SNe, such as the rapidly evolving 91bg-like subtype, the color stretch parameter, , has been used as an alternative to , defined by 30 days, where is the time between -band peak to the maximum post-peak color[91]. We used SNooPy[92] to fit the -band light curves of SN 2018aoz with a normal Type Ia SN template based on Hsiao et al. (2007)[93], where the fitted parameters are stretch, time of -band peak (), and DM. In the fitting process, we applied –correction between the observer and rest-frame filter response functions for each filter (see below) and correct for Galactic extinction. The best-fit template (see Supplementary Figure 3) provides a good comparison to our observed light curves with and DM of (MJD) and mag, respectively. The stretch parameter of the best-fit template is 0.87 0.03.
We derive rest-frame magnitudes for SN 2018aoz by adopting the DM and –corrections from the best-fit template and Galactic extinction correction. The –corrections are insubstantial ( 0.02 mag) given the relatively small redshift of the SN. With rest-frame light curves for the SN, we used polynomial fitting to measure the peak absolute magnitudes of each -band light curve to be , , and mags, respectively. The corrected -band light curves each attained their peaks at , , and days (in the observer frame) prior to obtained from template fitting above, respectively. We also measured the Phillips parameter and color stretch parameter to be mag and , respectively. These parameters are close to the average of normal Type Ia SNe[32, 91], while they are inconsistent with subluminous (91bg-like) and overluminous (91T-like) events, confirming the classification of SN 2018aoz as a normal Type Ia SN.
0.7 Data Availability
The source data for Figure 1 during 0–1 days since first light is available in the online version of this paper, while the data for the entire single-epoch UV to NIR light curves are provided in the Supplementary Information. All photometric and spectroscopic data are also available on the Open Supernova Catalog[70] and WISeREP3[75]. The modelled light curves and spectra of our He-shell DDet simulations are available at https://github.com/niyuanqi/he-shell-ddet.
0.8 Code Availability
We performed light curve template fitting in the post-infant phase using SNooPy, available at https://csp.obs.carnegiescience.edu/data/snpy/snpy. In our He-shell DDet models, hydrodynamics and nucleosynthesis simulations were conducted using Castro[94, 95], and the radiative transfer calculations were conducted using Sedona[96]. The code used to measure the KMTNet light curves of SN 2018aoz, construct the bolometric light curves, and generate the analytic -powered light curve models are available at https://github.com/niyuanqi/SNAP. IRAF is distributed by the National Optical Astronomy Observatory, which is operated by the Association of Universities for Research in Astronomy, Inc. under cooperative agreement with the National Science Foundation.
-
Acknowledgements
This research has made use of the KMTNet system operated by the Korea Astronomy and Space Science Institute (KASI) and the data were obtained at three host sites of CTIO in Chile, SAAO in South Africa, and SSO in Australia. The Gemini South observations were obtained under the K-GMT Science Program (PID: GS-2018A-Q-117 and GS-2018B-Q-121) of KASI. The Swift observations were triggered through the Swift GI program 80NSSC19K0316. SOUSA is supported by NASA’s Astrophysics Data Analysis Program through grant NNX13AF35G. Some of the data presented herein were obtained at the W. M. Keck Observatory, which is operated as a scientific partnership among the California Institute of Technology, the University of California and the National Aeronautics and Space Administration. The Observatory was made possible by the generous financial support of the W. M. Keck Foundation. The Computational HEP program in The Department of Energy’s Science Office of High Energy Physics provided simulation resources through Grant #KA2401022. This research used resources of the National Energy Research Scientific Computing Center, a U.S. Department of Energy Office of Science User Facility operated under Contract No. DE-AC02-05CH11231. D.-S.M., M.R.D., and C.D.M. are supported by Discovery Grants from the Natural Sciences and Engineering Research Council of Canada. D.-S.M. was supported in part by a Leading Edge Fund from the Canadian Foundation for Innovation (project No. 30951). M.R.D. was supported in part by the Canada Research Chairs Program, the Canadian Institute for Advanced Research (CIFAR), and the Dunlap Institute at the University of Toronto. D.J.S. acknowledges support by NSF grants AST-1821987, 1821967, 1908972 and from the Heising-Simons Foundation under grant #2020-1864. S.G.-G. acknowledges support by FCT under Project CRISP PTDC/FIS-AST-31546 and Project UIDB/00099/2020. H.S.P. was supported in part by the National Research Foundation of Korea (NRF) grant funded by the Korean government (MSIT, Ministry of Science and ICT; No. NRF-2019R1F1A1058228). P.J.B. acknowledges support from the Swift GI program 80NSSC19K0316. S.V., Y.D., and K.A.B. acknowledge support by NSF grants AST-1813176 and AST-2008108. C.M. acknowledges support by NSF grant AST-1313484. I.A. is a CIFAR Azrieli Global Scholar in the Gravity and the Extreme Universe Program and acknowledges support from that program, from the Israel Science Foundation (grant numbers 2108/18 and 2752/19), from the United States - Israel Binational Science Foundation (BSF), and from the Israeli Council for Higher Education Alon Fellowship. R.L.B. acknowledges support by NASA through Hubble Fellowship grant #51386.01 awarded by the Space Telescope Science Institute, which is operated by the Association of Universities for Research in Astronomy, Inc., for NASA, under contract NAS 5-26555. A.G.-Y. acknowledges support from the EU via ERC grant No. 725161, the ISF GW excellence center, an IMOS space infrastructure grant and BSF/Transformative and GIF grants, as well as The Benoziyo Endowment Fund for the Advancement of Science, the Deloro Institute for Advanced Research in Space and Optics, The Veronika A. Rabl Physics Discretionary Fund, Paul and Tina Gardner, the Yeda-Sela Center for Basic Research and the WIS-CIT joint research grant. A. G.-Y. is the recipient of the Helen and Martin Kimmel Award for Innovative Investigation. L.G. acknowledges financial support from the Spanish Ministerio de Ciencia e Innovación (MCIN), the Agencia Estatal de Investigación (AEI) 10.13039/501100011033, and the European Social Fund (ESF) ”Investing in your future” under the 2019 Ramón y Cajal program RYC2019-027683-I and the PID2020-115253GA-I00 HOSTFLOWS project, and from Centro Superior de Investigaciones Científicas (CSIC) under the PIE project 20215AT016. G.P. acknowledges support from the Millennium Science Initiative through grant IC120009. J.A. is supported by the Stavros Niarchos Foundation (SNF) and the Hellenic Foundation for Research and Innovation (H.F.R.I.) under the 2nd Call of “Science and Society” Action Always strive for excellence – “Theodoros Papazoglou” (Project Number: 01431)
-
Author Contributions
Y.Q.N. conducted most of the analyses under the supervision of D.-S.M. and M.R.D.. D.-S.M. is the principal investigator of the KMTNet Supernova Program (KSP) that detected the infant-phase features of SN 2018aoz and wrote the KSP pipeline. M.R.D. led collaboration between the KSP and other partners. Y.Q.N. D.-S.M. and M.R.D. co-drafted the manuscript. A.P. conducted the He-shell DDet simulations under the supervision of P.N.. D.-S.M., M.R.D., Y.Q.N., N.A., S.G.-G., S.C.K., Y.L., H.S.P., J.A., A.G.-Y., S.B.C., G.P. and S.D.R. are members of the KSP. N.A., D.-S.M., M.R.D., R.G.C. and C.D.M. are members of the Canadian Gemini South observing program for the KSP. H.S.P., D.-S.M., S.C.K., and Y.L. are members of the Korean Gemini South observing program for the KSP. A.L.P. performed the shock breakout modelling. P.J.B. led the Swift program for UV observations with help from S.B.C.. L.G. and G.P. obtained the ANDICAM NIR observations. D.J.S. and S.V. co-led the DLT40 Program. J.H., D.E.R., V.K. and S.W. contributed to the operation of the DLT40 program. S.Y. built the machine learning implementation for the DLT40 survey. K.A.B. Y.D., J.E.A. and N.S. are members of the DLT40 team who obtained the Keck and MMT spectra. S.-M.C. and Y.L. helped operate the KMTNet. D.A.H., C.M., I.A., J.B., D.H., and G.H. contributed to the LCO photometry and the FLOYDS spectroscopy. M.R.D., R.L.B., T.W.-S.H., S.D.J., N.M., and J.R. contributed to the du Pont WFCCD and Magellan spectra. All of the authors contributed to discussion.
-
Competing Interests
The authors declare no competing interests.
| Parameter | Value | |
|---|---|---|
| 1 | Sky coordinates (RA, decl.) (J2000) | (∘ ′ ′′) |
| 2 | Redshift () | 0.00580 0.00003 |
| 3 | First detection: UT & MJD | 00 54 on March 29, 2018 & MJD 58206.03779 |
| 4 | Observed peak magnitude | 12.81 (), 12.80 (), 13.26 () mag |
| 5 | Observed peak epochs | MJD 58221.41 (), 58221.30 (), 58218.29 () |
| 6 | Early light curve power-law indices () | 2.24 0.02 (), 1.99 0.02 (), 2.26 0.01 () |
| 7 | Epoch of first light () | MJD 58206.00 0.02 |
| 8 | First detection from epoch of first light | 1.0 0.5 hours |
| 9 | Post-peak decline rate () | 1.117 0.015 mag |
| 10 | Color stretch parameter () | 0.797 0.019 |
| 11 | Peak absolute magnitude | –19.32 (), –19.23 (), –18.61 () mag |
| 12 | Peak Si II velocity | (11.43 0.12) 103 km s-1 |
| 13 | Explosion epoch () | MJD 58205.6 0.7 |
| 14 | Peak bolometric luminosity () | 1.42 1043 erg s-1 |
| 15 | Bolometric peak epoch | –1.16 days |
| 16 | mass () | 0.509 0.006 |
| 17 | parameter | 9.51 0.26 days |
| 18 | Ejecta mass () | 0.8–1.0 |
| 19 | Ejecta kinetic energy () | (0.6–0.8) 1051 erg |
Supplementary Information
1 Power-law Fit for the Epoch of First Light.
To estimate the epoch of first light of SN 2018aoz, we use a power-law model whose form is , where is time (days) since first light, is flux in filter normalized by peak flux, is the epoch of first light, and is power-law index. is expected to be 2 for thermal emission from a homologously expanding -powered sphere[21], though it can vary depending on the ejecta structure. The -band rising light curves of SN 2018aoz up to 40% of peak brightness[23] (excluding that of the -band during 0–0.5 days) were fitted with a model consisting of a single power-law in each band sharing a common . The best-fit model (Figure 3, left) estimates the epoch of first light at h on 2018 March 28 UT (MJD ) and power-law indices of , , and in the , , and bands, respectively, similar to indices found in other Type Ia SNe[26, 17, 23]. We note that while the power-law cannot be applied to the plateaued -band data before 0.5 days, the non-plateaued -band data after 0.5 days fits the power-law excellently, and, additionally, we find that excluding the latter data does not change the best-fit epoch of first light. The power-law also provides an adequate fit to the -band light curves of the SN outside of the infant phase where there is observed excess emission. This is confirmed by examining the contribution to the total error from different epochs, with = 6.0 coming from the infant phase (0–1 days) and only = 3.2 coming from all data in subsequent epochs (1–7 days). We obtain upper and lower bounds for the epoch of first light when all three infant-phase light curves are included in and excluded from the fit, respectively. The best-fit model in each case is shown as the upper and lower bounds, respectively, of the grey shaded error region in Figure 3. For these models, the fitted values are days after and days prior to MJD , respectively.
2 Photospheric Velocity and the Explosion Epoch.
The photospheric velocities of Type Ia SN ejecta are typically measured using the Doppler shift of the Si II 6355 Å absorption feature (or “Si II velocity”), which persists until 30 days after peak[97, 98, 32]. We obtain the Si II velocity evolution of SN 2018aoz by fitting the minimum of the 6355 Å feature with a skewed Gaussian profile for a series of spectra obtained between 11.0 and 30.7 days since -band maximum (Supplementary Figure 4, left panel). Supplementary Figure 4 (bottom-right panel) shows that the measured Si II velocity evolution of SN 2018aoz is consistent with the range of Si II velocities observed in normal Type Ia SNe 2011fe[33] and 2002dj[77].
We estimate the explosion epoch of SN 2018aoz by fitting its Si II velocity evolution with a power-law model of the form , where is the velocity and is time (days) since the explosion epoch. Such a model has been found to be a good fit to the pre-peak evolution in other Type Ia SNe[37]. We fit the of SN 2018aoz before -band maximum using the model, adopting = 0.22, the theoretically expected value for Type Ia SNe with polytropic (n=3) ejecta structure. Supplementary Figure 4 (bottom-right panel) shows that the model (magenta line) provides a good fit to the observed velocities with = 2.3. The best-fit using this model is 0.4 0.7 days prior to first light (or MJD 58205.6 0.7), consistent with what has been found in other events with in the range of 0.3 to 1.6 days[37]. The quality of the fit does not change significantly for slight variations of in the range of 0.20–0.24, resulting in in the range of 2–3 and variations of up to 0.7 days in the inferred . The weighted mean of using three values of = 0.20, 0.22, and 0.24 is 0.2 0.4 days prior to first light, which is smaller than 0.4 0.7 days obtained using the theoretically expected value of = 0.22. Overall, these results point to an explosion epoch for SN 2018aoz within 1 day of its epoch of first light.
3 Spectral Energy Distribution and Bolometric Light Curve.
We construct the spectral energy distribution (SED) of SN 2018aoz based on four data sets (Supplementary Figure 3): (1) high-cadence optical photometry from KMTNet, which provides simultaneous measurements in bands; (2) photometry in a few additional optical bands from LCO, which provides nearly simultaneous high-cadence measurements showing consistent evolution with KMTNet in the -, - and -bands (see Supplementary Figure 3); (3) UV photometry from Swift with nearly simultaneous measurements in , , , , and bands at low cadence; and (4) NIR photometry from ANDICAM, which provides asynchronous band measurements at low cadence. Note that is not included since its effective wavelength can be redder than that of for Type Ia SN spectra[99]. In order to construct the full SED of SN 2018aoz from these asynchronous light curves, we used a Gaussian process[100] with a stationary Matern-3/2 kernel to interpolate the light curve in each band.
We estimate the rate of radioactive energy production in SN 2018aoz by constructing the bolometric light curve as follows. Following the onset of Swift observations at 10.7 days before peak, we obtain a UVO (UV and optical) lower bound on the bolometric luminosity by integrating the photometric SED from Swift band (2246 Å) to band (7698 Å) using trapezoidal rule. Since the majority of the emission from Type Ia SNe falls within the UVOIR (UV, optical, and NIR) waveband during its photospheric phase[101], roughly from band to band, we complete the bolometric luminosity by extending the trapezoidal integral to the band (23763 Å) whenever ANDICAM photometry is available. Where ANDICAM coverage is lacking, we substitute NIR luminosity from the best-fit SNooPy template (Methods), extrapolating the template out to band. The difference between the UVO and UVOIR bolometric light curves caused by the NIR tail extrapolation accounts for 20% of the total bolometric luminosity. Supplementary Figure 5 presents the SED bolometric light curve of SN 2018aoz (black filled circles) alongside a bolometric light curve constructed by directly integrating the SNooPy template from 2246 Å to 23763 Å (black open circles), showing that the template bolometry represents the observed one reasonably well. Thus, we extend the bolometric light curve of the SN with the integrated SNooPy template until 15 days before (or 1.3 days since first light), where the valid range of the template begins[93].
4 Explosion Parameters.
We estimate the mass, ejecta mass, and ejecta kinetic energy of SN 2018aoz by comparing its bolometric light curve to the -powered SN light curve model by Arnett (1982)[102] which is based on the following four assumptions: (1) the SN ejecta is spherically symmetric, (2) the light curve is powered only by decay, (3) the distribution of is strongly peaked toward the center of the ejected mass, and (4) the opacity is constant. (Note that the opacity of Type Ia SNe in the photospheric phase is expected to be nearly constant[38]). In the model, the SN luminosity is mainly determined by two parameters: mass and the timescale related to the ejecta mass and kinetic energy by Equation 2[53]. We fit the model for two cases: one where the onset of the model, representing the beginning of the central -powered light curve, is equal to the epoch of first light (see Supplementary Section 2) and another where the onset is allowed to vary.
In the first case, the Arnett model is matched to the peak bolometric luminosity of SN 2018aoz ( ergs -1) and the rise time of the light curve from the epoch of first light to the bolometric peak (14.17 days in the rest frame), as shown in Supplementary Figure 5 (red dotted curve). The inferred ejecta parameters are mass and days. However, as seen in the figure, this model poorly matches the observed bolometric light curve, whose evolution near the peak is much faster, and fails to represent the rapid rise of the SN. In the second case, we fit the Arnett model to the bolometric light curve near peak (from 10 days to 10 days since peak), allowing the time of the onset of the model to be a fit parameter, , representing the onset of the central -powered light curve. The best-fit model, with inferred mass of , days, and days after first light in the rest frame, is shown in Supplementary Figure 5 (green dot-dashed curve). As seen in the figure, the model obtained in this method provides a much better comparison to the observed bolometric light curve near the peak ( 0.2), though it underpredicts luminosities during earlier epochs. The discrepancy can be explained by a shallower distribution, which provides additional emission at earlier times (see below).
We estimate the ejecta mass and kinetic energy of SN 2018aoz using the best-fit parameter ( days) and Equation 2, adopting the observed Si II photospheric velocity near peak as the characteristic ejecta velocity. Using the approximate -dominated opacity expected for Type Ia SNe during the photospheric phase ( cm2 g-1)[38], we obtain fiducial values of and ergs for the ejecta mass and kinetic energy, respectively. By extending the calculation to include a range of opacities between and cm2 g-1 that have been used in modelling the bolometric luminosity of Type Ia SNe[37, 102, 34], we estimate the ejecta mass and kinetic energy of SN 2018aoz to be in the ranges of 0.8–1.0 and (0.6–0.8) 1051 ergs, respectively. In a comparison of the and ejecta masses of SN 2018aoz with what has been found in other normal Type Ia SNe[103], the mass of is consistent with the expectations for normal Type Ia SNe with similar as SN 2018aoz, but the estimated ejecta mass range of 0.8–1.0 is located at the lower extreme of what has been found in other normal events ( 0.9–1.2 for = 0.8) and well below the Chandrasekhar mass (1.4 ). This shows that an ejecta mass of SN 2018aoz that is comparatively lower than other normal events can explain its relatively rapid pre-peak rise time (see Figure 1). However, we note that the exact values of explosion parameters from such bolometric luminosity modelling in general can be subject to additional systematic uncertainties from the model assumptions. For example, using radiative transfer simulations described in Supplementary Section 7.1 that account for stratification and time-varying opacity, we obtain a slightly higher ejecta mass of 1.05 for SN 2018aoz, though this method depends on the SN having an ejecta profile specific to the He-shell DDet explosion mechanism. Similarly, for asymmetric explosion mechanisms, different ejecta masses can be obtained depending on viewing angle, and the mass inferred using 1-dimensional models should be interpreted as the “effective” ejecta mass along the line of sight rather than the total mass of the SN ejecta in such cases.
5 Distribution of Heating in the Ejecta.
As discussed above, the Arnett model, while it provides useful measurements of the bulk properties of the ejecta, is inadequate in explaining the early bolometric light curves within 2–10 days post-explosion. This may be caused by a distribution which is not strongly peaked toward the center of the ejected mass, and we explore whether heating from a shallower distribution, extended to the progenitor surface, can account for the early luminosity. According to Piro and Nakar (2014)[37], who investigated the impact of distribution on the early light curve, radioactive heating from a logistically stratified distribution of centrally concentrated is adequate in explaining the rising light curves of other normal Type Ia SNe. In their model, the fraction, X56, of per mass of ejecta at depth in the progenitor, measured from the surface of the star, follows a logistic function:
| (3) |
where the depth coordinate () is in units of the diffusion time (), the time in days since explosion when the ejecta becomes optically thin; describes how fast the logistic distribution declines; and is the depth where the distribution is at half-maximum. The normalization of Eqn 3 is determined by the observed luminosity of the SN at the diffusion time. Note that this model is only applicable to the light curves of SNe during early phases before the peak[36] where it has been used to investigate the stratification of in shallow layers of the ejecta[37].
Adopting from bolometric luminosity modelling (see Supplementary Section 4 above) and assuming that the epoch of explosion is roughly equal to that of the first light, we fit the logistic model to the bolometric light curve during 2–10 days since first light. Note that the difference between the epochs of explosion and first light in SN 2018aoz is estimated to be 1 day and consistent with zero (see Supplementary Section 2). Additionally, adopting 1-day earlier explosion epochs in the model does not affect the quality of the fit significantly since the slight delay before first light is simply explained by a slightly deeper distribution (i.e., larger and/or ), as detailed below. Supplementary Figure 5 shows the best-fit model (blue dashed curve) with , , and days. As seen in the figure, the model provides an excellent match to the observed bolometric light curve of SN 2018aoz within the range of 2–10 days, confirming that radioactive heating from a logistic distribution of can indeed explain the observed luminosity in that period.
We fitted the infant-phase -band light curves of SN 2018aoz using the logistic model by adopting a blackbody SED for the modelled emission. In the model, the blackbody temperature of the SN emission (; also known as color temperature) is determined by , in which is the luminosity and is the optical depth at the “color depth” () where the SN radioactive emission is thermalized. For the time evolution of , we adopt the equation from Piro and Nakar (2013) describing the evolution of the photospheric radius[36], assuming the color depth is located close to the photosphere. Since the color depth is determined by the diffusion depth separating the adiabatically expanding inner ejecta from the outer layers that cool via photon diffusion, we assume is a fraction of the optical depth at the diffusion depth, . The ejecta velocity () is extrapolated from the power-law fit to the Si II velocity of the SN (Supplementary Figure 4, bottom-right panel). The -band light curves of SN 2018aoz during 0–10 days after first light, excluding the -band light curves 0.5 days, were fitted with the blackbody logistic model, obtaining the best-fit . The best-fit model (Figure 3, blue dotted curves) adequately explains the overall luminosity evolution of SN 2018aoz. However, as noted in section “Distribution of Fe-peak Elements in the Extreme Outer Ejecta,” the model underpredicts the observed light curves in all three bands during the infant phase (Figure 3, left panels), showing that a lower SN luminosity is expected during the phase if the emission comes from a logistic, or similarly smoothly stratified and monotonic, distribution of alone.
To investigate if additional radioactive heating from near the ejecta surface can explain this luminosity difference during the infant phase, we modify Equation 3 to include two new fit parameters separately representing the distribution near the surface: and for location and mass, respectively. In the modification, the mass fraction in depths shallower than a fixed position, or , is adopted to be constant such that the total integrated mass of in the shell described by is equal to . We fit the model to the -band light curve of SN 2018aoz during 0–1 days after first light, obtaining the best-fit with and , corresponding to a shell of in the outer 0.31% of the ejected mass. By varying the explosion epoch by up to 1 day before the epoch of first light, we find that the explosion epoch mainly affects , increasing it up to , while and both vary by 10%, and the inferred mass of excess responsible for the early excess emission varies by 17%. The red, green, and purple models in Figure 3 (right panels) were obtained by adopting , , and , respectively, while keeping the other best-fit parameters fixed. As seen in the figure, a shell of near the ejecta surface can indeed explain excess luminosity during the infant phase over the expectation from the best-fit logistic distribution, which represents the main distribution of radioactive elements in the SN ejecta.
6 Non-continuous Process for the -band Suppression.
As noted in section “Origin of the Infant-Phase -band Plateau and Red Color,” no blackbody can fit the SED of SN 2018aoz at 0.5 days since first light without a -band suppression. One conceivable origin of the blue flux suppression at these early phases is extinction by circumstellar dust near the progenitor star. However, as detailed below, this process is incompatible with what is observed in SN 2018aoz, which requires significantly non-continuous extinction to explain the -band suppression. For this, we examine if blackbody extinction can reproduce the infant-phase SED of SN 2018aoz. We compare in Supplementary Figure 6 (top-left) the observed SED (colored symbols) at two epochs in 0–0.5 days to those of a set of blackbodies only (4000–14000 K; colored solid curves) and blackbodies extinction (colored dashed curves). The 14000 K blackbody is consistent with the observed color at 0.5 days, while the 4000 K case is for the color. (Note that the latter is an unreasonably low blackbody temperature for early Type Ia SNe). We adopt = 3.1 based on Galactic interstellar extinction[85] and a range of in 0–1 mag using the same blackbodies from the blackbody-only models. As shown in the figure, cooling (14000 to 4000 K) blackbodies with = 3.1 extinction in the early phase 0.5 days could mimic the observed evolution of the color, with = 0.5 mag as an exemplary case, but they cannot accommodate the much bluer color with the overall goodness of the fit to the bands deteriorating for increased extinction.
We further investigate whether blackbody extinction with a smaller value of , which effectively increases the relative extinction in band[84], between 0.1 and 3.1 can fit the observed -band fluxes of SN 2018aoz at 0.5 days, the epoch with the lowest -band flux compared to the and bands. As explained below, we find that no reasonable blackbody extinction model can accommodate the observed SED even with smaller values, although smaller values do provide an improved fit, with = 0.2 being the best case. Supplementary Figure 6 (middle- and bottom-left panels) shows the relationship between , temperature (), and goodness of fit () from fitting the SED of SN 2018aoz at 0.5 days with blackbody extinction for three exemplary cases of = 0.2, 1.7, and 3.1. 1.7 fits worse than a blackbody alone for 0 mag regardless of temperature, while 1.7 fits better for increasing temperature and . = 0.2 provides the minimal for any temperature, though we note that the best-fit temperature itself is unreasonably large ( 107 K). In Supplementary Figure 6 (top-left panel), we compare the observed SED of SN 2018aoz at 0.5 days with blackbody extinction for = 0.2 and two expectable temperatures in Type Ia SNe: (1) = 10000 K, which can be typically expected in Type Ia SNe at 1 day post-explosion[40]; and (2) = 25000 K, an exceptionally high temperature that can only be expected in extreme cases, such as the ejecta colliding with a red giant companion[39]. Note that the latter case is incongruent with the absence of bright excess emission in the early light curve of SN 2018aoz during 1–5 days; consequently, = 25000 K can be considered as an upper limit of the blackbody temperature. Although the = 25000 K case fits better than the 10000 K case, even the extreme case fails to reproduce the observed SED with = 0.2 extinction, while other fit worse for the same . This shows that continuous extinction by dust cannot explain the -band suppression in SN 2018aoz.
We explore a potential non-continuous extinction process (e.g., line-blanket absorption) for the origin of the observed -band suppression in SN 2018aoz by modelling a blackbody SED with a spectroscopic break between the and bands. For this, we calculate the required suppression of blackbody emission bluewards of a spectrum break for a range of break positions between 4000 and 5100 Å that can match the observed -band flux of SN 2018aoz at 0.5 days. We adopt the blackbody temperature of 7000 K as a conservative lower limit for the temperature of Type Ia SNe at this early epoch[40, 37, 104] and normalize the blackbody to the average of the observed and band fluxes at 0.5 days in order to compare to the observations. The solid line in Supplementary Figure 6 (right panel) shows the required suppression as a function of spectrum break position from 4300 to 5100 Å for the 7000 K blackbody. As seen in the figure, for the spectrum break positions 4700 Å, nearly 100% flux suppression is required even for the 7000 K case, showing that smaller wavelengths are incompatible with the observed -band suppression since only blackbodies with lower temperatures can accommodate the observed suppression. For the spectrum break positions in the range of 4700–5100 Å, 70% flux suppression is required to reproduce the observed -band suppression for the 7000 K blackbody, with higher temperatures requiring more suppression as denoted by the non-hatched area above the solid curve. Note that 6000 K and 8000 K blackbodies, shown with dashed lines below and above the solid line, respectively, provide the result for 1000 K variations, with a difference of only 5% from the 7000 K case. It appears, therefore, that the observed -band suppression in SN 2018aoz can be explained by a non-continuous extinction process that can provide 70% reduction of -band flux relative to the and bands by a spectroscopic break position between and band (i.e., from 4700 to 5100 Å).
7 Spectroscopic Predictions for Surface Fe-Peak Elements.
Fe-peak elements produced in Type Ia SN nucleosynthesis are associated with a blanket of absorption lines bluewards of 5000 Å at early phases when they are still in the second and third ionization states. Recent radiative transfer modelling of Type Ia SN ejecta have predicted that the presence of nucleosynthetic elements near the ejecta surface leads to redward color evolution during the early phases due to Fe-peak line-blanket absorption within a few days post-explosion[10, 6]. Here, we examine a suite of models of Type Ia SN ejecta profiles with various distributions of Fe-peak elements near the surface, which include radiative transfer calculations, in order to determine if the Fe-peak line-blanketing effect can explain the observed -band suppression and redward color evolution in SN 2018aoz during its infant phase.
7.1 7.1 Spectroscopic Predictions for Surface Fe-Peak Elements: He-shell DDet Simulations.
First, we perform a grid of new He-shell DDet simulations with a range of core carbon-oxygen WD masses (1.00–1.10 ) and He-shell masses (0.010–0.012 ) following Polin et al. (2019)[6]. These simulations include a full treatment of hydrodynamics and nucleosynthesis using an isotope network in order to obtain the SN ejecta profile at each time step before conducting radiative transfer calculations of their spectro-photometric observables. Note that similar simulations have been adopted to explain the light curves and spectra of spectroscopically peculiar Type Ia SNe such as MUSSES1604D[11] and SN 2018byg[12]. Compared to these previous simulations, our simulations have smaller He-shell masses and predict observable properties that are more consistent with normal Type Ia SNe.
Supplementary Figure 7 (left panels) presents the results of our He-shell DDet simulations where the top-left and bottom-left panels show a comparison to the observed evolution of the color and the average flux density (in AB mag) of SN 2018aoz, respectively. We adopt the explosion epoch of SN 2018aoz from Si II velocity fitting, days prior to first light (see Supplementary Section 2), for each of the modelled light curves in the comparison. As seen in the figure, the 1.05 WD + 0.010 He-shell model (magenta curves) provides an excellent fit to both the early color evolution of SN 2018aoz and its overall luminosity evolution near peak. The top-right panel presents the best-fit model prediction for the initial distribution of Fe-peak and associated nucleosynthetic elements—including 40Ca, 44Ti, 48Cr, 52Fe, and 56Ni—in the SN ejecta, showing an over-density of them in the outer 1% of the ejected mass and a logistic-like distribution of peaked towards the ejecta center. The bottom-right panel compares the observed spectra of SN 2018aoz from 11.0, 1.9, 10.9 days after first light to those predicted by the best-fit model, showing that the modelled Fe II/III absorption feature from Fe-peak elements agrees well with the observations throughout the evolution of the SN.
As shown in Figure 4 (bottom panel), the predicted spectrum of the best-fit He-shell DDet model at 0.5 days after first light can explain the observed -band suppression of SN 2018aoz in the infant-phase. We note, however, that the model underpredicts both the observed -band color temperature at 0.5 days (see Figure 4, bottom panel) and -band luminosity during the infant phase (see Supplementary Figure 7, bottom-left inset), indicating that an additional source of heating is required to account for the missing emission. Future studies are required to investigate if a He-shell DDet model incorporating such a heat source can indeed fully reproduce the infant-phase light curves of SN 2018aoz. While some of our He-shell DDet models can produce additional infant-phase emission, both the brightness of this emission and the duration of the redward color evolution scale with the He-shell mass. In particular, the 1.05 WD + 0.0111 He-shell model (Supplementary Figure 7, brown curves) provides a good match to the observed luminosity of the SN over the infant phase, but even this small increase in He-shell mass delays the redward color evolution by 1.5 days, inconsistent with our observations from 2–4 days.
7.2 7.2 Spectroscopic Predictions for Surface Fe-Peak Elements: Monotonic distribution.
In the He-shell DDet models, the Fe-peak elements near the surface of the SN ejecta responsible for the infant-phase -band suppression form an independent shell (see Supplementary Figure 7, top-right panel), but these Fe-peak elements may instead be part of the tail of the monotonic and smoothly stratified distribution of that forms the central distribution of Fe-peak elements in the SN. To investigate if a smoothly stratified and monotonic distribution can also explain the infant-phase -band suppression and redward color evolution observed in SN 2018aoz, we examine the set of radiative transfer models of logistically-distributed in Type Ia SN ejecta from Magee and Maguire (2020)[43]. In these models, the ejecta mass fraction has the following form:
| (4) |
where is the mass coordinate from the ejecta surface, is the total mass, and describes how fast the logistic distribution declines. As above, we adopt the explosion epoch of SN 2018aoz from Si II velocity fitting, days prior to first light, for the modelled light curves.
The ejecta density profile for the logistic radiative transfer models from Magee and Maguire (2020)[43] follows either double-power-law or exponential form. In the models, the parameters , , and ejecta kinetic energy () also vary in the ranges of 3–100, 0.4–0.8 , and 0.5–2.2 ergs, respectively, while the ejecta mass is fixed to be 1.4 . We find that these logistic radiative transfer models provide a good fit to the early -band light curves of SN 2018aoz during 1–10 days since first light with , in the range of ergs, and and for double-power-law and exponential density profiles, respectively. The best-fit model has , ergs, and a double-power-law density profile. Since the fixed ejecta mass in the models is larger than what we found in SN 2018aoz (see above), the and values required to fit the observations are also larger. The best-fit model is shown as the black dashed curve in Figure 2, while the full range of predicted colors for in the range of ergs is shown as the grey shaded region. As noted in section “Distribution of Fe-peak Elements in the Extreme Outer Ejecta,” these models predict bluer and more continuous color evolution than the He-shell DDet simulation due to the smooth distribution of heating from logistically-distributed in the ejecta.
| Date (MJD) | Filter | mobs | 1- (detection) | 1- (total)11footnotemark: 1 | S/N | Facility |
|---|---|---|---|---|---|---|
| 58206.03779 | 21.573 | 0.312 | 0.439 | 3.5 | KMTNet | |
| 58206.03913 | 21.257 | 0.254 | 0.254 | 4.3 | KMTNet | |
| 58206.11241 | 21.692 | 0.195 | 0.272 | 5.6 | KMTNet | |
| 58206.11378 | 20.686 | 0.090 | 0.091 | 12.1 | KMTNet | |
| 58206.11528 | 21.224 | 0.200 | 0.202 | 5.4 | KMTNet | |
| 58206.17685 | 21.768 | 0.190 | 0.265 | 5.7 | KMTNet | |
| 58206.17834 | 20.613 | 0.072 | 0.072 | 15.1 | KMTNet | |
| 58206.17984 | 21.154 | 0.162 | 0.164 | 6.7 | KMTNet | |
| 58206.43054 | 19.905 | 0.095 | 0.095 | 11.5 | KMTNet | |
| 58206.43198 | 20.074 | 0.162 | 0.161 | 6.7 | KMTNet | |
| 58206.48679 | 21.510 | 0.239 | 0.332 | 4.5 | KMTNet | |
| 58206.48818 | 20.029 | 0.087 | 0.088 | 12.5 | KMTNet | |
| 58206.48953 | 20.307 | 0.154 | 0.155 | 7.0 | KMTNet | |
| 58206.49089 | 20.086 | 0.094 | 0.094 | 11.6 | KMTNet | |
| 58206.49238 | 20.246 | 0.135 | 0.136 | 8.0 | KMTNet | |
| 58206.54919 | 21.566 | 0.210 | 0.292 | 5.2 | KMTNet | |
| 58206.55053 | 19.922 | 0.068 | 0.069 | 15.9 | KMTNet | |
| 58206.55205 | 20.121 | 0.141 | 0.142 | 7.7 | KMTNet | |
| 58207.13608 | 18.117 | 0.191 | 0.195 | 5.7 | DLT40 | |
| 58208.04432 | 17.013 | 0.022 | 0.054 | 50.0 | KMTNet | |
| 58208.04573 | 16.529 | 0.019 | 0.025 | 55.8 | KMTNet | |
| 58208.04728 | 16.968 | 0.017 | 0.018 | 65.8 | KMTNet | |
| 58208.12303 | 16.882 | 0.016 | 0.048 | 68.5 | KMTNet | |
| 58208.12449 | 16.472 | 0.015 | 0.020 | 71.3 | KMTNet | |
| 58208.12602 | 16.911 | 0.015 | 0.016 | 71.7 | KMTNet | |
| 58208.13576 | 16.339 | 0.047 | 0.054 | 23.1 | DLT40 | |
| 58208.19667 | 16.798 | 0.014 | 0.047 | 75.0 | KMTNet | |
| 58208.19818 | 16.416 | 0.014 | 0.019 | 75.9 | KMTNet | |
| 58208.19971 | 16.842 | 0.012 | 0.013 | 88.4 | KMTNet | |
| 58208.45245 | 16.580 | 0.021 | 0.052 | 52.3 | KMTNet | |
| 58208.45389 | 16.129 | 0.021 | 0.027 | 52.1 | KMTNet | |
| 58208.45524 | 16.585 | 0.015 | 0.017 | 70.3 | KMTNet |
-
•
Note. The entirety of this table is available in machine readable form. Photometric data in each filter is calibrated according to Methods section “Photometric Calibration.”
-
• 11footnotemark: 1
Total 1- error includes detection S/N, photometric calibration error, and S-correction error.
| Date (UT) | Telescope | Instrument | R | Wavelength [] |
|---|---|---|---|---|
| 2018 April 2.39 | COJ 2m | FLOYDS | 400–700 | 3250–10000 |
| 2018 April 2.72 | COJ 2m | FLOYDS | 400–700 | 3300–10000 |
| 2018 April 5.67 | COJ 2m | FLOYDS | 400–700 | 3250–10000 |
| 2018 April 8.63 | COJ 2m | FLOYDS | 400–700 | 3250–10000 |
| 2018 April 11.55 | COJ 2m | FLOYDS | 400–700 | 3250–10000 |
| 2018 April 15.34 | MMT | Blue Channel | 3340 | 5700–7000 |
| 2018 April 15.52 | COJ 2m | FLOYDS | 400–700 | 3350–9300 |
| 2018 April 19.06 | du Pont | WFCCD | 800 | 3600–9200 |
| 2018 April 21.31 | du Pont | WFCCD | 800 | 3600–9200 |
| 2018 April 24.23 | MMT | Blue Channel | 3340 | 5700–7000 |
| 2018 April 24.35 | OGG 2m | FLOYDS | 400–700 | 3250–10000 |
| 2018 April 30.53 | COJ 2m | FLOYDS | 400–700 | 4800–10000 |
| 2018 May 4.57 | COJ 2m | FLOYDS | 400–700 | 3500–10000 |
| 2018 May 10.30 | OGG 2m | FLOYDS | 400–700 | 3500–10000 |
| 2018 May 13.08 | du Pont | WFCCD | 800 | 3600–9200 |
| 2018 May 14.25 | OGG 2m | FLOYDS | 400–700 | 3500–10000 |
| 2018 May 18.39 | COJ 2m | FLOYDS | 400–700 | 4800–10000 |
| 2018 May 23.46 | COJ 2m | FLOYDS | 400–700 | 4800–10000 |
| 2018 June 7.04 | du Pont | WFCCD | 800 | 3600–9200 |
| 2018 July 1.34 | COJ 2m | FLOYDS | 400–700 | 3500–10000 |
| 2018 July 6.96 | Gemini S | GMOS | 1690 | 5000–10000 |
| 2018 July 11.37 | COJ 2m | FLOYDS | 400–700 | 3500–10000 |
| 2018 June 14.01 | du Pont | WFCCD | 800 | 3600–9200 |
| 2018 July 20.39 | COJ 2m | FLOYDS | 400–700 | 3500–10000 |
| 2018 July 22.35 | COJ 2m | FLOYDS | 400–700 | 3500–10000 |
| 2018 July 24.35 | COJ 2m | FLOYDS | 400–700 | 3500–10000 |
| 2018 August 12.99 | du Pont | WFCCD | 800 | 3600–9200 |
-
•
Note. The COJ 2m and OGG 2m are the Las Cumbres 2m Telescopes at Siding Spring Observatory and Haleakala Observatory, respectively.
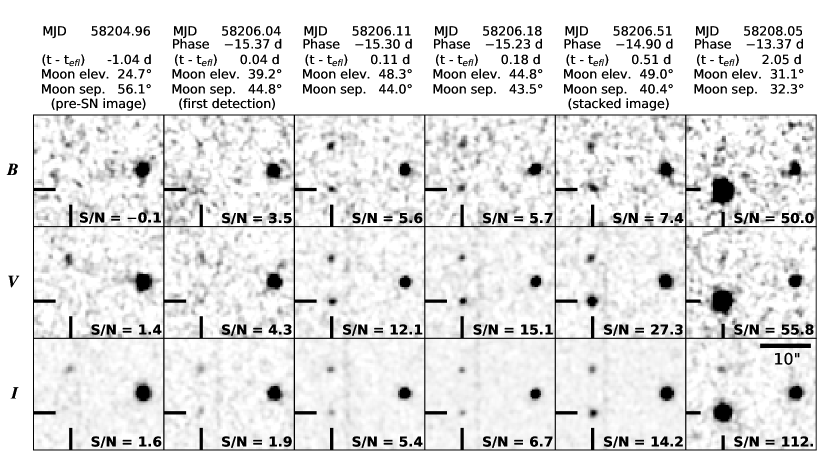
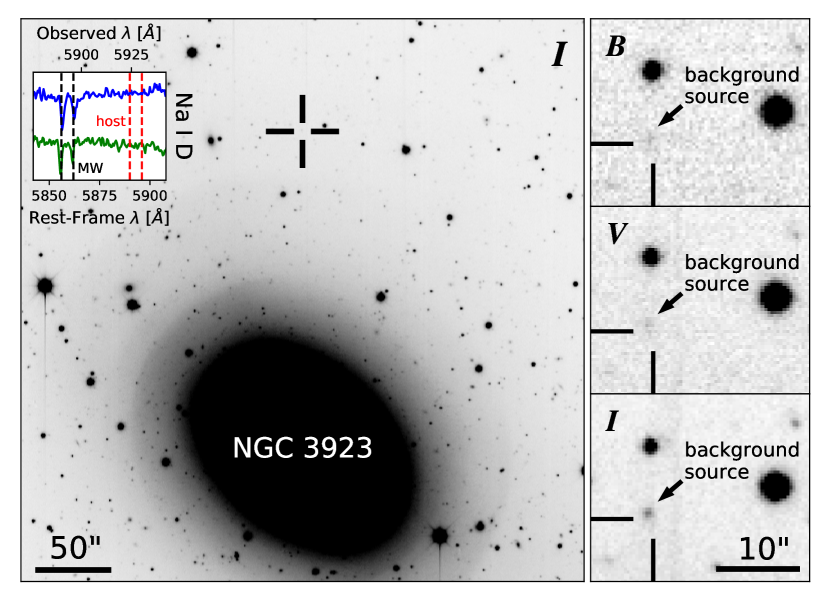
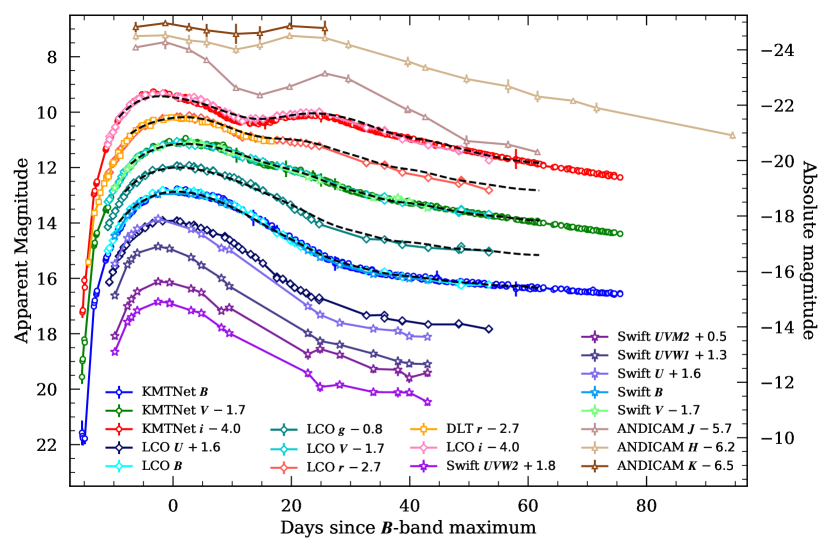
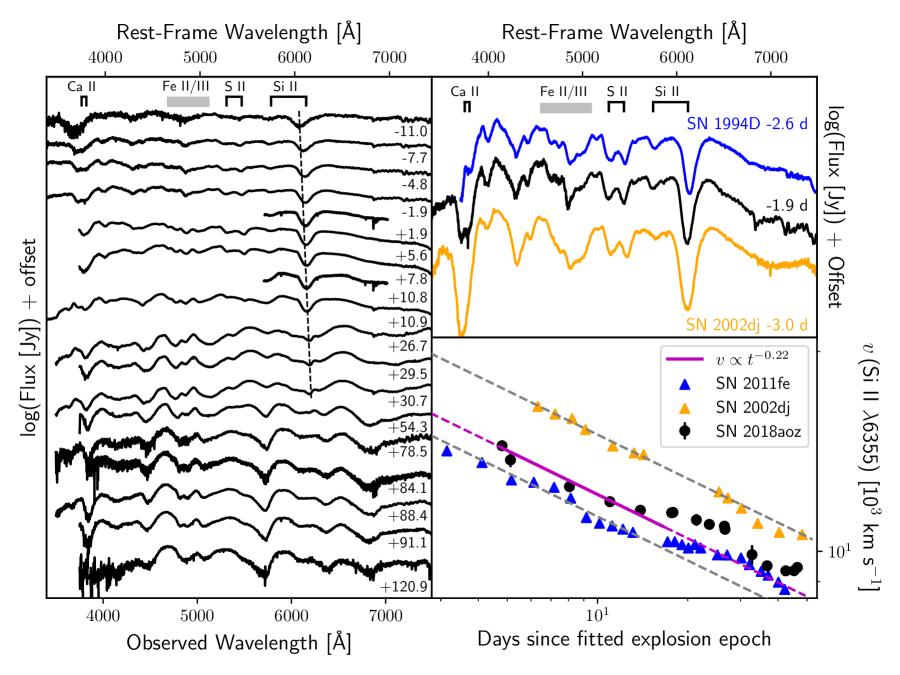
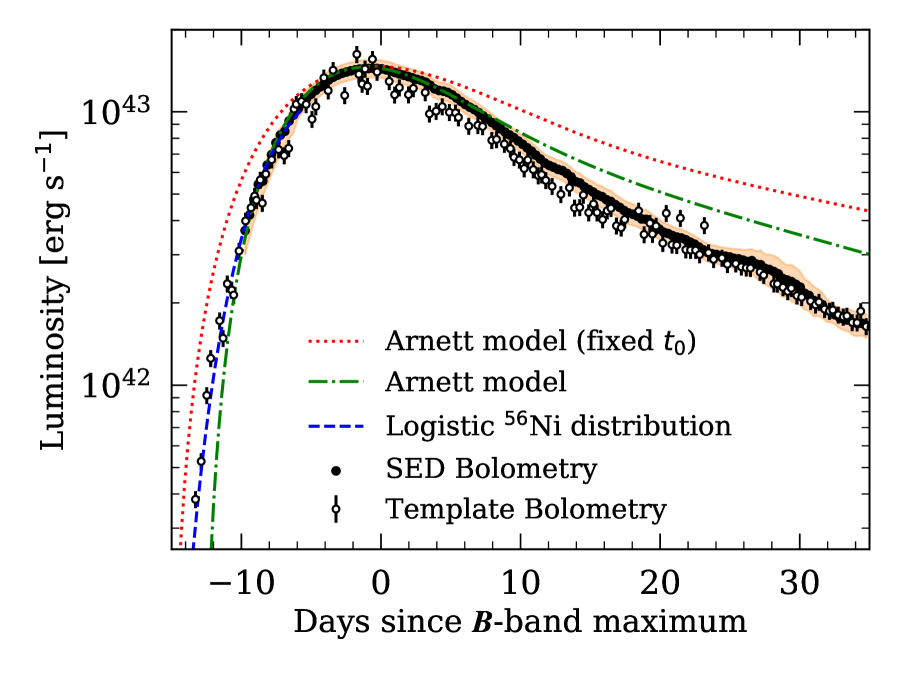
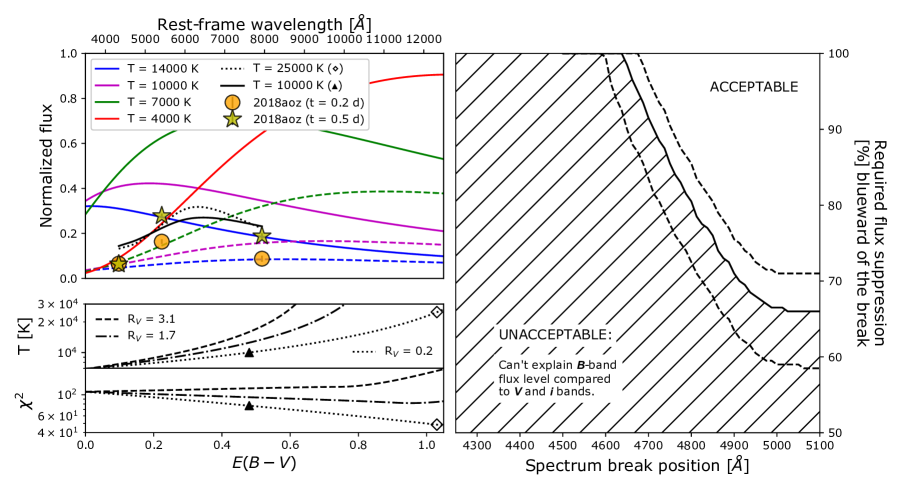
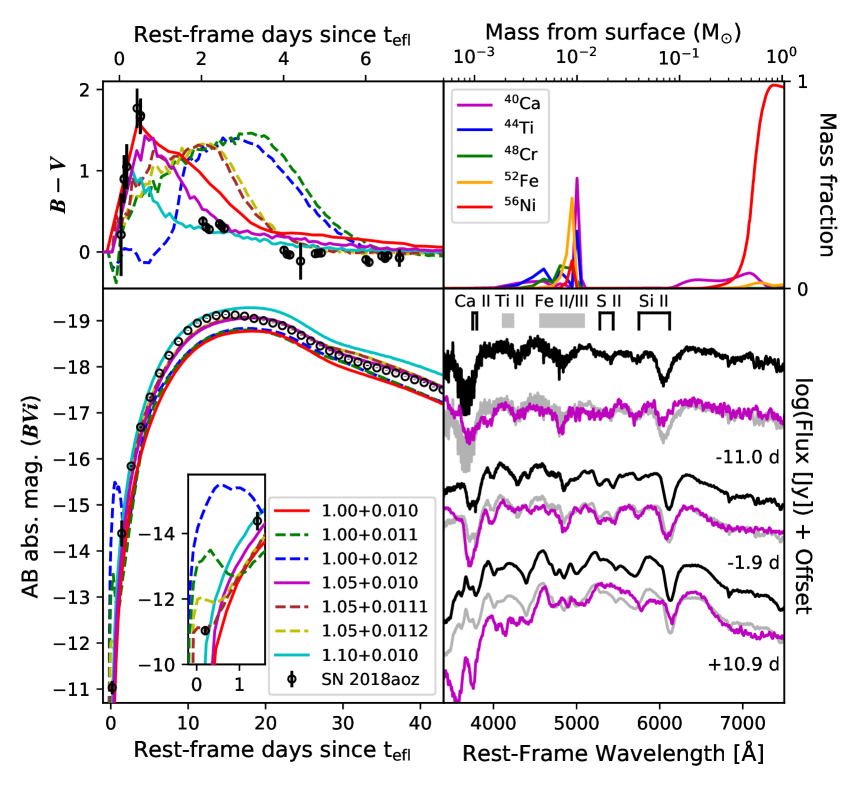
- 1. Matteucci, F. Chemical Evolution of Galaxies (2012).
- 2. Riess, A. G. et al. Observational Evidence from Supernovae for an Accelerating Universe and a Cosmological Constant. Astron. J. 116, 1009–1038 (1998). astro-ph/9805201.
- 3. Perlmutter, S. et al. Measurements of and from 42 High-Redshift Supernovae. Astrophys. J. 517, 565–586 (1999). astro-ph/9812133.
- 4. Maoz, D., Mannucci, F. & Nelemans, G. Observational Clues to the Progenitors of Type Ia Supernovae. Ann. Rev. Astron. Astrophys. 52, 107–170 (2014). 1312.0628.
- 5. Blondin, S. et al. The Spectroscopic Diversity of Type Ia Supernovae. Astron. J. 143, 126 (2012). 1203.4832.
- 6. Polin, A., Nugent, P. & Kasen, D. Observational Predictions for Sub-Chandrasekhar Mass Explosions: Further Evidence for Multiple Progenitor Systems for Type Ia Supernovae. Astrophys. J. 873, 84 (2019). 1811.07127.
- 7. Townsley, D. M., Miles, B. J., Shen, K. J. & Kasen, D. Double Detonations with Thin, Modestly Enriched Helium Layers can Make Normal Type Ia Supernovae 878, L38 (2019). 1903.10960.
- 8. Shen, K. J. et al. Non-local Thermodynamic Equilibrium Radiative Transfer Simulations of Sub-Chandrasekhar-mass White Dwarf Detonations 909, L18 (2021). 2102.08238.
- 9. Reinecke, M., Hillebrandt, W. & Niemeyer, J. C. Three-dimensional simulations of type Ia supernovae. Astron. & Astrophys. 391, 1167–1172 (2002). astro-ph/0206459.
- 10. Maeda, K., Jiang, J.-a., Shigeyama, T. & Doi, M. Type Ia Supernovae in the First Few Days: Signatures of Helium Detonation versus Interaction. Astrophys. J. 861, 78 (2018). 1805.12325.
- 11. Jiang, J.-A. et al. A hybrid type Ia supernova with an early flash triggered by helium-shell detonation. Nature 550, 80–83 (2017). 1710.01824.
- 12. De, K. et al. ZTF 18aaqeasu (SN2018byg): A Massive Helium-shell Double Detonation on a Sub-Chandrasekhar-mass White Dwarf 873, L18 (2019). 1901.00874.
- 13. Bulla, M. et al. ZTF Early Observations of Type Ia Supernovae. III. Early-time Colors As a Test for Explosion Models and Multiple Populations. Astrophys. J. 902, 48 (2020). 2001.00587.
- 14. Marion, G. H. et al. SN 2012cg: Evidence for Interaction Between a Normal Type Ia Supernova and a Non-degenerate Binary Companion. Astrophys. J. 820, 92 (2016). 1507.07261.
- 15. Hosseinzadeh, G. et al. Early Blue Excess from the Type Ia Supernova 2017cbv and Implications for Its Progenitor. Astrophys. J. 845, L11 (2017). 1706.08990.
- 16. Shappee, B. J. et al. Strong Evidence against a Non-degenerate Companion in SN 2012cg. Astrophys. J. 855, 6 (2018). 1610.07601.
- 17. Dimitriadis, G. et al. K2 Observations of SN 2018oh Reveal a Two-component Rising Light Curve for a Type Ia Supernova 870, L1 (2019). 1811.10061.
- 18. Jiang, J.-a., Doi, M., Maeda, K. & Shigeyama, T. Surface Radioactivity or Interactions? Multiple Origins of Early-excess Type Ia Supernovae and Associated Subclasses. Astrophys. J. 865, 149 (2018). 1808.06343.
- 19. Stritzinger, M. D. et al. Red versus Blue: Early Observations of Thermonuclear Supernovae Reveal Two Distinct Populations? Astrophys. J. 864, L35 (2018). 1807.07576.
- 20. Sand, D. J. et al. Nebular Spectroscopy of the “Blue Bump” Type Ia Supernova 2017cbv. Astrophys. J. 863, 24 (2018). 1804.03666.
- 21. Nugent, P. E. et al. Supernova SN 2011fe from an exploding carbon-oxygen white dwarf star. Nature 480, 344–347 (2011). 1110.6201.
- 22. Foley, R. J. et al. Very Early Ultraviolet and Optical Observations of the Type Ia Supernova 2009ig. Astrophys. J. 744, 38 (2012). 1109.0987.
- 23. Olling, R. P. et al. No signature of ejecta interaction with a stellar companion in three type Ia supernovae. Nature 521, 332–335 (2015).
- 24. Cartier, R. et al. Early observations of the nearby Type Ia supernova SN 2015F 464, 4476–4494 (2017). 1609.04465.
- 25. Holmbo, S. et al. Discovery and progenitor constraints on the Type Ia supernova 2013gy. Astron. & Astrophys. 627, A174 (2019). 1809.01359.
- 26. Miller, A. A. et al. ZTF Early Observations of Type Ia Supernovae. II. First Light, the Initial Rise, and Time to Reach Maximum Brightness. Astrophys. J. 902, 47 (2020). 2001.00598.
- 27. Moon, D.-S. et al. Supernova and optical transient observations using the three wide-field telescope array of the KMTNet. In Ground-based and Airborne Telescopes VI, vol. 9906 of Society of Photo-Optical Instrumentation Engineers (SPIE) Conference Series, 99064I (2016).
- 28. Kim, S.-L. et al. KMTNET: A Network of 1.6 m Wide-Field Optical Telescopes Installed at Three Southern Observatories 49, 37–44 (2016).
- 29. Norris, M. A. & Kannappan, S. J. The ubiquity and dual nature of ultra-compact dwarfs 414, 739–758 (2011). 1102.0001.
- 30. Tartaglia, L. et al. The Early Detection and Follow-up of the Highly Obscured Type II Supernova 2016ija/DLT16am. Astrophys. J. 853, 62 (2018). 1711.03940.
- 31. Brown, T. M. et al. Las Cumbres Observatory Global Telescope Network 125, 1031 (2013). 1305.2437.
- 32. Parrent, J., Friesen, B. & Parthasarathy, M. A review of type Ia supernova spectra. Astrophys. Space Sci. 351, 1–52 (2014). 1402.6337.
- 33. Pereira, R. et al. Spectrophotometric time series of SN 2011fe from the Nearby Supernova Factory. Astron. & Astrophys. 554, A27 (2013). 1302.1292.
- 34. Li, W. et al. Photometric and Spectroscopic Properties of Type Ia Supernova 2018oh with Early Excess Emission from the Kepler 2 Observations. Astrophys. J. 870, 12 (2019). 1811.10056.
- 35. Goobar, A. et al. Constraints on the Origin of the First Light from SN 2014J. Astrophys. J. 799, 106 (2015). 1410.1363.
- 36. Piro, A. L. & Nakar, E. What can we Learn from the Rising Light Curves of Radioactively Powered Supernovae? Astrophys. J. 769, 67 (2013). 1210.3032.
- 37. Piro, A. L. & Nakar, E. Constraints on Shallow 56Ni from the Early Light Curves of Type Ia Supernovae. Astrophys. J. 784, 85 (2014). 1211.6438.
- 38. Pinto, P. A. & Eastman, R. G. The Physics of Type IA Supernova Light Curves. II. Opacity and Diffusion. Astrophys. J. 530, 757–776 (2000).
- 39. Kasen, D. Seeing the Collision of a Supernova with Its Companion Star. Astrophys. J. 708, 1025–1031 (2010). 0909.0275.
- 40. Piro, A. L., Chang, P. & Weinberg, N. N. Shock Breakout from Type Ia Supernova. Astrophys. J. 708, 598–604 (2010). 0909.2643.
- 41. Mihalas, D. Statistical-Equilibrium Model Atmospheres for Early-Type Stars. I. Hydrogen Continua. Astrophys. J. 149, 169 (1967).
- 42. Mihalas, D. & Stone, M. E. Statistical Equilibrium Model Atmospheres for Early-Type Stars. III. Hydrogen and Helium Continua. Astrophys. J. 151, 293 (1968).
- 43. Magee, M. R. et al. Determining the 56Ni distribution of type Ia supernovae from observations within days of explosion. Astron. & Astrophys. 634, A37 (2020). 1912.07603.
- 44. Nomoto, K. & Leung, S.-C. Thermonuclear Explosions of Chandrasekhar Mass White Dwarfs. In Alsabti, A. W. & Murdin, P. (eds.) Handbook of Supernovae, 1275 (2017).
- 45. Maeda, K. et al. Nucleosynthesis in Two-Dimensional Delayed Detonation Models of Type Ia Supernova Explosions. Astrophys. J. 712, 624–638 (2010). 1002.2153.
- 46. Seitenzahl, I. R. et al. Three-dimensional delayed-detonation models with nucleosynthesis for Type Ia supernovae 429, 1156–1172 (2013). 1211.3015.
- 47. Seitenzahl, I. R. et al. Three-dimensional simulations of gravitationally confined detonations compared to observations of SN 1991T. Astron. & Astrophys. 592, A57 (2016). 1606.00089.
- 48. Shen, K. J. & Moore, K. The Initiation and Propagation of Helium Detonations in White Dwarf Envelopes. Astrophys. J. 797, 46 (2014). 1409.3568.
- 49. Kasen, D. Secondary Maximum in the Near-Infrared Light Curves of Type Ia Supernovae. Astrophys. J. 649, 939–953 (2006). astro-ph/0606449.
- 50. Han, X. et al. SN 2017cfd: A Normal Type Ia Supernova Discovered Very Young. Astrophys. J. 892, 142 (2020). 1911.07734.
- 51. Maguire, K. et al. Exploring the spectral diversity of low-redshift Type Ia supernovae using the Palomar Transient Factory 444, 3258–3274 (2014). 1408.1430.
- 52. Afsariardchi, N. et al. KSP-SN-2016kf: A Long-rising H-rich Type II Supernova with Unusually High 56Ni Mass Discovered in the KMTNet Supernova Program. Astrophys. J. 881, 22 (2019). 1906.09271.
- 53. Moon, D.-S. et al. Rapidly Declining Hostless Type Ia Supernova KSP-OT-201509b from the KMTNet Supernova Program: Transitional Nature and Constraint on 56Ni Distribution and Progenitor Type. Astrophys. J. 910, 151 (2021). 2103.16663.
- 54. Reichart, D. et al. PROMPT: Panchromatic Robotic Optical Monitoring and Polarimetry Telescopes. Nuovo Cimento C Geophys. Space Phys. C 28, 767 (2005). astro-ph/0502429.
- 55. Valenti, S., Sand, D. J. & Wyatt, S. DLT40 Transient Discovery Report for 2018-04-02. Transient Name Server Discovery Report 2018-428, 1 (2018).
- 56. Brown, P. & Sand, D. Swift UVOT Observations show SN Ia 2018aoz/DLT18q is UV-bright. The Astronomer’s Telegram 11511, 1 (2018).
- 57. Gehrels, N. et al. The Swift Gamma-Ray Burst Mission. Astrophys. J. 611, 1005–1020 (2004). astro-ph/0405233.
- 58. Roming, P. W. A. et al. The Swift Ultra-Violet/Optical Telescope. Space Sci. Rev. 120, 95–142 (2005). astro-ph/0507413.
- 59. DePoy, D. L. et al. A Novel Double Imaging Camera (ANDICAM). In Iye, M. & Moorwood, A. F. M. (eds.) Instrument Design and Performance for Optical/Infrared Ground-based Telescopes, vol. 4841 of Society of Photo-Optical Instrumentation Engineers (SPIE) Conference Series, 827–838 (2003).
- 60. Moffat, A. F. J. A Theoretical Investigation of Focal Stellar Images in the Photographic Emulsion and Application to Photographic Photometry. Astron. & Astrophys. 3, 455 (1969).
- 61. Trujillo, I., Aguerri, J. A. L., Cepa, J. & Gutiérrez, C. M. The effects of seeing on Sérsic profiles - II. The Moffat PSF 328, 977–985 (2001). astro-ph/0109067.
- 62. Henden, A. A. et al. APASS Data Release 10. vol. 232 of American Astronomical Society Meeting Abstracts, 223.06 (2018).
- 63. Park, H. S. et al. Dwarf Galaxy Discoveries from the KMTNet Supernova Program. I. The NGC 2784 Galaxy Group. Astrophys. J. 848, 19 (2017). 1708.07326.
- 64. Stritzinger, M. et al. Optical Photometry of the Type Ia Supernova 1999ee and the Type Ib/c Supernova 1999ex in IC 5179. Astron. J. 124, 2100–2117 (2002). astro-ph/0206438.
- 65. Valenti, S. et al. The diversity of Type II supernova versus the similarity in their progenitors 459, 3939–3962 (2016). 1603.08953.
- 66. Brown, P. J., Breeveld, A. A., Holland, S., Kuin, P. & Pritchard, T. SOUSA: the Swift Optical/Ultraviolet Supernova Archive. Astrophys. Space Sci. 354, 89–96 (2014). 1407.3808.
- 67. Breeveld, A. A. et al. An Updated Ultraviolet Calibration for the Swift/UVOT. In McEnery, J. E., Racusin, J. L. & Gehrels, N. (eds.) American Institute of Physics Conference Series, vol. 1358 of American Institute of Physics Conference Series, 373–376 (2011). 1102.4717.
- 68. Breeveld, A. A. Swift-uvot-caldb-15-06: Uvot sensitivity loss (2020).
- 69. Skrutskie, M. F. et al. The Two Micron All Sky Survey (2MASS). Astron. J. 131, 1163–1183 (2006).
- 70. Guillochon, J., Parrent, J., Kelley, L. Z. & Margutti, R. An Open Catalog for Supernova Data. Astrophys. J. 835, 64 (2017). 1605.01054.
- 71. Jeong, W.-S. et al. Optical Survey with KMTNet for Dusty Star-Forming Galaxies in the Akari Deep Field South 49, 225–232 (2016).
- 72. Hook, I. M. et al. The Gemini-North Multi-Object Spectrograph: Performance in Imaging, Long-Slit, and Multi-Object Spectroscopic Modes 116, 425–440 (2004).
- 73. Schmidt, G. D., Weymann, R. J. & Foltz, C. B. A Moderate-Resolution, High-Throughput CCD Channel for the MMT Spectrograph 101, 713 (1989).
- 74. Matheson, T. et al. Optical Spectroscopy of Type Ia Supernovae. Astron. J. 135, 1598–1615 (2008). 0803.1705.
- 75. Yaron, O. & Gal-Yam, A. WISeREP—An Interactive Supernova Data Repository 124, 668 (2012). 1204.1891.
- 76. Meikle, W. P. S. et al. An early-time infrared and optical study of the Type IA supernovae SN 1994D and 1991T 281, 263–280 (1996).
- 77. Pignata, G. et al. Optical and infrared observations of SN 2002dj: some possible common properties of fast-expanding Type Ia supernovae 388, 971–990 (2008). 0805.1089.
- 78. Blondin, S. & Tonry, J. L. Determining the Type, Redshift, and Age of a Supernova Spectrum. Astrophys. J. 666, 1024–1047 (2007). 0709.4488.
- 79. Steer, I. et al. Redshift-independent Distances in the NASA/IPAC Extragalactic Database: Methodology, Content, and Use of NED-D. Astron. J. 153, 37 (2017). 1612.09263.
- 80. Riess, A. G. et al. A 2.4% Determination of the Local Value of the Hubble Constant. Astrophys. J. 826, 56 (2016). 1604.01424.
- 81. Mould, J. R. et al. The Hubble Space Telescope Key Project on the Extragalactic Distance Scale. XXVIII. Combining the Constraints on the Hubble Constant. Astrophys. J. 529, 786–794 (2000). astro-ph/9909260.
- 82. Tully, R. B. et al. Cosmicflows-2: The Data. Astron. J. 146, 86 (2013). 1307.7213.
- 83. Schlafly, E. F. & Finkbeiner, D. P. Measuring Reddening with Sloan Digital Sky Survey Stellar Spectra and Recalibrating SFD. Astrophys. J. 737, 103 (2011). 1012.4804.
- 84. Fitzpatrick, E. L. Correcting for the Effects of Interstellar Extinction 111, 63–75 (1999). astro-ph/9809387.
- 85. Fitzpatrick, E. L. & Massa, D. An Analysis of the Shapes of Interstellar Extinction Curves. V. The IR-through-UV Curve Morphology. Astrophys. J. 663, 320–341 (2007). 0705.0154.
- 86. Poznanski, D., Prochaska, J. X. & Bloom, J. S. An empirical relation between sodium absorption and dust extinction 426, 1465–1474 (2012). 1206.6107.
- 87. Misgeld, I. & Hilker, M. Families of dynamically hot stellar systems over 10 orders of magnitude in mass 414, 3699–3710 (2011). 1103.1628.
- 88. Gavazzi, G., Fumagalli, M., Cucciati, O. & Boselli, A. A snapshot on galaxy evolution occurring in the Great Wall: the role of Nurture at z = 0. Astron. & Astrophys. 517, A73 (2010). 1003.3795.
- 89. Harris, W. E., Allwright, J. W. B., Pritchet, C. J. & van den Bergh, S. The Luminosity Distribution of Globular Clusters in Three Giant Virgo Ellipticals. Astrophys. J. Suppl. 76, 115 (1991).
- 90. Phillips, M. M. et al. The Reddening-Free Decline Rate Versus Luminosity Relationship for Type Ia Supernovae. Astron. J. 118, 1766–1776 (1999). astro-ph/9907052.
- 91. Burns, C. R. et al. The Carnegie Supernova Project: Intrinsic Colors of Type Ia Supernovae. Astrophys. J. 789, 32 (2014). 1405.3934.
- 92. Burns, C. R. et al. The Carnegie Supernova Project: Light-curve Fitting with SNooPy. Astron. J. 141, 19 (2011). 1010.4040.
- 93. Hsiao, E. Y. et al. K-Corrections and Spectral Templates of Type Ia Supernovae. Astrophys. J. 663, 1187–1200 (2007). astro-ph/0703529.
- 94. Almgren, A. S. et al. CASTRO: A New Compressible Astrophysical Solver. I. Hydrodynamics and Self-gravity. Astrophys. J. 715, 1221–1238 (2010). 1005.0114.
- 95. Zingale, M. et al. Meeting the Challenges of Modeling Astrophysical Thermonuclear Explosions: Castro, Maestro, and the AMReX Astrophysics Suite. In Journal of Physics Conference Series, vol. 1031 of Journal of Physics Conference Series, 012024 (2018). 1711.06203.
- 96. Kasen, D., Thomas, R. C. & Nugent, P. Time-dependent Monte Carlo Radiative Transfer Calculations for Three-dimensional Supernova Spectra, Light Curves, and Polarization. Astrophys. J. 651, 366–380 (2006). astro-ph/0606111.
- 97. Tanaka, M. et al. The Outermost Ejecta of Type Ia Supernovae. Astrophys. J. 677, 448–460 (2008). 0712.2823.
- 98. Wang, X. et al. Improved Distances to Type Ia Supernovae with Two Spectroscopic Subclasses 699, L139–L143 (2009). 0906.1616.
- 99. Brown, P. J., Breeveld, A., Roming, P. W. A. & Siegel, M. Interpreting Flux from Broadband Photometry. Astron. J. 152, 102 (2016). 1608.02599.
- 100. Ambikasaran, S., Foreman-Mackey, D., Greengard, L., Hogg, D. W. & O’Neil, M. Fast direct methods for gaussian processes (2014). 1403.6015.
- 101. Contardo, G., Leibundgut, B. & Vacca, W. D. Epochs of maximum light and bolometric light curves of type Ia supernovae. Astron. & Astrophys. 359, 876–886 (2000). astro-ph/0005507.
- 102. Arnett, W. D. Type I supernovae. I - Analytic solutions for the early part of the light curve. Astrophys. J. 253, 785–797 (1982).
- 103. Scalzo, R. A. et al. Probing type Ia supernova properties using bolometric light curves from the Carnegie Supernova Project and the CfA Supernova Group 483, 628–647 (2019). 1811.08969.
- 104. Zheng, W. & Filippenko, A. V. An Empirical Fitting Method for Type Ia Supernova Light Curves: A Case Study of SN 2011fe 838, L4 (2017). 1612.02097.