Current address: ]Department of Physics, University of Maryland, College Park, Maryland 20742, USA
Effects of the order parameter anisotropy on the vortex lattice in UPt3
Abstract
We have used small-angle neutron scattering to determine the vortex lattice phase diagram in the topological superconductor UPt3 for the applied magnetic field along the crystalline -axis. A triangular vortex lattice is observed throughout the superconducting state, but with an orientation relative to the hexagonal basal plane that changes with field and temperature. At low temperature, in the chiral B phase, the vortex lattice undergoes a non-monotonic rotation with increasing magnetic field. The rotation amplitude decreases with increasing temperature and vanishes before reaching the A phase. Within the A phase an abrupt vortex lattice rotation was previously reported by Huxley et al., Nature 406, 160-164 (2000). The complex phase diagram may be understood from competing effects of the superconducting order parameter, the symmetry breaking field, and the Fermi surface anisotropy. The low-temperature rotated phase, centered around 0.8 T, reported by Avers et al., Nature Physics 16, 531-535 (2020), can be attributed directly to the symmetry breaking field.
I Introduction
With three distinct superconducting phases UPt3 has attracted significant attention Joynt and Taillefer (2002), but despite decades of experimental and theoretical studies the unconventional superconductivity in this material is still not fully understood. Figure 2(b) shows the UPt3 phase diagram, indicting the extent of the superconducting A, B and C phases. The presence of two distinct zero-field superconducting transitions suggests that the order parameter belongs to one of the two-dimensional representations of the D6h point group Hess et al. (1989). Here, -wave pairing states with the irreducible representation are the most likely Sauls (1994). In such a scenario the B phase breaks time reversal and mirror symmetries while the A and C phases are time-reversal symmetric. Experimental support comes from the - phase diagram Adenwalla et al. (1990); Sauls (1994); Shivaram et al. (1986); Choi and Sauls (1991), and thermodynamic and transport studies Taillefer et al. (1997); Graf et al. (2000). Broken time-reversal symmetry in the B phase is supported by phase-sensitive Josephson tunneling Strand et al. (2009), the observation of polar Kerr rotation Schemm et al. (2014), and a field history-dependent vortex lattice (VL) configuration Avers et al. (2020). Finally, the linear temperature dependence of the London penetration depth is consistent with a quadratic dispersion of the energy gap at the polar nodes structure, which is a characteristic of the model Signore et al. (1995); Schöttl et al. (1999); Gannon et al. (2015).
A key component in the understanding of superconductivity in UPt3 is the presence of a symmetry breaking field (SBF) that couples to the superconducting order parameter Hayden et al. (1992). The SBF lifts the degeneracy of the multi-dimensional representation, splitting the zero-field transition and leading to the multiple superconducting phases Sauls (1994). However, the origin of the SBF is an outstanding issue, with possible candidates that include a quasi-static antiferromagnetic state that develops at 5 K above the superconducting transition Aeppli et al. (1988a, b); Hayden et al. (1992), a distortion of the hexagonal crystal structure Walko et al. (2001), or prismatic plane stacking faults Hong (1999); Gannon et al. (2012).
Vortices provide a highly sensitive probe of the host superconductor. This includes anisotropies in the screening current plane perpendicular to the applied magnetic field which affect the VL symmetry and orientation. Such anisotropies may arise from the Fermi surface Kogan (1981); Kogan et al. (1997), and nodes in or distortions of the superconducting gap Huxley et al. (2000); Avers et al. (2020). As an example one can consider the “simple” superconductor niobium that displays a rich VL phase diagram when the applied field is along the [100] crystalline direction and the Fermi surface anisotropy is incommensurate with an equilateral triangular VL Laver et al. (2006, 2009); Mühlbauer et al. (2009). Even in materials with a hexagonal crystal structure VL rotations may occur due to competing anisotropies, as observed in MgB2 when the applied field is perpendicular to the basal plane Cubitt et al. (2003); Das et al. (2012).
We have used small-angle neutron scattering (SANS) to determine the VL phase diagram in UPt3. This extends our previous studies at low temperature, where the VL was found to undergo a field-driven, non-monotonic rotation transition Avers et al. (2020). We discuss how the VL phase diagram and the existence of the VL rotation transition can be directly attributed to the SBF.
II Experimental Details
Small-angle neutron scattering studies of the VL are possible due to the periodic field modulation from the vortices Mühlbauer et al. (2019). The scattered intensity depends strongly on the superconducting penetration depth, and for UPt3 with a large in-plane nm Gannon et al. (2015) necessitates a large sample volume. For this work we used a high-quality single crystal (ZR11), combined with previously published results obtained on a separate sample (ZR8) Avers et al. (2020). Properties of both single crystals are listed in table 1,
| Sample | mass (g) | RRR | (mK) | (mK) |
|---|---|---|---|---|
| ZR8 | 15 | 10 | ||
| ZR11 | 9 | 5 |
determined from resistive measurements performed on smaller samples cut from the main crystals. Here, RRR is the residual resistivity ratio, is the superconducting transition temperature and is the width of the transition.
For the SANS measurements each long, rod-like crystal was cut into two pieces, co-aligned and fixed with silver epoxy (EPOTEK E4110) to a copper cold finger. The sample assembly was mounted onto the mixing chamber of a dilution refrigerator and placed inside a superconducting magnet, oriented with the crystalline a axis vertical and the c axis horizontally along the magnetic field and the neutron beam. The neutron beam was masked off to illuminate a mm2 area.
The SANS experiment was performed at the GP-SANS beam line at the High Flux Isotope Reactor at Oak Ridge National Laboratory Heller et al. (2018). All measurements were carried out in a “rocked on” configuration, satisfying the Bragg condition for VL peaks at the top of the two-dimensional position sensitive detector, as seen in Fig. 1. Background measurements, obtained either in zero field or above , were subtracted from both the field reduction and field reversal data.
Measurements were performed at temperatures between 100 mK and 300 mK and fields between 0.4 T and 1.2 T. Prior to the SANS measurements the field was reduced from above the B-C phase transition at base temperature. The sample was then heated to the measurement temperature and a damped field oscillation with an initial amplitude of 20 mT was applied to obtain a well ordered VL with a homogeneous vortex density Avers et al. (2020). Furthermore, a 5 mT field oscillation was applied approximately every 60 seconds during the SANS measurements, in order to counteract VL disordering due to neutron induced fission of 235U Avers et al. .
III Results
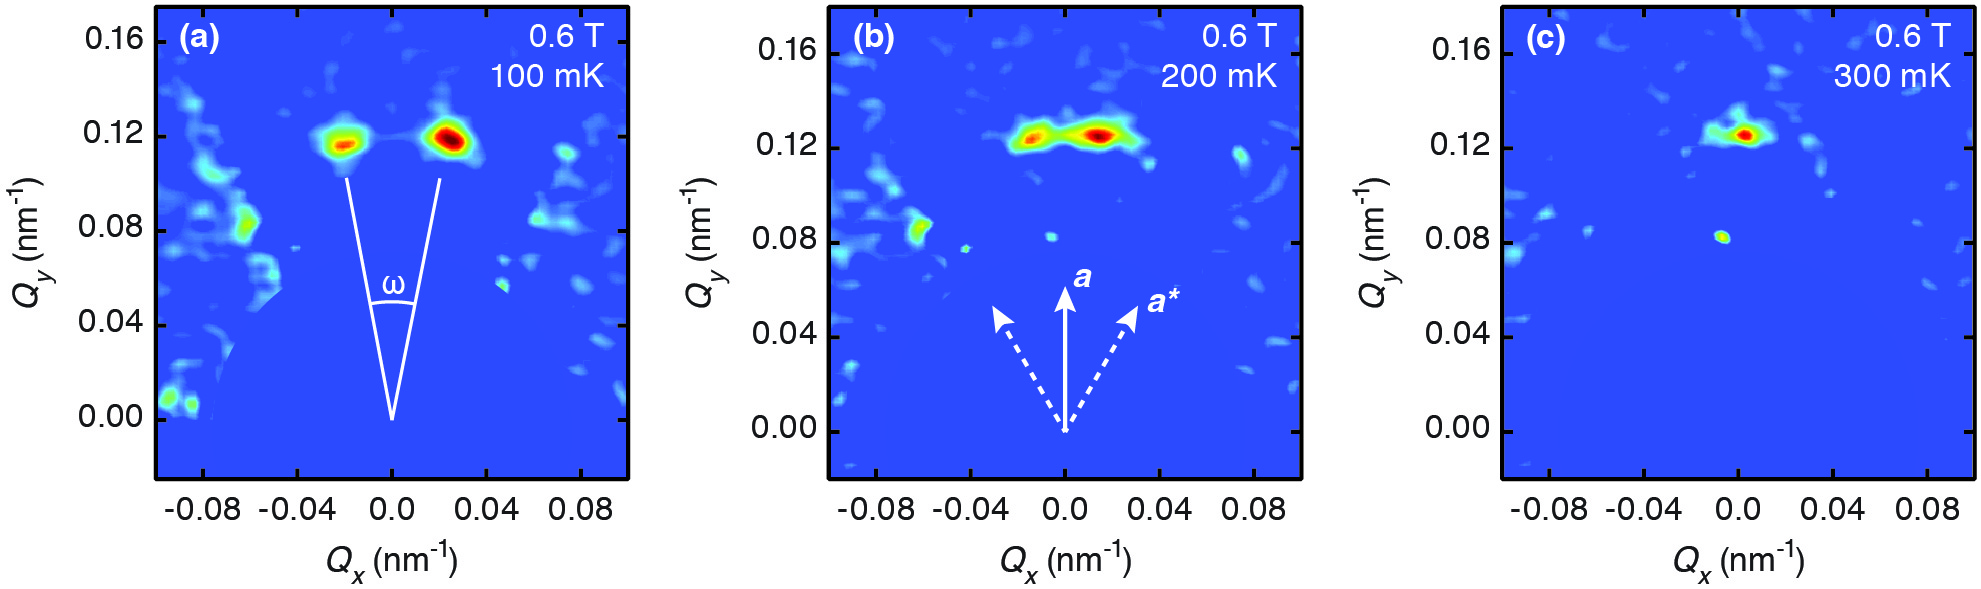
Figure 1 shows VL diffraction patterns obtained in an applied field of 0.6 T and temperature between 100 mK and 300 mK. As previously reported, the VL in UPt3 has a triangular symmetry but is in general not oriented along a high symmetry direction of the hexagonal crystalline basal lattice ( or ) Avers et al. (2020). This causes the VL to break up into clockwise and counterclockwise rotated domains, and gives rise to the Bragg peak splitting in Figs. 1(a) and 1(b). With increasing temperature the splitting decreases, and the two peaks eventually merge as seen in Fig. 1(c).
To quantify the VL rotation we define the peak splitting angle () shown in Fig. 1(a), determined from two-Gaussian fits to the diffraction pattern intensity. Specific details of the fitting will be discussed in more detail later. The temperature dependence of is summarized in Fig. 2(a) for all the magnetic fields measured, together with results from our previous SANS studies obtained at base temperature Avers et al. (2020).
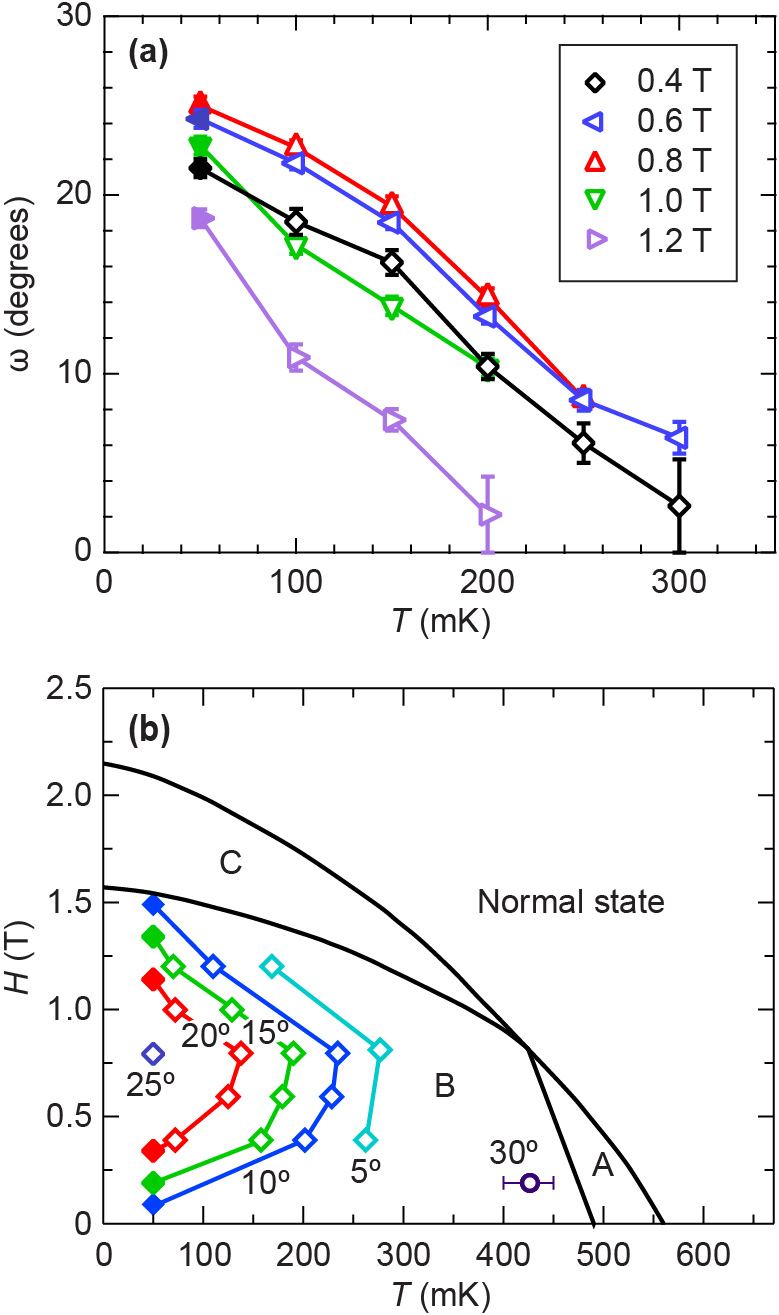
At all fields the temperature dependence of appears to be linear within the measurement error, and extrapolate to zero well below the A-B phase transition. The larger error bars at higher temperature is due to an increasing penetration depth and the resulting decrease in the scattered intensity Gannon et al. (2015).
Figure 2(b) shows equicontours superimposed on the UPt3 - phase diagram. The nonmonotonic behavior, previously reported at base temperature Avers et al. (2020), is clearly observed at higher temperatures, although with a decreasing amplitude. Furthermore, the splitting extrapolates to zero in the zero field limit, and also decreases upon approaching the B-C phase transition. However, once in the C phase the splitting remains at a fixed value of Avers et al. (2020). At all temperatures the maximal VL rotation is observed at 0.8 T. Also indicated in Fig. 2(b) is the approximate temperature at 0.19 T at which reaches in the vicinity of the A phase, reported by Huxley et al. Huxley et al. (2000).
Ensuring a reliable determination of requires a careful approach to the fitting. At all fields and temperatures the radial position () as well as the radial () and azimuthal () widths were constrained to be the same for both of the split peaks. Furthermore, the azimuthal width at each field was determined from fits at low temperature where the peaks are clearly separated, and then kept fixed at the higher temperature where they begin to overlap. To justify this approach, we note that when the peaks are clearly separated, does not exhibit any systematic temperature dependence. The azimuthal width does show a field dependence, however, with decreasing from FWHM at 0.4 T to FWHM at 1.2 T.
The VL density is reflected in and , shown in Fig. 3.
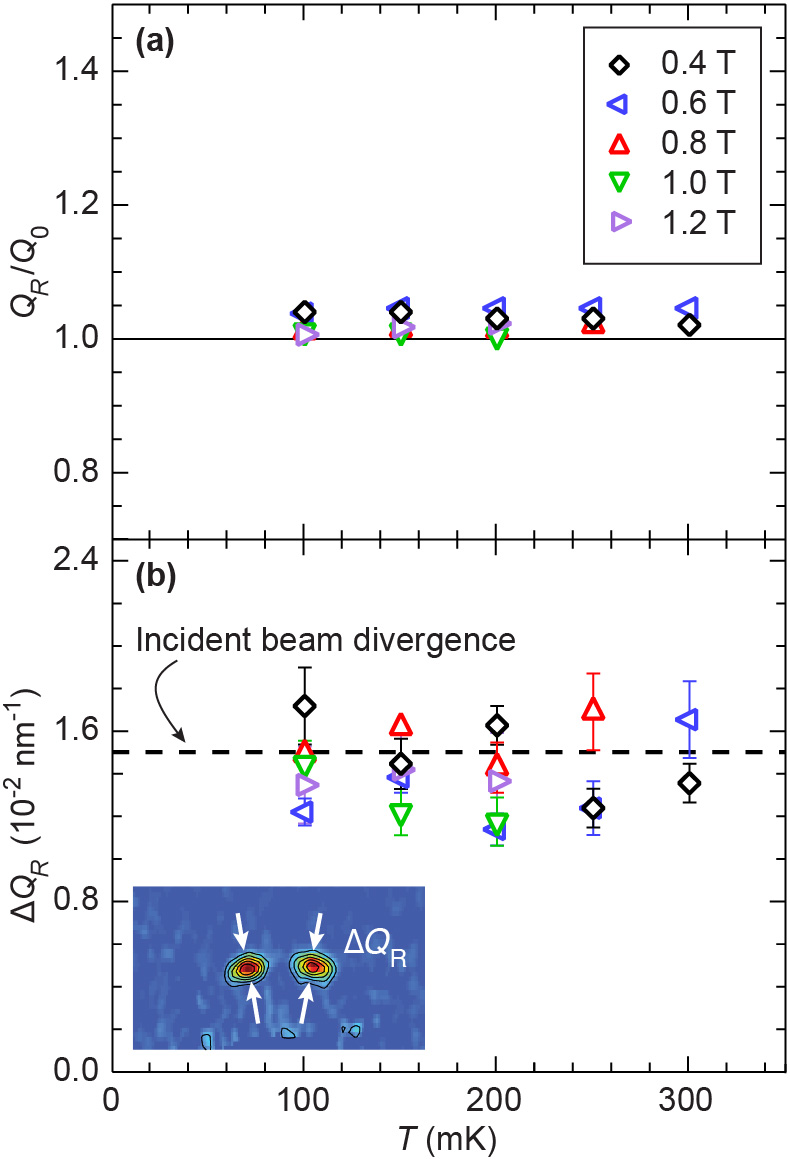
The magnitude of the scattering vector in Fig. 3(a) agrees to within a few percent with expected for a triangular VL and assuming that the magnetic induction () is equal to the applied magnetic field. Here T nm2 is the flux quantum. The small deviation between and is slightly greater at low fields consistent with earlier work Avers et al. (2020), but notably independent of temperature. Similarly, there is no systematic temperature or field dependence in the radial width in Fig. 3(b). However, the values are systematically at or below the divergence of the incident beam, indicating a highly ordered VL which leads to a diffracted neutron beam that is more collimated than the incident one.
IV Discussion
The complex VL phase diagram in Fig. 2(b) reflects the presence of multiple competing effects. In the following we discuss how, at the qualitative level, this phase diagram arises from the interplay between the SBF and the nodal configuration of the superconducting energy gap for the A and C phases. A more detailed treatment of the VL structure and orientation within the A phase was provided by Champel and Mineev Champel and Mineev (2001). First, however, we note that in the limit . For large vortex separations the order parameter has a vanishing effect on the VL, and the orientation with Bragg peaks along the a axis must be due to the Fermi surface anisotropy Huxley et al. (2000); Champel and Mineev (2001).
In momentum space the two-component order parameter proposed for UPt3 is given by Sauls (1994)
| (1) |
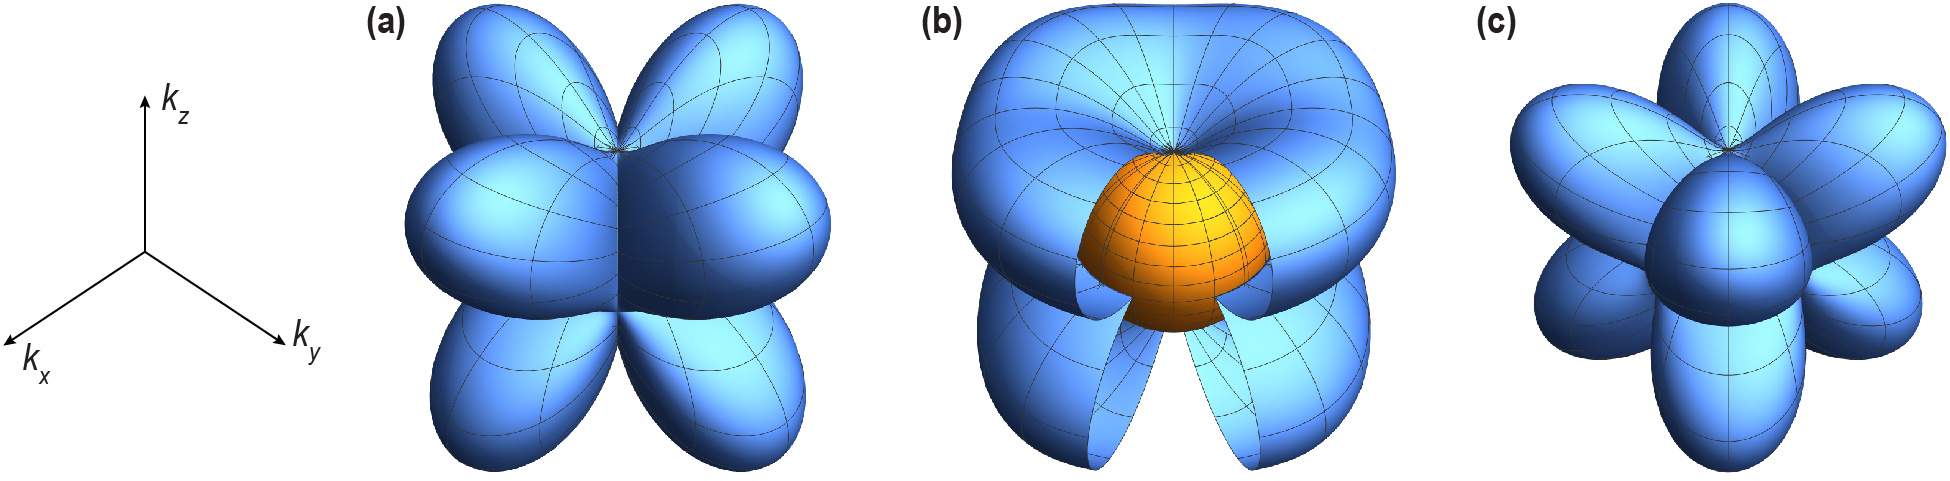
Here, and are real amplitudes which depend on temperature and magnetic field and is due to the SBF. The A and C phases correspond to a vanishing of and respectively. The magnitude of the SBF determines the zero-field split in the superconducting transition () and thus the width of the A phase. Experimentally, mK which yields Sauls (1994). Within the B phase both components of the order parameter are non-zero, although with different amplitudes. Due to the SBF this imbalance persists even in the low-temperature, low-field limit where both and approach unity Sauls (1994). The order parameter structure is illustrated in Fig. 4.
Within the A phase SANS studies by Huxley et al. found a VL with domains rotated by relative to the a axis () Huxley et al. (2000). The VL rotation was attributed to a competition between the sixfold Fermi surface anisotropy and the fourfold anisotropy of the nodal structure in the A phase Huxley et al. (2000); Champel and Mineev (2001). Notably, the rotation persists into the B phase as indicated in Fig. 2(b). This is not surprising since the upon approaching the A phase from low temperature, where the B phase order parameter therefore exhibit a substantial fourfold anisotropy. However, as increases with decreasing temperature this ratio quickly decreases, causing an abrupt transition to around 425 mK Huxley et al. (2000).
Due to the SBF the order parameter in the B phase preserves a degree of fourfold anisotropy, as shown in Fig. 4. This anisotropy is oriented in a manner similar to the A phase, with an effect on the vortex-vortex interactions which will increase with increasing field (vortex density). The influence of the SBF anisotropy will increase further at low temperature as the superfluid density increases Gannon et al. (2015), even if remains fixed. This explains the initial increase of with field at low temperatures, with an amplitude (0.8 T) that extrapolates to a value close to for .
As the field is increased further and approaches the BC phase transition, decreases and finally vanish. The C phase order parameter is rotated by about with respect to the B phase, as shown in Fig. 4. This will favor a VL oriented along the a axis, i.e. the same as the Fermi surface anisotropy, and explains the non-monotonic VL rotation as a function of field. Once has fully vanished no further VL rotation is expected, in agreement with the observed field-independence of in the C phase Avers et al. (2020).
V Conclusion
In summary, the rotated VL phase at low temperatures and intermediate fields in Fig. 2(b) can be directly attributed to the SBF. To our knowledge this is the first observation of such an effect at the microscopic level, and may provide further constraints on the nature of both the SBF and the order parameter in UPt3. A quantitative understanding of will require a detailed theoretical analysis, taking into account the field and temperature dependence of the superfluid density as well as the complex Fermi surface of UPt3. Here, the finite value of in the C phase is somewhat surprising and not obviously consistent with the order parameter in Eq. (1).
Conflict of Interest Statement
The authors declare that the research was conducted in the absence of any commercial or financial relationships that could be construed as a potential conflict of interest.
Author Contributions
KEA, WPH, and MRE conceived of the experiment. WJG and KEA grew and annealed the crystals. KEA, AWDL, and MRE performed the SANS experiments with assistance from LDS. KEA, WPH, and MRE wrote the paper with input from all authors.
Funding
This work was supported by the the Northwestern-Fermilab Center for Applied Physics and Superconducting Technologies (KEA) and by the U.S. Department of Energy, Office of Basic Energy Sciences, under Awards No. DE-SC0005051 (MRE: University of Notre Dame; neutron scattering) and DE-FG02-05ER46248 (WPH: Northwestern University; crystal growth and neutron scattering). A portion of this research used resources at the High Flux Isotope Reactor, a DOE Office of Science User Facility operated by the Oak Ridge National Laboratory.
Acknowledgments
We are grateful to J. A. Sauls for numerous discussions and to V. P. Mineev for valuable feed-back.
References
- Joynt and Taillefer (2002) R. Joynt and L. Taillefer, Rev. Mod. Phys. 74, 235 (2002).
- Hess et al. (1989) D. W. Hess, T. A. Tokuyasu, and J. A. Sauls, J. Phys.: Condens. Matter 1, 8135 (1989).
- Sauls (1994) J. A. Sauls, Adv. Phys. 43, 113 (1994).
- Adenwalla et al. (1990) S. Adenwalla, S. W. Lin, Q. Z. Ran, Z. Zhao, J. B. Ketterson, J. A. Sauls, L. Taillefer, D. G. Hinks, M. Levy, and B. K. Sarma, Phys. Rev. Lett. 65, 2298 (1990).
- Shivaram et al. (1986) B. S. Shivaram, T. F. Rosenbaum, and D. G. Hinks, Phys. Rev. Lett. 57, 1259 (1986).
- Choi and Sauls (1991) C. H. Choi and J. A. Sauls, Phys. Rev. Lett. 66, 484 (1991).
- Taillefer et al. (1997) L. Taillefer, B. Ellman, B. Lussier, and M. Poirier, Physica B: Condens. Matter 230–232, 327 (1997).
- Graf et al. (2000) M. J. Graf, S. K. Yip, and J. A. Sauls, Phys. Rev. B 62, 14393 (2000).
- Strand et al. (2009) J. D. Strand, D. J. Van Harlingen, J. B. Kycia, and W. P. Halperin, Phys. Rev. Lett. 103, 197002 (2009).
- Schemm et al. (2014) E. R. Schemm, W. J. Gannon, C. M. Wishne, W. P. Halperin, and A. Kapitulnik, Science 345, 190 (2014).
- Avers et al. (2020) K. E. Avers, W. J. Gannon, S. J. Kuhn, W. P. Halperin, J. A. Sauls, L. DeBeer-Schmitt, C. D. Dewhurst, J. Gavilano, G. Nagy, U. Gasser, and M. R. Eskildsen, Nat. Phys. 16, 531 (2020).
- Signore et al. (1995) P. J. C. Signore, B. Andraka, M. W. Meisel, S. E. Brown, Z. Fisk, A. L. Giorgi, J. L. Smith, F. Gross-Alltag, E. A. Schuberth, and A. A. Menovsky, Phys. Rev. B 52, 4446 (1995).
- Schöttl et al. (1999) S. Schöttl, E. A. Schuberth, K. Flachbart, J. B. Kycia, J. I. Hong, D. N. Seidman, W. P. Halperin, J. Hufnagl, and E. Bucher, Phys. Rev. Lett. 82, 2378 (1999).
- Gannon et al. (2015) W. J. Gannon, W. P. Halperin, C. Rastovski, K. J. Schlesinger, J. Hlevyack, M. R. Eskildsen, A. B. Vorontsov, J. Gavilano, U. Gasser, and G. Nagy, New J. Phys. 17, 023041 (2015).
- Hayden et al. (1992) S. M. Hayden, L. Taillefer, C. Vettier, and J. Flouquet, Phys. Rev. B 46, 8675 (1992).
- Aeppli et al. (1988a) G. Aeppli, E. Bucher, C. Broholm, J. K. Kjems, J. Baumann, and J. Hufnagl, Phys. Rev. Lett. 60, 615 (1988a).
- Aeppli et al. (1988b) G. Aeppli, E. Bucher, A. I. Goldman, G. Shirane, C. Broholm, and J. K. Kjems, J. Magn. Magn. Mater. 76-77, 385 (1988b).
- Walko et al. (2001) D. A. Walko, J. I. Hong, T. V. C. Rao, Z. Wawrzak, D. N. Seidman, W. P. Halperin, and M. J. Bedzyk, Phys. Rev. B 63, 054522 (2001).
- Hong (1999) J.-I. Hong, Strucure-Property Relationships for a Heavy Fermion Superconductor UPt3, PhD, Northwestern University (1999).
- Gannon et al. (2012) W. J. Gannon, W. P. Halperin, C. Rastovski, M. R. Eskildsen, P. Dai, and A. Stunault, Phys. Rev. B 86, 104510 (2012).
- Kogan (1981) V. G. Kogan, Phys. Rev. B 24, 1572 (1981).
- Kogan et al. (1997) V. G. Kogan, M. Bullock, B. Harmon, P. Miranovic, L. Dobrosavlevic-Grujic, P. L. Gammel, and D. J. Bishop, Phys. Rev. B 55, R8693 (1997).
- Huxley et al. (2000) A. Huxley, P. Rodière, D. M. Paul, N. van Dijk, R. Cubitt, and J. Flouquet, Nature 406, 160 (2000).
- Laver et al. (2006) M. Laver, E. M. Forgan, S. P. Brown, D. Charalambous, D. Fort, C. Bowell, S. Ramos, R. J. Lycett, D. K. Christen, J. Kohlbrecher, C. D. Dewhurst, and R. Cubitt, Phys. Rev. Lett. 96, 167002 (2006).
- Laver et al. (2009) M. Laver, C. J. Bowell, E. M. Forgan, A. B. Abrahamsen, D. Fort, C. D. Dewhurst, S. Mühlbauer, D. K. Christen, J. Kohlbrecher, R. Cubitt, and S. Ramos, Phys. Rev. B 79, 014518 (2009).
- Mühlbauer et al. (2009) S. Mühlbauer, C. Pfleiderer, P. Böni, M. Laver, E. M. Forgan, D. Fort, U. Keiderling, and G. Behr, Phys. Rev. Lett. 102, 136408 (2009).
- Cubitt et al. (2003) R. Cubitt, M. R. Eskildsen, C. D. Dewhurst, J. Jun, S. M. Kazakov, and J. Karpinski, Phys. Rev. Lett. 91, 047002 (2003).
- Das et al. (2012) P. Das, C. Rastovski, T. R. O’Brien, K. J. Schlesinger, C. D. Dewhurst, L. DeBeer-Schmitt, N. D. Zhigadlo, J. Karpinski, and M. R. Eskildsen, Phys. Rev. Lett. 108, 167001 (2012).
- Mühlbauer et al. (2019) S. Mühlbauer, D. Honecker, E. A. Périgo, F. Bergner, S. Disch, A. Heinemann, S. Erokhin, D. Berkov, C. Leighton, M. R. Eskildsen, and A. Michels, Rev. Mod. Phys 91, 015004 (2019).
- Heller et al. (2018) W. T. Heller, M. Cuneo, L. Debeer-Schmitt, C. Do, L. He, L. Heroux, K. Littrell, S. V. Pingali, S. Qian, C. Stanley, V. S. Urban, B. Wu, and W. Bras, J. Appl. Crystallogr. 51, 242 (2018).
- (31) K. E. Avers, S. J. Kuhn, A. W. D. Leishman, W. J. Gannon, L. DeBeer-Schmitt, C. D. Dewhurst, D. Honecker, R. Cubitt, W. P. Halperin, and M. R. Eskildsen, arXiv:2103.09843 .
- Champel and Mineev (2001) T. Champel and V. P. Mineev, Phys. Rev. Lett. 86, 4903 (2001).