Quantum Membrane Phases in Synthetic Lattices of Cold Molecules or Rydberg Atoms
Abstract
We calculate properties of dipolar interacting ultracold molecules or Rydberg atoms in a semi-synthetic three-dimensional configuration – one synthetic dimension plus a two-dimensional real space optical lattice or periodic microtrap array – using the stochastic Green function Quantum Monte Carlo method. Through a calculation of thermodynamic quantities and appropriate correlation functions, along with their finite size scalings, we show that there is a second order transition to a low temperature phase in which two-dimensional ‘sheets’ form in the synthetic dimension of internal rotational or electronic states of the molecules or Rydberg atoms, respectively. Simulations for different values of the interaction , which acts between atoms or molecules that are adjacent both in real and synthetic space, allow us to compute a phase diagram. We find a finite-temperature transition at sufficiently large , as well as a quantum phase transition – a critical value below which the transition temperature vanishes.
I Introduction
Atomic and molecular platforms for quantum simulation offer the versatility to realize an enormous range of physics, which has recently been extended to physics with extra dimensions by augmenting true spatial extent with internal [1, 2, 3, 4, 5, 6, 7] or motional states [8, 9, 10, 11] coupled to mimic motion through a lattice in a synthetic dimension. Synthetic dimensions can lend access to many-body Hamiltonians with high levels of control over parameters such as tunneling amplitude and phase in the synthetic dimension, particularly useful for studying gauge fields, disorder, and topological band structures, all of which have been explored in recent experiments, reviewed in Ref. [12].
Recent experiments in ultracold molecules and Rydberg atoms demonstrate their potential as many-body systems with synthetic dimensions. Ultracold molecules’ rotational-state-exchanging dipolar interactions have been observed in optical lattices [13, 14, 15], they have been trapped in arrays of optical tweezers [16, 17], and sophisticated coherent rotational state control of many levels has been demonstrated [18], all the ingredients required to create many-body strongly interacting synthetic dimensions with rotational states of molecules [5, 6]. Similarly, rapid advances in optical tweezer arrays of dozens or hundreds of Rydberg atoms [19, 20, 21, 22, 23] can be combined with the synthetic dimensions for single Rydberg atoms demonstrated in Ref. [7] to create many-body synthetic dimensions. Ref. [7] specifically used a ladder of alternating and Rydberg states, but many alternative level schemes are possible.
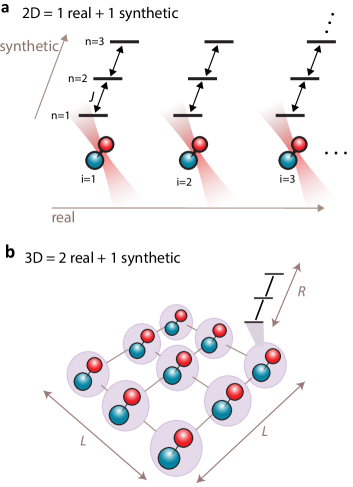
Here, we consider an effectively three dimensional system constructed from a two-dimensional real-space lattice with one ultracold polar molecule or Rydberg atom per site, extended by a third, synthetic, dimension of molecular rotational states, as illustrated in Fig. 1. We will mostly describe the system for the molecular case, but identical physics will apply for configurations of Rydberg atoms, as discussed below. We show that the system undergoes a quantum phase transition as the dipolar interaction , which causes angular momentum exchange between adjacent molecules, is varied relative to the “tunneling” within the synthetic dimension.
The transition represents the development of a “quantum membrane”, or a low-temperature phase in which molecules across the lattice are confined to occupy one of a few spontaneously chosen adjacent sites in the synthetic dimension, a two-dimensional surface fluctuating in the three dimensional space. Previously, this phase transition was examined using mean-field theories [5], and, in 1D, with density matrix renormalization group (DMRG) calculations and analytical solutions in the limit [6]. Here, we utilize the Stochastic Green Function (SGF) method [24] to perform numerically exact Quantum Monte Carlo (QMC) calculations determining the phase boundary at zero and finite-temperature, as well as multiple observables across the phase diagram. We evaluate the average distance between molecules along the synthetic direction, which measures the degree of rotational state confinement into a membrane, as well as thermodynamic quantities such as energy, heat capacity, and entropy, and correlation functions. Varying the lattice size allows a characterization of the phase transition in the thermodynamic limit.
II Model and Methodology
Experiments on two dimensional periodic arrays of ultracold polar molecules in an optical trap or microtrap array with no real-space tunneling and with near-resonant microwaves coupling a chain of rotational states are described by [5] the many-body Hamiltonian,
| (1) |
when the microwave transition rates, detuning and interactions are small compared to the energy differences between rotational states. Here is either a bosonic or fermionic annihilation operator for a molecule at real space lattice site and rotational state (synthetic site) , and the Hamiltonian is the same for both cases, since particles are frozen on their lattice sites and cannot exchange in real space. The first term arises from the near-resonant microwaves, where is proportional to the microwave amplitude coupling states and . The second term arises from dipolar interactions, which drive an exchange of angular momentum between pairs of molecules with adjacent angular momenta , i.e. . We have truncated the dipole interaction to nearest-neighbors. This captures the dominant interactions, and in 2D the longer range interactions are likely to give mostly quantitative corrections to the physics. More significant qualitative effects are expected only in small regions, for example at low temperatures where multiple phases of matter with nearby energies compete.
Interpreting the rotational states as a synthetic dimension indexed by , the first term describes microwave-induced tunneling along the synthetic dimension for each spatial location in the array, while the second term describes the dipole interactions, which causes molecules adjacent in the synthetic dimension to undergo coordinated quantum fluctuations. The precise functional forms for are nontrivial [5], but they vary slowly and approach a constant for large , so we assume for all , an excellent approximation for many choices of rotational states. The are fully tunable in experiment by controlling the microwave amplitudes, but here we restrict to the simplest scenario, in which and . Such a model provides the simplest example of an interacting synthetic dimension in this system, but as has been argued in Refs. [5, 6] and we will see here, the physics is already quite rich, with interesting finite-temperature and quantum phase transitions.
In this work, we fix and , while focusing on , where the QMC sign problem is absent [25]. We refer to and as the linear lattice sizes in synthetic and real space, as illustrated in Fig. 1(b). For a system of trapped, ultracold molecules or Rydberg atoms, is tunable and controlled by the microwave configurations applied. Initial experiments have demonstrated for Rydberg atoms [7] and demonstrated the individual couplings required for for molecules [26]. No issues are expected to arise scaling to much larger , and interesting physics already occurs for . denotes the total number of real sites (molecules) on a square lattice. We use periodic boundary conditions (PBC) for both real space and the synthetic dimension. Both open boundary conditions (OBC) and PBC in synthetic dimensions are realizable experimentally and we do not expect the choice of boundary conditions to alter the physics for large or .
The SGF method [24] that we use is closely related to the Canonical Worm (CW) algorithms[27, 28, 29, 30]. It has the advantage of ease of implementation for general forms of inter-particle interaction, but is somewhat less efficient than methods which have been optimized for particular models. Its name derives from the central role of the many-body Green functions and its ability to capture them in a simple and general way. The SGF approach works in the canonical ensemble and utilizes continuous imaginary time. Hence it avoids any systematic errors introduced by Trotter discretization [31, 32, 33].
III Results
III.1 Thermal Phase Transition
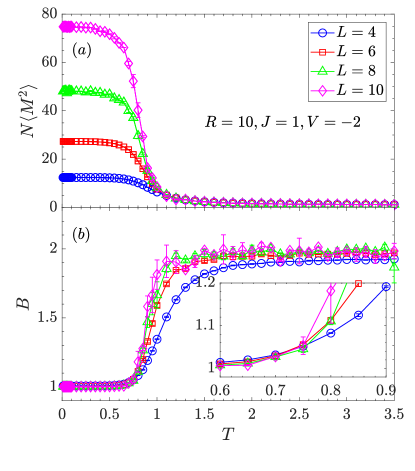
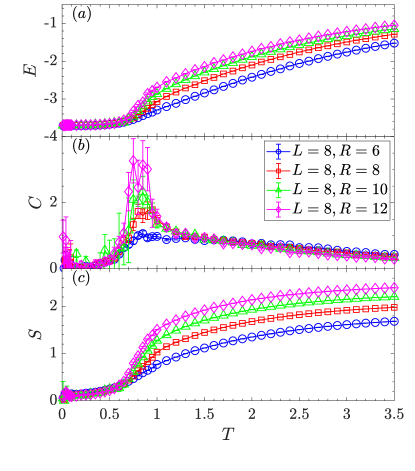
We begin our determination of the phase diagram by considering a fixed number of rotational states and . The temperature dependence of the energy (i.e. per spatial site), as obtained by the SGF, is shown in Fig. 2(a) for linear lattice sizes . Figs. 2(b,c) complete the picture of the thermodynamics by showing the resulting heat capacity , and entropy . is obtained from a numerical differentiation of the energy. The entropy is obtained by thermodynamic integration, where is the highest temperature we simulate. We have checked convergence in and find that it causes only a small shift of the curves, and doesn’t change any of the features we identify. We approximate by , the non-interacting entropy at , which captures the zeroth order term in the high- expansion.
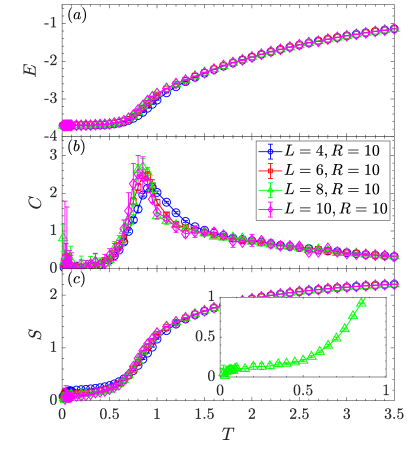
The most prominent feature of Fig. 2 is a sharp decrease in both energy and entropy at , and the corresponding peak in . These are signals of a thermal phase transition, as we will verify more rigorously below. In concurrence with this picture, the greater dependence of on lattice size in the region suggests a large correlation length.
The inset of Fig. 2(c) focuses on the low behavior of the entropy for , which reveals a plateau in in a temperature range which can be understood as follows: In the limit , the ground state is degenerate [6]. When is turned on, this ground state degeneracy is broken, so that the resulting unique ground state yields an entropy as . Our value , is sufficiently small that the reduction in entropy occurs in two stages: a phase transition to sheet formation (as we shall show) at , and then a final decrease at much lower when the temperature drops below the energy scale distinguishing the nearly degenerate states, remnants of those exactly present at . There is a corresponding second peak in the heat capacity Fig. 2(b) at .
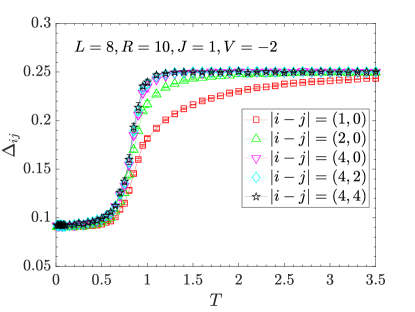
In order to explore the nature of the ordered phase suggested by the thermodynamics, we measure , the average separation in the synthetic dimension between two molecules on spatial sites and . This is
| (2) |
where denotes the distance between synthetic sites and , accounting for periodic boundary conditions.
Measuring and related observables discussed below is challenging, but may be possible, in near-term experiments. Experimentally, one can measure populations in specific synthetic sites using standard techniques. In molecules, one can measure populations by state-selective absorption imaging [34] or by absorption imaging the atoms produced after a STImulated Raman Adiabatic Passage (STIRAP) process addressing specific rotational states [35, 36]. However, this can be done only for a single rotational level per experimental shot, because the absorption imaging is destructive. Thus one can obtain only the terms in the integrand of Eq. (2). These drawbacks may be overcome by novel imaging techniques, such as dispersive imaging [37] or perhaps by taking advantage of special molecules with quasi-cycling transitions [38]. In Rydberg atoms, one can measure populations by selective field ionization [39] or level-specific transitions followed by absorption imaging, but novel non-destructive high-resolution real-space imaging will be required to directly measure correlations.
Figure 3 shows as a function of temperature for several for an , , system. denotes the vector connecting real sites and . At high temperature, molecules are randomly distributed and densities on different real sites are independent. In this case, defining , we have when . As a consequence, we find in the high temperature limit when the sum over and is performed, in agreement with the high- limit of Fig. 3. The transition to the relatively low value below , is consistent with the peak position of , and signals the formation of an ordered quantum membrane phase, with greatly reduced separation in the synthetic dimension.
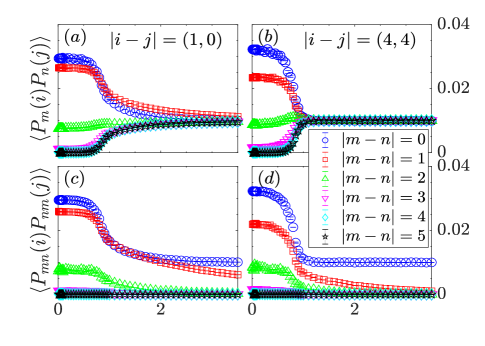
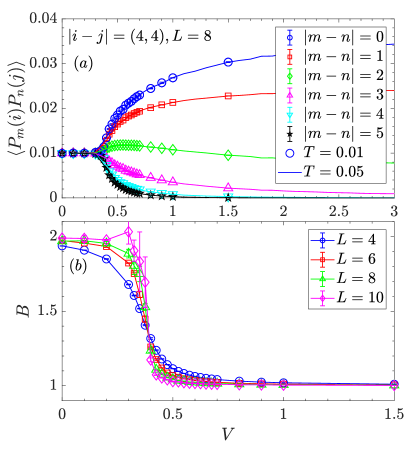
We can more fully characterize this phase by measuring two additional correlation functions. The first, , breaks the average distance into its components and better resolves the rotational separation. When is measured for the same molecule, , it takes either of the two temperature independent values for , or for . On the other hand, for distinct molecules, , there is a strong temperature dependence. At high , for all , as discussed above, consistent with a complete lack of correlation between the rotational states. However, as is lowered, there is a rapid increase in the probability that the rotational states are identical, , or adjacent, . Simultaneously, becomes small for all . This is true both for neighboring molecules and for those at maximal separation for , indicating the ordering of molecules to nearby synthetic locations is long-ranged in real space.
The results of Fig. 3 together with the top row of Fig. 4 give considerable insight into the nature of the phase transition and the ordered phase. At low-temperature, the string is mostly confined to three adjacent states (spontaneously chosen) in the synthetic dimension, and when the system is heated to the phase transition, the width of the strings diverges until it saturates the full width of the synthetic dimension. In an infinite system, it is expected to diverge at the phase transition, as investigated below. Intriguingly, the low-temperature width of the strings is reminiscent of the limit of the 2D=(1 real)+(1 synthetic) system at that was exactly solved in Ref. [6], which had a width of exactly three synthetic sites. Our results suggest the same phenomena occurs in 3D=(2 real)+(1 synthetic dimension), and that adding broadens the strings by a finite amount until the phase transition is reached and the string width diverges.
We also consider the correlation function, with , which describes the probability of molecules being in states with superpositions of exchanged synthetic positions , . As with , the correlation takes a trivial value for . For and , this rotational exchange is the expectation value of the second (interaction) term of the Hamiltonian (with the coefficient removed). Fig. 4 (bottom) shows this correlation rapidly grows as temperature is lowered below . The increase is even more abrupt for larger . This corroborates the preference for the occupation of nearby rotational states across the entire molecular array for .
We now quantify these transitions through a finite size scaling analysis and an appropriately defined order parameter. We begin, in analogy to the common analysis of the Potts model[40], by defining an order parameter
| (3) |
that gives a one-dimensional representation of the group of translations in the synthetic dimension. Then , shown in Fig. 5(a) can be viewed as the corresponding structure factor. Above , the synthetic position is random, and thus preserves synthetic translation invariance so in the thermodynamic limit. Below , in the quantum membrane phase, the structure factor becomes proportional to the real-space lattice size .
An associated Binder ratio [41] is . Its crossings can be used to determine precisely both thermal and quantum critical points. In the molecular gas phase, above , and the Binder ratio . In the quantum membrane phase, below , and . Precisely this behavior is seen in Fig. 5(b). A Binder ratio crossing of curves for different lattice sizes occurs, and is emphasized in the inset. This allows an accurate determination of , refining the more crude estimates from Figs. 2-4.
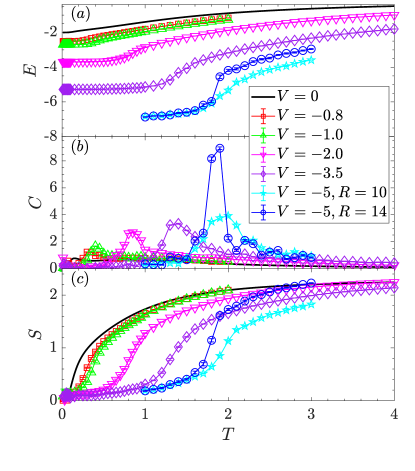
We now expand our focus from the results considered so far to study the dependence of the thermal phase transition on , shown in Fig. 6. When the temperature is lower than (which can depend on ), molecules collapse to a quantum membrane with thickness of roughly 2 or 3 sites and the total energy is independent of the number of unoccupied synthetic sites, as is seen in Fig. 6(a). For , the energy depends on , increasing with as the molecules escape the bound states. The heat capacity peaks increase with , reflecting the greater loss in entropy as the membrane forms and the occupied rotational states decline from to -. The positions of the peaks, i.e. the locations of , decrease as increases, but the shift is relatively small. The critical temperature of the square lattice Potts model, a rough classical analog of the quantum model considered here, is known to decline as , which similarly has a very slow dependence on 111Comparing and , and .
We similarly expand our calculations from the previous to general . Analogous to Fig. 2, the energy , heat capacity and entropy are shown in Fig. 7. All the curves are for a square lattice with . The black curve is obtained from analytical solution for the non-interacting limit . As increases, the transition temperature rises and for , is roughly proportional to , an expected result since is negligible and is the only energy scale at these temperatures. In the non-interacting limit, the ground state degeneracy is completely removed and entropy drops to directly without any plateaus. As the interaction strength grows, wider low temperature entropy plateaus are evident.
III.2 Quantum Phase Transition
The results of Fig. 7 show that is becoming small as decreases. This suggests the possibility that there is a quantum critical point (QCP) below which there is no ordered phase (no membrane formation) even at zero temperature. To explore this possibility, we fix at a low value and vary the interaction strength . The correlation function is plotted in Fig. 8(a). Both (solid line) and (dot) curves are presented. The fact that they coincide indicates we have accessed the ground state for the given finite lattice. The data support the existence of a QCP at . Below this value, even in the ground state, for all , its uncorrelated, gas phase, value. However, for , the quantum membrane phase occurs at low . is then large for , whereas for away from . The values of for grow as is approached: the membrane becomes increasingly thick.
Similar to the thermal phase transition, a more accurate way to locate is by plotting the Binder ratio as a function of for different lattice sizes. The clear crossing of Fig. 8(b) determines the position of the QCP, .
III.3 Phase Diagram
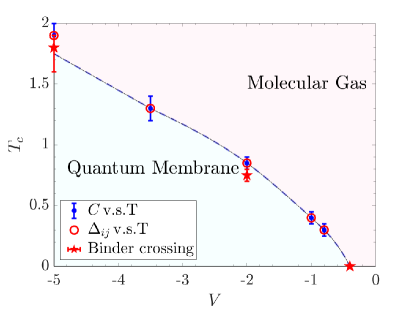
Putting together the results for the thermal and quantum phase transitions leads to the phase diagram shown in Fig. 9. The blue dots are obtained from the peaks in the heat capacity curves and the red open circles are extracted from the temperature of largest slope in the average distance . Both data sets were analyzed at fixed spatial lattice size, an square with rotational states. They are in close quantitative agreement. As is suggested in Fig. 6, the dependence of transition temperature on number of rotational states near this value is weak.
As noted earlier, the most reliable are obtained from a Binder crossing, as in Fig. 5 for . These are shown by red stars at and in Fig. 9. The Binder value lies somewhat below the values inferred from a single lattice size, an expected result. Finally, the red star at reveals the quantum critical point implied by the Binder crossing in Fig. 8. The two phases are labeled in the figure: When , the system is in a molecular gas phase where spatially separated molecules are uncorrelated. When there is a quantum membrane phase where molecules separated far in real space remain close along the synthetic direction, with a finite value, approaching as .
IV Discussion and conclusions
In this work we calculated properties of 3D systems formed by 2D real-space arrays of either ultracold polar molecules or Rydberg atoms augmented by a synthetic dimension employing the Stochastic Green Function (SGF) quantum Monte Carlo (QMC) method. Thermodynamic quantities – the energy , heat capacity , entropy were measured as functions of temperature and interaction strength and suggested the occurrence of both finite temperature and quantum phase transitions. The high-temperature 3D gas transitions to a low-temperature quantum membrane, a spontaneously formed fluctuating 2D surface, as evidenced by correlation functions that capture the average separation in the synthetic dimension [], probabilities for two molecules to occupy given synthetic sites [], and a measure of correlated hopping in the synthetic dimension for particles separated in real space []. Finite size studies of these observables, including an analysis of the Binder ratio, suggest a genuine phase transition and capture accurately. Together with the extraction of a quantum critical coupling strength , these data produced a phase diagram in the plane of temperature and the energy scale of coordinated quantum tunneling of adjacent molecules.
We show that the quantum membrane phase suggested in prior work [5, 6] zero-temperature mean-field or in 2D (1 real+1 synthetic) DMRG calculations also exists in 3D (2 real+1 synthetic), and that it survives to finite temperature. We also show this with significantly larger systems and finite-size scaling, and with a variety of conceptually important and experimentally accessible observables. These elucidate the nature of the thermal and phase transitions as a continuous transition occurring by the divergence of the string width. These results will be invaluable for experiments that are beginning to probe synthetic dimensions in arrays of trapped molecules and Rydberg atoms.
A question opened by these results is the precise nature of the classical and quantum phase transitions, in particular their universality class. It is unclear whether this corresponds to a known universality class, or something previously unexplored. Additionally, while the results should capture the main physics, the long-ranged interactions will lead to quantitative, and perhaps some qualitative, modifications of the behavior, and will need to be incorporated for detailed comparison with future experiments. Finally, the results and methods also serve as a jumping off point for calculations in the infinite variety of synthetic landscapes that can be experimentally engineered, including topological band structures, such as the Su-Schrieffer-Heeger model realized in Ref. [7], models with disorder, ladders, gauge fields, or even exotic geometries such as Möbius strips. The interplay of the interaction-driven tendency towards a quantum membrane with the single-particle band structures is expected to lead to a rich variety of physics.
Acknowledgements: We thank Sohail Dasgupta and Bryce Gadway for useful conversations. H.M. was supported by the Research Experience for Undergraduates program (NSF grant PHY-1852581) and by the Caltech Applied Physics Department Yariv/Blauvelt Fellowship. The work of C.H.F. and R.T.S. was supported by the grant DOE-DE‐SC0014671 funded by the U.S. Department of Energy, Office of Science. K.H. was supported by the Welch Foundation Grant No. C1872, the National Science Foundation Grant No. PHY1848304, and also benefited from discussions at the KITP, which was supported in part by the National Science Foundation under Grant No. NSF PHY-1748958.
References
- Boada et al. [2012] O. Boada, A. Celi, J. Latorre, and M. Lewenstein, Quantum simulation of an extra dimension, Phys. Rev. Lett. 108, 133001 (2012).
- Celi et al. [2014] A. Celi, P. Massignan, J. Ruseckas, N. Goldman, I. B. Spielman, G. Juzeliūnas, and M. Lewenstein, Synthetic gauge fields in synthetic dimensions, Phys. Rev. Lett. 112, 043001 (2014).
- Mancini et al. [2015] M. Mancini, G. Pagano, G. Cappellini, L. Livi, M. Rider, J. Catani, C. Sias, P. Zoller, M. Inguscio, M. Dalmonte, and L. Fallani, Observation of chiral edge states with neutral fermions in synthetic Hall ribbons, Science 349, 1510 (2015).
- Wall et al. [2016] M. L. Wall, A. P. Koller, S. Li, X. Zhang, N. R. Cooper, J. Ye, and A. M. Rey, Synthetic spin-orbit coupling in an optical lattice clock, Phys. Rev. Lett. 116, 035301 (2016).
- Sundar et al. [2018] B. Sundar, B. Gadway, and K. R. A. Hazzard, Synthetic dimensions in ultracold polar molecules, Scientific Reports 8, 1 (2018).
- Sundar et al. [2019] B. Sundar, M. Thibodeau, Z. Wang, B. Gadway, and K. R. A. Hazzard, Strings of ultracold molecules in a synthetic dimension, Phys. Rev. A 99, 013624 (2019).
- Kanungo et al. [2021] S. K. Kanungo, J. D. Whalen, Y. Lu, M. Yuan, S. Dasgupta, F. B. Dunning, K. R. A. Hazzard, and T. C. Killian, Realizing Su-Schrieffer-Heeger topological edge states in Rydberg-atom synthetic dimensions, arXiv preprint arXiv:2101.02871 (2021).
- Heimsoth et al. [2013] M. Heimsoth, D. Hochstuhl, C. E. Creffield, L. D. Carr, and F. Sols, Effective Josephson dynamics in resonantly driven Bose–Einstein condensates, New Journal of Physics 15, 103006 (2013).
- Gadway [2015] B. Gadway, Atom-optics approach to studying transport phenomena, Phys. Rev. A 92, 043606 (2015).
- Price et al. [2017] H. M. Price, T. Ozawa, and N. Goldman, Synthetic dimensions for cold atoms from shaking a harmonic trap, Phys. Rev. A 95, 023607 (2017).
- An et al. [2021] F. A. An, B. Sundar, J. Hou, X.-W. Luo, E. J. Meier, C. Zhang, K. R. A. Hazzard, and B. Gadway, Nonlinear dynamics in a synthetic momentum-state lattice, Phys. Rev. Lett. 127, 130401 (2021).
- Ozawa and Price [2019] T. Ozawa and H. Price, Topological quantum matter in synthetic dimensions, Nature Reviews Physics 1, 349 (2019).
- Yan et al. [2013] B. Yan, S. A. Moses, B. Gadway, J. P. Covey, K. R. A. Hazzard, A. M. Rey, D. S. Jin, and J. Ye, Observation of dipolar spin-exchange interactions with lattice-confined polar molecules, Nature 501, 521 (2013).
- Hazzard et al. [2014] K. R. A. Hazzard, B. Gadway, M. Foss-Feig, B. Yan, S. A. Moses, J. P. Covey, N. Y. Yao, M. D. Lukin, J. Ye, D. S. Jin, and A. M. Rey, Many-body dynamics of dipolar molecules in an optical lattice, Phys. Rev. Lett. 113, 195302 (2014).
- Seeßelberg et al. [2018] F. Seeßelberg, X.-Y. Luo, M. Li, R. Bause, S. Kotochigova, I. Bloch, and C. Gohle, Extending rotational coherence of interacting polar molecules in a spin-decoupled magic trap, Phys. Rev. Lett. 121, 253401 (2018).
- Anderegg et al. [2019] L. Anderegg, L. Cheuk, Y. Bao, S. Burchesky, W. Ketterle, K.-K. Ni, and J. M. Doyle, An optical tweezer array of ultracold molecules, Science 365, 1156 (2019).
- Zhang et al. [2021] J. T. Zhang, L. R. Picard, W. B. Cairncross, K. Wang, Y. Yu, F. Fang, and K.-K. Ni, An optical tweezer array of ground-state polar molecules, arXiv preprint arXiv:2112.00991 (2021).
- Gregory et al. [2019] P. Gregory, M. Frye, J. Blackmore, E. Bridge, R. Sawant, J. Hutson, and S. Cornish, Sticky collisions of ultracold RbCs molecules, Nature Communications 10 (2019).
- Scholl et al. [2021a] P. Scholl, M. Schuler, H. J. Williams, A. A. Eberharter, D. Barredo, K.-N. Schymik, V. Lienhard, L.-P. Henry, T. C. Lang, T. Lahaye, A. M. Läuchli, and A. Browaeys, Quantum simulation of 2D antiferromagnets with hundreds of Rydberg atoms, Nature 595, 233 (2021a).
- Bluvstein et al. [2021] D. Bluvstein, A. Omran, H. Levine, A. Keesling, G. Semeghini, S. Ebadi, T. T. Wang, A. A. Michailidis, N. Maskara, W. W. Ho, S. Choi, M. Serbyn, M. Greiner, V. Vuletić, and M. D. Lukin, Controlling quantum many-body dynamics in driven Rydberg atom arrays, Science 371, 1355 (2021).
- Ebadi et al. [2021] S. Ebadi, T. T. Wang, H. Levine, A. Keesling, G. Semeghini, A. Omran, D. Bluvstein, R. Samajdar, H. Pichler, W. W. Ho, S. Choi, S. Sachdev, M. Greiner, V. Vuletić, and M. D. Lukin, Quantum phases of matter on a 256-atom programmable quantum simulator, Nature 595, 227 (2021).
- Semeghini et al. [2021] G. Semeghini, H. Levine, A. Keesling, S. Ebadi, T. T. Wang, D. Bluvstein, R. Verresen, H. Pichler, M. Kalinowski, R. Samajdar, A. Omran, S. Sachdev, A. Vishwanath, M. Greiner, V. Vuletić, and M. D. Lukin, Probing topological spin liquids on a programmable quantum simulator, Science 374, 1242 (2021).
- Scholl et al. [2021b] P. Scholl, H. J. Williams, G. Bornet, F. Wallner, D. Barredo, T. Lahaye, A. Browaeys, L. Henriet, A. Signoles, C. Hainaut, T. Franz, S. Geier, A. Tebben, A. Salzinger, G. Zürn, and M. Weidemüller, Microwave-engineering of programmable XXZ hamiltonians in arrays of Rydberg atoms (2021b), arXiv:2107.14459 [quant-ph] .
- Rousseau [2008] V. Rousseau, Stochastic Green function algorithm, Phys. Rev. E 77, 056705 (2008).
- Loh et al. [1990] E. Y. Loh, J. E. Gubernatis, R. T. Scalettar, S. R. White, D. J. Scalapino, and R. L. Sugar, Sign problem in the numerical simulation of many-electron systems, Phys. Rev. B 41, 9301 (1990).
- Blackmore et al. [2020] J. A. Blackmore, P. D. Gregory, S. L. Bromley, and S. L. Cornish, Coherent manipulation of the internal state of ultracold molecules with multiple microwave fields, Phys. Chem. Chem. Phys. 22, 27529 (2020).
- Evertz et al. [1993] H. G. Evertz, G. Lana, and M. Marcu, Cluster algorithm for vertex models, Phys. Rev. Lett. 70, 875 (1993).
- Prokof’ev et al. [1998] N. Prokof’ev, B. Svistunov, and I. Tupitsyn, Exact, complete, and universal continuous-time worldline Monte Carlo approach to the statistics of discrete quantum systems, Journal of Experimental and Theoretical Physics 87, 310 (1998).
- Van Houcke et al. [2006] K. Van Houcke, S. Rombouts, and L. Pollet, Quantum Monte Carlo simulation in the canonical ensemble at finite temperature, Phys. Rev. E 73, 056703 (2006).
- Rombouts et al. [2006] S. Rombouts, K. Van Houcke, and L. Pollet, Loop updates for Quantum Monte Carlo simulations in the canonical ensemble, Phys. Rev. Lett. 96, 180603 (2006).
- Trotter [1958] H. F. Trotter, Approximation of semi-groups of operators, Pacific Journal of Mathematics 8, 887 (1958).
- Suzuki [1976] M. Suzuki, Generalized Trotter’s formula and systematic approximants of exponential operators and inner derivations with applications to many-body problems, Communications in Mathematical Physics 51, 183 (1976).
- Fye [1986] R. Fye, New results on Trotter-like approximations, Phys. Rev. B 33, 6271 (1986).
- Wang et al. [2010] D. Wang, B. Neyenhuis, M. H. G. de Miranda, K.-K. Ni, S. Ospelkaus, D. S. Jin, and J. Ye, Direct absorption imaging of ultracold polar molecules, Phys. Rev. A 81, 061404 (2010).
- Ni et al. [2008] K.-K. Ni, S. Ospelkaus, M. H. G. de Miranda, A. Pe’er, B. Neyenhuis, J. J. Zirbel, S. Kotochigova, P. S. Julienne, D. S. Jin, and J. Ye, A high phase-space-density gas of polar molecules, Science 322, 231 (2008).
- Chotia et al. [2012] A. Chotia, B. Neyenhuis, S. A. Moses, B. Yan, J. P. Covey, M. Foss-Feig, A. M. Rey, D. S. Jin, and J. Ye, Long-lived dipolar molecules and Feshbach molecules in a 3D optical lattice, Phys. Rev. Lett. 108, 080405 (2012).
- Guan et al. [2020] Q. Guan, M. Highman, E. J. Meier, G. R. Williams, V. Scarola, B. DeMarco, S. Kotochigova, and B. Gadway, Nondestructive dispersive imaging of rotationally excited ultracold molecules, Phys. Chem. Chem. Phys. 22, 20531 (2020).
- Cheuk et al. [2018] L. W. Cheuk, L. Anderegg, B. L. Augenbraun, Y. Bao, S. Burchesky, W. Ketterle, and J. M. Doyle, -enhanced imaging of molecules in an optical trap, Phys. Rev. Lett. 121, 083201 (2018).
- Gallagher [1994] T. F. Gallagher, Rydberg Atoms (Cambridge University Press, Cambridge, 1994).
- Wu [1982] F. Y. Wu, The Potts model, Rev. Mod. Phys. 54, 235 (1982).
- Binder [1981] K. Binder, Finite size scaling analysis of Ising model block distribution functions, Zeitschrift für Physik B Condensed Matter 43, 119 (1981).
- Note [1] Comparing and , and .