Massive Galaxy Mergers Have Distinctive Global H I Profiles
Abstract
The global 21 cm H i emission-line profile of a galaxy encodes valuable information on the spatial distribution and kinematics of the neutral atomic gas. Galaxy interactions significantly influence the H i disk and imprint observable features on the integrated H i line profile. In this work, we study the neutral atomic gas properties of galaxy mergers selected from the Great Observatories All-sky LIRG Survey. The H i spectra come from new observations with the Five-hundred-meter Aperture Spherical Telescope and from a collection of archival data. We quantify the H i profile of the mergers with a newly developed method that uses the curve-of-growth of the line profile. Using a control sample of non-merger galaxies carefully selected to match the stellar mass of the merger sample, we show that mergers have a larger proportion of single-peaked H i profiles, as well as a greater tendency for the H i central velocity to deviate from the systemic optical velocity of the galaxy. By contrast, the H i profiles of mergers are not significantly more asymmetric than those of non-mergers.
1 Introduction
Galaxy mergers constitute an essential stage of galaxy evolution in a hierarchical universe. Toomre & Toomre (1972) proposed that mergers transform spirals into ellipticals. Galaxy-galaxy interactions promote gas dissipation, starburst activity, black hole growth, structural assembly, and morphological transformation (Barnes & Hernquist, 1992; Kormendy & Ho, 2013; Mundy et al., 2017). Quantifying the incidence of mergers, the type of mergers (e.g., gas richness and mass ratio), and the dependences on mass and environment are fundamental for the study of galaxy evolution (Darg et al., 2010; Lotz et al., 2010, 2011; Kampczyk et al., 2013). Multi-wavelength observations of diverse stages and types of mergers demonstrate that most interacting galaxies experience substantial dynamical evolution (Schweizer, 1986, 1996; Hibbard & van Gorkom, 1996; Surace et al., 2004; Oh et al., 2016; Brown & Wilson, 2019), which imparts significant irregularities in the distribution and kinematics of the gas and stars (Barrera-Ballesteros et al., 2015; Bloom et al., 2017, 2018; Feng et al., 2020). Numerical simulations (Barnes & Hernquist, 1996; Barnes, 2002; Kapferer et al., 2008) show that gravitational interactions lead to asymmetric gas distributions and velocity fields in galaxies. Asymmetric features can be long-lasting in the outer regions of the galaxy. Gas can be stripped by a companion, or it can flow inward due to the torque exerted by the companion or asymmetric structures formed during the interaction. The complex exchange of gas in different phases can boost the reservoir of molecular gas and replenish the atomic gas by cooling (Moreno et al., 2019).
The gas in the interstellar medium of interacting galaxies has been investigated both through observations and theory. The atomic and molecular gas of merging galaxies can be restructured, (e.g., Horellou et al. 2001; Yun & Hibbard 2001; Cullen et al. 2007), and the overall gas content can be enhanced (e.g., Larson et al. 2016; Ellison et al. 2018). Neutral atomic hydrogen (H i) traces the extended and diffuse gas distribution in galaxies. The H i disk can be easily distorted by tidal effects, making H i a sensitive tracer of galaxy interactions (e.g., Yun et al. 1994; Kornreich et al. 2000; Reichard et al. 2008). Images show that the H i of merging galaxies produce bridges and tails that can extend to several hundred kpc (e.g., Horellou et al. 2001; Yun & Hibbard 2001; Cullen et al. 2007), as well as forming intra-group clouds that can account for 10% of the H i in the entire interacting group (Serra et al., 2015). Interferometric observations can sensitively probe perturbations on the H i (Wang et al. 2013), but they are not widely available. While less information is contained in single-dish H i spectra, they nevertheless provide the atomic gas content, radial velocity, line width, profile asymmetry, and concentration (Yu et al., 2020). Single-dish surveys such as the H i Parkes All-Sky Survey (HIPASS: Koribalski et al. 2004), xGASS (Catinella et al., 2012, 2018), and ALFALFA (Haynes et al., 2011, 2018) have published tens of thousands of spectra for nearby galaxies.
The exact influences of galactic mergers on the shape of H i profiles have been inconclusive. In non-merger galaxies, gas accretion from the large-scale environment, minor mergers of satellite galaxies, encounters with a flyby galaxy, and interactions with the dark matter halo are all possible mechanisms that can perturb the distribution of H i and induce profile asymmetry (Mapelli et al., 2008; Sancisi et al., 2008; Lagos et al., 2018). In denser environments, the mechanisms that enhance H i asymmetry include ram pressure stripping (e.g., Gunn & Gott, 1972; Kenney et al., 2004), harrasment (e.g., Moore et al., 1996), tidal stripping (e.g., Moore et al. 1999; Koribalski & López-Sánchez 2009; English et al. 2010), and galactic mergers (e.g., Bok et al. 2019).
Previous investigations have not yielded a clear relation between H i profile asymmetry and the dynamical state of the galaxy. For example, even relatively isolated galaxies can exhibit high levels of profile asymmetry (Espada et al., 2011), while interacting systems can have symmetric profiles (Watts et al., 2021). Reynolds et al. (2020b) found no significant correlation between profile asymmetry and environment in their study of HIPASS galaxies, although within the xGASS sample profile asymmetry seems to be related to whether a galaxy is a central or a satellite of a group (Watts et al., 2020b). Within the local volume, profile asymmetry appears to increase with the local galactic density (Reynolds et al., 2020a). In their comparative analysis of galaxy pairs and isolated galaxies, Bok et al. (2019) found that merger activity indeed enhances asymmetry in the global H i profile, but in order to avoid observational confusion, they excluded very close pairs, and thus it is unclear whether the results are biased against close encounters, particularly late-stage mergers.
Recently, Yu et al. (2020) developed a new method to analyze one-dimensional spectral profiles, borrowing from the concept of the curve-of-growth (CoG), which is widely used in two-dimensional image analysis. In this paper, we apply the CoG method to analyze the integrated H i spectra of a subset of merger galaxies selected from the Great Observatories All-sky LIRG Survey (GOALS; Armus et al. 2009), a well-defined, infrared-selected sample consisting of 202 luminous, massive, low-redshift (), galaxies that are primarily mergers in different evolutionary stages. GOALS is arguably the best-studied sample of nearby starburst galaxies, one that possesses a large amount of ancillary multi-wavelength data (e.g., Spitzer: Inami et al. 2013; Herschel: Chu et al. 2017; HST: Haan et al. 2011; ALMA: Xu et al. 2015; Chandra: Iwasawa et al. 2011). The molecular gas (Larson et al., 2016; Yamashita et al., 2017) and dust (Herrero-Illana et al., 2019; Shangguan et al., 2019) properties have been investigated in detail. Missing, to date, is a systematic study of the H i properties.
We will statistically compare the H i spectra of mergers with those of a control sample of non-mergers, with the aim of ascertaining whether the H i profile can provide any useful tracers that can distinguish the two populations. In Section 2, we define the sample and introduce the new FAST observations. The CoG method is briefly introduced in Section 3. We compare the H i properties of mergers and control galaxies in Section 4. A summary of the main results is provided in Section 5. This work adopts the following parameters for a CDM cosmology: , , and km s-1 Mpc-1 (Planck Collaboration et al., 2016).
2 Data
We analyze 56 mergers contained in the GOALS sample, seven based on new H i observations obtained with FAST and 49 from published H i spectra collected from the NASA/IPAC Extragalactic Database (NED)111http://ned.ipac.caltech.edu/forms/SearchSpectra.html. We adopt the morphological classifications, based on optical and near-infrared images, from the studies of Stierwalt et al. (2013), Larson et al. (2016), and Jin et al. (2019). In addition, we analyze a control sample of non-mergers drawn from a representative sample of nearby galaxis recently studied by Yu et al. (2020). As the non-mergers have preferentially lower stellar masses than the mergers, we restrict the comparison only to the 80 control galaxies that statistically match the merger sample over the stellar mass range (Table 4).
2.1 FAST Observations
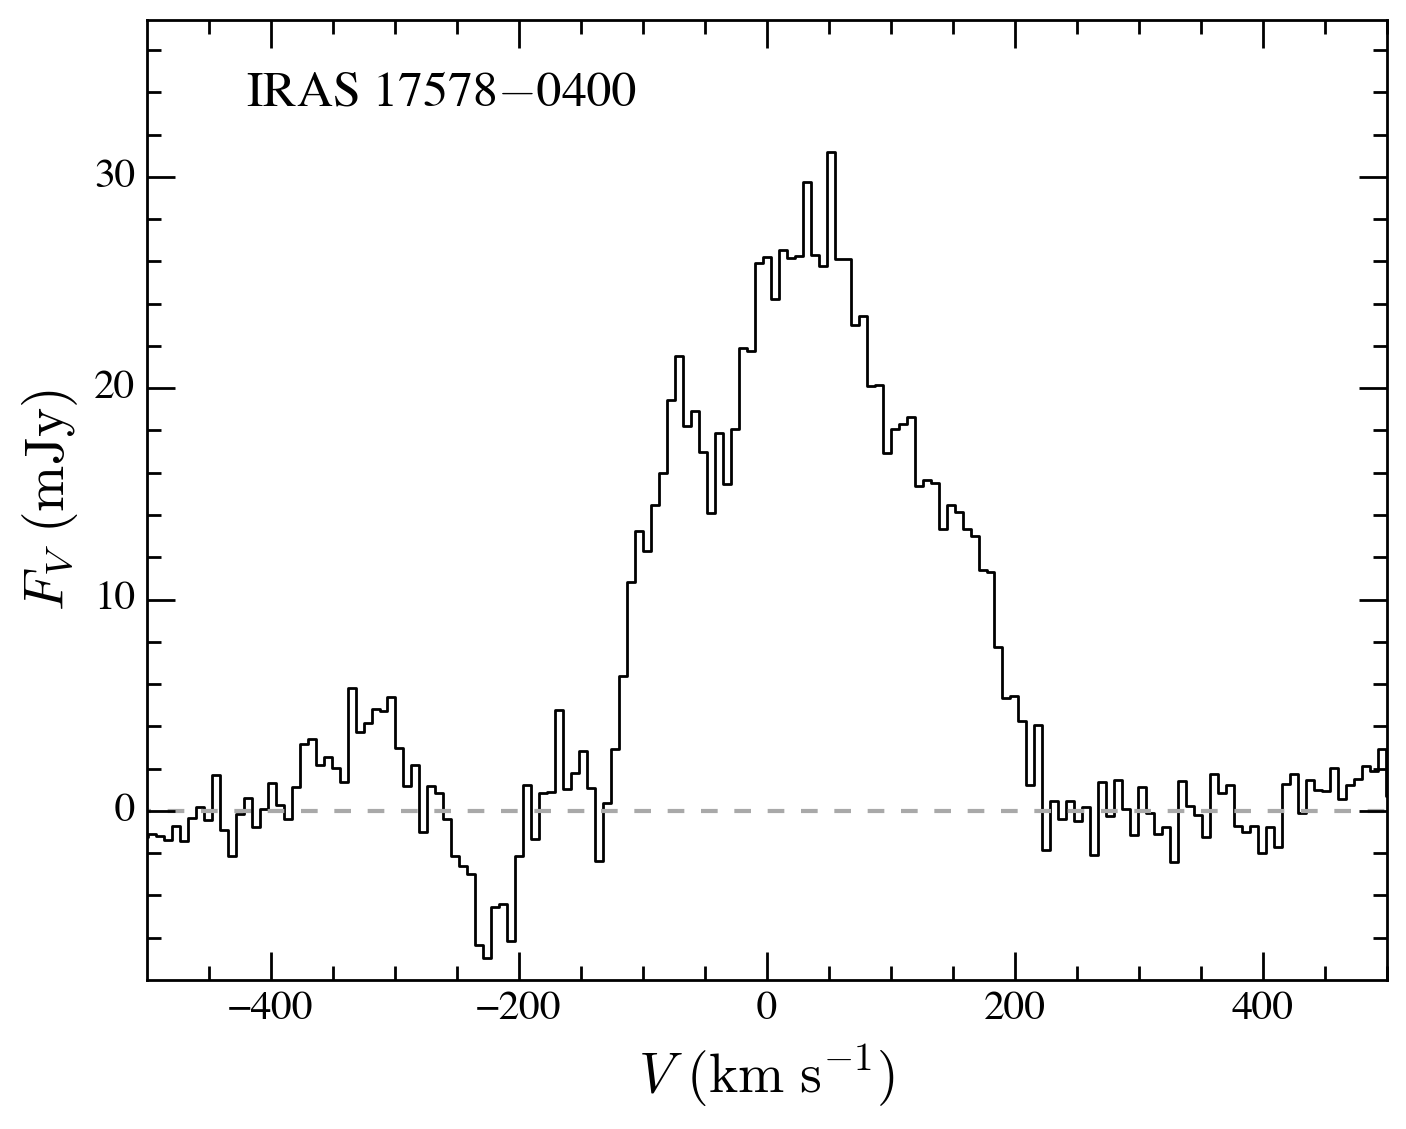
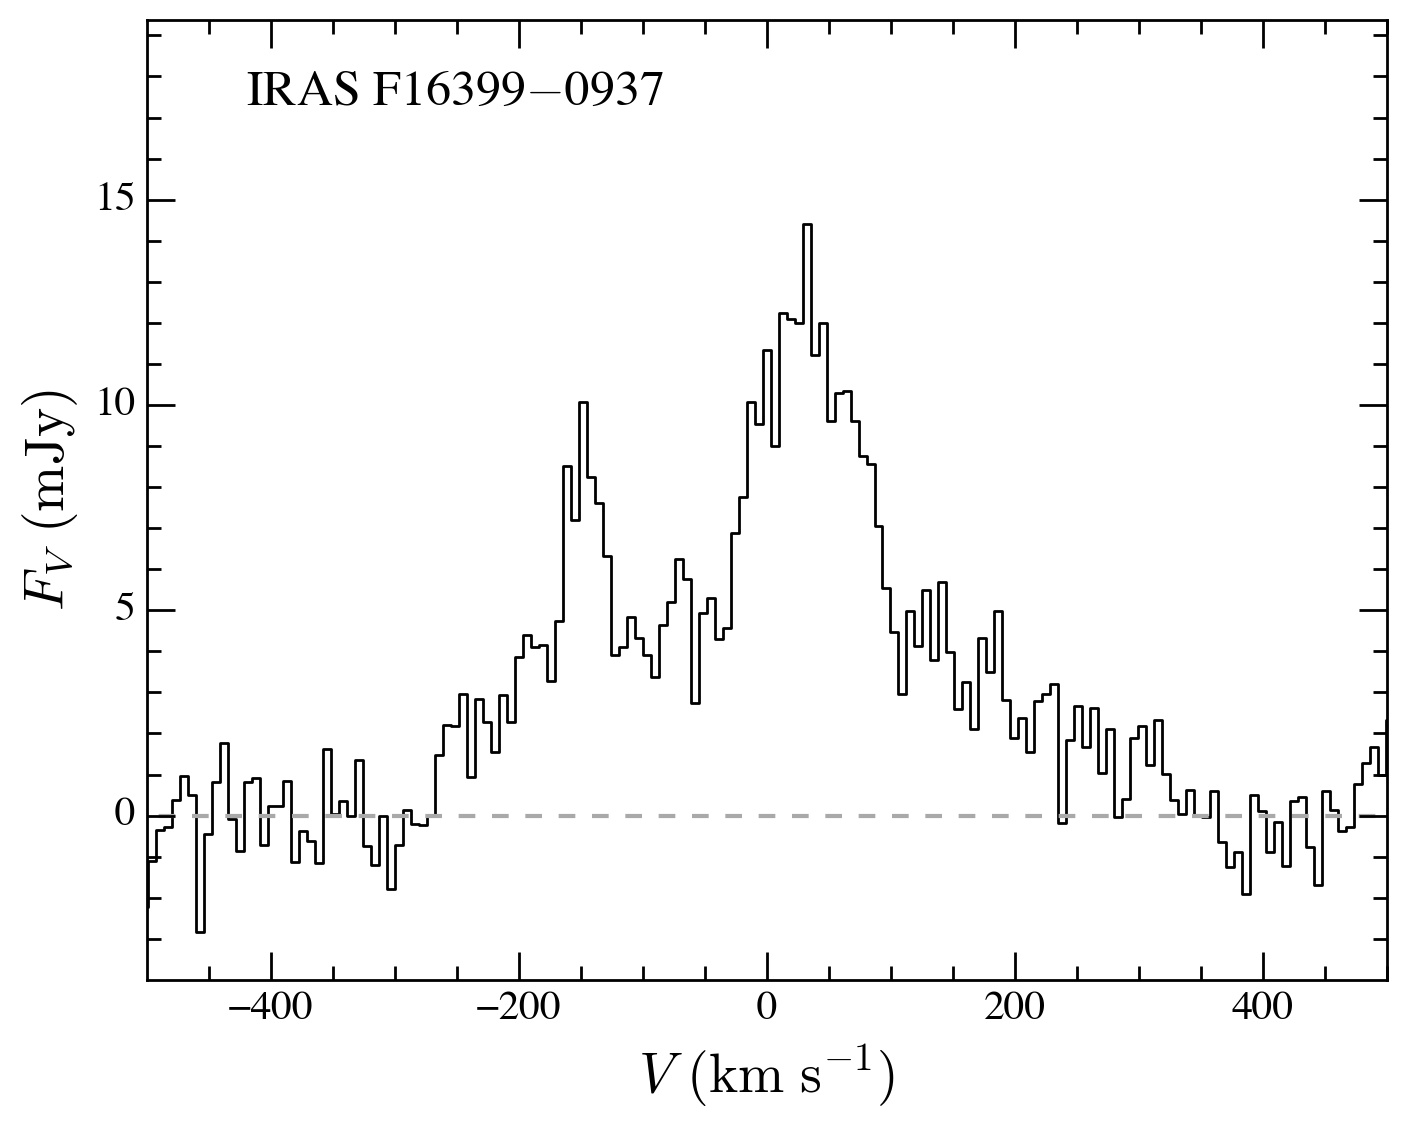
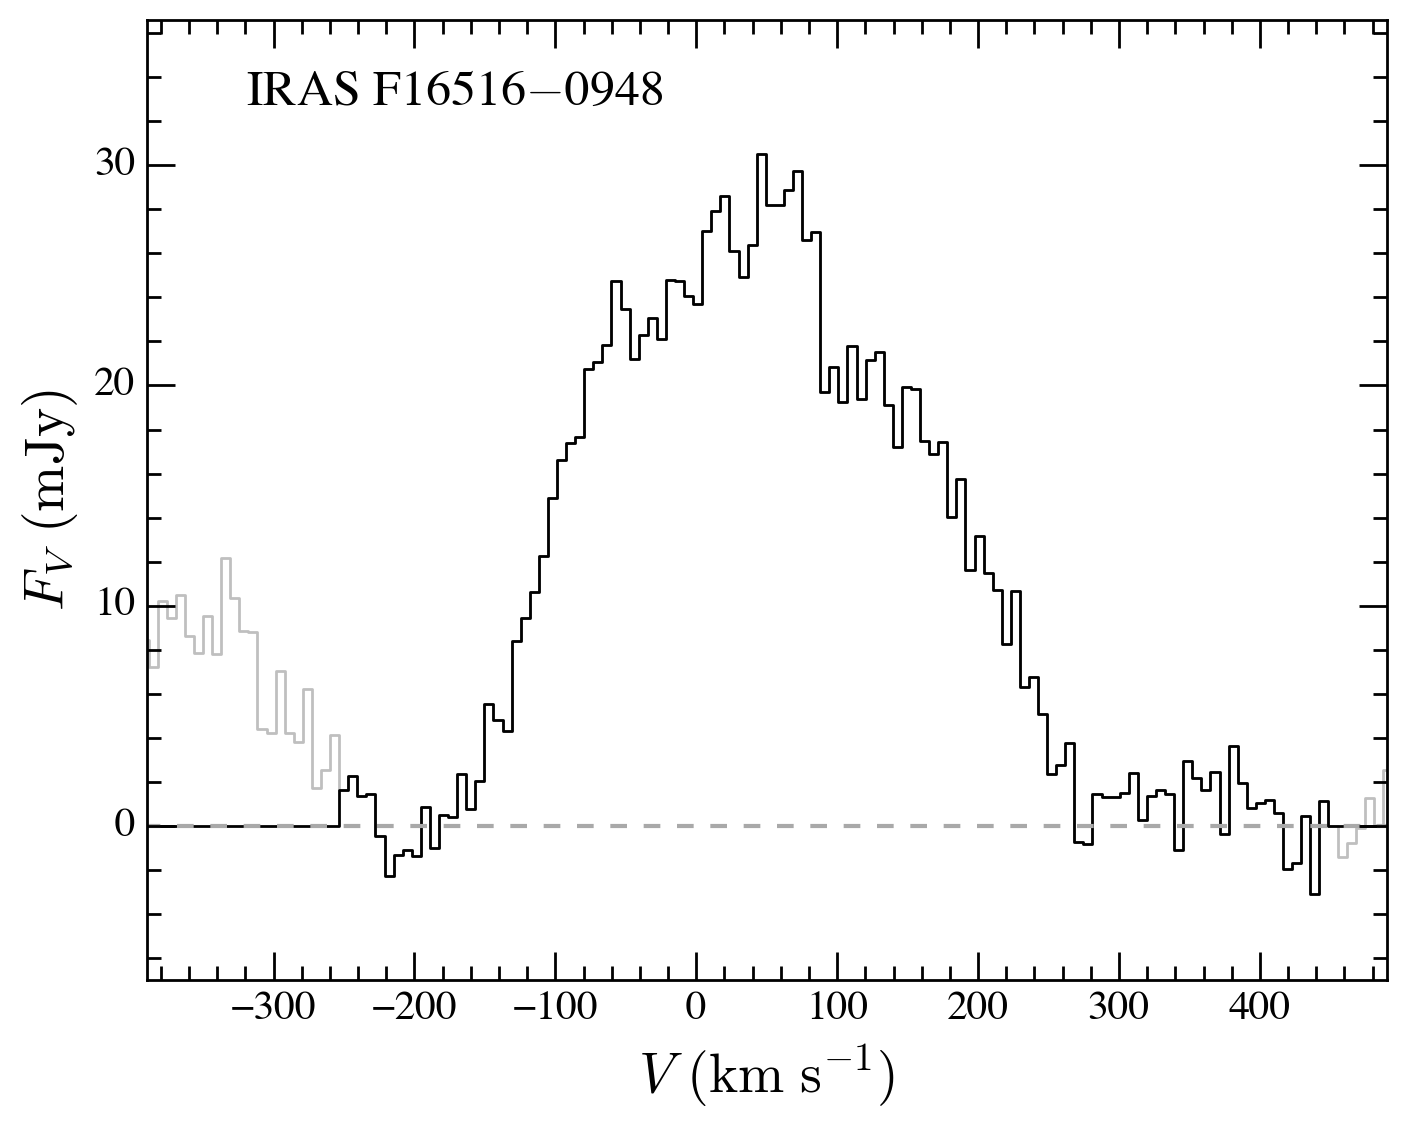
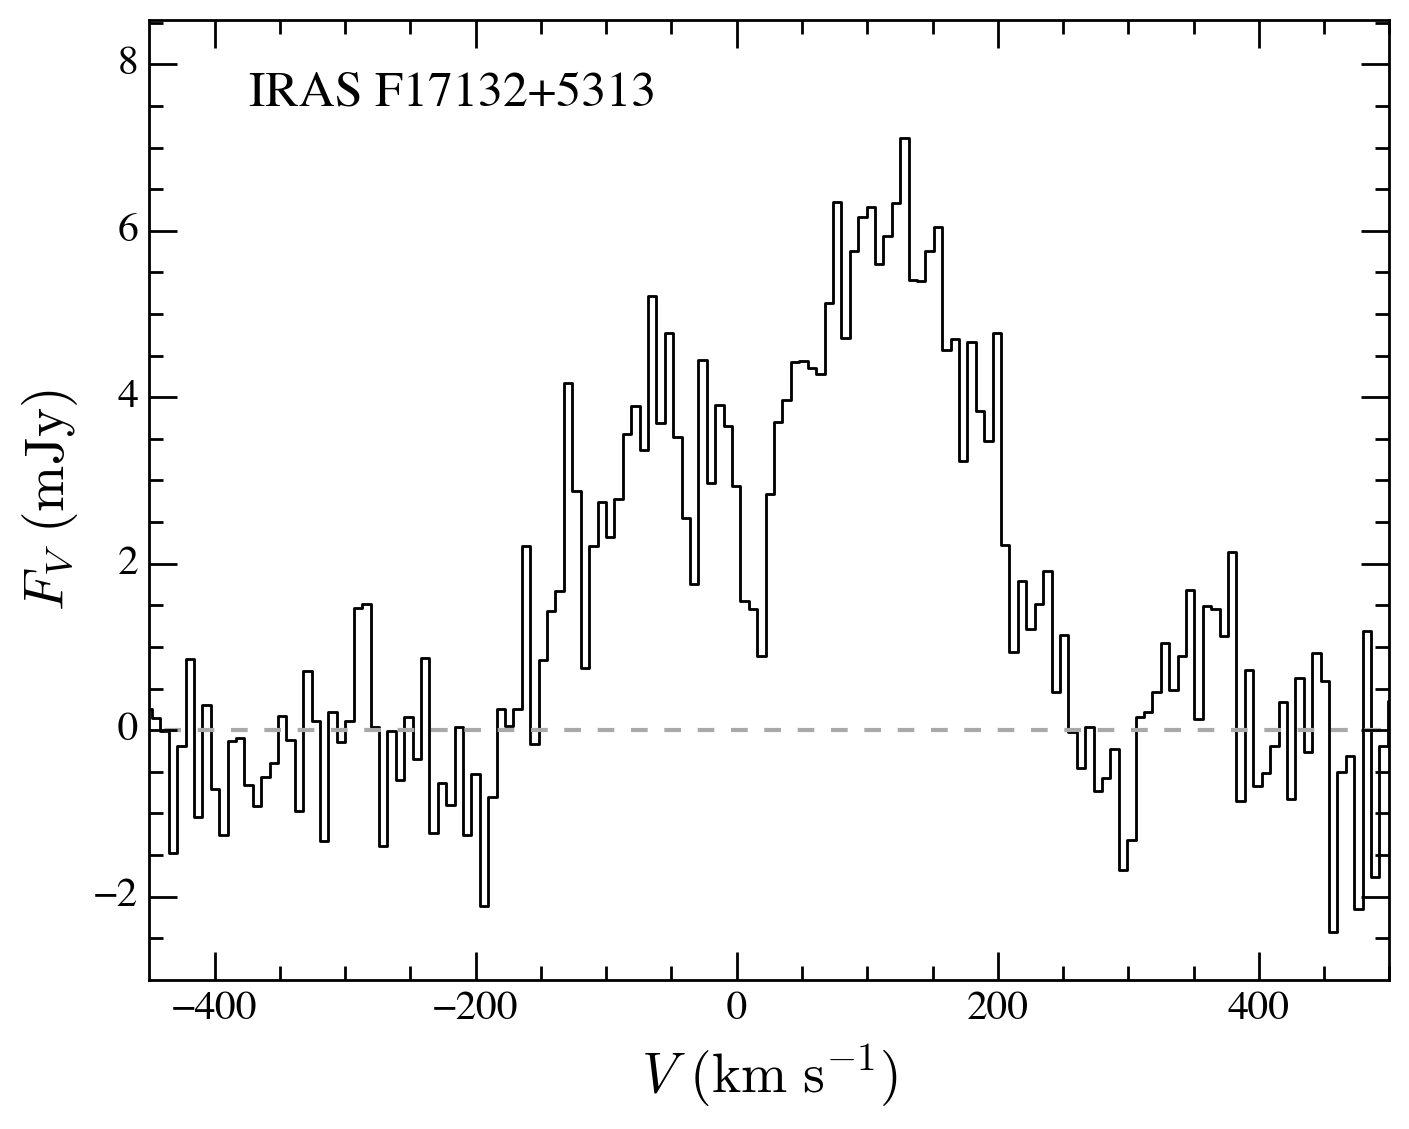
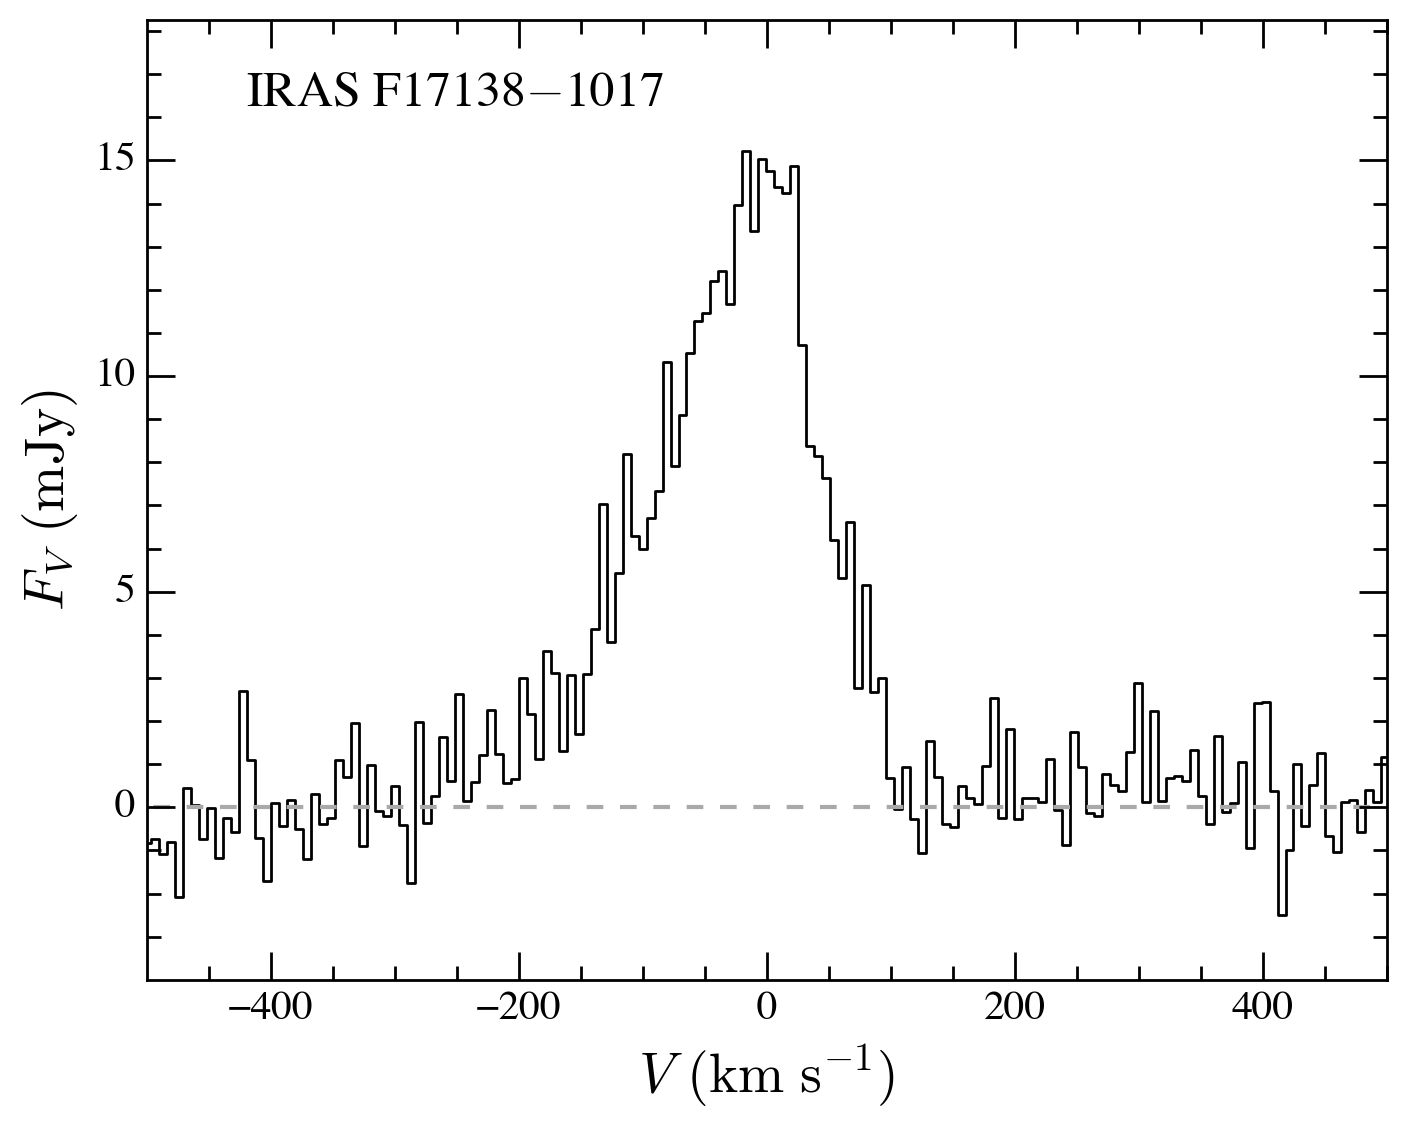
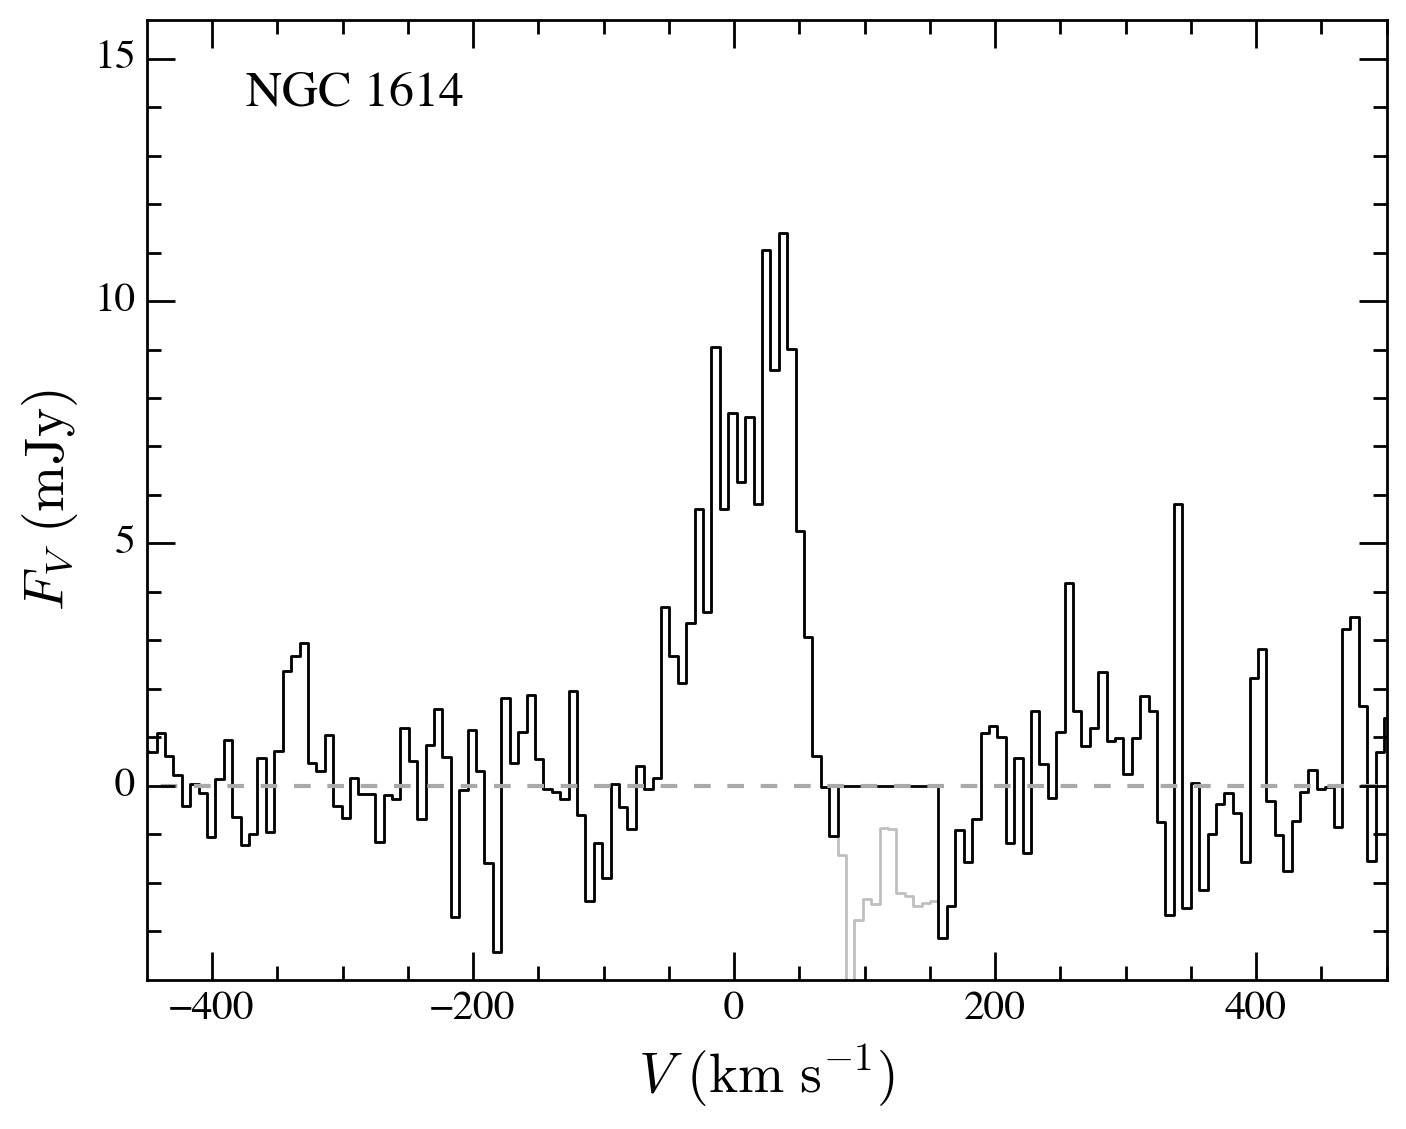
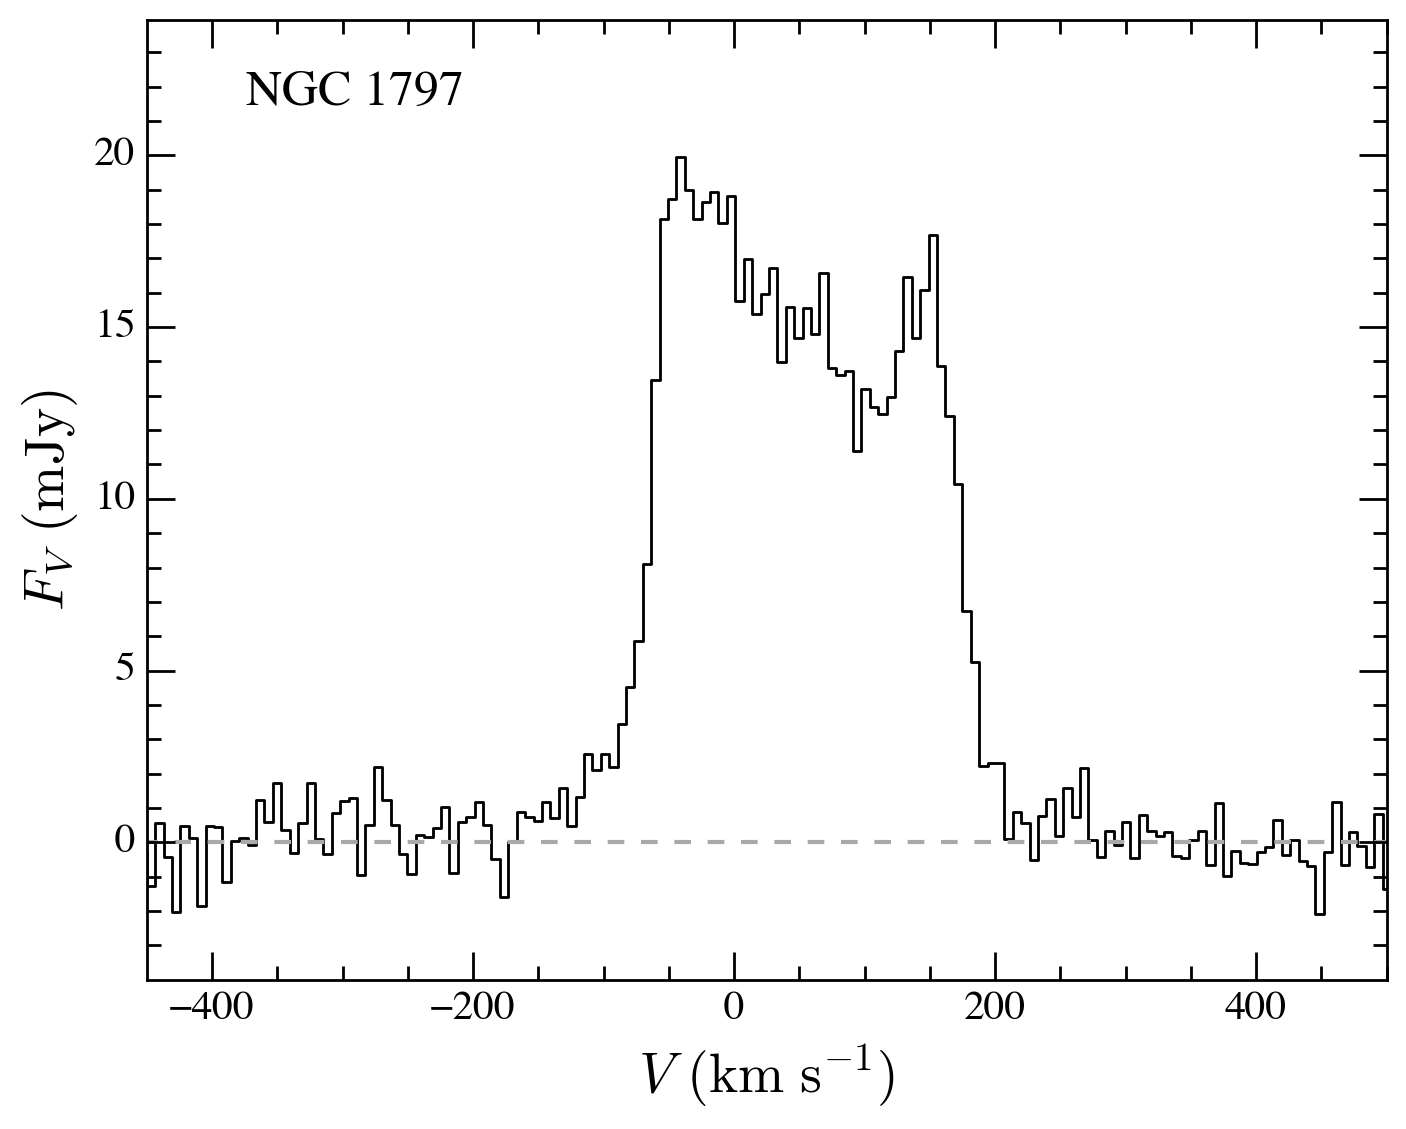
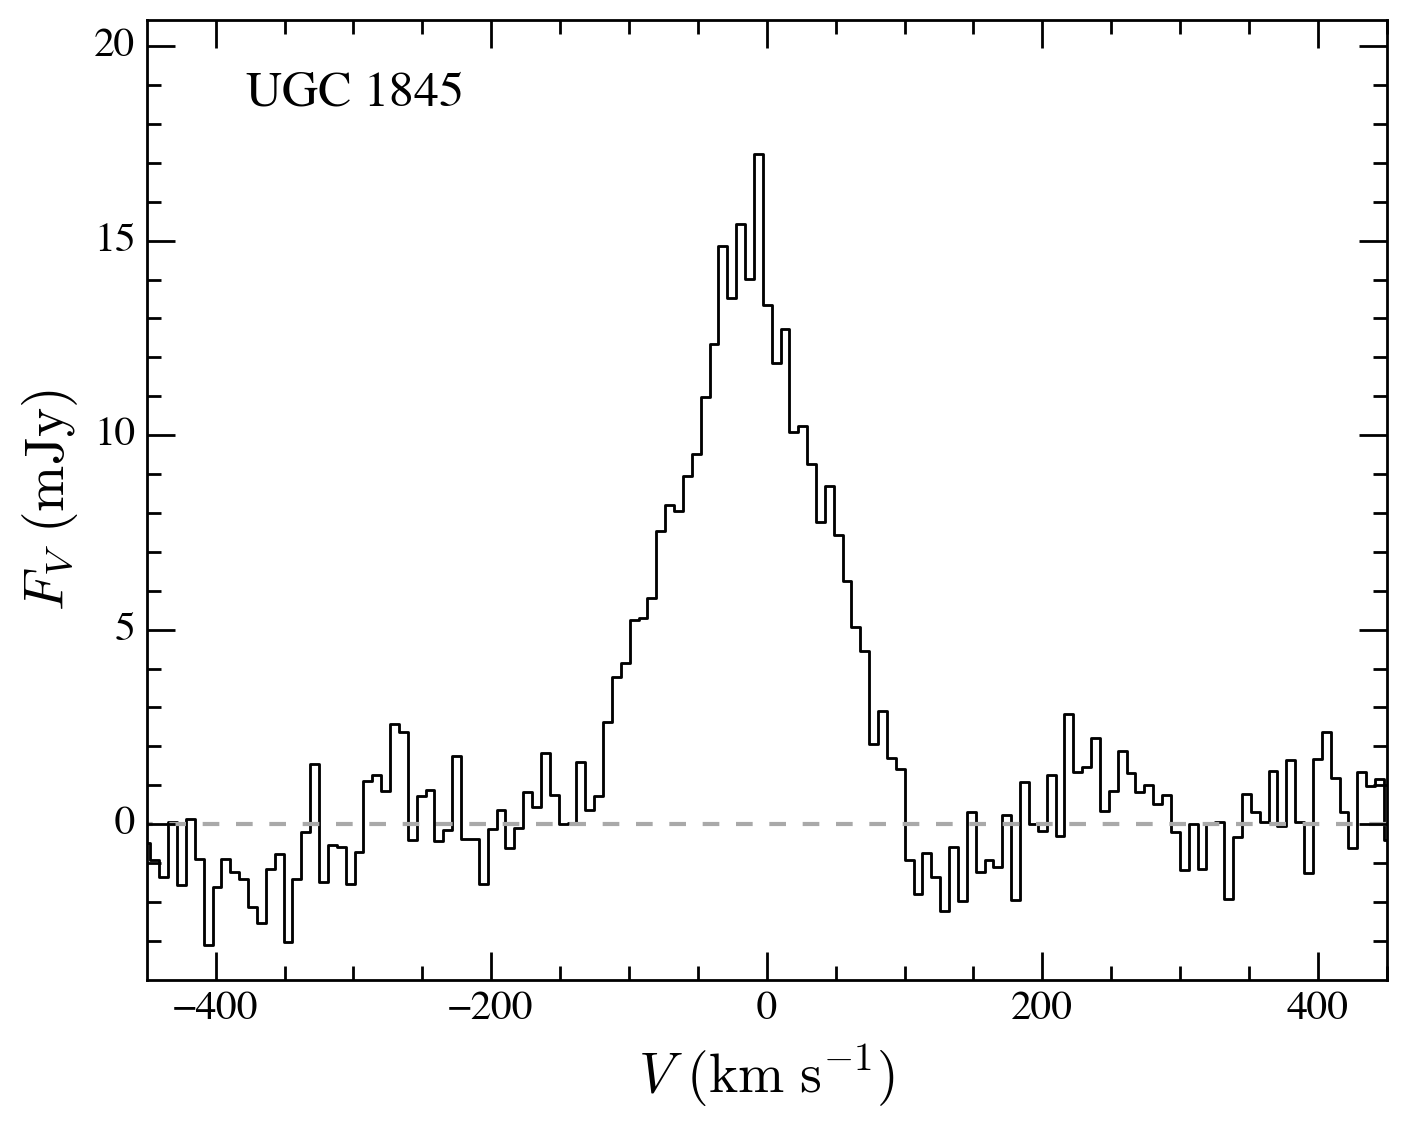
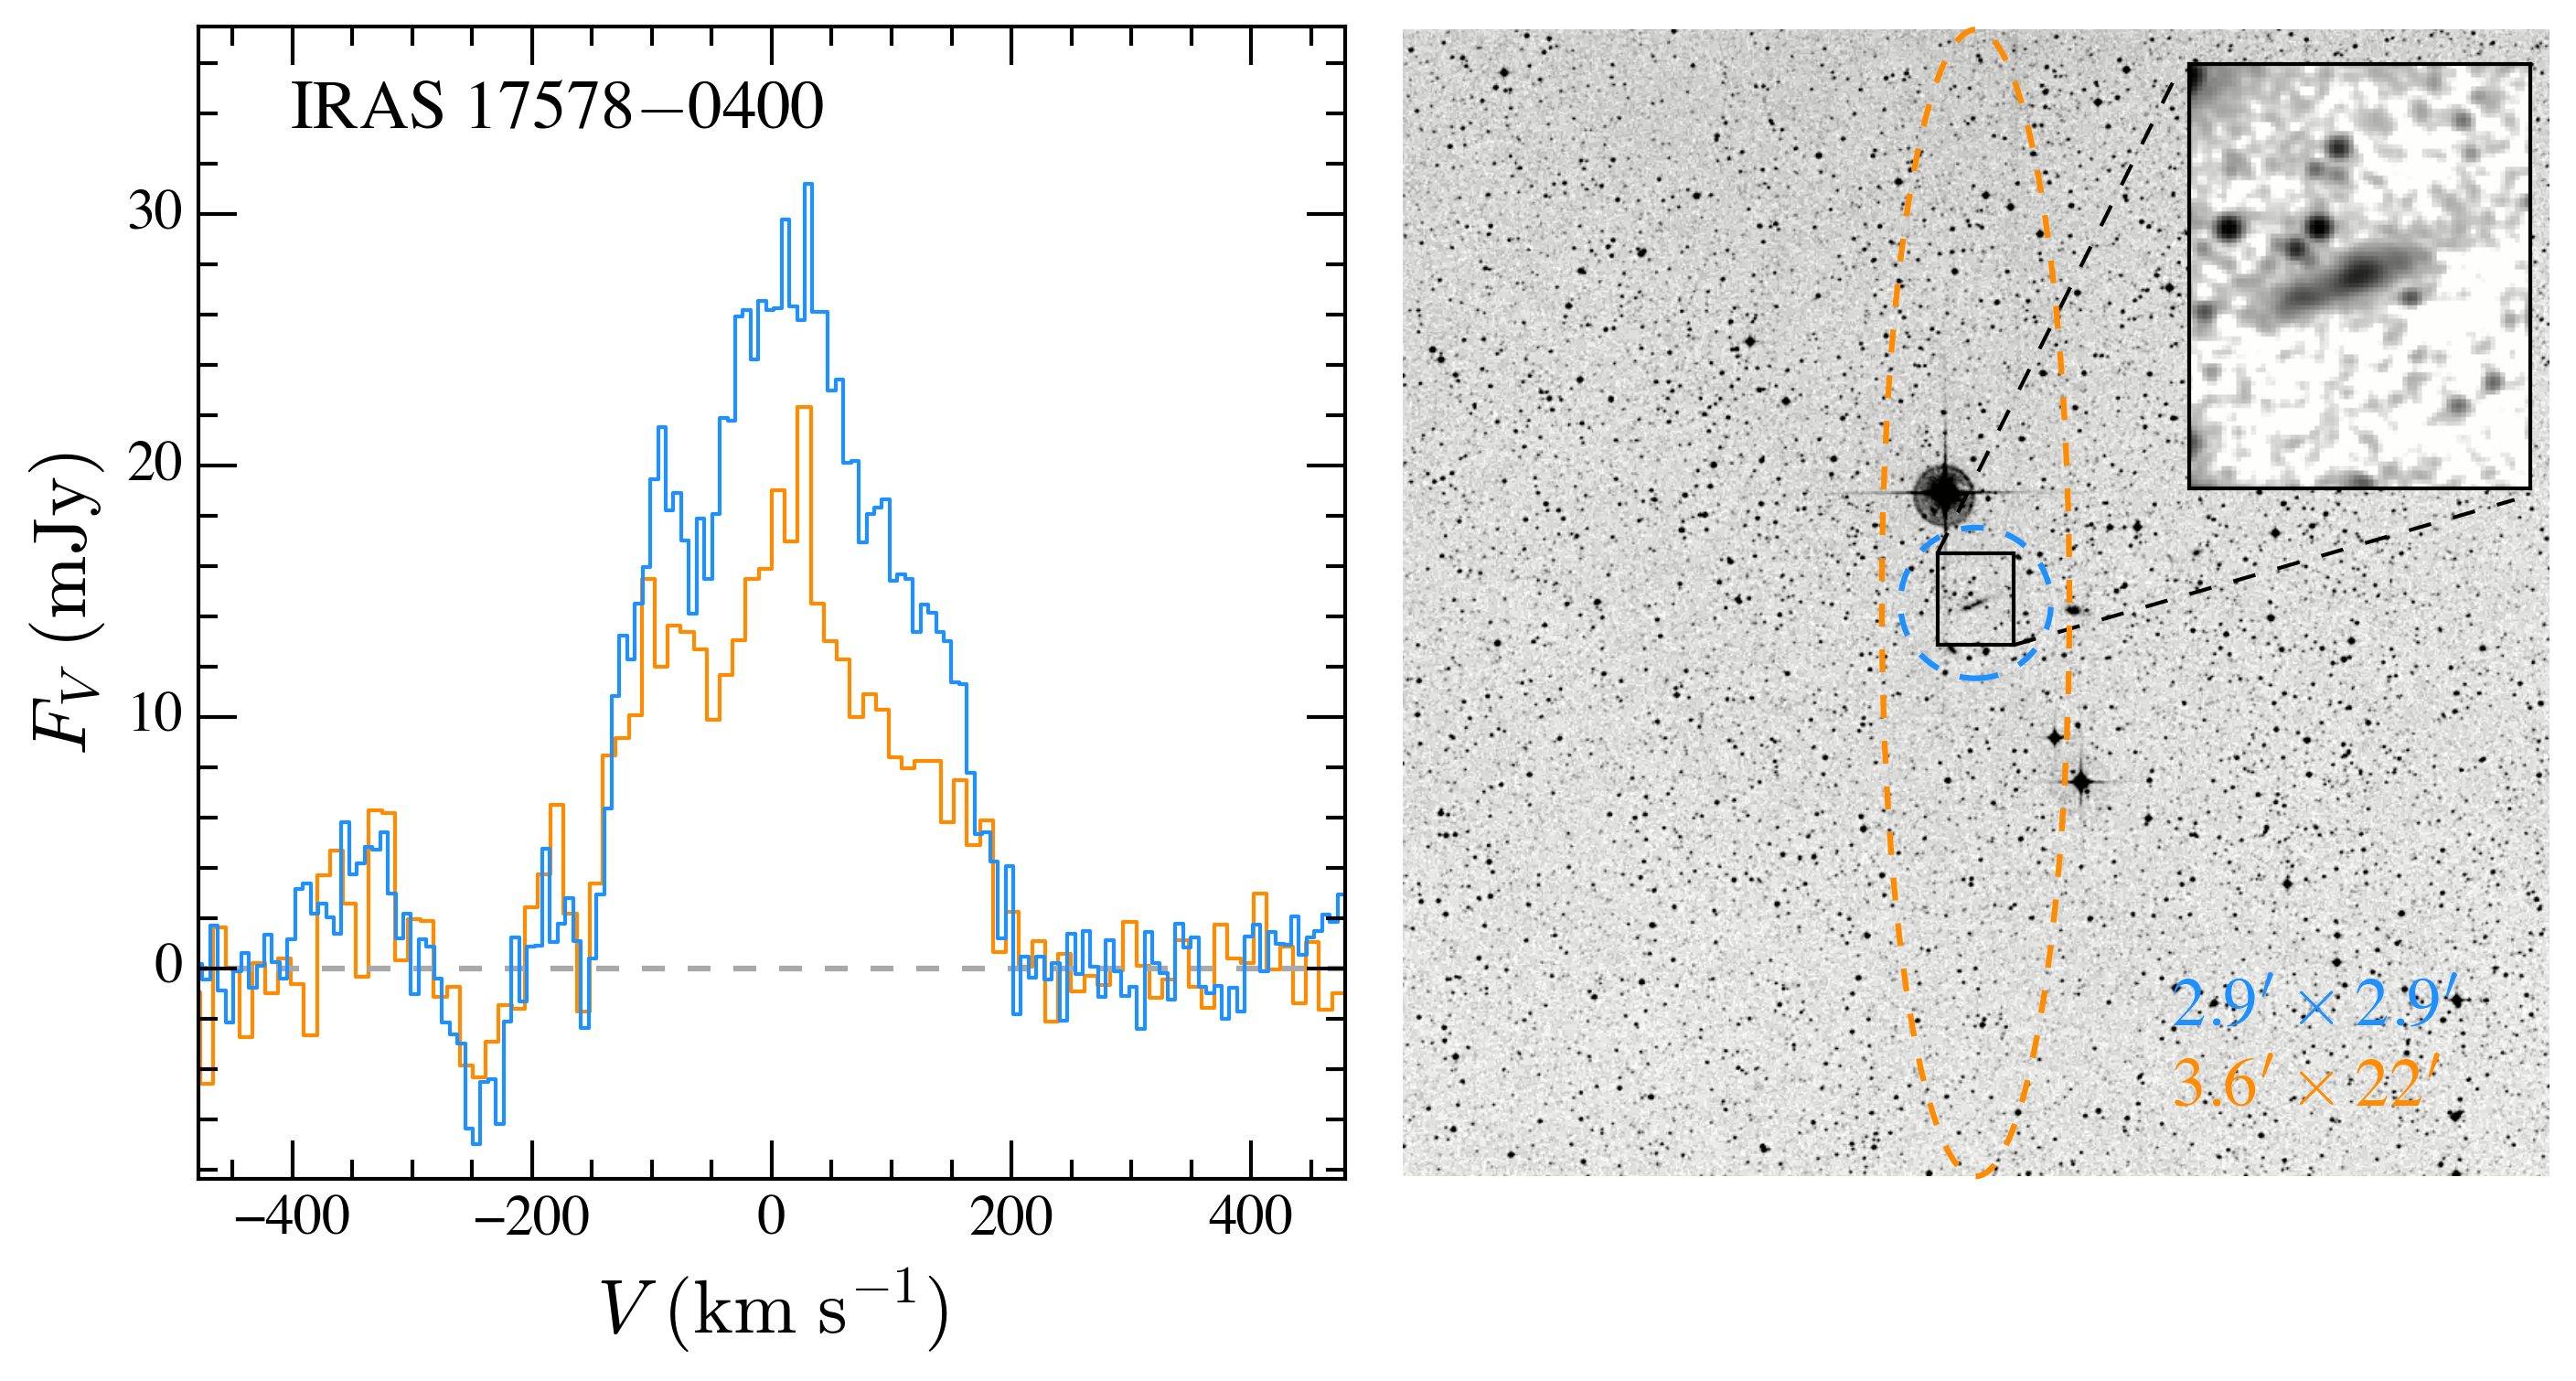
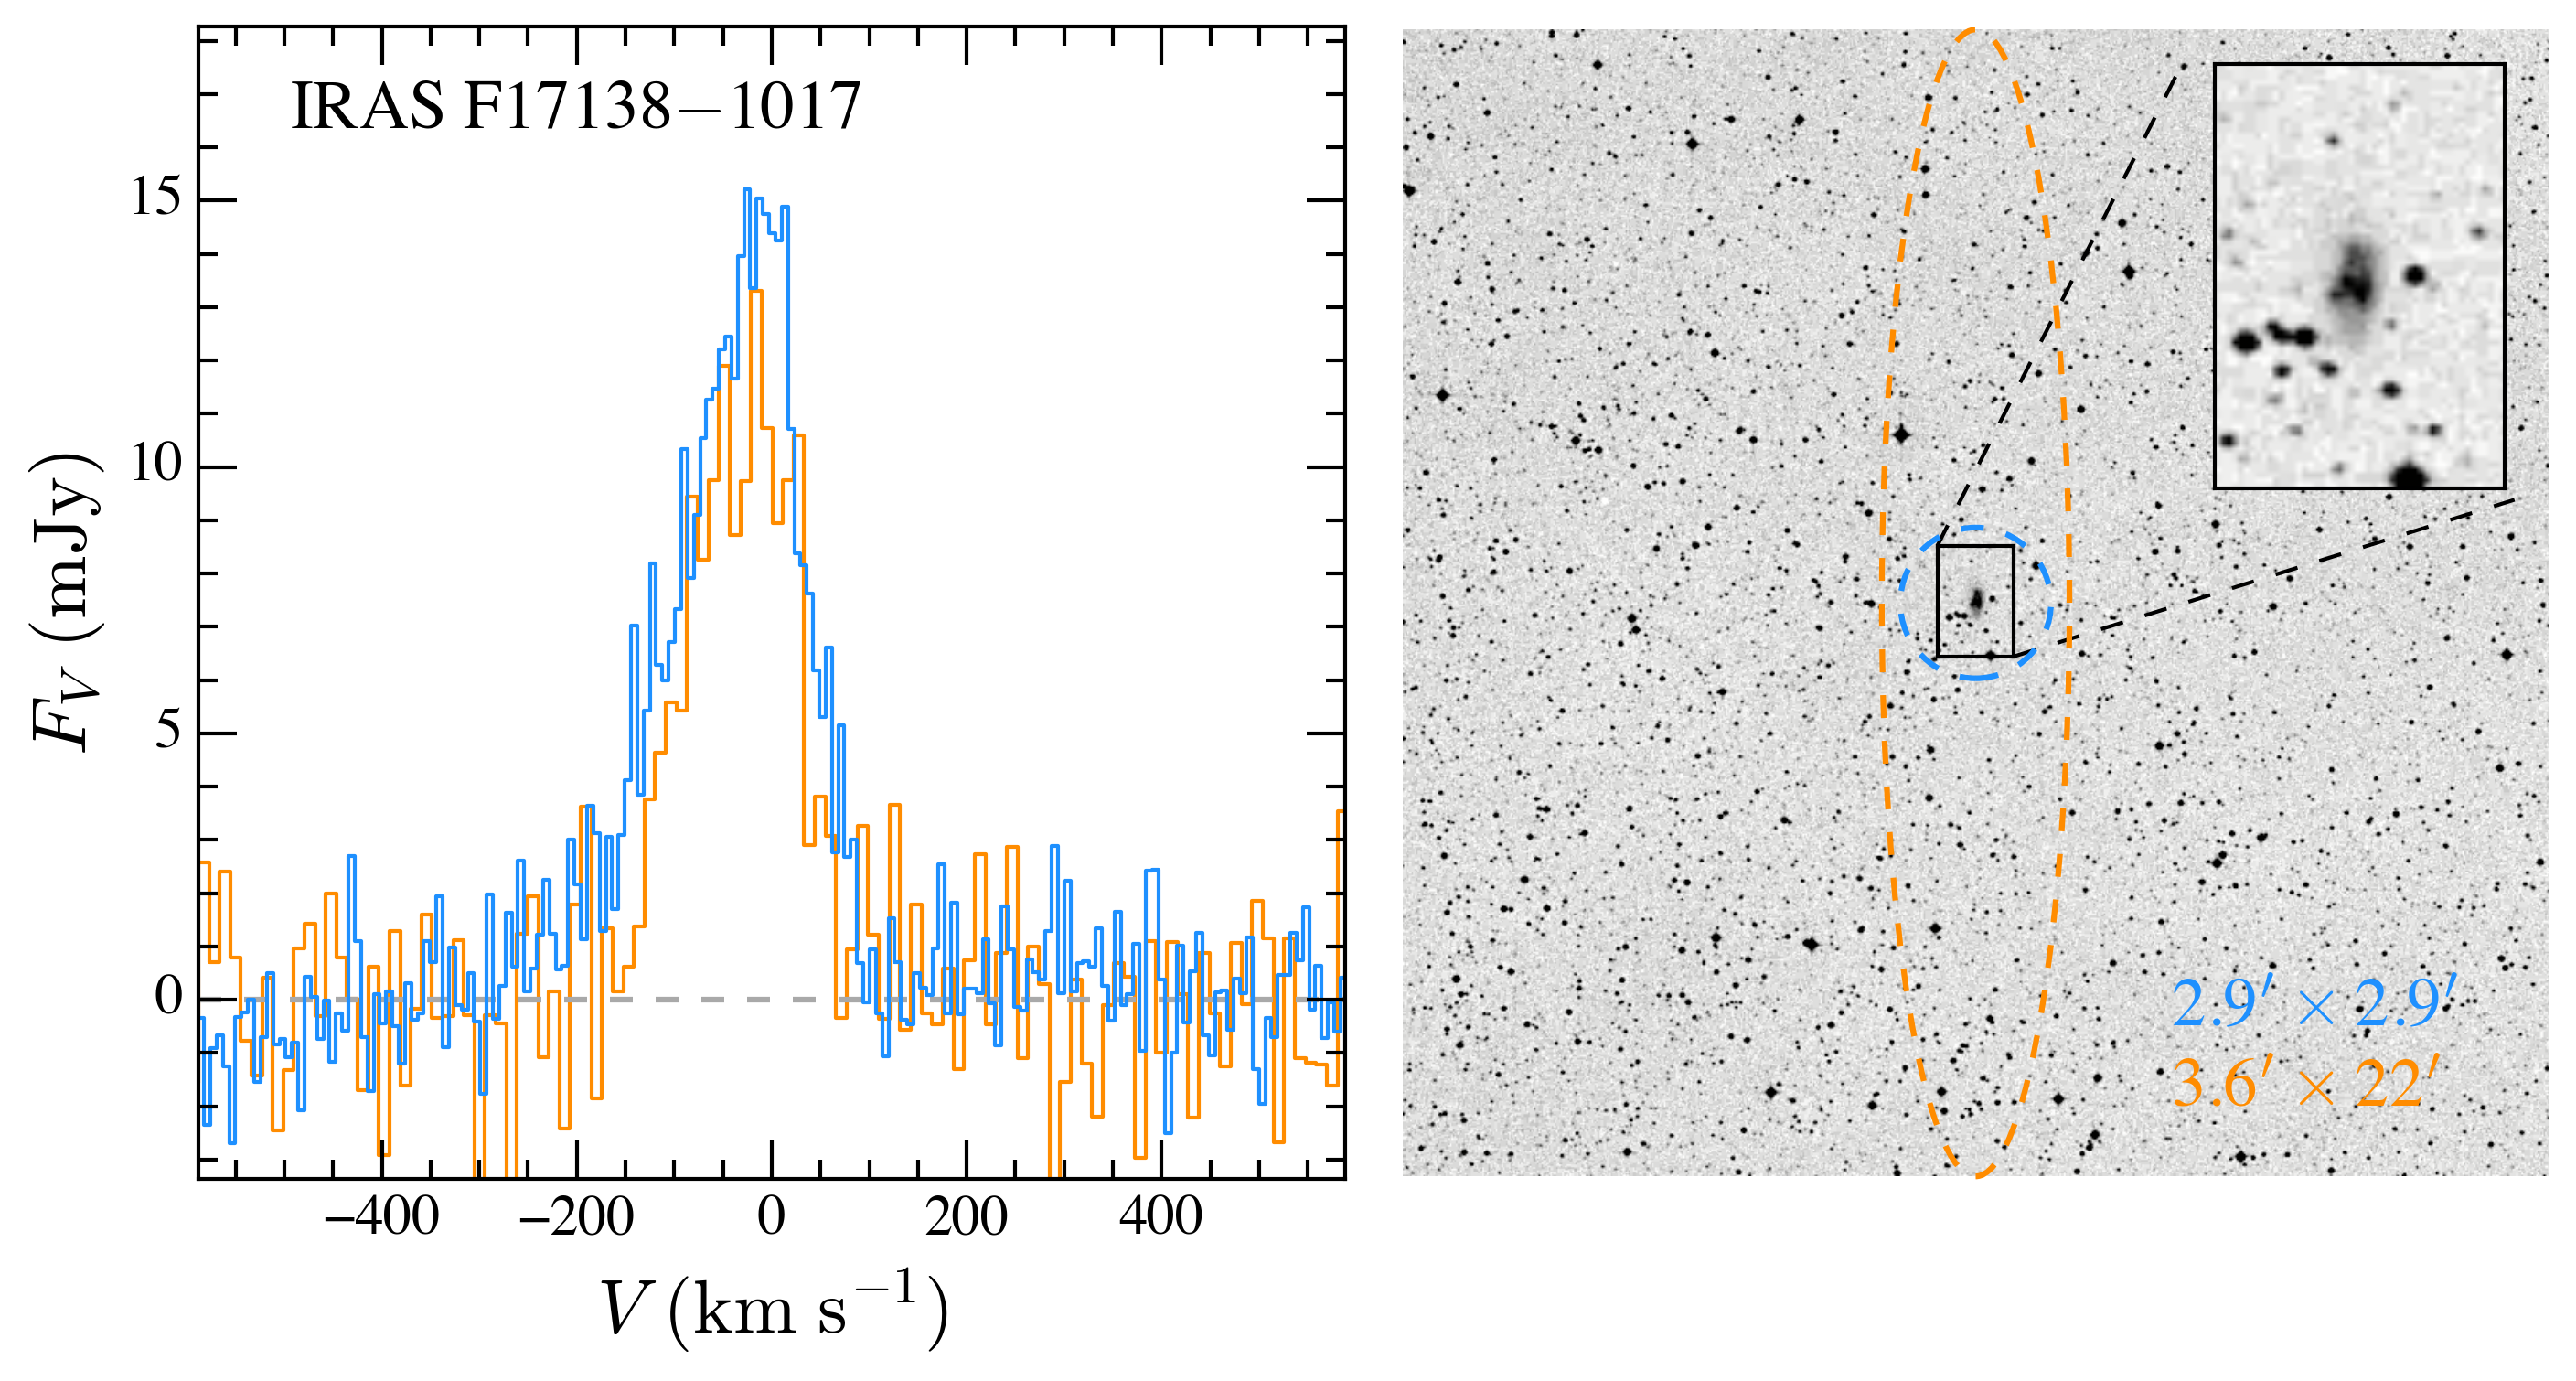
New FAST data for eight sources (Table 1; Figure 1) from the GOALS sample were acquired during a pilot cycle of “shared-risk” observations (PI: Ho; project code: 2019a-017-S). Six of the targets did not have prior H i observations, while two were deliberately chosen to be redundant with published observations in order to verify the performance of FAST. One source, UGC 1845, turns out to be a non-merger galaxy, and we did not include it in the following analysis. The observations, carried out using the 19-beam receiver at band ( GHz) in August 2019, were taken with the entire wide (500 MHz) band using the on-off mode and the central (M01) beam, using 300 s for each on and off pointing and s for switching between them. The beam size is . Using s sampling, the dual-polarization observations provide 0.475 kHz ( km s-1) spectral resolution covering 1,048,576 channels. We calibrate the flux intensity using data from the on-off noise diode, which were acquired during the observations, and we apply aperture efficiency correction based on Jiang et al. (2019). Scans and channels with radio frequency interference (RFI) were flagged. The data for each polarization were accumulated and averaged. A polynomial of order was used to fit the spectrum and subtract the baseline. The spectra were binned to a velocity resolution of km s-1 in order to be consistent with the spectral resolution of the archival data. The analysis results of the new H i data are listed in Table 3.
Two of the targets, IRAS 175780400 and IRAS F171381017, have prior observations by the Nanay telescope, affording an opportunity for a direct comparison with the FAST data (Figure 2). The FAST spectra show and higher total H i flux than those from Nanay, for IRAS 175780400 and IRAS F171381017, although the line profiles and velocity ranges are consistent. While typical uncertainties in total flux are expected to be 10%–15%, accounting for calibration (6%, Liu et al. in prep.) effects such as beam attenuation, pointing, flux calibration, and H i self-absorption (Springob et al., 2005), it is likely that the early Nanay measurements underestimate fluxes for the brightest, more extended sources (Haynes et al., 2011). van Driel et al. (2016) found that the multi-beam observations of Arecibo and Parkes yield fluxes higher than those of the single-receiver observations of Nanay. This excess is similar to those we find above. Nevertheless, there is good consistency for the asymmetry and concentration parameters of the H i profiles from the FAST and Nanay spectra.
| Galaxy | R. A. | Decl. | log | Quality | ||||
|---|---|---|---|---|---|---|---|---|
| (J2000) | (J2000) | (Mpc) | () | (MHz) | ||||
| (1) | (2) | (3) | (4) | (5) | (6) | (7) | (8) | |
| IRAS 175780400aaHas previous H I observation. | 18:00:28.61 | 04:01:16.3 | 0.0140 | 70.6 | 10.27 0.20 | 1400.79 | I | |
| IRAS F163990937 | 16:42:40.11 | 09:43:13.7 | 0.0270 | 131.5 | 11.00 0.20 | 1383.06 | II | |
| IRAS F165160948 | 16:54:23.72 | 09:53:20.9 | 0.0227 | 111.6 | 10.73 0.20 | 1388.88 | II | |
| IRAS F171325313 | 17:14:20.45 | 53:10:31.6 | 0.0509 | 238.9 | 11.00 0.20 | 1351.61 | II | |
| IRAS F171381017aaHas previous H I observation. | 17:16:35.68 | 10:20:40.5 | 0.0173 | 86.6 | 10.72 0.20 | 1396.25 | ||
| NGC 1614 | 04:33:59.95 | 08:34:47.0 | 0.0159 | 69.9 | 10.85 0.20 | 1398.17 | I, II | |
| NGC 1797 | 05:07:44.84 | 08:01:08.7 | 0.0149 | 65.7 | 10.61 0.20 | 1399.55 | ||
| UGC 1845bbThis source is a non-merger galaxy in the GOALS sample, and we do not include it in the analysis. | 02:24:07.97 | 47:58:11.9 | 0.0156 | 69.1 | 10.57 0.20 | 1398.59 | I, II |
Note. — Column (1): Galaxy name. Columns (2)–(3) Equatorial coordinates (J2000). Column (4): Redshift from NED. Column (5): Luminosity distance from Shangguan et al. (2019), derived from the heliocentric velocity corrected for the three-attractor flow model of Mould et al. (2000) using , , and km s-1 Mpc-1 (Planck Collaboration et al., 2016). Column (6): Stellar mass from Shangguan et al. (2019). Column (7): Central frequency for the observation. Column (8): Quality flag: I = scans with strong radio frequency interferences removed; II = channels with strong radio frequency interferences flagged.
2.2 Data from the Literature
With the aid of NED, we located single-dish H i spectra for 82 GOALS sources. After excluding 18 sources classified by Stierwalt et al. (2013), Larson et al. (2016), and Jin et al. (2019) as non-mergers and another 13 that exhibit prominent H i absorption, which is frequently associated with active galactic nuclei with strong radio continuum emission (Geréb et al., 2015; Glowacki et al., 2017; Maccagni et al., 2017) and radio-loud galaxy mergers (Dutta et al., 2019), we are left with 51 mergers (Table 2). Among these, two have new FAST observation (Section 2.1; Figure 2), and we adopt the new data in the subsequent analysis.
If multiple spectra of the same target are available from the same telescope, we chose the one with the highest velocity resolution and sensitivity. When more than one H i spectrum exists, we adopted the one observed with the smallest beam that can cover the entire galaxy merger system. Meanwhile, we confirm through visual inspection of optical images that there is no contamination from nearby sources within the H i beam and within 1000 km s-1 of H i central velocity. Most of the spectra were obtained using Arecibo, which, with a beam of , has the highest sensitivity and spatial resolution. By contrast, Parkes has a beam, while that of Nanay is . The spectral resolution of the final spectra ranges from 6.6 to 22.0 km s-1, with a median value of 10.5 km s-1. There are 21 archival H i spectra from Arecibo, 14 from Green Bank Telescope (GBT) 90-m, 11 from Nanay, two from Parkes, two from Jodrell Bank Lovell, and one from the GBT 110-m.
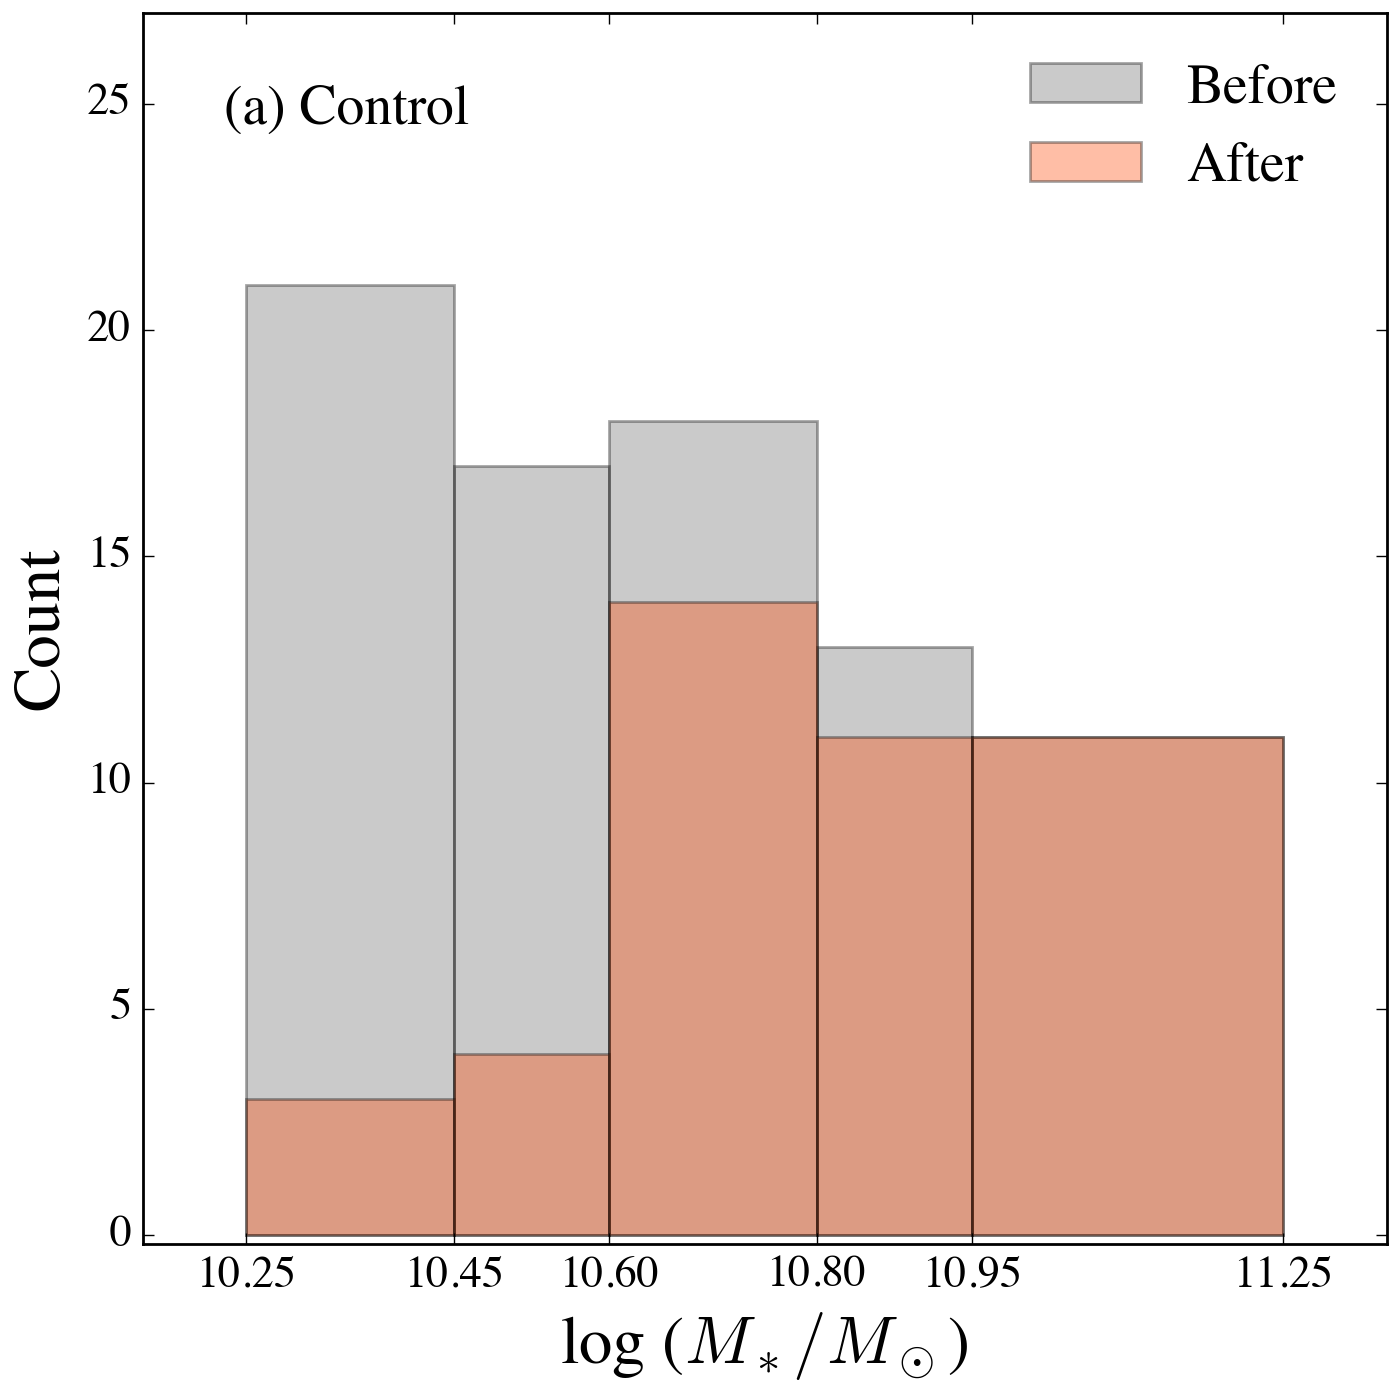
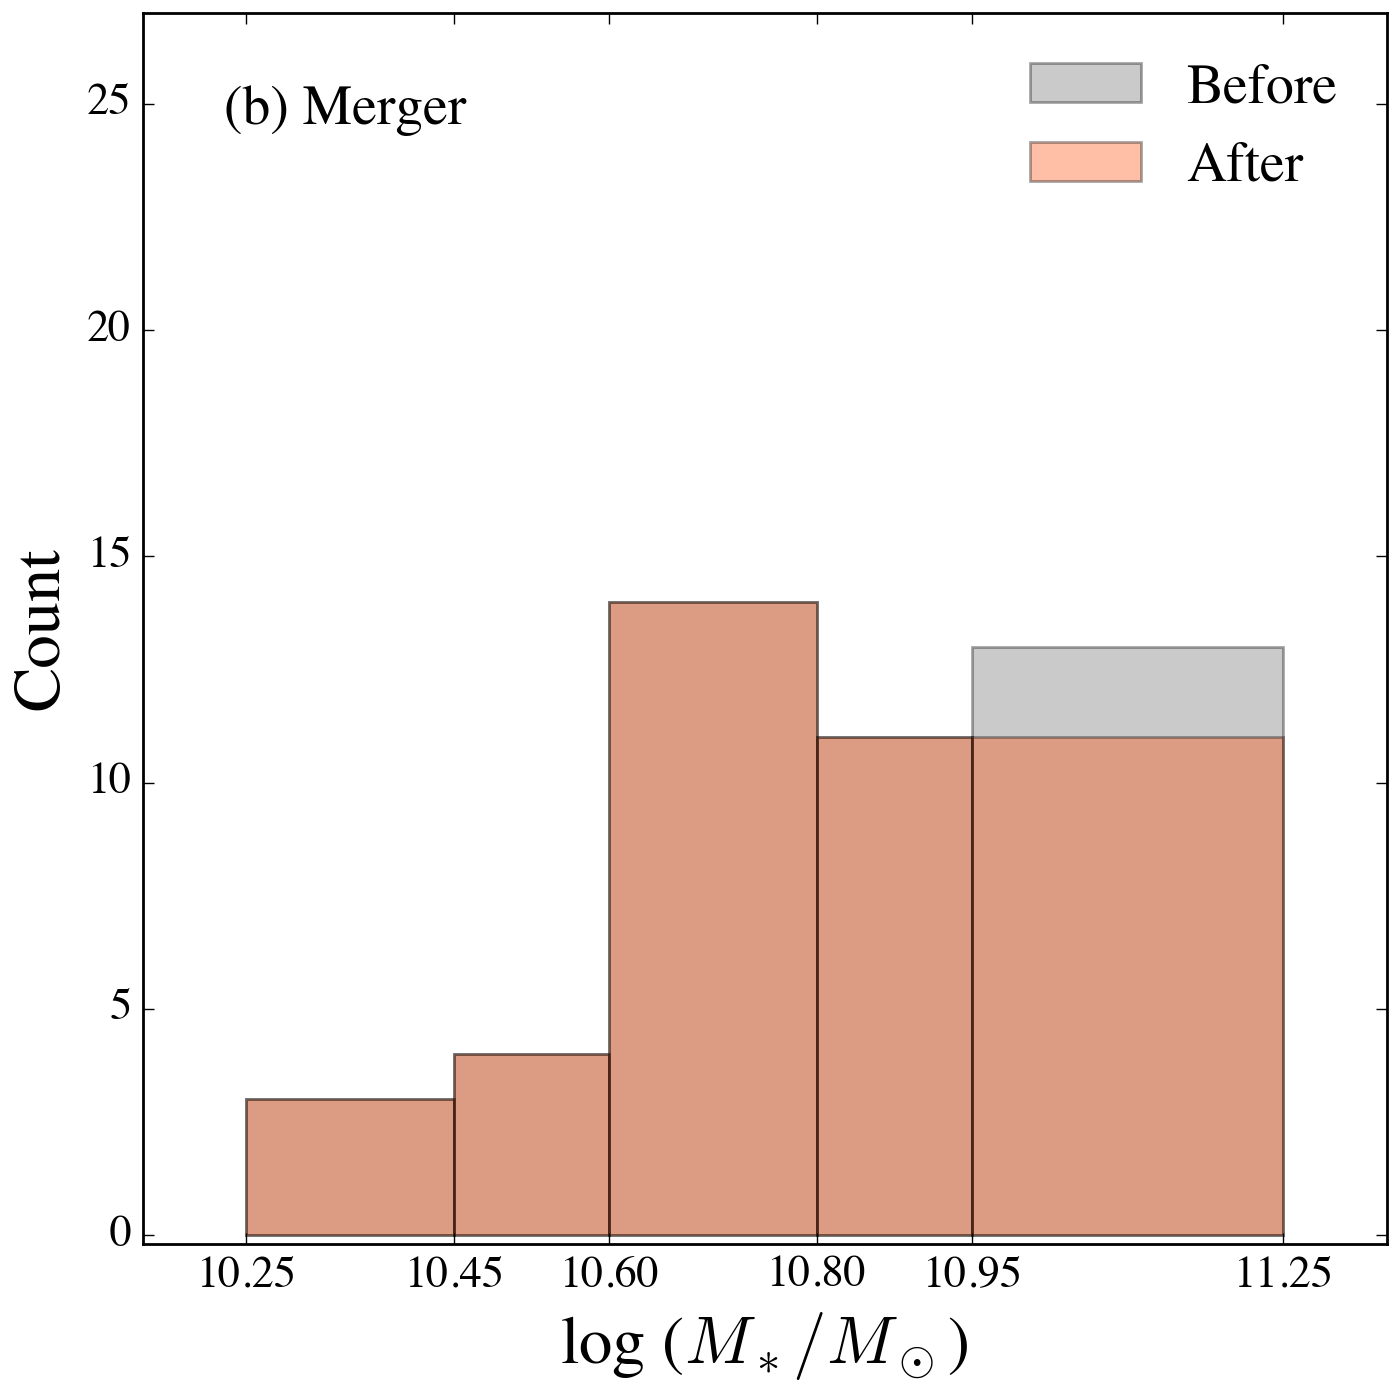
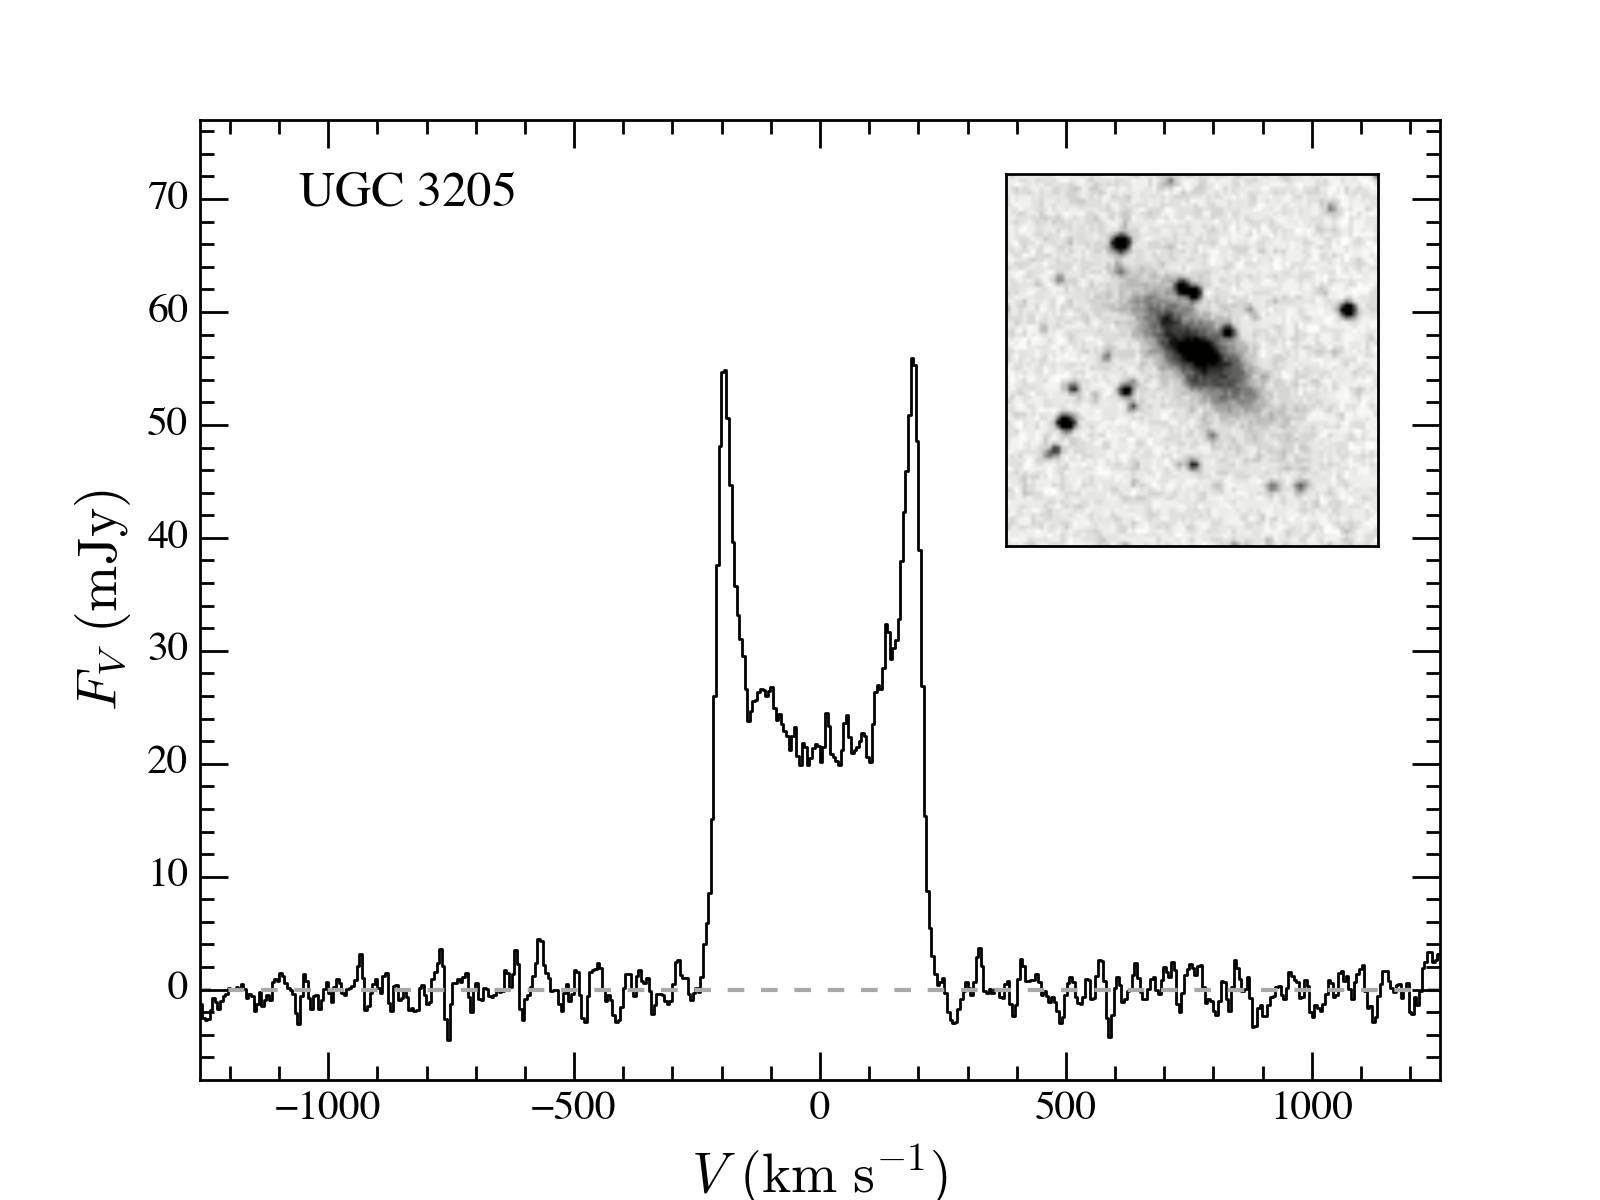
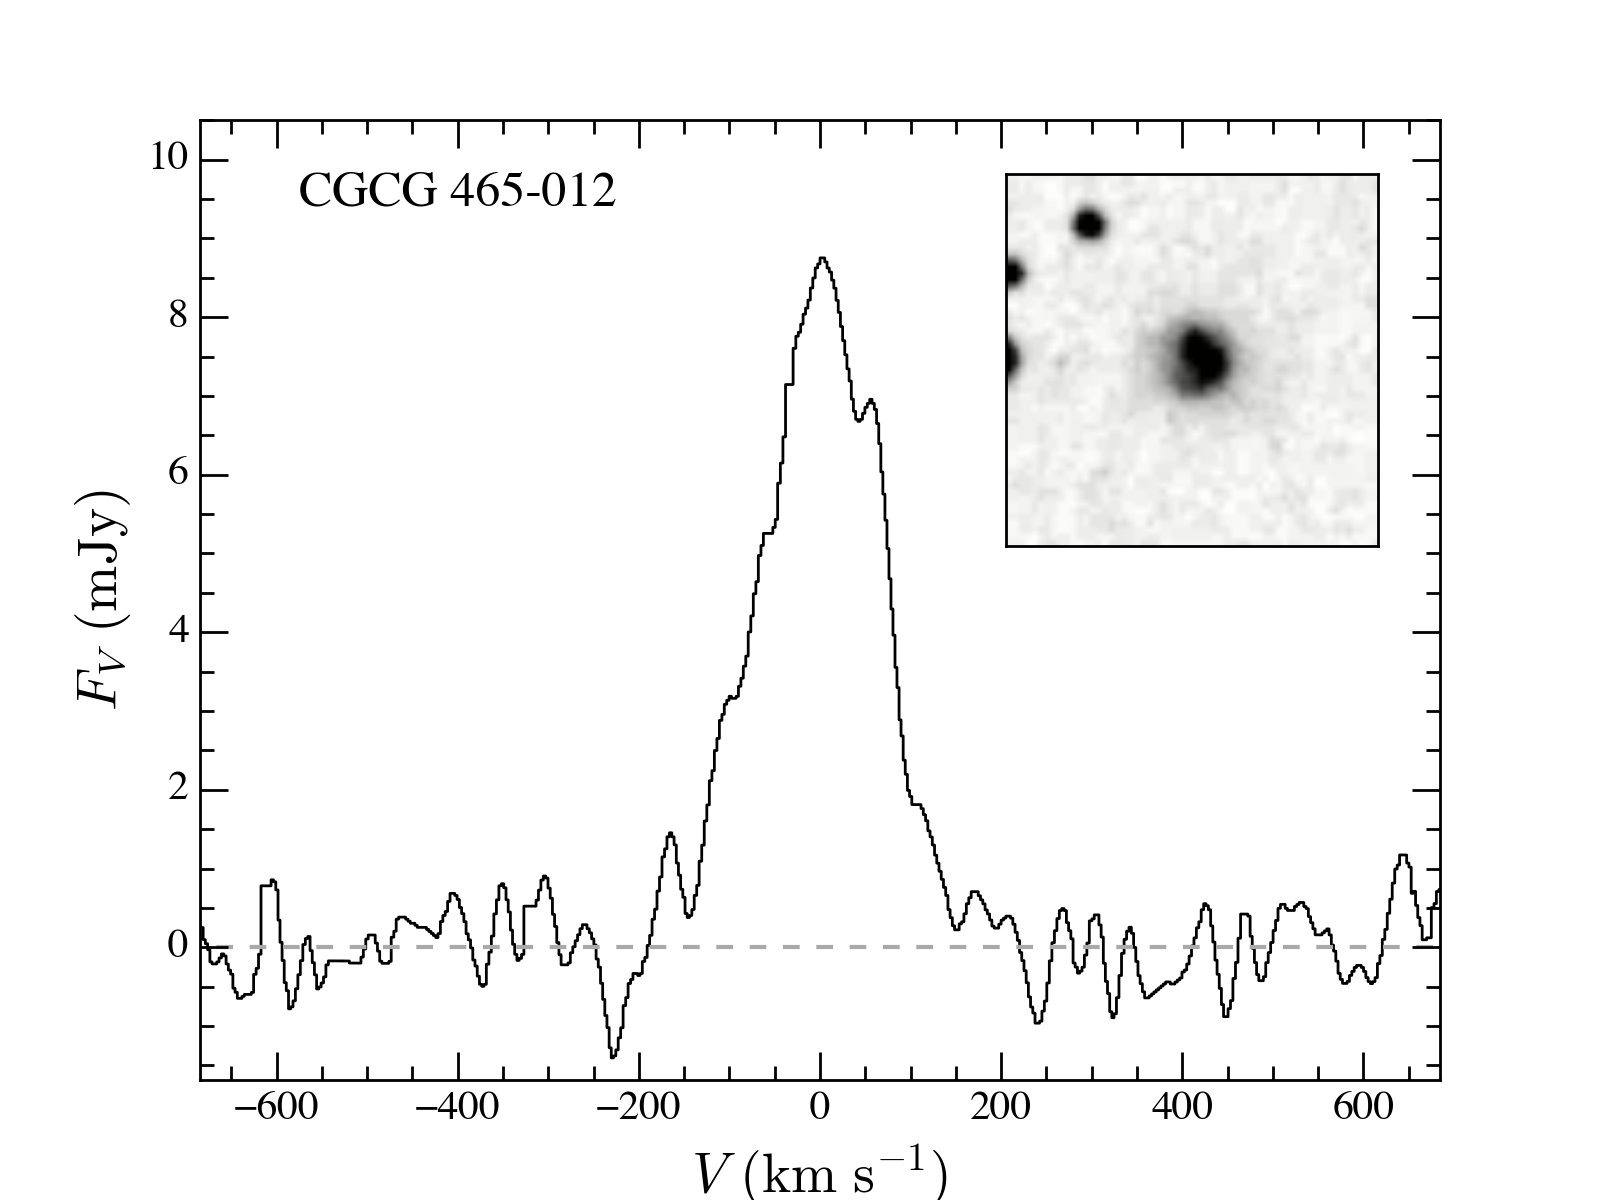
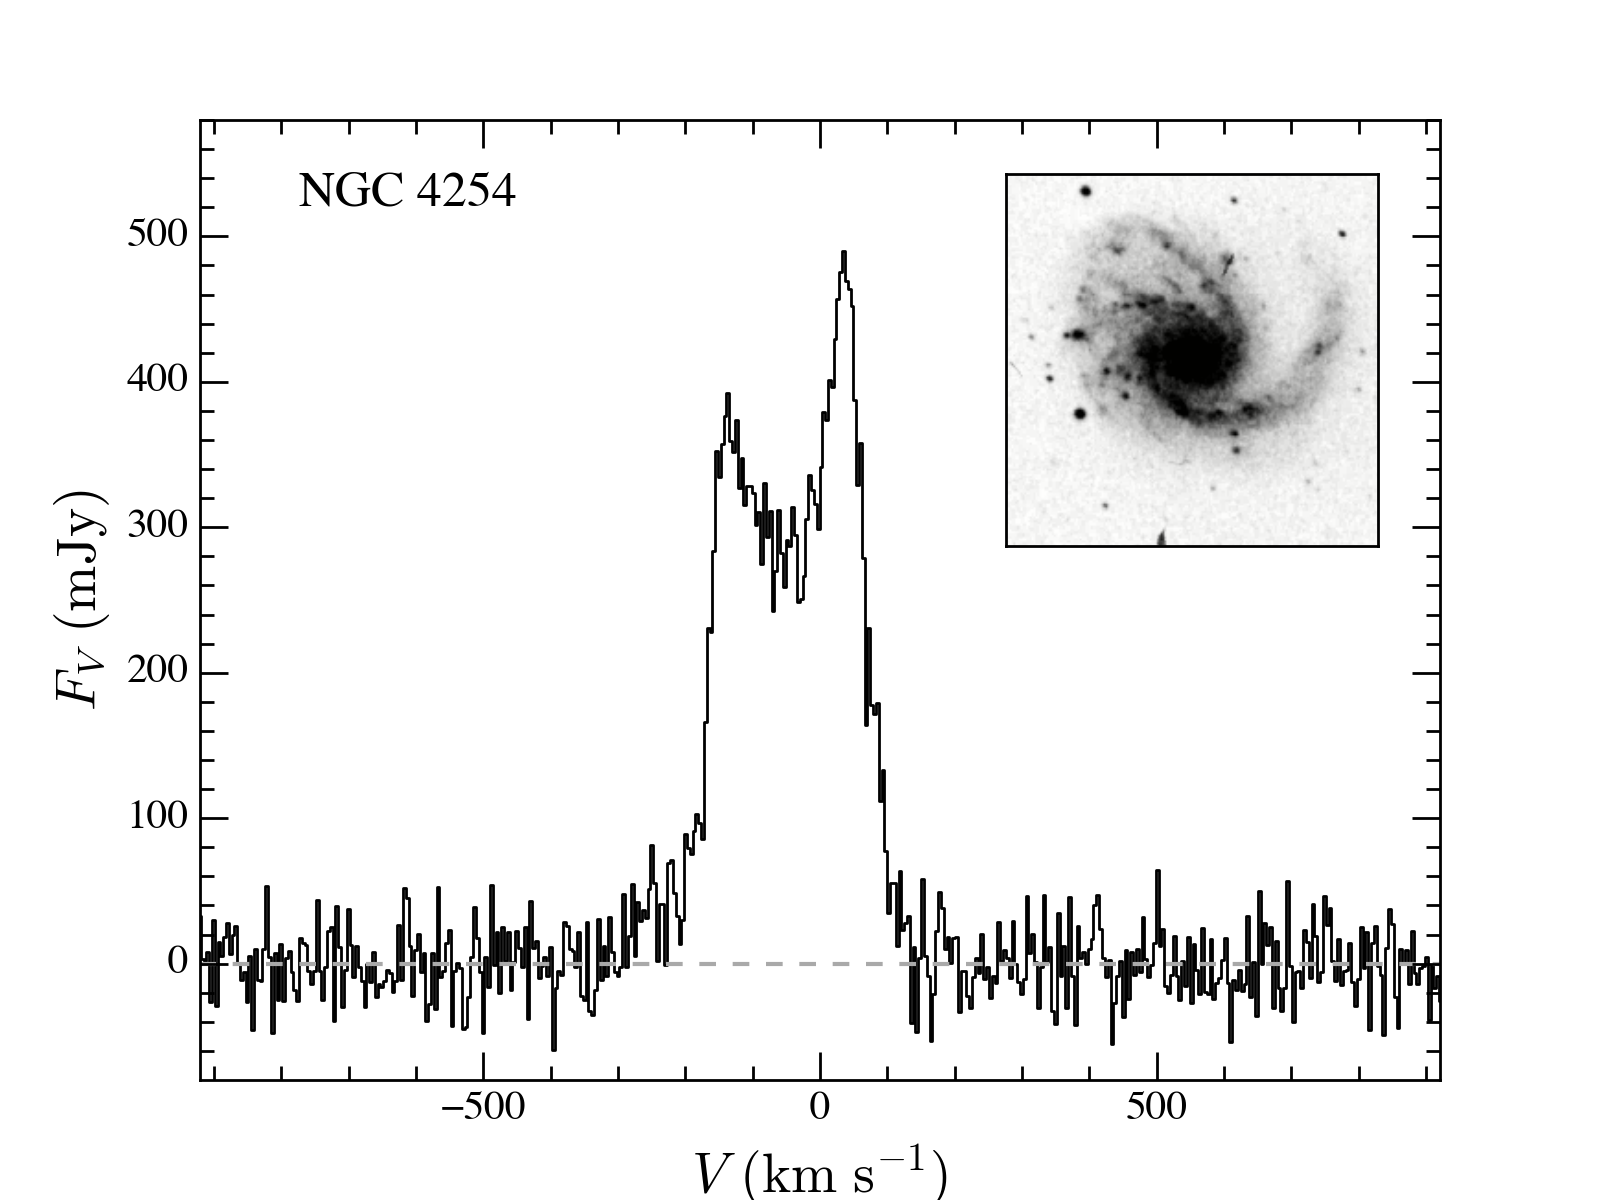
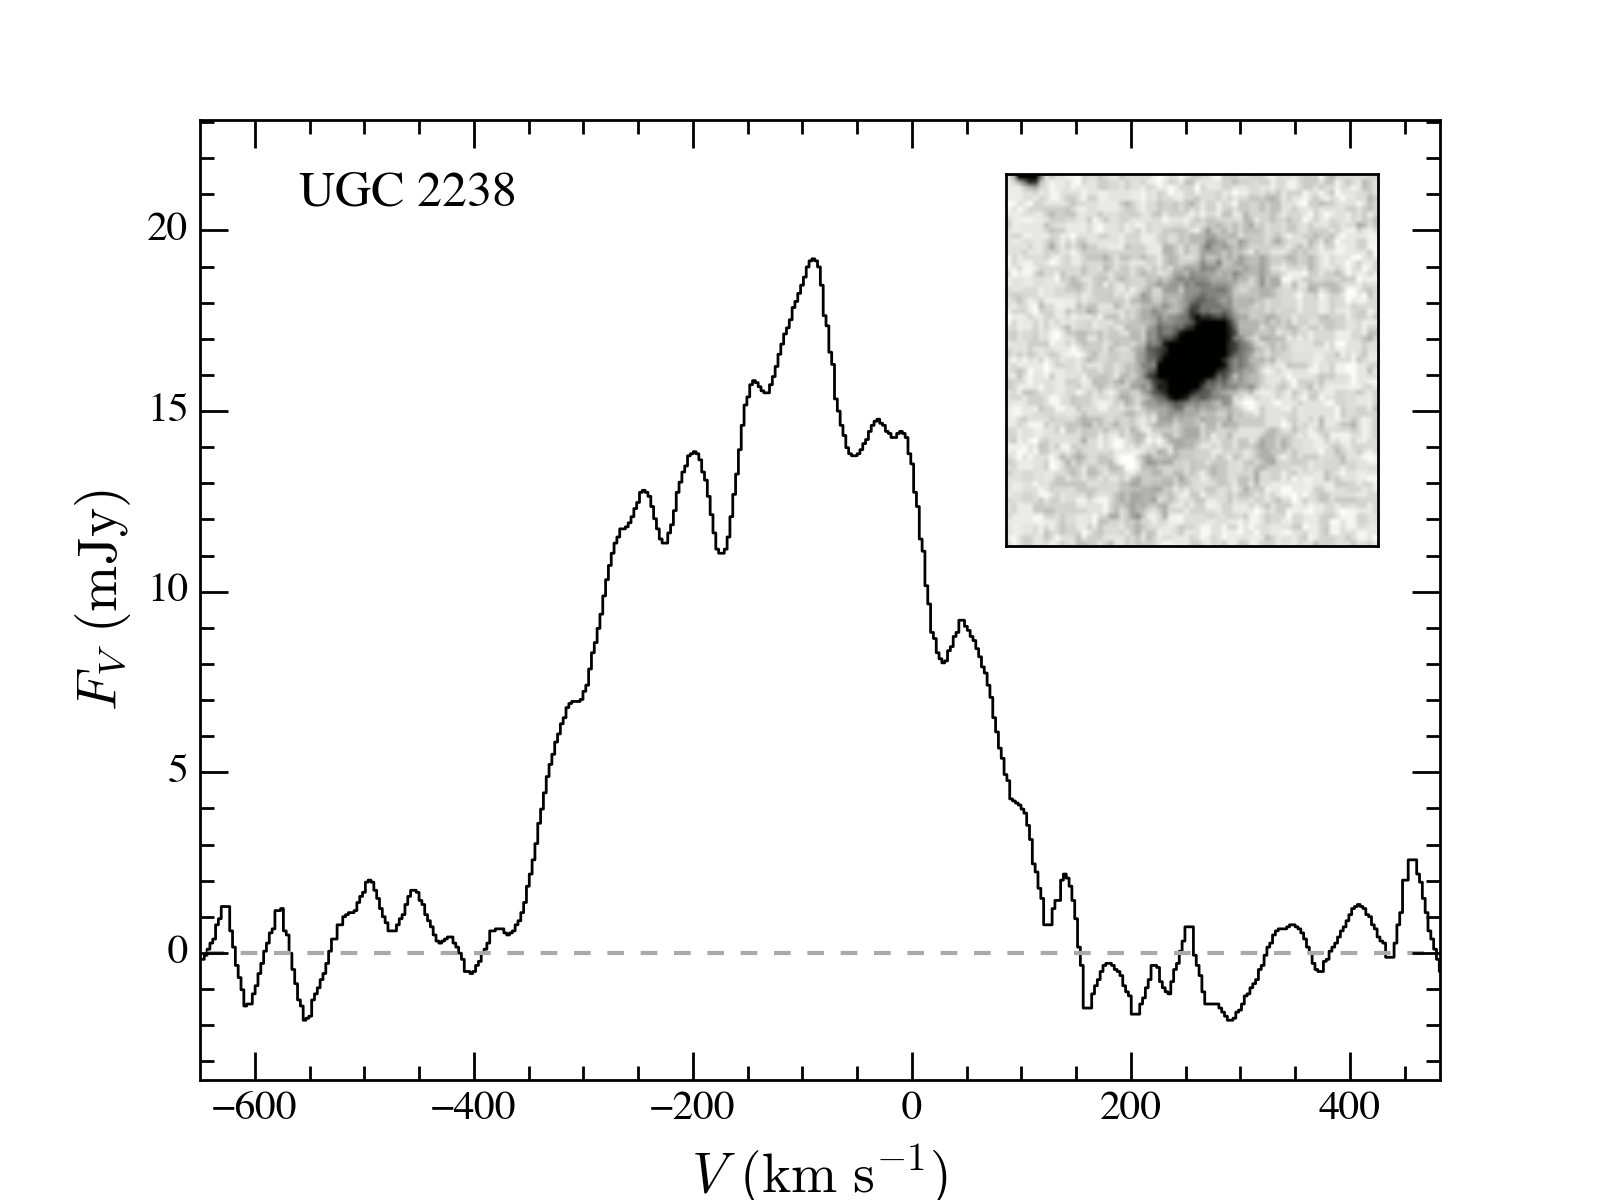
To construct the control sample of non-mergers, we begin with the representative sample of 269 nearby galaxies whose integrated H i profiles were studied by Yu et al. (2020). We carefully inspect optical images to exclude objects with visibly disturbed features and nearby companions projected within the H i beam, as well as sources exhibiting spectral line contamination within 1000 km s-1 of the central velocity. Seven targets have apparent companions with projected separations of 50–100 kpc, but they are included because the companions are outside of the telescope beam. We verified that our main conclusions are not affected by this choice. In view of the expected perturbed peculiarities and elevated star formation rates of the mergers, it is impractical when selecting a comparison sample to control for factors such as surface brightness, star formation rate, and inclination angle (e.g., Wang et al. 2013, 2020). Instead, we focus on stellar mass, choosing as the range that best matches the final sample of 45 mergers and the control sample of 80 non-mergers. The stellar masses of the GOALS galaxies were derived by Shangguan et al. (2019) using 2MASS -band magnitudes and a mass-to-light ratio estimated from the color and the calibrations of Bell et al. (2003). We use a similar strategy for the non-mergers, in this instance using 2MASS -band magnitudes and assuming mag, a color typical of the control galaxies estimated using Sloan Digital Sky Survey data (Ahumada et al., 2020). All stellar masses are referenced to the stellar initial mass function of Chabrier (2003). We define five stellar mass bins [ and ]. The width of each bin is adjusted to ensure that there are enough galaxies in both the control and merger sample. For each target in the merger sample, we randomly select a galaxy in the same stellar mass bin from the control sample. We use a Monte Carlo approach to resample the merger and control galaxies 1000 times in order to quantify the statistical uncertainty (see Section 4). After one-to-one matching in stellar mass, the merger and non-merger samples both contain 43 galaxies. One particular realization of the matched samples is shown in Figure 3. Figure 4 gives the H i profiles and optical morphologies of example control and merger galaxies.
| Galaxy | R. A. | Decl. | log | log | Beam size | Ref. | ||||
|---|---|---|---|---|---|---|---|---|---|---|
| (J2000) | (J2000) | (Mpc) | () | () | (′) | (km s-1) | ||||
| (1) | (2) | (3) | (4) | (5) | (6) | (7) | (8) | (9) | (10) | |
| CGCG 043-099 | 13:01:49.9 | 04:20:01 | 0.0375 | 180.2 | 10.87 0.20 | 10.17 | 3.3 | 8.3 | 1 | |
| CGCG 436-030aaH i spectrum strongly affected by absorption. | 01:20:01.4 | 14:21:35 | 0.0312 | 137.9 | 10.59 0.20 | 3.3 | 8.3 | 1 | ||
| CGCG 448-020aaH i spectrum strongly affected by absorption. | 20:57:23.3 | 17:07:34 | 0.0361 | 165.9 | 10.96 0.20 | 10.03 | 3.3 | 8.3 | 1 | |
| CGCG 465-012 | 03:54:16.4 | 15:55:44 | 0.0222 | 97.3 | 10.67 0.20 | 9.42 | 3.3 | 8.3 | 1 | |
| IC 2810 | 11:25:47.3 | 14:40:23 | 0.0342 | 162.8 | 11.19 0.20 | 9.91 | 3.3 | 8.3 | 1 | |
| IC 5298 | 23:16:01.7 | 25:33:33 | 0.0274 | 122.7 | 10.87 0.20 | 9.80 | 3.3 | 8.3 | 1 |
Note. — Column (1): Galaxy name. Columns (2)–(3): Equatorial coordinates (J2000). Column (4): Redshift from NED, measured from optical spectra. Column (5): Luminosity distance from Shangguan et al. (2019), derived from the heliocentric velocity corrected for the three-attractor flow model of Mould et al. (2000) using , , and km s-1 Mpc-1 (Planck Collaboration et al., 2016). Column (6): Stellar mass from Shangguan et al. (2019). Column (7): H i mass from the references given in Col. (10). Column (8): Beam size of the H i observation. Column (9): Velocity resolution of the H i line. Column (10): References for the H i observations.
3 H i Profile Measurements
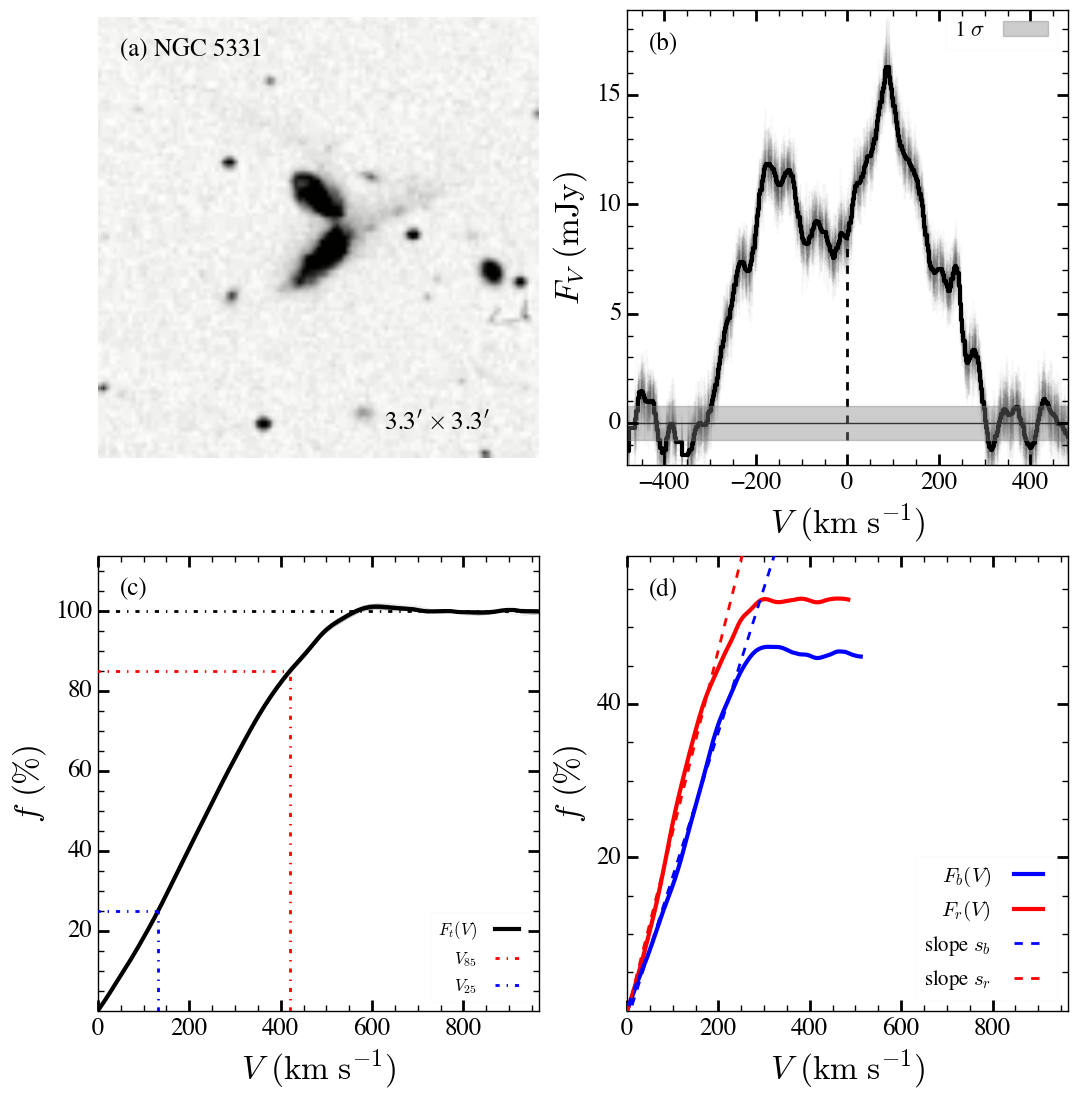
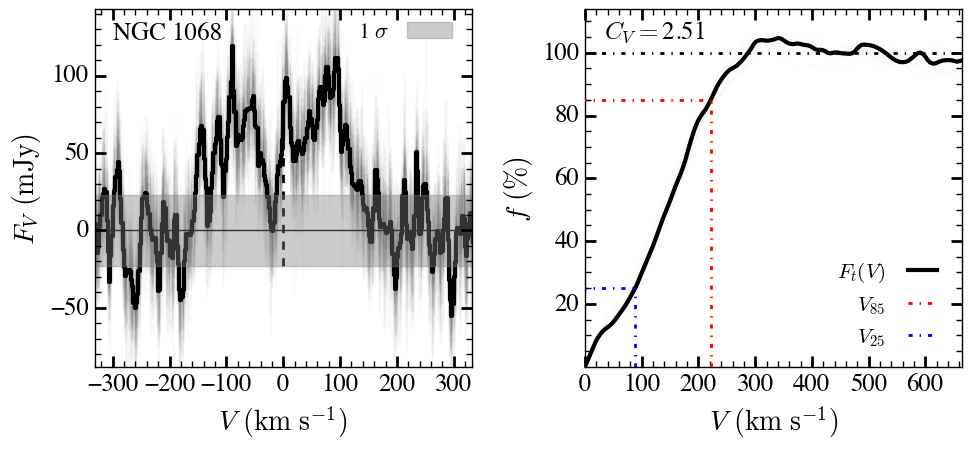
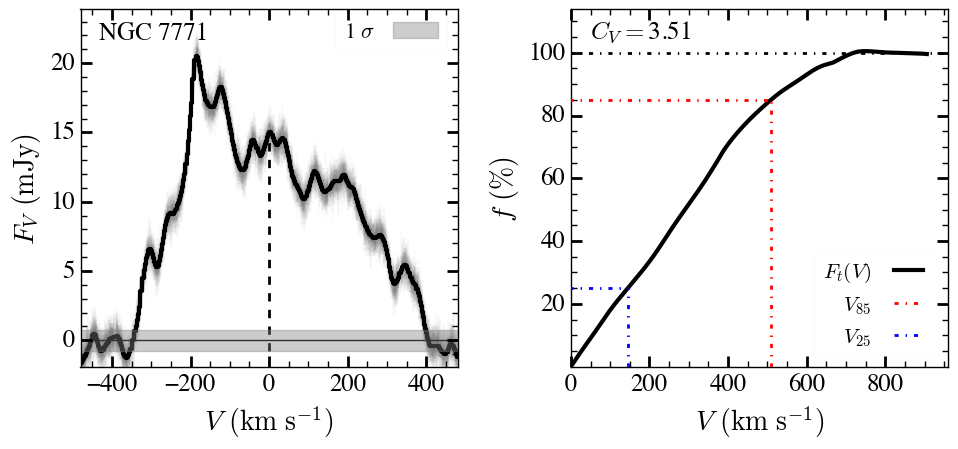
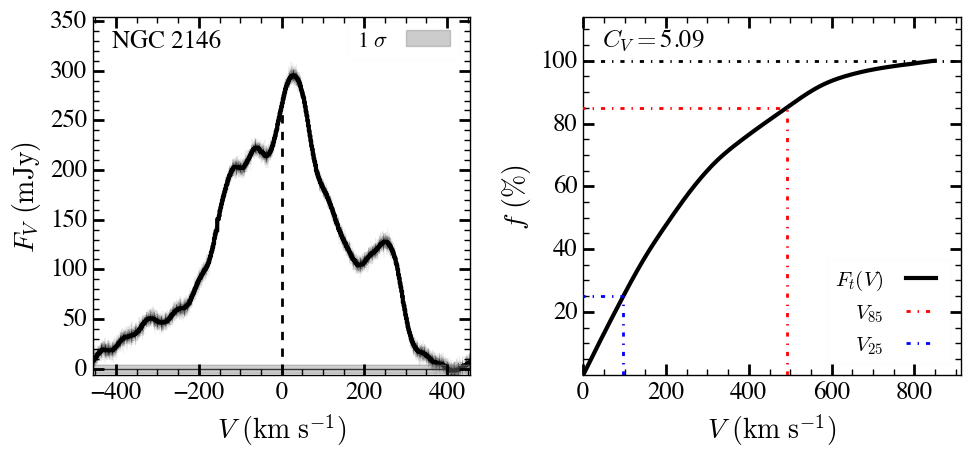
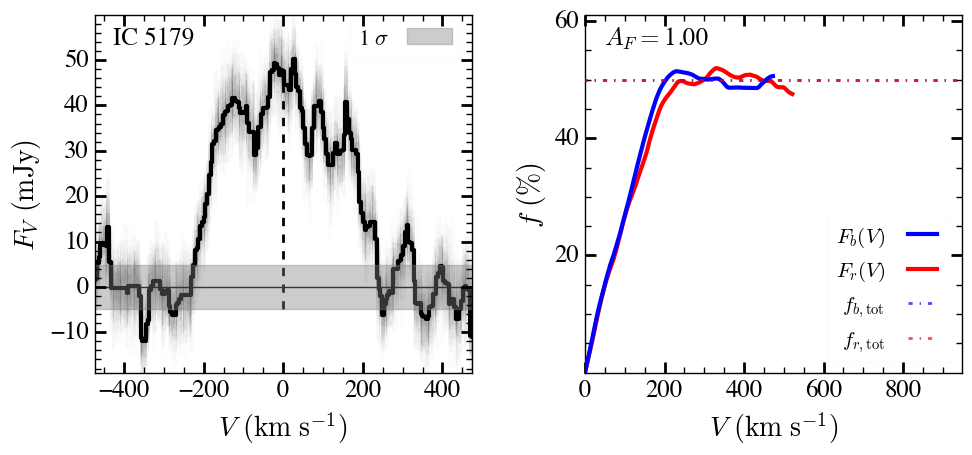
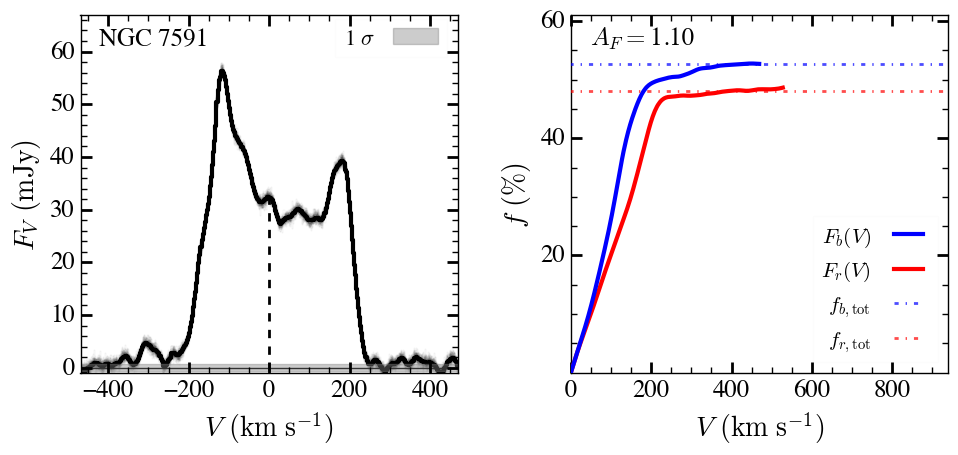
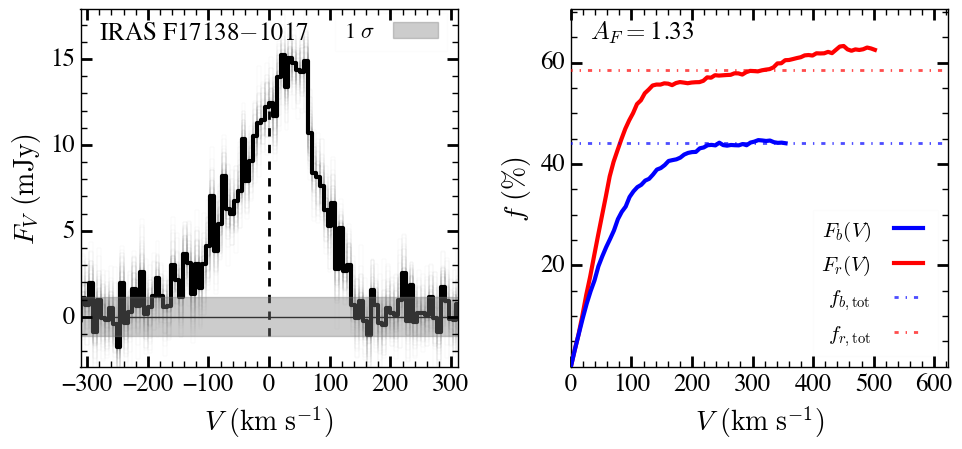
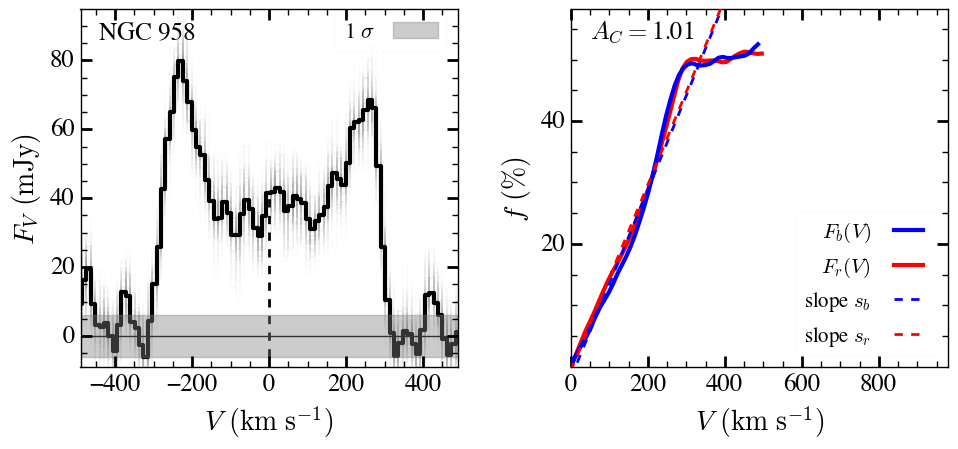
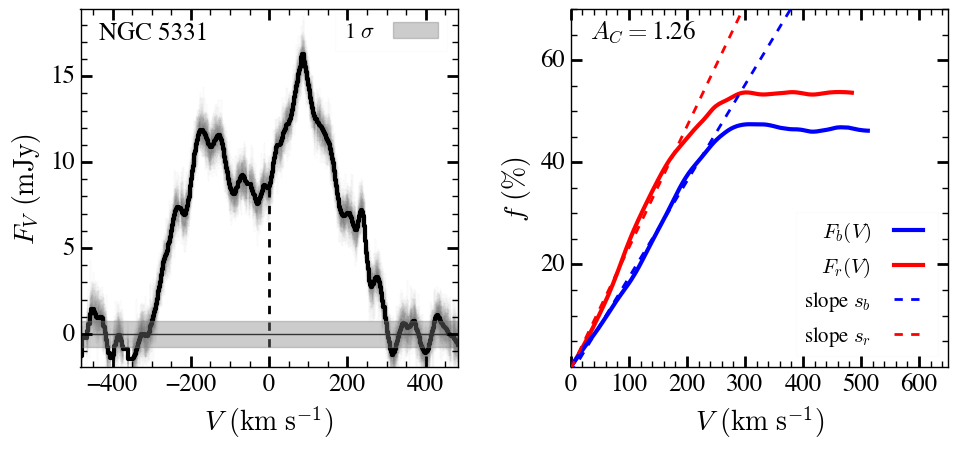
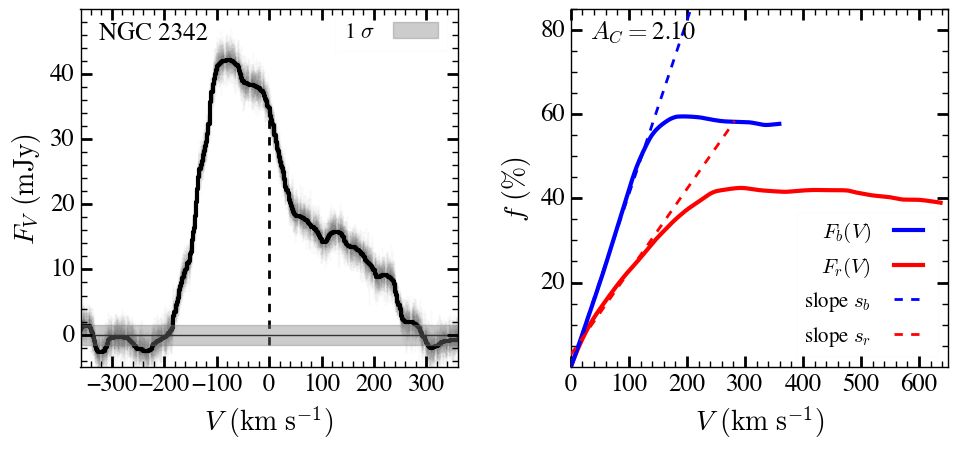
We quantify the H i profiles of the merger and control samples using the CoG method of Yu et al. (2020). Here, we briefly summarize the main points, which are also illustrated for an example galaxy in Figure 5. After subtracting the baseline and masking channels with obvious contamination by RFI, we search for H i emission in channels within a range km s-1around the optical systemic velocity of the galaxy. Spectral segments with at least three consecutive channels are selected if their mean flux density is above 0.7 times the maximum flux density of the spectrum. The lowest and highest velocity channels of the selected segments determine the velocity range of the line emission. The flux intensity-weighted velocity of the line-emitting channels defines the central velocity (Figure 5b). Starting at velocity , we integrate the H i flux toward both sides of the profile to construct the CoG of the line (Figure 5c). If the baseline of the spectrum has been measured properly and subtracted, the CoG rises monotonically until it reaches a plateau. The total line flux is the median integrated flux on the flat part of the CoG. The line widths and are the velocity widths enclosing 25% and 85% of the total flux (blue and red dash-dotted lines). Defining the concentration of the line as , the line profile varies from double-horned to single-peaked as increases (Figure 6). To quantify the asymmetry of the line, we calculate the CoG for the blue and red sides of the profile (red and blue curves in Figure 5d). The asymmetry parameter is defined as the larger of the ratios of the integrated flux of one side of the line relative to the other (Figure 7). The growth rate of the CoG of the two sides of the line also reflects the line asymmetry: denotes the larger of the ratios of the slopes of the rising part of the CoG of the two sides (Figure 8). The parameters and are always equal to or larger than 1. These newly defined profile asymmetry and concentration parameters are stable against conditions of relatively low signal-to-noise ratio (; Yu et al. 2020).
Following Yu et al. (2020), we obtain intrinsic line widths from the observed line widths after correcting them for instrumental resolution, redshift, and turbulent motions. The profile asymmetry and concentration parameters are corrected for the effect of S/N. The uncertainties of the measurements are the quadrature sum of statistical uncertainties estimated from Monte Carlo realizations that add Gaussian noise to the observed spectrum and systematic uncertainties from mock simulations (Yu et al., 2020). The final measured parameters are given in Table 3 for the merger sample and in Table 4 for the control sample.
| Galaxy | S/N | log | Notes | ||||||||||||
|---|---|---|---|---|---|---|---|---|---|---|---|---|---|---|---|
| (km s-1) | (Jy km s-1) | (km s-1) | () | ||||||||||||
| (1) | (2) | (3) | (4) | (5) | (6) | (7) | (8) | (9) | (10) | ||||||
| CGCG 043-099 | 11237 | 3 | 2.68 | 0.02 | 263 | 16 | 1.13 | 0.08 | 1.12 | 0.11 | 3.88 | 0.05 | 43.7 | 10.31 | |
| CGCG 052-037 | 7398 | 3 | 1.15 | 0.01 | 253 | 15 | 1.06 | 0.08 | 1.09 | 0.11 | 4.41 | 0.07 | 37.4 | 9.59 | 2 |
| CGCG 453-062 | 7453 | 3 | 1.22 | 0.01 | 338 | 21 | 1.03 | 0.08 | 1.25 | 0.13 | 3.67 | 0.07 | 23.7 | 9.56 | 2 |
| CGCG 465-012 | 6659 | 3 | 1.37 | 0.01 | 180 | 11 | 1.07 | 0.08 | 1.06 | 0.11 | 4.51 | 0.06 | 32.8 | 9.49 | |
| ESO 173-G015 | 2926 | 13 | 28.60 | 0.83 | 242 | 83 | 1.00 | 0.27 | 1.08 | 1.00 | 3.15 | 0.12 | 8.9 | 9.92 | 1 |
| ESO 297-G011/012 | 5187 | 13 | 3.90 | 0.12 | 167 | 57 | 1.06 | 0.29 | 1.39 | 1.29 | 4.24 | 0.26 | 8.6 | 9.73 | |
Note. — Column (1): Galaxy name. Column (2): Flux intensity-weighted central velocity. Column (3): Total integrated flux of H i line. Column (4): Corrected line width measured at 85% of the total flux. Columns (5) and (6): Flux asymmetry and flux distribution asymmetry, corrected for S/N as described in Section 3. Column (7): Corrected concentration of the H i profile. Column (8): S/N of the profile, calculated based on Equation (5) in Yu et al. (2020). Column (9): H mass; for an assumed uncertainty of 10% for the distance and 15% for the H i flux, the typical uncertainty of is 0.11 dex. Column (10): Notes: 1 = mask generated for the spectrum; 2 = baseline subtracted in this work.
| Galaxy | S/N | log | Notes | ||||||||||||
|---|---|---|---|---|---|---|---|---|---|---|---|---|---|---|---|
| (km s-1) | (Jy km s-1) | (km s-1) | () | ||||||||||||
| (1) | (2) | (3) | (4) | (5) | (6) | (7) | (8) | (9) | (10) | ||||||
| AGC 190187 | 8060 | 1 | 1.17 | 0.23 | 271 | 3 | 1.02 | 0.27 | 1.04 | 0.92 | 3.09 | 0.08 | 9.3 | 9.56 | 2 |
| AGC 260268 | 8950 | 1 | 1.75 | 0.28 | 165 | 3 | 1.05 | 0.07 | 1.23 | 1.08 | 2.72 | 0.07 | 13.7 | 9.88 | |
| IC 381 | 2485 | 1 | 22.11 | 3.50 | 240 | 1 | 1.12 | 0.08 | 1.33 | 1.23 | 2.66 | 0.01 | 166.4 | 9.91 | 2 |
| IC 529 | 2272 | 1 | 27.93 | 4.42 | 272 | 1 | 1.03 | 0.07 | 1.13 | 1.04 | 2.91 | 0.01 | 148.5 | 9.90 | 1 |
| IC 1074 | 7791 | 18 | 1.21 | 0.24 | 470 | 30 | 1.16 | 0.28 | 1.08 | 0.94 | 2.55 | 0.41 | 5.5 | 9.61 | |
| IC 2387 | 7686 | 1 | 4.94 | 0.78 | 311 | 2 | 1.11 | 0.08 | 1.04 | 0.93 | 2.92 | 0.05 | 19.1 | 10.26 | |
| UGC 448 | 4859 | 1 | 6.23 | 0.99 | 157 | 1 | 1.01 | 0.07 | 1.05 | 0.96 | 3.09 | 0.05 | 27.6 | 9.74 | |
| NGC 514 | 2476 | 1 | 28.10 | 4.45 | 228 | 1 | 1.06 | 0.07 | 1.02 | 0.93 | 2.63 | 0.03 | 28.5 | 9.86 | 1 |
| UGC 463 | 4451 | 1 | 6.02 | 0.95 | 192 | 2 | 1.10 | 0.08 | 1.16 | 1.06 | 3.05 | 0.06 | 23.1 | 9.42 | |
| UGC624 | 4770 | 1 | 11.68 | 1.85 | 467 | 1 | 1.04 | 0.07 | 1.04 | 0.96 | 2.87 | 0.02 | 43.7 | 10.16 | |
Note. — Column (1): Galaxy name. Column (2): Flux intensity-weighted central velocity. Column (3): Total integrated flux of H i line. Column (4): Corrected line width measured at 85% of the total flux. Columns (5) and (6): Flux asymmetry and flux distribution asymmetry, corrected for S/N as described in Section 3. Column (7): Corrected concentration of the H i profile. Column (8): S/N of the profile, calculated based on Equation (5) in Yu et al. (2020). Column (9): H mass; for an assumed uncertainty of 10% for the distance and 15% for the H i flux, the typical uncertainty of is 0.11 dex. Column (10): Notes: 1 = mask generated for the spectrum; 2 = baseline subtracted in this work.
4 Comparison Between Merger and Non-merger Galaxies
With the H i profile measurements in hand, we compare systematically the statistical properties of the merger and non-merger galaxies. The violin plots of Figure 9 display the distributions of the main parameters for the two samples: , , , , , and . The violin plot is similar to a box plot, a non-parametric, visual representation of a variable distribution across different samples, but includes the kernel density estimate of the sample distribution (see the caption of Figure 9 for more details). Matched in stellar mass by design (Figure 9a), the two samples exhibit statistically similar rotation velocities (Figure 10)222Because the inclination angle is difficult to measure or poorly defined in mergers, in this paper the quantity pertains to the projected rotation velocity, for both the merger and non-merger samples.. In other words, mergers cannot be distinguished from non-mergers in terms of their H i line widths. This is somewhat surprising, as one naively might have thought that merging systems, in the aftermath of two galaxies colliding, would show a larger range of integrated velocities. This expectation holds only for one out of the five mass bins () in Figure 10, for which mergers have a median , to be compared to for the control sample. The violin density plots of the two groups are nearly identical (Figure 9b). Based on the Kolmogorov-Smirnov (K-S) test with a -value = (Table 5), the null hypothesis that the two samples are drawn from the same parent distribution cannot be rejected. 333Following convention, we consider two distributions significantly different if .
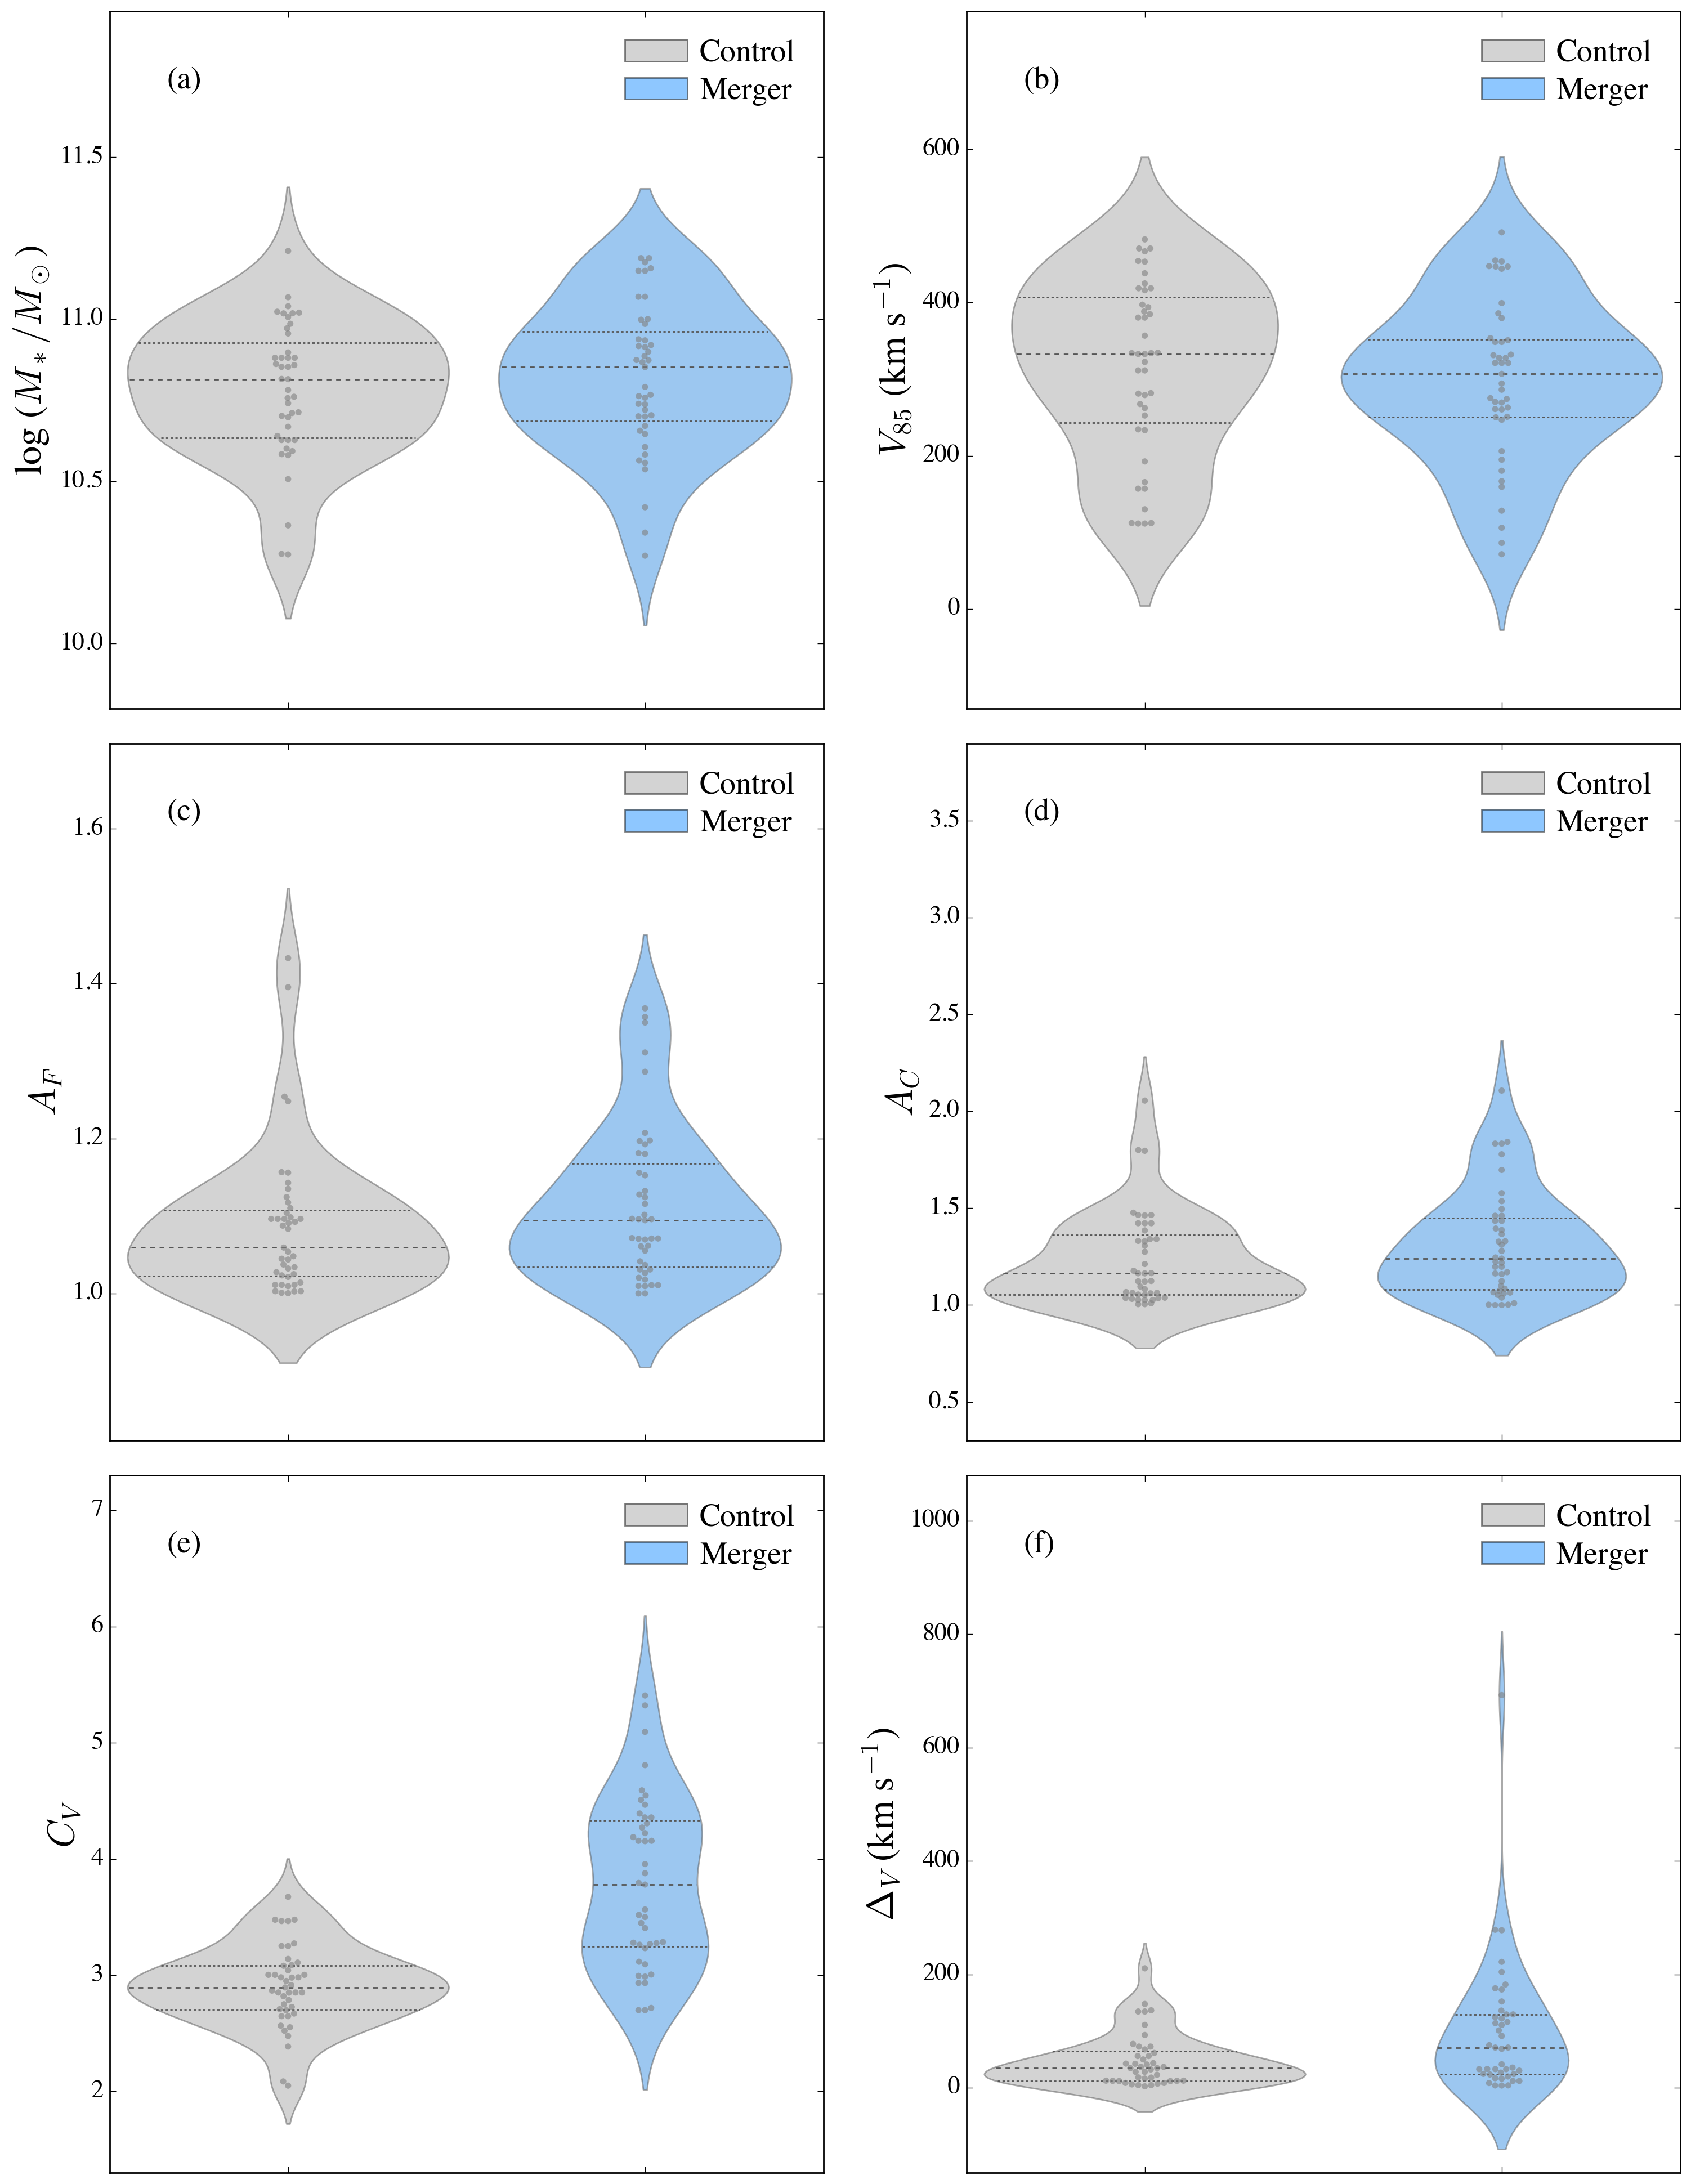
If mergers do not produce notably broader lines, what imprint do they leave on their line asymmetry? This comes as an even bigger surprise. Neither their distribution of nor stands out compared to that of non-mergers (Figures 9c and 9d). According to the K-S test, the asymmetry parameters of merger and control galaxies are drawn from a similar distribution, with for and for . Taken at face value, our results are at odds with those of Bok et al. (2019), whose analysis of H i asymmetry of close galaxy pairs and an approximately similar number of isolated galaxies show that galaxy pairs tend to exhibit slightly but significantly higher levels of asymmetry. For consistency with these authors, we repeated our statistical analysis using the k-sample Anderson–Darling test (Scholz & Stephens, 1987), but the results were unchanged. However, it is not entirely trivial to compare our results with those in the literature. Adopting as the criterion for asymmetry, the asymmetry fraction in our study is for non-mergers and for mergers. The uncertainty is determined by resampling the values 100 times according to their uncertainties, which consist of both statistical and systematic uncertainties, as explained in Yu et al. (2020). However, the asymmetry fraction of non-mergers and mergers becomes and , respectively, after we matched the samples one-to-one. The difference is no longer significant. Using a similar criterion, previous studies have reported a wide range of asymmetry fractions, from 9% to 22% for isolated galaxies (e.g., Haynes et al. 1998; Matthews et al. 1998; Espada et al. 2011; Bok et al. 2019, to for galaxies in clusters (Scott et al., 2018), and 27% for galaxy pairs (Bok et al., 2019). It is important to note that our profile asymmetry measurements have been corrected for the effects of S/N, which can be important (Watts et al., 2020a), but not all authors follow this practice. Sample differences in stellar mass poses a further complication. While the dependence of profile asymmetry on stellar mass is controversial (e.g., Espada et al. 2011; Reynolds et al. 2020b; Watts et al. 2020a; Manuwal et al. 2021), N. Yu et al. (in preparation) find that massive galaxies tend to have more symmetric H i profiles. Our present GOALS sample is biased toward high-mass galaxies, and the control sample was carefully chosen to match them in terms of stellar mass, both spanning . By contrast, the sample of Bok et al. (2019) covers .
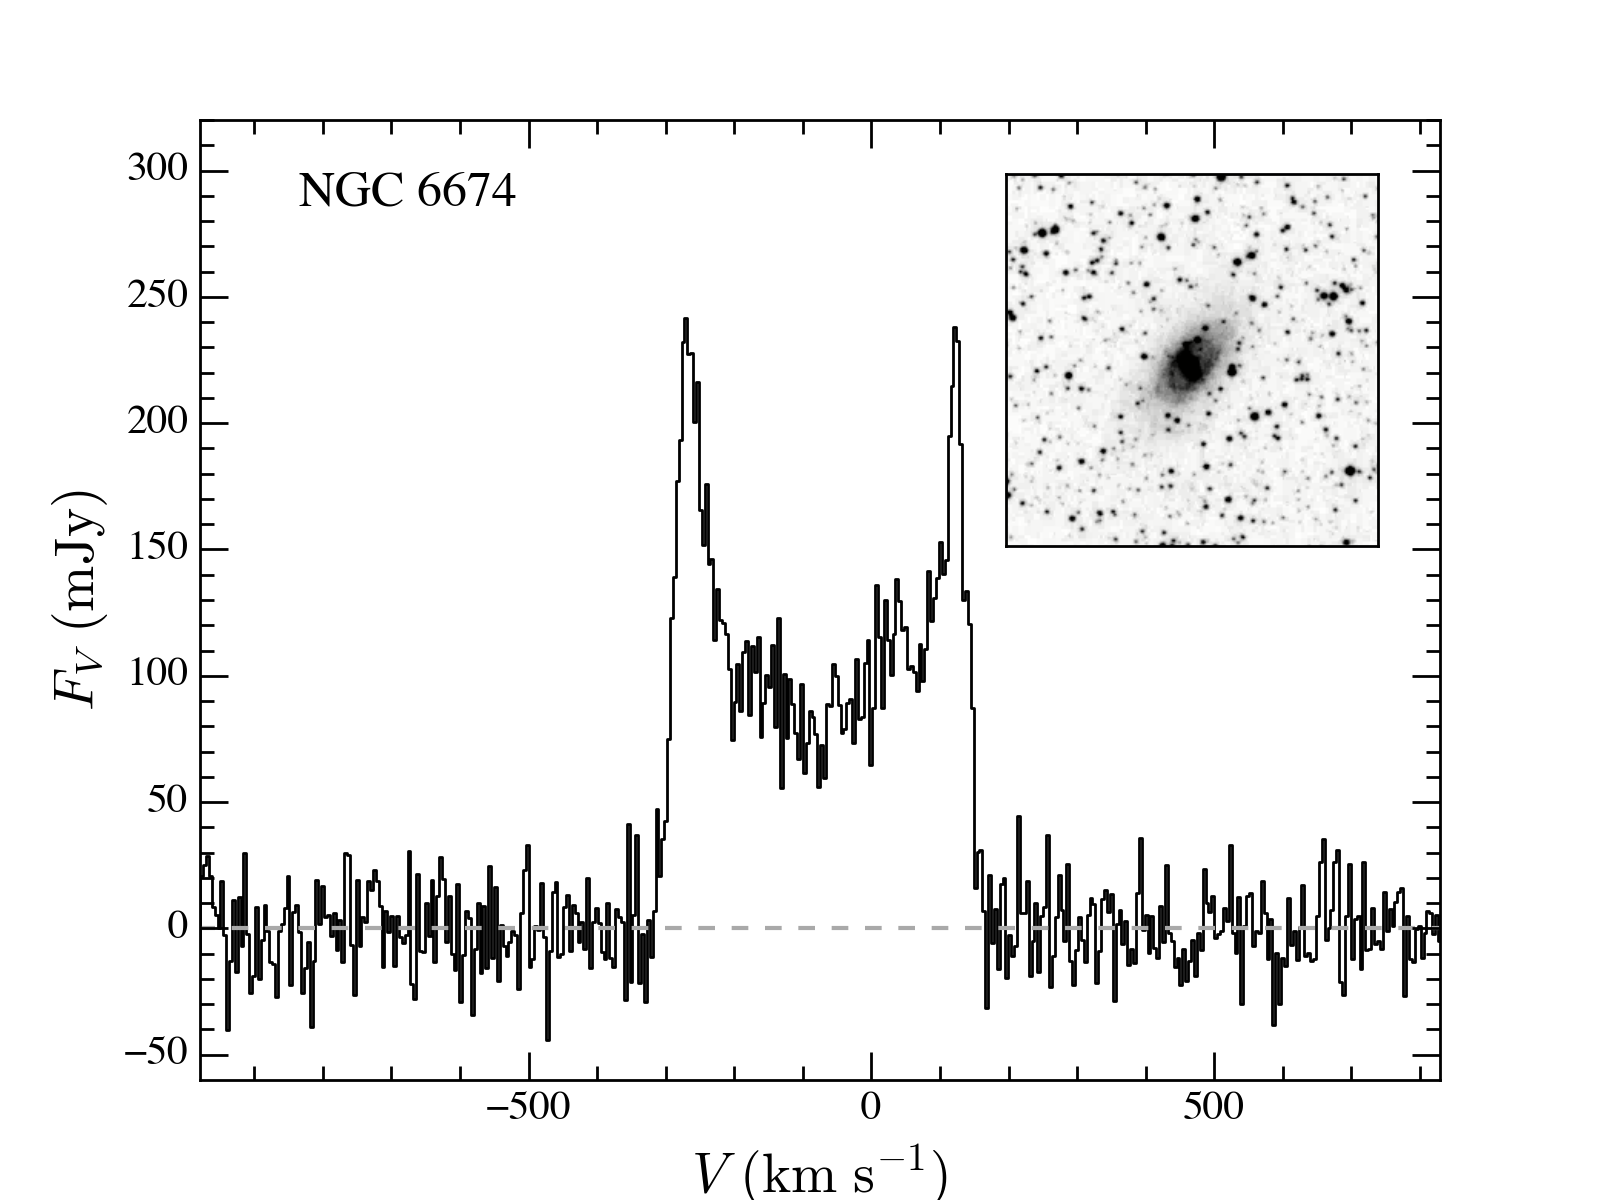
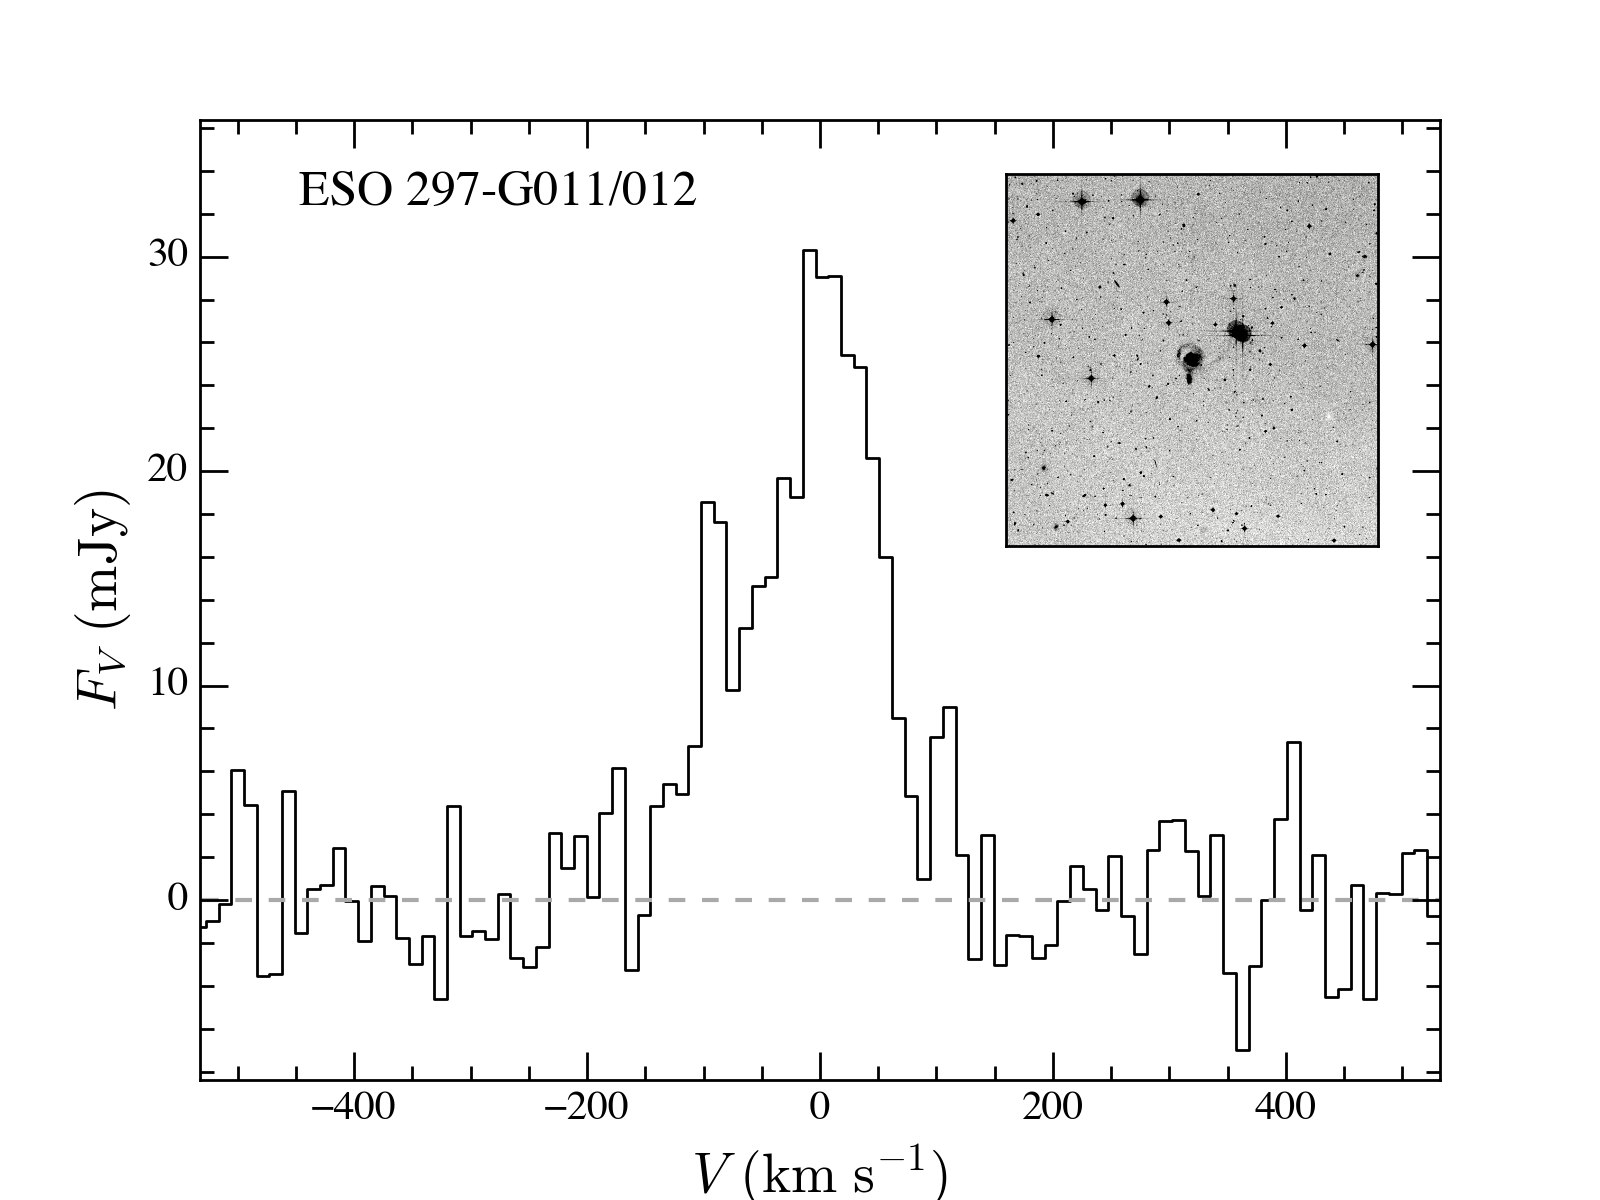
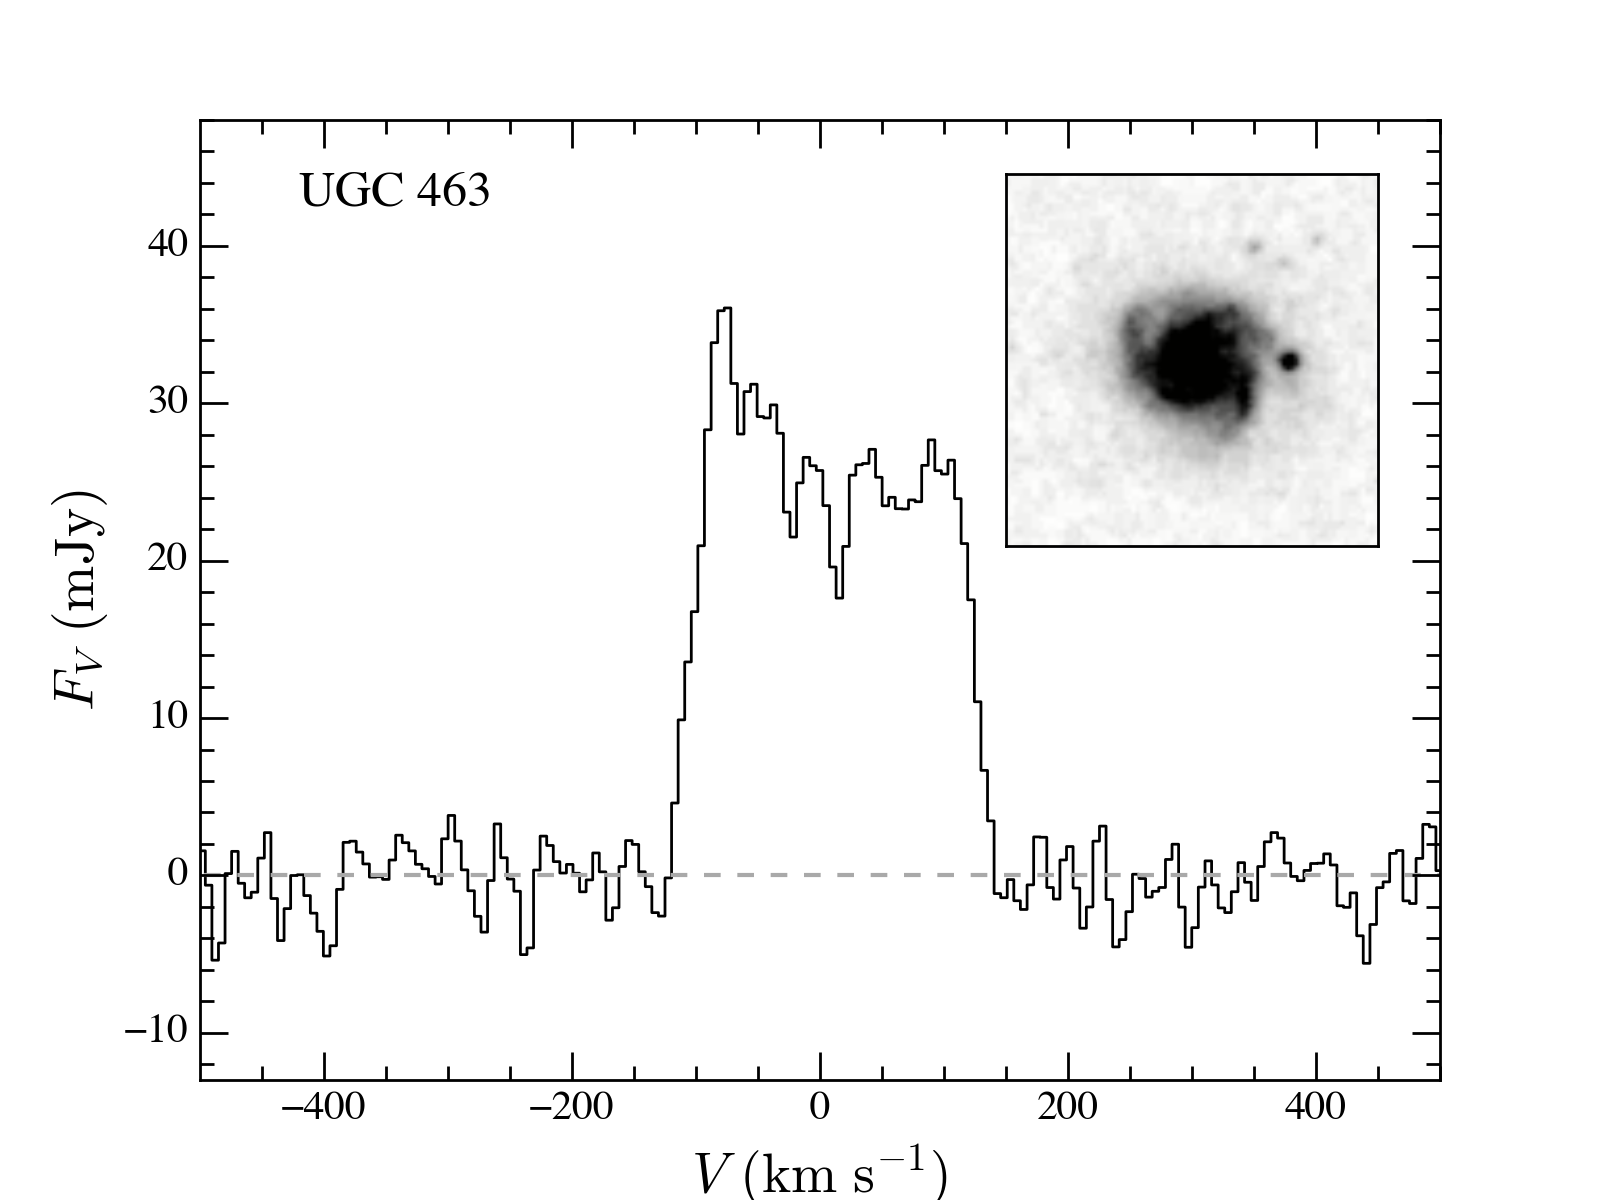
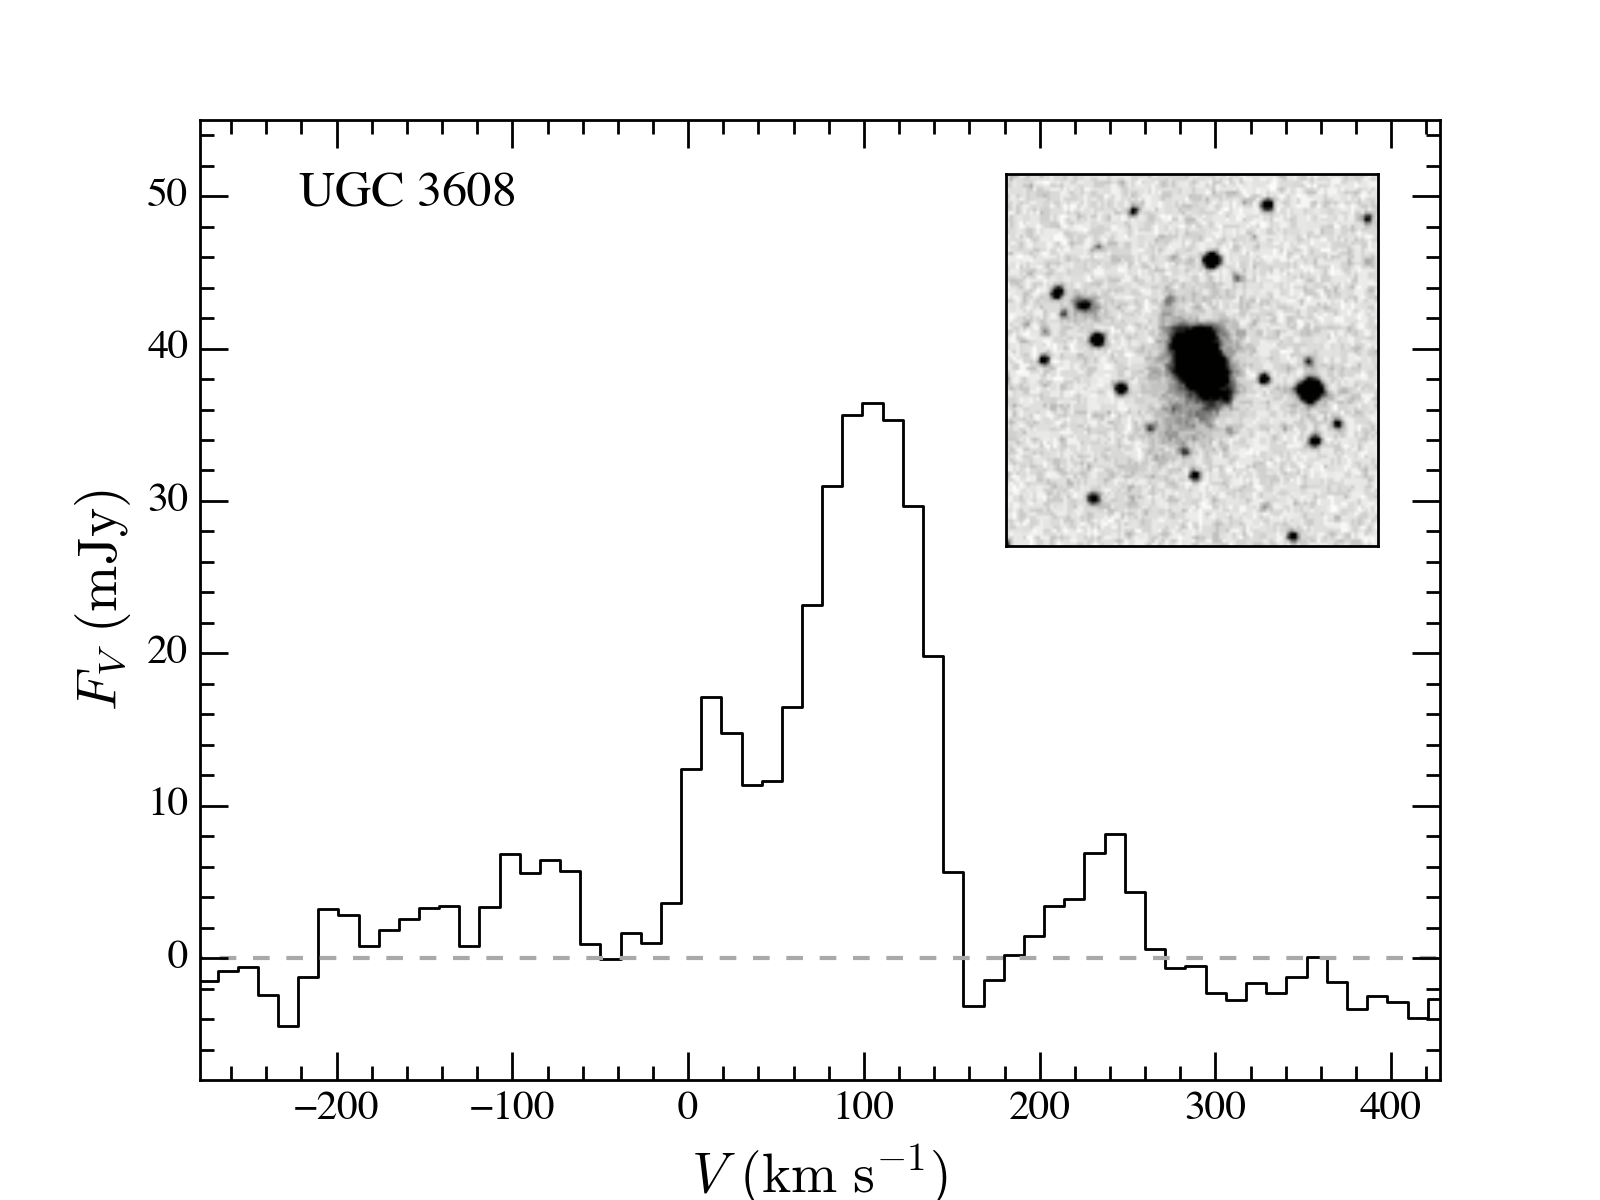
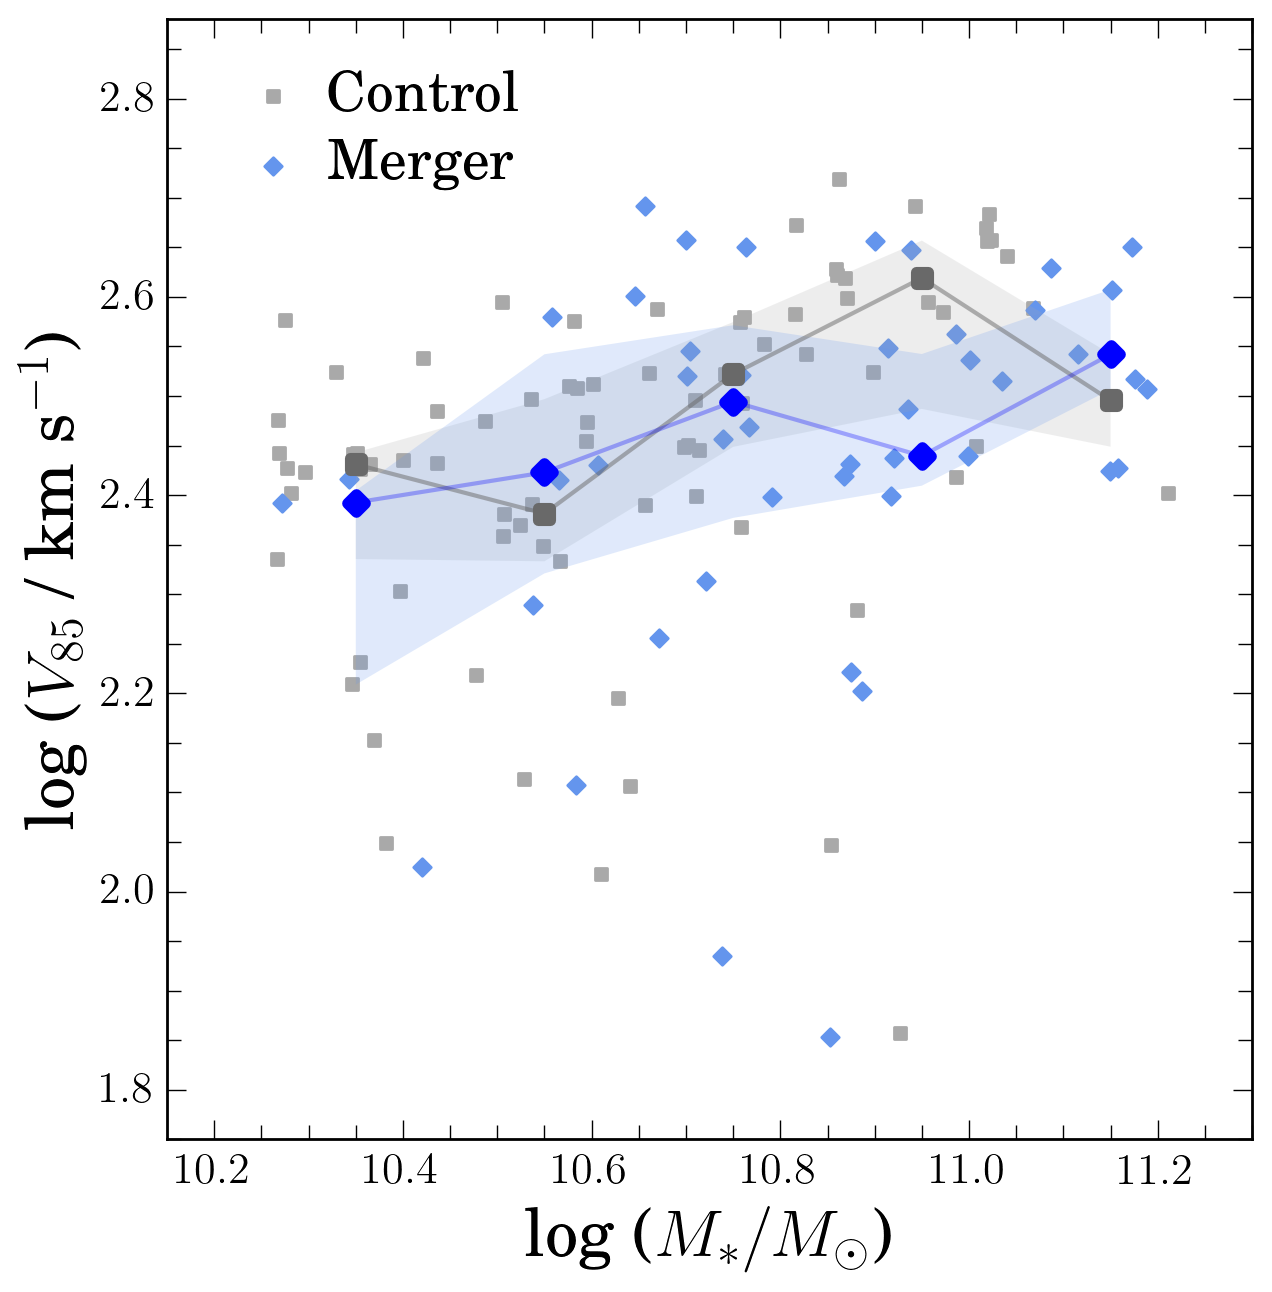
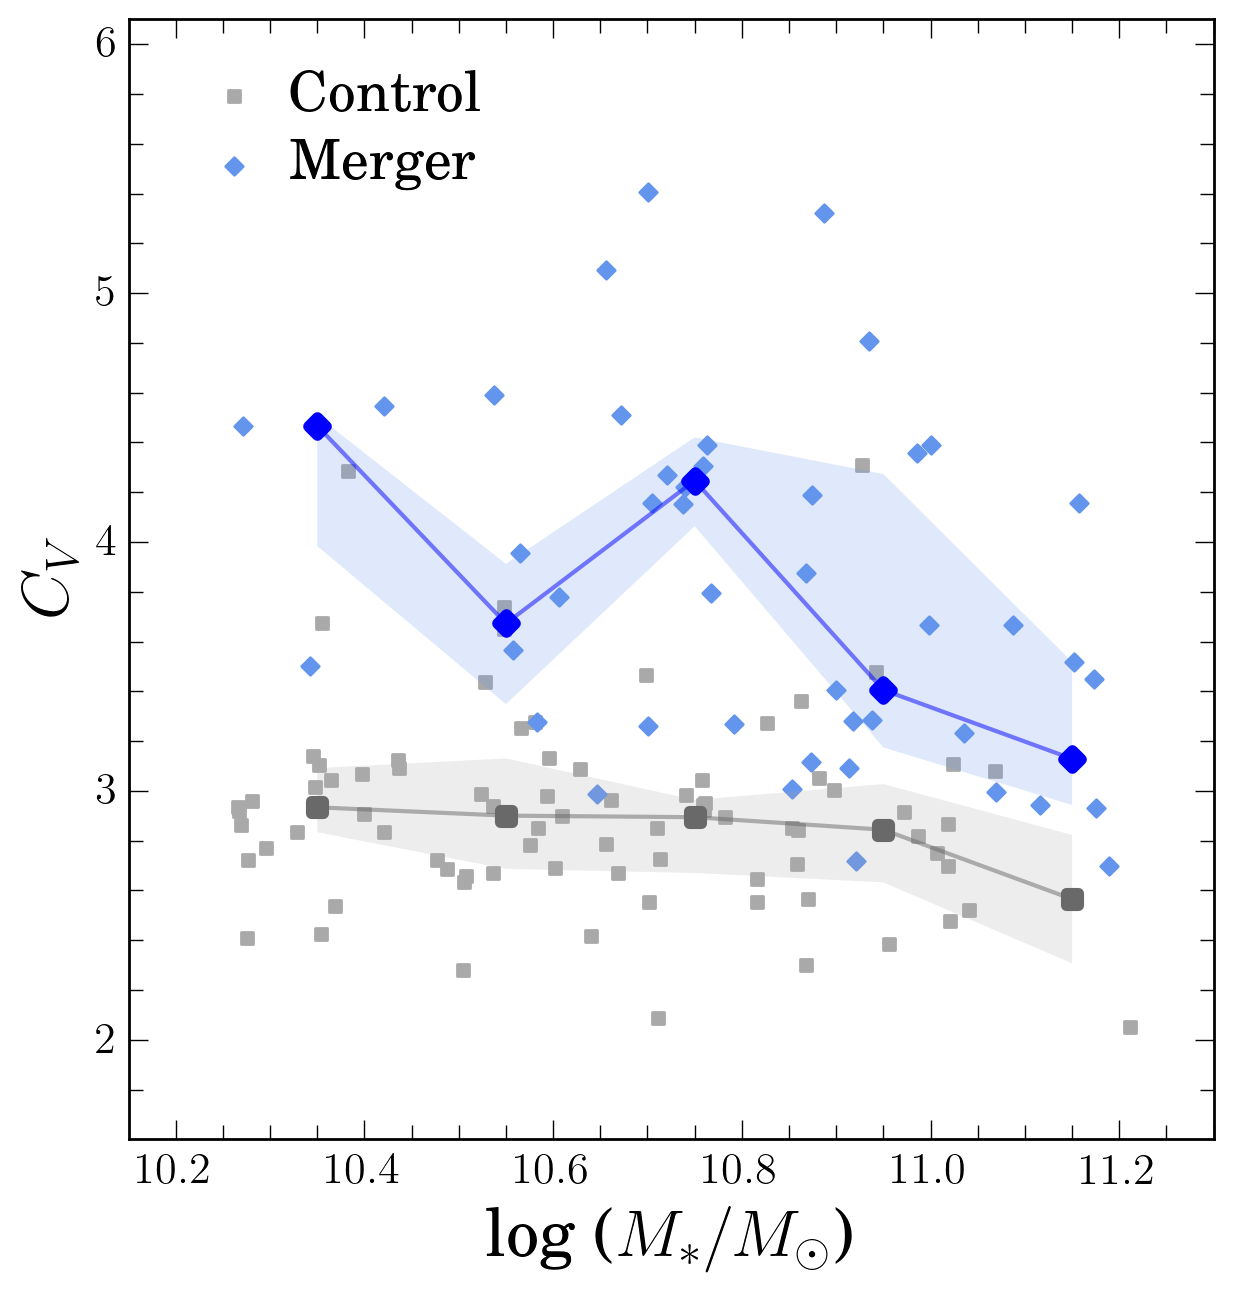
Whereas neither the width nor the asymmetry of the H i line provides a clear signature of mergers, the detailed shape of the line profile does. As illustrated for some examples in Figure 4, mergers typically display single-peaked H i profiles, in strong contrast to the double-horned profiles characteristic of their non-merger counterparts. Yu et al. (2022) demonstrate that the parameter introduced in Yu et al. (2020) effectively captures the range of line profile shapes observed in galaxies. After controlling for projection effects due to inclination angle, H i profiles of normal galaxies depend systematically on galaxy mass, as a consequence of both their internal distribution of atomic gas and their velocity field: massive disk galaxies of earlier Hubble type tend to have double-horned H i profiles (low ), while the H i spectra of low-mass, late-type disk galaxies are preferentially single-peaked (high ). This trend is evident even within the relatively limited range of stellar mass covered by our control sample (Figure 11). It can be clearly seen that, at a given stellar mass, mergers have significantly larger values of than non-mergers, in support of the visual impression conveyed by Figure 4 that the H i profiles of mergers tend to be single-peaked, despite the fact that all of the GOALS objects are massive galaxies and therefore should be double-peaked. Within our sample, 67% of the mergers have single-peaked or flat-topped profiles (), to be compared with only 12% for the control sample. The violin density plot in Figure 9e further reinforces the conclusion that the values of the merger and non-merger samples are significantly different, as does the K-S test, which yields (Table 5).
| Parameter | K-S Probability |
|---|---|
| (1) | (2) |
Note. — Column (1): Properties of the galaxy or its H i profile. Column (2): Median of the K-S test comparison between merger and non-merger (control) galaxies, based on 1000 bootstrap realizations of the two samples. Error bars are derived from the 5 to 95 percentile range.
Lastly, we examine , the relative offset between the radial velocity as derived from the H i line and the systemic velocity of the galaxy, which we assume to be well-represented by the optical velocity measured through nebular emission lines from ionized gas or from stellar absorption lines. Although the kinematics of the ionized gas may differ from that of the stars in galaxy mergers, previous studies have not found significant systematic difference between them (e.g., Medling et al. 2014; Barrera-Ballesteros et al. 2015). The distribution of of mergers differs significantly from that of non-mergers (; Table 5). In particular, mergers have a prominent tail of positive values in (Figure 9f).
5 Discussion and Summary
Major mergers, particularly those involving gas-rich galaxies, constitute important episodes in the lifecycle of massive galaxies. Tides and shocks exert especially dramatic effects on the cold interstellar medium of the merging galaxies (e.g., Barnes & Hernquist 1996; Barnes 2002), both on the molecular and atomic phases. Interferometric observations show that the tidal tails of galaxy mergers are H i-rich and the H i extends to tens of kpc (Hibbard & van Gorkom, 1996; Hibbard & Yun, 1999; Manthey et al., 2008). The molecular fraction of galaxy mergers is higher than that in non-mergers, probably because H i flows into the galactic center and then converts into molecular gas (Larson et al., 2016). Simulations also show that the gas fraction in the inner region increases during the galaxy merger (e.g., Blumenthal & Barnes, 2018). Mergers perturb not only the spatial distribution but also the kinematics of the atomic gas (Horellou et al., 2001; Barnes, 2002; Struve et al., 2010). Within this backdrop, H i observations in principle can provide a sensitive tool to identify major mergers within the general galaxy population, complimentary to and perhaps even superior than traditional methods based on optical imaging (e.g., Conselice, 2014). However, major mergers comprise only a minority of the galaxy population (López-Sanjuan et al. 2009a, b; Lotz et al. 2011; Casteels et al. 2014; Ventou et al. 2017), and securing spatially resolved H i maps of large, unbiased samples of galaxies beyond the local Universe are impractical for the near future. We are motivated to explore whether mergers imprint recognizable features on their integrated H i line profile. If so, then large extragalactic single-dish H i surveys can be exploited to identify merger candidates efficiently.
We investigate this problem by analyzing the integrated H i spectra of a subset of the galaxies in GOALS, a well-studied sample of nearby, bright starburst galaxies that encompasses a wide range of gas-rich systems along the merger sequence. With the aid of new observations acquired using FAST and existing data collected from the literature, we assembled integrated H i spectra for 45 mergers and a control sample of 80 non-mergers matched in stellar mass from to . We analyzed the H i spectra using the recently developed “curve-of-growth” method of Yu et al. (2020) to measure a number of line profile parameters that may be potentially useful for distinguishing between 43 merging and 43 non-merger galaxies with matched stellar mass.
Intriguingly, we find that galaxies experiencing mergers do not exhibit notably broader lines compared to their non-merger counterparts. Part of the difficulty stems from our inability to correct the observed line widths for projection effects, given the lack of a clear plane of symmetry for ongoing mergers, which is further compounded by the sizable intrinsic scatter in the Tully-Fisher relation (Tully & Fisher, 1977) for galaxies of earlier Hubble type (e.g., Neistein et al. 1999; Ho 2007; Williams et al. 2010). Contrary to the conclusion of Bok et al. (2019), the mergers in our study do not show any obvious excess in asymmetry. This inconsistency is not unexpected, because Bok et al. (2019) selected their control sample using very strict criteria for isolation, while our control sample consists of more representative non-merger galaxies. While our results may suffer from small-number statistics—the sample of galaxy pairs in Bok et al. (2019) is significantly larger than ours—it is crucial to note that the extended H i disk of galaxies is inherently fragile and easily susceptible to a variety of external perturbations. Asymmetry in the gas distribution can be induced by gas accretion from the large-scale environment (e.g., Bournaud et al. 2005; Sancisi et al. 2008; Lagos et al. 2018), minor mergers of satellites (e.g., Zaritsky & Rix 1997), flyby interactions (e.g., Mapelli et al. 2008), and ram pressure stripping (e.g., Gunn & Gott 1972; Kenney et al. 2004). Ordinary field galaxies have higher H i asymmetry compared to truly isolated galaxies (Espada et al., 2011), and even some of the isolated galaxies studied by Bok et al. (2019) are highly asymmetric. Our control sample consists of galaxies that inhabit a wide range of environments (Yu et al., 2020), and hence its H i asymmetry distribution is correspondingly diverse (Figures 9c and 9d). We are forced to conclude that neither the width nor the asymmetry of the H i profile offers an effective diagnostic to identify mergers.
Much more promising is the line shape. As described in Yu et al. (2022), the line concentration parameter , defined simply as the ratio of the velocity widths enclosing 25% and 85% of the total flux (Figure 6), conveniently describes line profiles that vary from double-horned to single-peaked. According to the statistical analysis of Yu et al. (2022), at a given inclination angle, low-mass, dwarf galaxies tend to be single-peaked (large ), and high-mass galaxies of earlier type (having larger bulges) are preferentially double-horned (small ). Figures 4 and 11 clearly demonstrate that at a fixed stellar mass, mergers differ markedly from non-mergers: in view of their large stellar masses, mergers should possess double-horned H i profiles, but, instead, they predominantly show single-peaked profiles. We suggest that the relation (Figure 11) can be used as an effective tool to select massive galaxies that have a high probability of being mergers.
The relation has a simple physical underpinning. The integrated H i profile reflects the convolution of the spatial distribution of the atomic hydrogen and the velocity field of the gas, which is governed by the gravitational potential of the galaxy. Late-type, low-mass galaxies have intrinsically single-peaked H i profiles because the baryons, including the H i, resides in a small inner radial range of the dark matter halo, such that the rotation curve keeps rising in the H i disk (Oh et al., 2015). Massive, gas-rich spirals have double-horned H i profiles because their neutral atomic hydrogen distribution has a central deficit (Swaters et al., 2002) and because they have a steeply rising and then flattened rotation curve on account of their prominent bulge and less dominating dark matter halo (de Blok et al., 2008). Mergers, despite being massive systems, systematically depart from this expectation presumably because their H i gas is strongly centrally concentrated. They have no central H i hole. The gravitational torques from the merger drive gas inflow, as observed (e.g., Hibbard et al. 1994; Iono et al. 2004) and predicted by numerical simulations (e.g., Barnes & Hernquist 1996; Barnes 2002). The merger process naturally induces highly perturbed kinematics on the gas, as observed in the enhanced relative velocity offsets of the H i ().
References
- Ahumada et al. (2020) Ahumada, R., Prieto, C. A., Almeida, A., et al. 2020, ApJS, 249, 3
- Andersen & Bershady (2009) Andersen, D. R., & Bershady, M. A. 2009, ApJ, 700, 1626
- Armus et al. (2009) Armus, L., Mazzarella, J. M., Evans, A. S., et al. 2009, PASP, 121, 559
- Barnes (2002) Barnes, J. E. 2002, MNRAS, 333, 481
- Barnes & Hernquist (1992) Barnes, J. E., & Hernquist, L. 1992, ARA&A, 30, 705
- Barnes & Hernquist (1996) Barnes, J. E., & Hernquist, L. 1996, ApJ, 471, 115
- Barrera-Ballesteros et al. (2015) Barrera-Ballesteros, J. K., García-Lorenzo, B., Falcón-Barroso, J., et al. 2015, A&A, 582, A21
- Bell et al. (2003) Bell, E. F., McIntosh, D. H., Katz, N., et al. 2003, ApJS, 149, 289
- Bloom et al. (2018) Bloom, J. V., Croom, S. M., Bryant, J. J., et al. 2018, MNRAS, 476, 2339
- Bloom et al. (2017) Bloom, J. V., Fogarty, L. M. R., Croom, S. M., et al. 2017, MNRAS, 465, 123
- Blumenthal & Barnes (2018) Blumenthal, K. A. & Barnes, J. E. 2018, MNRAS, 479, 3952
- Bok et al. (2019) Bok, J., Blyth, S.-L., Gilbank, D. G., & Elson, E. C. 2019, MNRAS, 484, 582
- Bottinelli et al. (1993) Bottinelli, L., Durand, N., Fouque, P., et al. 1993, A&AS, 102, 57
- Bournaud et al. (2005) Bournaud, F., Combes, F., Jog, C. J., & Puerari, I. 2005, A&A, 438, 507
- Brown & Wilson (2019) Brown, T., & Wilson, C. D. 2019, ApJ, 879, 17
- Casteels et al. (2014) Casteels, K. R. V., Conselice, C. J., Bamford, S. P., et al. 2014, MNRAS, 445, 1157
- Catinella et al. (2012) Catinella, B., Kauffmann, G., Schiminovich, D., et al. 2012, MNRAS, 420, 1959
- Catinella et al. (2018) Catinella, B., Saintonge, A., Janowiecki, S., et al. 2018, MNRAS, 476, 875
- Catinella et al. (2008) Catinella, B., Schiminovich, D., & Kauffmann, G. 2008, in AIP Conf. Ser., The Evolution of Galaxies Through the Neutral Hydrogen Window, ed. R. Minchin & E. Momjian (Melville, NY: AIP), 252
- Cattaneo et al. (2009) Cattaneo, A., Faber, S. M., Binney, J., et al. 2009, Nature, 460, 213
- Chabrier (2003) Chabrier, G. 2003, PASP, 115, 763
- Chu et al. (2017) Chu, J. K., Sanders, D. B., Larson, K. L., et al. 2017, ApJS, 229, 25
- Conselice (2014) Conselice, C. J. 2014, ARA&A, 52, 291
- Courtois et al. (2009) Courtois, H. M., Tully, R. B., Fisher, J. R., et al. 2009, AJ, 138, 1938
- Cullen et al. (2007) Cullen, H., Alexander, P., Green, D. A., & Sheth, K. 2007, MNRAS, 376, 98
- Darg et al. (2010) Darg, D. W., Kaviraj, S., Lintott, C. J., et al. 2010, MNRAS, 401, 1552.
- Darling et al. (2011) Darling, J., Macdonald, E. P., Haynes, M. P., & Giovanelli, R. 2011, ApJ, 742, 60
- de Blok et al. (2008) de Blok, W. J. G., Walter, F., Brinks, E., et al. 2008, AJ, 136, 2648
- Deg et al. (2020) Deg, N., Blyth, S.-L., Hank, N., Kruger, S., & Carignan, C. 2020, MNRAS, 495, 1984
- Dickel & Rood (1978) Dickel, J. R., & Rood, H. J. 1978, ApJ, 223, 391
- Dutta et al. (2019) Dutta, R., Srianand, R., & Gupta, N. 2019, MNRAS, 489, 1099
- Ellison et al. (2018) Ellison, S. L., Catinella, B., & Cortese, L. 2018, MNRAS, 478, 3447
- English et al. (2010) English, J., Koribalski, B., Bland-Hawthorn, J., Freeman, K. C., & McCain, C. F. 2010, AJ, 139, 102
- Espada et al. (2011) Espada, D., Verdes-Montenegro, L., Huchtmeier, W. K., et al. 2011, A&A, 532, A117
- Feng et al. (2020) Feng, S., Shen, S.-Y., Yuan, F.-T., Riffel, R. A., & Pan, K. 2020, ApJ, 892, L20
- Gabor et al. (2016) Gabor, J. M., Capelo, P. R., Volonteri, M., et al. 2016, A&A, 592, A62
- Geréb et al. (2015) Geréb, K., Maccagni, F. M., Morganti, R., et al. 2015, A&A, 575, A44
- Glowacki et al. (2017) Glowacki, M., Allison, J. R., Sadler, E. M., et al. 2017, MNRAS, 467, 2766
- Gunn & Gott (1972) Gunn, J. E. & Gott, J. R. 1972, ApJ, 176, 1
- Haan et al. (2011) Haan, S., Surace, J. A., Armus, L., et al. 2011, AJ, 141, 100
- Haynes et al. (2018) Haynes, M. P., Giovanelli, R., Kent, B. R., et al. 2018, ApJ, 861, 49
- Haynes et al. (2011) Haynes, M. P., Giovanelli, R., Martin, A. M., et al. 2011, AJ, 142, 170
- Haynes et al. (1998) Haynes, M. P., Hogg, D. E., Maddalena, R. J., Roberts, M. S., & van Zee, L. 1998, AJ, 115, 62
- Herrero-Illana et al. (2019) Herrero-Illana, R., Privon, G. C., Evans, A. S., et al. 2019, A&A, 628, A71
- Hibbard et al. (1994) Hibbard, J. E., Guhathakurta, P., van Gorkom, J. H., & Schweizer, F. 1994, AJ, 107, 67
- Hibbard & van Gorkom (1996) Hibbard, J. E., & van Gorkom, J. H. 1996, AJ, 111, 655
- Hibbard & Yun (1999) Hibbard, J. E., & Yun, M. S. 1999, AJ, 118, 162
- Ho (2007) Ho, L. C. 2007, ApJ, 668, 94
- Horellou et al. (2001) Horellou, C., Black, J. H., van Gorkom, J. H., et al. 2001, A&A, 376, 837
- Hutchings (1989) Hutchings, J. B. 1989, AJ, 98, 524
- Inami et al. (2013) Inami, H., Armus, L., Charmandaris, V., et al. 2013, ApJ, 777, 156
- Iono et al. (2004) Iono, D., Yun, M. S., & Mihos, J. C. 2004, ApJ, 616, 199
- Iwasawa et al. (2011) Iwasawa, K., Sanders, D. B., Teng, S. H., et al. 2011, A&A, 529, A106
- Jiang et al. (2019) Jiang, P., Yue, Y., Gan, H., et al. 2019, Science China Physics, Mechanics, and Astronomy, 62, 959502
- Jin et al. (2019) Jin, J.-J., Zhu, Y.-N., Wu, H., et al. 2019, ApJS, 244, 33
- Kampczyk et al. (2013) Kampczyk, P., Lilly, S. J., de Ravel, L., et al. 2013, ApJ, 762, 43.
- Kapferer et al. (2008) Kapferer, W., Kronberger, T., Ferrari, C., Riser, T., & Schindler, S. 2008, MNRAS, 389, 1405.
- Kenney et al. (2004) Kenney, J. D. P., van Gorkom, J. H., & Vollmer, B. 2004, AJ, 127, 3361
- Koribalski & López-Sánchez (2009) Koribalski, B. S., & López-Sánchez, Á. R. 2009, MNRAS, 400, 1749.
- Koribalski et al. (2004) Koribalski, B. S., Staveley-Smith, L., Kilborn, V. A., et al. 2004, AJ, 128, 16
- Kormendy & Ho (2013) Kormendy, J., & Ho, L. C. 2013, ARA&A, 51, 511
- Kornreich et al. (2000) Kornreich, D. A., Haynes, M. P., Lovelace, R. V. E., & van Zee, L. 2000, AJ, 120, 139
- Lagos et al. (2018) Lagos, P., Scott, T. C., Nigoche-Netro, A., et al. 2018, MNRAS, 477, 392
- Larson et al. (2016) Larson, K. L., Sanders, D. B., Barnes, J. E., et al. 2016, ApJ, 825, 128
- Lewis (1987) Lewis, B. M. 1987, ApJS, 63, 515
- Li et al. (2008) Li, C., Kauffmann, G., Heckman, T. M., Jing, Y. P., & White, S. D. M. 2008, MNRAS, 385, 1903
- Linden et al. (2019) Linden, S. T., Song, Y., Evans, A. S., et al. 2019, ApJ, 881, 70
- Liu et al. (in prep.) Liu, Z., Wang, J., et al. in preparation.
- López-Sanjuan et al. (2009b) López-Sanjuan, C., Balcells, M., García-Dabó, C. E., et al. 2009, ApJ, 694, 643
- López-Sanjuan et al. (2009a) López-Sanjuan, C., Balcells, M., Pérez-González, P. G., et al. 2009, A&A, 501, 505
- Lotz et al. (2010) Lotz, J. M., Jonsson, P., Cox, T. J., & Primack, J. R. 2010, MNRAS, 404, 575
- Lotz et al. (2011) Lotz, J. M., Jonsson, P., Cox, T. J., et al. 2011, ApJ, 742, 103
- Maccagni et al. (2017) Maccagni, F. M., Morganti, R., Oosterloo, T. A., et al. 2017, A&A, 604, A43
- Madore et al. (2007) Madore, B. F., Gil de Paz, A., Pevunova, O., & Thompson, I. 2007, AJ, 134, 394
- Mancera Piña et al. (2019) Mancera Piña, P. E., Fraternali, F., Adams, E. A. K., et al. 2019, ApJ, 883, L33
- Manthey et al. (2008) Manthey, E., Aalto, S., Hüttemeister, S., & Oosterloo, T. A. 2008, A&A, 484, 693
- Manuwal et al. (2021) Manuwal, A., Ludlow, A. D., Stevens, A. R. H., Wright, R. J., & Robotham, A. S. G. 2021, arXiv e-prints, arXiv:2109.11214.
- Mapelli et al. (2008) Mapelli, M., Moore, B., & Bland-Hawthorn, J. 2008, MNRAS, 388, 697
- Marquez et al. (1996) Marquez, I., Moles, M., & Masegosa, J. 1996, A&A, 310, 401
- Mathewson et al. (1992) Mathewson, D. S., Ford, V. L., & Buchhorn, M. 1992, ApJS, 81, 413
- Matthews et al. (1998) Matthews, L. D., van Driel, W., & Gallagher, J. S. 1998, AJ, 116, 1169.
- Matthews et al. (2001) Matthews, L. D., van Driel, W., & Monnier-Ragaigne, D. 2001, A&A, 365, 1
- McGaugh (2012) McGaugh, S. S. 2012, AJ, 143, 40
- McGaugh et al. (2000) McGaugh, S. S., Schombert, J. M., Bothun, G. D., & de Blok, W. J. G. 2000, ApJ, 533, L99
- Medling et al. (2014) Medling, A. M., U, V., Guedes, J., et al. 2014, ApJ, 784, 70
- Mirabel & Sanders (1988) Mirabel, I. F., & Sanders, D. B. 1988, ApJ, 335, 104
- Mirabel & Wilson (1984) Mirabel, I. F., & Wilson, A. S. 1984, ApJ, 277, 92
- Moore et al. (1996) Moore, B., Katz, N., Lake, G., et al. 1996, Nature, 379, 613
- Moore et al. (1999) Moore, B., Lake, G., Quinn, T., et al. 1999, MNRAS, 304, 465
- Moreno et al. (2019) Moreno, J., Torrey, P., Ellison, S. L., et al. 2019, MNRAS, 485, 1320
- Morganti et al. (2005) Morganti, R., Tadhunter, C. N., & Oosterloo, T. A. 2005, A&A, 444, L9
- Mould et al. (2000) Mould, J. R., Huchra, J. P., Freedman, W. L., et al. 2000, ApJ, 529, 786
- Mundy et al. (2017) Mundy, C. J., Conselice, C. J., Duncan, K. J., et al. 2017, MNRAS, 470, 3507
- Nan et al. (2011) Nan, R., Li, D., Jin, C., et al. 2011, International Journal of Modern Physics D, 20, 989
- Neistein et al. (1999) Neistein, E., Maoz, D., Rix, H.-W., & Tonry, J. L. 1999, AJ, 117, 2666
- Oh et al. (2016) Oh, S., Yi, S. K., Cortese, L., et al. 2016, ApJ, 832, 69
- Oh et al. (2015) Oh, S.-H., Hunter, D. A., Brinks, E., et al. 2015, AJ, 149, 180
- Paturel et al. (2003) Paturel, G., Theureau, G., Bottinelli, L., et al. 2003, A&A, 412, 57
- Peterson & Shostak (1974) Peterson, S. D., & Shostak, G. S. 1974, AJ, 79, 767
- Petric et al. (2011) Petric, A. O., Armus, L., Howell, J., et al. 2011, ApJ, 730, 28
- Planck Collaboration et al. (2016) Planck Collaboration, Ade, P. A. R., Aghanim, N., Arnaud, et al. 2016, A&A, 594, A13
- Puech et al. (2008) Puech, M., Flores, H., Hammer, F., et al. 2008, A&A, 484, 173
- Puech et al. (2019) Puech, M., Flores, H., Rodrigues, M., Hammer, F., & Yang, Y. B. 2019, MNRAS, 488, 876
- Puech et al. (2010) Puech, M., Hammer, F., Flores, H., et al. 2010, A&A, 510, A68
- Reichard et al. (2008) Reichard, T. A., Heckman, T. M., Rudnick, G., Brinchmann, J., & Kauffmann, G. 2008, ApJ, 677, 186
- Reynolds et al. (2020b) Reynolds, T. N., Westmeier, T., & Staveley-Smith, L. 2020, MNRAS, 499, 3233
- Reynolds et al. (2020a) Reynolds, T. N., Westmeier, T., Staveley-Smith, L., Chauhan, G., & Lagos, C. D. P. 2020, MNRAS, 493, 5089
- Rich et al. (2015) Rich, J. A., Kewley, L. J., & Dopita, M. A. 2015, ApJS, 221, 28
- Richter & Huchtmeier (1991) Richter, O.-G., & Huchtmeier, W. K. 1991, A&AS, 87, 425
- Richter & Sancisi (1994) Richter, O.-G., & Sancisi, R. 1994, A&A, 290, L9
- Roberts (1978) Roberts, M. S. 1978, AJ, 83, 1026
- Roth et al. (1991) Roth, J., Mould, J. R., & Davies, R. D. 1991, AJ, 102, 1303
- Rubin et al. (1970) Rubin, V. C., Ford, W. K., & D’Odorico, S. 1970, ApJ, 160, 801
- Salpeter (1955) Salpeter, E. E. 1955, ApJ, 121, 161
- Sancisi et al. (2008) Sancisi, R., Fraternali, F., Oosterloo, T., et al. 2008, A&A Rev., 15, 189
- Sanders et al. (2003) Sanders, D. B., Mazzarella, J. M., Kim, D.-C., Surace, J. A., & Soifer, B. T. 2003, AJ, 126, 1607
- Scarano et al. (2008) Scarano, S., Madsen, F. R. H., Roy, N., & Lépine, J. R. D. 2008, MNRAS, 386, 963
- Scholz & Stephens (1987) Scholz, F. W., & Stephens, M. A. 1987, J. Am. Stat. Assoc., 82, 918
- Schweizer (1986) Schweizer, F. 1986, Science, 231, 227
- Schweizer (1996) Schweizer, F. 1996, AJ, 111, 109
- Scott et al. (2018) Scott, T. C., Brinks, E., Cortese, L., Boselli, A., & Bravo-Alfaro, H. 2018, MNRAS, 475, 4648.
- Scudder et al. (2015) Scudder, J. M., Ellison, S. L., Momjian, E., et al. 2015, MNRAS, 449, 3719
- Serra et al. (2015) Serra, P., Koribalski, B., Kilborn, V., et al. 2015, MNRAS, 452, 2680
- Shangguan et al. (2019) Shangguan, J., Ho, L. C., Li, R., et al. 2019, ApJ, 870, 104
- Sinha & Holley-Bockelmann (2009) Sinha, M., & Holley-Bockelmann, K. 2009, MNRAS, 397, 190
- Skrutskie et al. (2006) Skrutskie, M. F., Cutri, R. M., Stiening, R., et al. 2006, AJ, 131, 1163.
- Springob et al. (2005) Springob, C. M., Haynes, M. P., Giovanelli, R., & Kent, B. R. 2005, ApJS, 160, 149
- Staveley-Smith & Davies (1987) Staveley-Smith, L., & Davies, R. D. 1987, MNRAS, 224, 953
- Staveley-Smith et al. (1996) Staveley-Smith, L., Wilson, W. E., Bird, T. S., et al. 1996, PASA, 13, 243
- Stierwalt et al. (2013) Stierwalt, S., Armus, L., Surace, J. A., et al. 2013, ApJS, 206, 1
- Struve et al. (2010) Struve, C., Oosterloo, T. A., Morganti, R., et al. 2010, A&A, 515, A67
- Surace et al. (2004) Surace, J. A., Sanders, D. B., & Mazzarella, J. M. 2004, AJ, 127, 3235
- Swaters et al. (1999) Swaters, R. A., Schoenmakers, R. H. M., Sancisi, R., & van Albada, T. S. 1999, MNRAS, 304, 330
- Swaters et al. (2002) Swaters, R. A., van Albada, T. S., van der Hulst, J. M., & Sancisi, R. 2002, A&A, 390, 829
- Tapia et al. (2017) Tapia, T., Eliche-Moral, M. C., Aceves, H., et al. 2017, A&A, 604, A105
- Theureau et al. (1998) Theureau, G., Bottinelli, L., Coudreau-Durand, N., et al. 1998, A&AS, 130, 333
- Theureau et al. (2007) Theureau, G., Hanski, M. O., Coudreau, N., Hallet, N., & Martin, J.-M. 2007, A&A, 465, 71
- Tifft & Cocke (1988) Tifft, W. G., & Cocke, W. J. 1988, ApJS, 67, 1
- Toomre (1977) Toomre, A. 1977, in Evolution of Galaxies and Stellar Populations, ed. B. M. Tinsley, D. C. Larson, & Richard B. Gehret (New Haven, CT: Yale Univ. Observatory), 401
- Toomre & Toomre (1972) Toomre, A., & Toomre, J. 1972, ApJ, 178, 623
- Tully & Fisher (1977) Tully, R. B., & Fisher, J. R. 1977, A&A, 500, 105.
- Vandervoort (2018) Vandervoort, P. O. 2018, MNRAS, 474, 4186
- van Driel et al. (2016) van Driel, W., Butcher, Z., Schneider, S., et al. 2016, A&A, 595, A118
- van Driel et al. (2001) van Driel, W., Marcum, P., Gallagher, J. S., et al. 2001, A&A, 378, 370
- van Velzen et al. (2012) van Velzen, S., Falcke, H., Schellart, P., Nierstenhöfer, N., & Kampert, K.-H. 2012, A&A, 544, A18
- Ventou et al. (2017) Ventou, E., Contini, T., Bouché, N., et al. 2017, A&A, 608, A9
- Wang et al. (2020) Wang, J., Catinella, B., Saintonge, A., et al. 2020, ApJ, 890, 63
- Wang et al. (2013) Wang, J., Kauffmann, G., Józsa, G. I. G., et al. 2013, MNRAS, 433, 270
- Watts et al. (2020a) Watts, A. B., Catinella, B., Cortese, L., & Power, C. 2020, MNRAS, 492, 3672
- Watts et al. (2021) Watts, A. B., Catinella, B., Cortese, L., Power, C., & Ellison, S. L. 2021, MNRAS, 504, 1989
- Watts et al. (2020b) Watts, A. B., Power, C., Catinella, B., Cortese, L., & Stevens, A. R. H. 2020, MNRAS, 499, 5205
- Wenger et al. (2000) Wenger, M., Ochsenbein, F., Egret, D., et al. 2000, A&AS, 143, 9
- Westmeier et al. (2014) Westmeier, T., Jurek, R., Obreschkow, D., Koribalski, B. S., & Staveley-Smith, L. 2014, MNRAS, 438, 1176
- Williams et al. (2010) Williams, M. J., Bureau, M., & Cappellari, M. 2010, MNRAS, 409, 1307
- Xu et al. (2015) Xu, C. K., Cao, C., Lu, N., et al. 2015, ApJ, 799, 11
- Yamashita et al. (2017) Yamashita, T., Komugi, S., Matsuhara, H., et al. 2017, ApJ, 844, 96
- Yu et al. (2020) Yu, N., Ho, L. C., & Wang, J. 2020, ApJ, 898, 102
- Yu et al. (2022) Yu, N., Ho, L. C., Wang, J., & Li, H. 2022, ApJ, submitted
- Yuan et al. (2010) Yuan, T.-T., Kewley, L. J., & Sanders, D. B. 2010, ApJ, 709, 884
- Yun & Hibbard (2001) Yun, M. S., & Hibbard, J. E. 2001, ApJ, 550, 104
- Yun et al. (1994) Yun, M. S., Ho, P. T. P., & Lo, K. Y. 1994, Nature, 372, 530
- Zaritsky & Rix (1997) Zaritsky, D. & Rix, H.-W. 1997, ApJ, 477, 118