UV counterpart of an X-ray ultra-fast outflow in IRAS 17020+4544
Abstract
We report on the discovery of a UV absorption counterpart of a low-ionization X-ray ultra-fast outflow (UFO) in the Narrow-Line Seyfert-1 galaxy IRAS 17020+4544. This UV signature of the UFO is seen as a narrow and blueshifted Ly absorption feature in the far-UV spectrum, taken with the Cosmic Origins Spectrograph (COS) on the Hubble Space Telescope (HST). The Ly feature is found to be outflowing with a velocity of (). We carry out high-resolution UV spectroscopy and photoionization modeling to study the UFO that is seen in the HTS/COS spectrum. The results of our modeling show that the UV UFO corresponds to a low-ionization, low-velocity component of the X-ray UFO found previously with XMM-Newton’s Reflection Grating Spectrometer (RGS). The other higher-velocity and higher-ionization components of the X-ray UFOs are not significantly detected in the HST/COS spectrum, consistent with predictions of our photoionization calculations. The multiple ionization and velocity components of the UFOs in IRAS 17020+4544 suggest a scenario where a powerful primary UFO entrains and shocks the ambient medium, resulting in formation of weaker secondary UFO components, such as the one found in the UV band.
1 Introduction
The observational relations between supermassive black holes (SMBHs) and their host galaxies (e.g. Kormendy & Ho 2013) suggest that they are co-evolved. However, the mechanism needed for this co-evolution is not yet fully understood. In active galactic nuclei (AGN), accretion onto the SMBH liberates enormous power, but how this power is transferred from the small scales close to the SMBH to the larger scales of the galaxy is uncertain. The accretion in AGN is accompanied by outflowing winds, which transfer energy into the interstellar medium (ISM) of the host galaxy. The resulting feedback mechanism may have an important impact on star formation and galaxy evolution (see e.g. Silk & Rees 1998; King & Pounds 2015; Gaspari & Sądowski 2017).
The AGN feedback models suggest the kinetic luminosity of AGN outflows needs to be at least 0.5–5% Eddington luminosity to have a significant impact on the galaxy evolution (Di Matteo et al., 2005; Hopkins & Elvis, 2010). The energetic ultra-fast outflows (UFOs, Tombesi et al. 2010), with relativistic outflow velocities, are a crucial component of AGN outflows as they have adequate kinetic luminosity to play a key role in AGN feedback. UFOs consist of highly-ionized outflows, which primarily imprint their absorption signatures in hard X-rays in the Fe-K band, namely through Fe XXV and Fe XXVI lines; see e.g. case studies of PG 1211+143 (catalog ) (Pounds et al., 2003a) and PDS 456 (catalog ) (Reeves et al., 2018a). X-ray studies of nearby Seyfert-1 galaxies find that about 40% of them have highly-ionized UFOs, detected in tens of targets (Tombesi et al., 2010; Gofford et al., 2013). The presence of UFOs alongside molecular outflows have also been discovered, suggesting a physical connection between the small-scale outflows near the accretion disk and the large-scale galactic outflows (Tombesi et al., 2015; Longinotti et al., 2018; Chartas et al., 2020). There are however still significant gaps in our understanding of the physical structure of UFOs, how they operate in AGN, and what is their relation to the less energetic warm-absorber outflows (e.g. Blustin et al. 2005; Laha et al. 2014), which have moderate outflow velocities ( few 1000 km s-1).
Observational results that have come into light in recent years suggest that absorption signatures of UFOs are not only confined to the hard X-ray band, produced by highly-ionized gas. UFOs with relatively low ionizations and multiple components have been found in the soft X-ray band: Ark 564 (Gupta et al., 2013), Mrk 590 (Gupta et al., 2015), IRAS 17020+4544 (Longinotti et al., 2015), and Mrk 1044 (Krongold et al., 2021). Also, counterparts of the hard X-ray UFOs in the Fe-K band have been found in the soft X-ray spectra of PG 1211+143 (Reeves et al., 2018b) and PG 1114+445 (Serafinelli et al., 2019). Interestingly, lower-ionization counterparts of the UFOs found in X-rays have been discovered at even lower energies in the UV band. A broad and relativistically blueshifted H I Ly absorption feature was found in the HST/COS (Green et al., 2012) spectrum of PG 1211+143 by Kriss et al. (2018a), matching the velocity of one of the X-ray UFO absorption components. Broad absorption lines (BALs) in PDS 456, namely an unidentified feature short-ward of Ly and a highly blueshifted C IV feature (Hamann et al., 2018), are also thought to be associated with the X-ray UFO in this AGN. Overall, these recent multi-wavelength findings indicate that UFOs may be multi-ionization outflows in AGN.
High-resolution UV spectroscopy with HST can play a crucial role in UFO studies by observing the UV counterpart of the X-ray UFO, thus providing additional physical information about the outflowing gas, such as their kinematics and multi-ionization structure, which are challenging to ascertain from the X-rays alone. This was demonstrated by the study of the Ly counterpart of the X-ray UFO in PG 1211+143 (Kriss et al., 2018a). The superior signal-to-noise ratio (S/N) and spectral resolution in the UV band, facilitated thanks to HST/COS, may complement and advance the X-ray UFO studies, which are currently mostly limited to CCD-resolution spectroscopy in the Fe-K band and high-resolution X-ray grating spectroscopy for only the very few brightest AGN. Depending on the photoionization parameters of the UFO gas, its absorption lines may be detectable in the UV band. Such photoionization calculations and UV predictions for UFOs were reported as part of the investigation by Kriss et al. (2018b). As long as the outflowing gas is not overly ionized, UV absorption lines such Ly would be produced in the HST/COS energy band. While UFOs are most commonly detected as highly-ionized outflows (Tombesi et al., 2010), the rarer cases of moderately-ionized X-ray UFOs open a new window for studying these UFOs through high-resolution UV spectroscopy, as previously reported in PG 1211+143 (Kriss et al., 2018a) and presented here in this paper for IRAS 17020+4544.
IRAS 17020+4544 is a Narrow-Line Seyfert-1 galaxy at redshift (de Grijp et al., 1992) as given in the NASA/IPAC Extragalactic Database (NED). In the XMM-Newton Reflection Grating Spectrometer (RGS, den Herder et al. 2001) study of IRAS 17020+4544, Longinotti et al. (2015) discovered the presence of five UFO components in the soft X-ray band. These UFO components, outflowing with velocities ranging from to , were found along with typical warm-absorber outflows in this AGN. These UFOs in IRAS 17020+4544 were reported to be capable of playing a significant role in AGN feedback. The modeling of the RGS spectra showed the UFO absorption features are produced by a broad range of low to medium ionization levels, seen mostly as O IV to O VIII lines, with also hints of O II and O III absorption (Longinotti et al., 2015). The modeling of the multi-component UFO features in IRAS 17020+4544 showed they are present as narrow absorption lines in the RGS spectrum, consistent with the instrumental line broadening. The UFO and the warm absorber in IRAS 17020+4544 were further studied in a follow-up paper by Sanfrutos et al. (2018). They found significant variations in the velocity and ionization of two components of the warm absorber, seen between the 2004 and 2014 XMM-Newton observations. The variable warm-absorber was interpreted as a consequence of a ‘shocked outflow’ scenario, where the UFO sweeps and shocks the ambient medium. Most recently, Salomé et al. (2021) studied the molecular outflows in IRAS 17020+4544 in the context of AGN feedback, which may possibly have an association to the observed UFO in this AGN. Interestingly, IRAS 17020+4544 is one of a few AGN showing compelling evidence for an energy-conserving outflow on galactic scales. This was first discovered by Longinotti et al. (2018) using observations with the Large Millimeter Telescope (LMT), and since then has been verified (Longinotti et al. in prep) using observations with the NOrthern Extended Millimeter Array (NOEMA). The radio observations of IRAS 17020+4544 suggest the presence of a jetted non-thermal source at milli-arcsecond spatial scales (Giroletti et al., 2017); the inter-play between this radio source and the outflowing wind is currently under investigation (Stanghellini et al. in prep).
In this paper we investigate the UV spectral signatures of the X-ray UFOs in IRAS 17020+4544 using our HST/COS observations taken in 2018. This enables us to examine the multi-ionization structure of the UFOs in IRAS 17020+4544 by exploring the presence of any expected UV counterparts of the X-ray UFOs, and accurately ascertain the parameters of the outflows thanks to the high-resolution and high-S/N HST/COS data. Since UV counterparts of X-ray UFOs have only been found and studied in a couple of AGN (PG 1211+143, Kriss et al. 2018a; PDS 456, Hamann et al. 2018), currently a general understanding of the relation between UV and X-ray components of the UFOs is missing. By investigating this in a new AGN, and thereby increasing the number of cases, the differences and similarities between the multi-component UFOs in AGN can be investigated. This helps towards delineating a general physical picture of the UFO phenomenon in AGN.
The structure of the paper is as follows. In Section 2 we describe the HST/COS observations of IRAS 17020+4544 and their data processing and preparation. The spectroscopic analysis and modeling of the UFO as seen in the HST/COS spectrum are presented in Section 3. In Section 4 we discuss and interpret the results of our modeling and give our conclusions. Our HST/COS spectral fitting and photoionization modeling in this paper were done in Python and with the Cloudy v17.02 photoionization code (Ferland et al., 2017).
2 Observations and data processing
The log of the HST/COS observations of IRAS 17020+4544, proposed by our team (PI: Krongold) and observed in HST Cycle 25, is provided in Table 1. The observations, taken over 9 orbits during COS Lifetime Position 4 (LP4), used grating G140L with the central wavelength setting of 1105 Å, covering the wavelength range of 1101–2291 Å. The COS exposures were taken at all four grating offset positions (FP-POS), so that the spectrum falls on slightly different areas of the detector, thus eliminating the effects of detector artifacts such as flat-field features (Hirschauer, 2021).
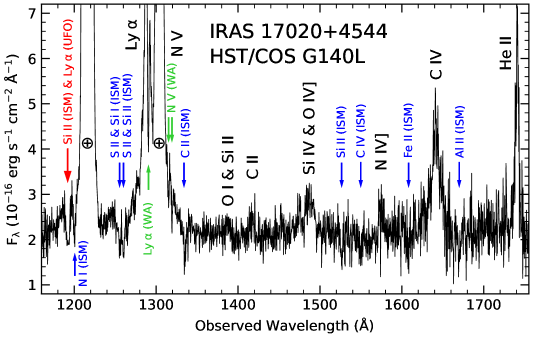
Our HST/COS data of IRAS 17020+4544 were retrieved from the Mikulski Archive for Space Telescopes (MAST) and processed with the latest COS calibration pipeline, CalCOS v3.3.10. These data can be accessed via https://doi.org/10.17909/gpc6-xv04 (catalog 10.17909/gpc6-xv04). We verified the expected accuracy of the wavelength calibration by examining the observed wavelengths of suitable Galactic ISM lines in the spectrum. All COS exposures were combined to produce one calibrated merged spectrum. This COS spectrum was then binned by four pixels to improve the S/N while still oversampling the 10-pixel resolution element on the far-UV detector (Fox et al., 2018). An overview of the final COS spectrum of IRAS 17020+4544 in the far-UV band is shown in Figure 1.
| Instrument / | Dataset | Start time | Exposure |
|---|---|---|---|
| Grating | ID | yyyy-mm-dd hh:mm:ss | (ks) |
| COS / G140L | LDHP01010 | 2018-11-23 22:50:35 | 7.61 |
| COS / G140L | LDHP02010 | 2018-11-24 03:43:35 | 7.61 |
| COS / G140L | LDHP03010 | 2018-11-24 08:29:31 | 7.61 |
Note. — The data correspond to proposal ID number 15239, obtained in HST Cycle 25. All G140L exposures were taken with the central-wavelength setting 1105 Å.
3 Spectral analysis and modeling
We began our spectral analysis of IRAS 17020+4544 by examining regions of the COS spectrum where any UV counterpart of the X-ray UFO components may appear. The best-fit parameters of the X-ray UFO, measured most recently by Sanfrutos et al. (2018), are provided in Table 2. The X-ray UFO is found to have four ionization components, named ‘UFO 1’, ‘UFO 2’, ‘UFO 3’, and ‘UFO 4’. However, the X-ray UFO consists of only two velocity components, which we refer to as the ‘high-velocity’ (UFO 1 and UFO 2) and ‘low-velocity’ (UFO 3 and UFO 4) components of the X-ray UFO. Only the UFO 1 and UFO 3 components are persistently present in both the 2004 and 2014 X-ray data. The UFO 2 and UFO 4 components are not seen in the 2004 data, and thus may not always be present in our line of sight.
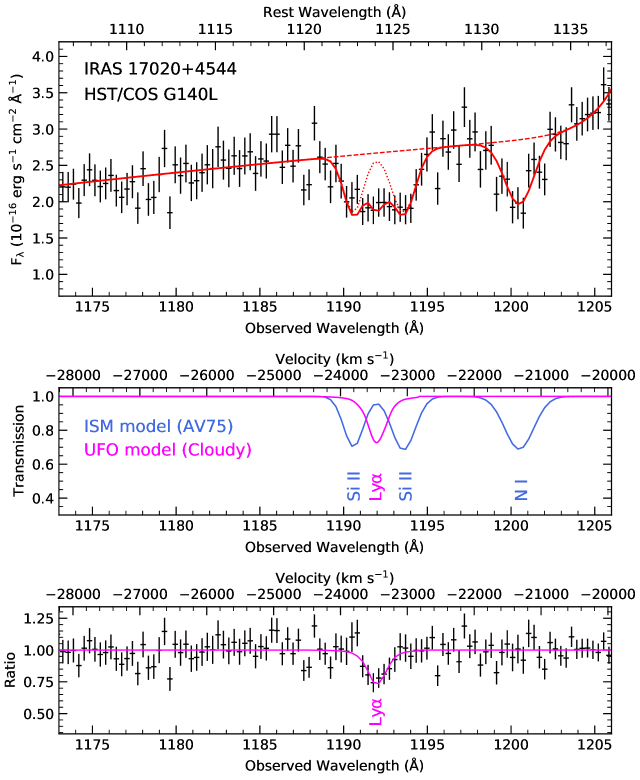
By taking into account the outflow velocities of the X-ray UFO components (Table 2), and the cosmological redshift of the AGN, we calculated the resulting observed wavelengths of typical UV absorption lines, such as Ly and C IV, and searched for them in the COS spectrum. Remarkably, we found a Ly absorption feature corresponding to the low-velocity components of the X-ray UFO (Table 2), which we will give more detail on later in Section 3.2. The location of this Ly feature, outflowing with a velocity of , is indicated by the red arrow in the overview spectrum of Figure 1. A close-up of this UFO region is presented later in Figure 2. Incidentally, the blueshifted Ly UFO feature, observed at a central wavelength of 1192.0 Å, happens to fall in a region of the spectrum where there are also two foreground Galactic ISM lines: the Si II doublet at 1190.4 and 1193.3.
| Component | |||
|---|---|---|---|
| name | ( ) | () | |
| UFO 1 | |||
| UFO 2 | ′′ | ||
| UFO 3 | |||
| UFO 4 | ′′ |
Note. — The modeling adopts full covering fraction (). Only the UFO 1 and UFO 3 components have been persistently present, as UFO 2 and UFO 4 were not seen in earlier 2004 X-ray data. We refer to UFO 1 and UFO 2 as the ‘high-velocity’ components, and UFO 3 and UFO 4 as the ‘low-velocity’ components of the X-ray UFO. The low-velocity components of the X-ray UFO can alternatively be modeled as one component with ionization parameter , column density , and the outflow velocity (‘Comp. A’ in Longinotti et al. 2015).
Before considering the feature at 1192.0 Å as the UV counterpart of the X-ray UFO, we first investigated whether or not it can be a line from the warm absorber of IRAS 17020+4544, or any intervening gas between us and IRAS 17020+4544. Using the X-ray warm absorber model of Sanfrutos et al. (2018), we calculated the corresponding UV absorption model and compared that with our HST/COS spectrum. The X-ray warm-absorber consists of four components, with their velocities ranging from an inflow of to an outflow of . Our UV calculations were done using the Cloudy code with the parameters of the warm-absorber components taken from Table 1 of Sanfrutos et al. (2018). From this comparison between the model and the COS spectrum we ascertain that the feature at 1192.0 Å cannot be attributed to any neutral or ionized absorption line from the warm absorber (see also Sect. 3.3). Our analysis of the COS spectrum shows that the only UV warm-absorber present, seen as Ly and N V lines (Figure 1), has an inflow velocity of about , which corresponds to the ‘WA 1’ component of Sanfrutos et al. (2018) at , as well as the molecular CO line found by Longinotti et al. (2018) at (their ‘Line B’ component). This intrinsic UV absorption component, which has a relatively low velocity, cannot explain the highly blueshifted feature at 1192.0 Å. Our calculations show no neutral or ionized absorption line at this wavelength can be produced by the UV warm absorber considering the low velocity and the column density of the observed Ly and N V lines. Therefore, we deduce that the feature at 1192.0 Å is not a line from any X-ray or UV component of the warm absorber in IRAS 17020+4544. The lack of any significant UV absorption by the other components of the X-ray warm-absorber in the COS spectrum is likely because of the ionization state of those components and/or their low covering fraction of the UV source. Our team plans to publish a separate paper on the UV warm-absorber in IRAS 17020+4544 and its relation to the molecular and X-ray outflows in this AGN. Hence, while we have established that the 1192.0 Å feature cannot be any warm-absorber line, we do not discuss the warm absorber further in this paper, which is focused on the study of the UFO in IRAS 17020+4544.
The feature at 1192.0 Å cannot be from any intervening intergalactic medium (IGM). Any feasible IGM line would only appear at wavelengths Å produced by Ly, whereas the feature is observed at 1192.0 Å. Likewise, there is no possible interstellar medium (ISM) line at the wavelength of 1192.0 Å; the modeling of the actual ISM lines near the feature is shown in Section 3.1. The 1192.0 Å feature cannot be explained by any ion or line other than Ly, because otherwise various associated lines would also be produced, which are not observed in the COS spectrum. This point is demonstrated by the series of spectral calculations provided later in Section 3.3 (Figure 5). The feature at 1192.0 Å can only be explained as a blue-shifted Ly line, produced by a gas with high outflow velocity. Since such a high outflow velocity gas is already seen in IRAS 17020+4544 as a UFO in the X-ray band (Longinotti et al., 2015; Sanfrutos et al., 2018), and the velocity of the Ly feature is consistent with that of the low-ionization, low-velocity component of the X-ray UFO, it is reasonable to infer that the feature is associated to the X-ray UFO. We investigate this by photoionization modeling and spectral fitting in Section 3.2.
The blueshifted Ly line at 1192.0 Å is blended with the two adjacent Si II lines, therefore, it is essential to model precisely both the UFO and ISM lines. Importantly, COS G140L is capable of resolving the two lines of the Si II doublet, as we demonstrate in Section 3.1, where we derive an ISM model from G140L observations of other targets with the same instrumental settings. We then apply our derived ISM model to the COS spectrum of IRAS 17020+4544 in Section 3.2, where we carry out parametrization and photoionization modeling of the UV UFO feature.
We note that in this paper the outflow velocity that we quote and show in figures is the relativistic outflow velocity , calculated as
,
where is the speed of light,
,
is the observed wavelength of a spectral line, and is the rest wavelength of the spectral line, and is the cosmological redshift. For IRAS 17020+4544 according to optical spectroscopy by de Grijp et al. (1992), or alternatively based on the recent study of the double-peak CO lines by Salomé et al. (2021). In this paper we adopted the redshift value which was used in the prior X-ray studies of IRAS 17020+4544 (Longinotti et al., 2015; Sanfrutos et al., 2018), which is , for a consistent comparison with the velocities of the X-ray absorption components. Nonetheless, the velocity difference between the two redshift values ( ) is relatively small compared to the velocity of the UFO in IRAS 17020+4544.
3.1 Modeling of the ISM absorption lines
To model the blueshifted Ly feature of the UFO in IRAS 17020+4544, a model for the neighboring ISM lines in the HST/COS spectrum is required. We derived this model using HTS/COS G140L observations of an O-type star named AV75 (catalog ), which has been a standard reference target for calibrating the resolution of the COS instrument (Fox et al., 2018). For comparison and further checks, we also produced a mean ISM spectrum from HST/COS G140L observations of those quasi-stellar objects (QSOs) with the highest S/N for spectroscopy of the Si II and N I ISM lines, that were taken with identical COS instrumental setup and settings as our IRAS 17020+4544 observations. This resulted in selection of seven QSOs. The selected AV75 and QSO datasets111Dataset IDs: LDQ701070, LDUH01070, LDUH51070, LE0R01070,
LEFC01070, LE2J01010, LE2J02010, LE2J03010, LE2J05010,
LE2J06010, LE2J12010, LE2J13010. were observed with the G140L grating, the central-wavelength setting of 1105 Å, taken during the COS LP4 period, which are the same as our IRAS 17020+4544 observations. Therefore, the ISM transmission model that is derived, which is already convolved with the instrumental effects such as the line spread function (LSF), is directly applicable to the COS spectrum of IRAS 17020+4544. The processing of the AV75 and QSO data follows the same procedure described in Section 2 for IRAS 17020+4544.
Figure 3 shows the HTS/COS G140L spectrum of AV75 (top panel) and the stacked QSO sample (bottom panel). Our best-fit model to the ISM lines of the Si II doublet and N I are also displayed. For modeling these narrow ISM lines a local continuum fit is adequate as here we are not concerned with the intrinsic broadband continuum of the objects. To this end, we fitted a polynomial function to represent both the continuum and any other underlying broad spectral features. This local continuum model is fitted over the band displayed in Figure 3, while excluding wavelengths where any narrow feature resides. Each of the three absorption lines (Si II doublet and N I) was fitted with a Gaussian function as shown in Figure 3. As AV75 is in the Small Magellanic Cloud (SMC), its observed stellar absorption lines are redshifted by . This velocity shift is taken into account in our modeling of the lines.
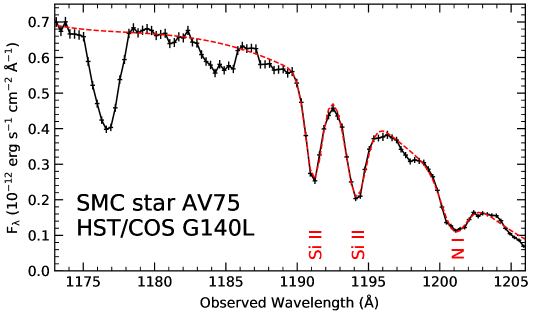
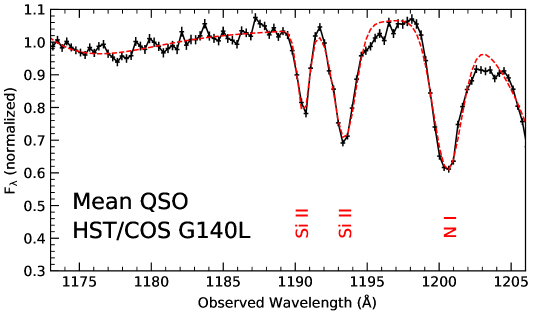
The ISM transmission model derived from AV75 is used for our final fitting of the IRAS 17020+4544 spectrum in Section 3.2 (Figure 2). The AV75 ISM model is normalized to take into account the Galactic column density in our line of sight towards IRAS 17020+4544 ( , Kalberla et al. 2005) while maintaining the line ratios and widths according to the AV75 ISM model. Since AV75 is the reference calibration target for HST/COS, it is the most appropriate target to use. In any case, we find that the results of our UFO modeling remains the same by using the ISM model derived from the mean QSO spectrum. The individual ISM lines in the AV75 and QSO spectra (Figure 3) are narrow as their widths are consistent with predominantly instrumental broadening by G140L. Importantly, both the AV75 and QSO spectra show that the individual lines of the Si II doublet are resolved (Figure 3), and there is no additional feature present between the two Si II lines. This is in contrast to the IRAS 17020+4544 spectrum, where there is an additional absorption feature (Figure 2, left panels), corresponding to the Ly absorption line of the X-ray UFO. The fact that the N I line in the Ly region (Figure 2, left panels) and the Si II line in the C IV region (Figure 2, right panels) are both narrow and fitted well with the AV75 ISM model, verifies that the Si II doublet lines that are around the Ly feature must also be narrow. Therefore, two peculiarly broad Si II lines cannot explain the blended feature at 1192.0 Å as they would be physically inconsistent with the other ISM lines in the COS spectrum. Our modeling of the UV UFO in IRAS 17020+4544 is described below in Section 3.2.
3.2 Modeling of the UV UFO in IRAS 17020+4544
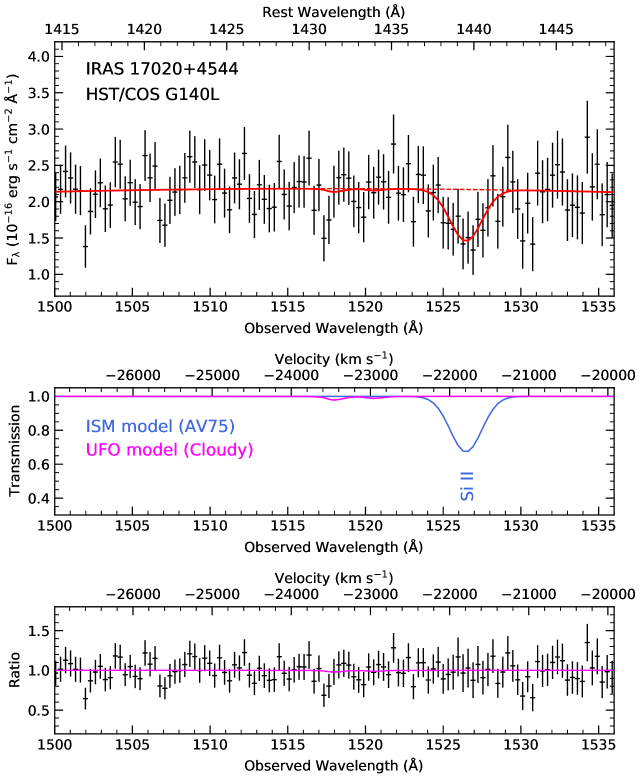
We used the Cloudy v17.02 code (Ferland et al., 2017) for both photoionization modeling and the calculation of the UV spectrum of the UFO in IRAS 17020+4544. We produced a grid of model spectra computed by Cloudy to fit the Ly feature (Figure 2, left panels), and to also calculate and examine the corresponding UV absorption model in other regions of the COS spectrum, notably the C IV doublet (Figure 2, right panels) where the second strongest signature would be detectable. The associated blueshifted N V doublet falls on the geocoronal Ly emission line at 1216 Å and thus is unobservable. Also, any corresponding blueshifted Ly and O VI lines from the UFO would fall outside of the COS spectral band.
For photoionization modeling we used one of the built-in spectral energy distributions (SEDs) in Cloudy that represents the SED of a typical type-1 AGN. This SED corresponds to the intrinsic broadband continuum of NGC 5548, derived by Mehdipour et al. (2015) from an extensive multi-wavelength campaign. The choice of the specific SED does not affect our finding of the Ly UFO feature in the COS spectrum, but rather for a given ionization parameter the inferred column density that fits the data can be slightly different if adopting other type-1 AGN SED models. The relation between the ionization parameter (defined by Davidson 1977) and the ionization parameter (defined by Krolik et al. 1981) is: . For our Cloudy calculations we adopted the proto-solar abundances of Lodders et al. (2009).
As the X-ray lines of the UFO in IRAS 17020+4544 were seen to be narrow (consistent with instrumental broadening) in the RGS spectrum (Longinotti et al., 2015; Sanfrutos et al., 2018), in our Cloudy calculations we did not add any turbulent line broadening. The calculated model spectra from Cloudy, which contain natural and thermal line broadenings, were then convolved with the appropriate COS Line Spread Function (LSF) for our observations to take into account the instrumental line broadening. We find the resulting Ly profile matches well the observed UFO feature in the COS spectrum without needing any additional line broadening. The Ly UFO feature (Figure 2, left panels) is consistent with being narrow (i.e. consistent with instrumental broadening) in the HST/COS spectrum.
For fitting the observed local continuum we used a polynomial function to take into account both the intrinsic continuum and any contribution from broad spectral features, such as the wing of the nearby geocoronal Ly emission line. In our modeling we also incorporated the ISM transmission model that we derived earlier in Section 3.1 to fit the narrow ISM lines of Si II and N I.
In our modeling of the Ly feature we fixed the ionization parameter to that of the persistent low-ionization, low-velocity component of the X-ray UFO (Table 2): , i.e. ‘UFO 3’ in Sanfrutos et al. (2018) or ‘Comp. A’ in Longinotti et al. (2015). As the outflow velocity of the blueshifted Ly feature ( ) is consistent with that of this low-velocity X-ray UFO component ( in Longinotti et al. 2015, or in Sanfrutos et al. 2018), it is reasonable to assume they originate from similar photoionized regions. Indeed our adopted ionization parameter is fully consistent with the observed COS spectrum, where only Ly is significantly detected, and other lines such as the C IV and N V doublets are not present in the spectrum (see Figures 1, 2, and 5). For the low-velocity X-ray UFO components (Table 2), the Cloudy predictions show that, compared to the 1192 Å Ly feature, absorption lines from other ions would be too weak to be significantly detected in the COS spectrum (Figures 2 and 5).
| Model | () | () | ||
|---|---|---|---|---|
| A | (f) | (f) | ||
| B | (f) | (f) |
Note. — Our Model A, where the UFO gas fully covers the UV source, is consistent with the persistent low-velocity component of the X-ray UFO (UFO 3 in Table 2). Our Model B, where the UFO partially covers the UV source with higher column density, corresponds to both of the low-velocity components of the X-ray UFO (UFO 3 and UFO 4 in Table 2). The ‘(f)’ denotes the parameter is fixed. The parameter errors are given at the 1 confidence level. The best-fit statistics for both models are for 106 degrees-of-freedom (DOF).
We fitted the blueshifted Ly absorption feature at 1192 Å (Figure 2, left panels) by parameterizing the column density (), covering fraction (), and the outflow velocity (). We considered two possible scenarios: Model A, where full covering of the UV source is assumed () and is fitted; Model B, where is fitted, while is fixed to the total of the low-velocity components of the X-ray UFO (UFO 3 and UFO 4 in Table 2), which Longinotti et al. (2015) have modeled them as one component with and . Since UFO 3 and UFO 4 have identical velocities, their Ly absorption lines would be blended and thus cannot be distinguished in our modeling, therefore we model UFO 3 and UFO 4 as one component like in Longinotti et al. (2015).
Both Model A and Model B provide equally good fits to the COS data and look almost identical to each other. Interestingly, our fitted parameters of Model A nearly match within errors the parameters of the persistent low-velocity component of the X-ray UFO (UFO 3 in Table 2). Our best-fit parameters of Model A and Model B are given in Table 3. The best-fit model to the Ly feature is shown on the left panels of Figure 2, and its predicted absorption model in the C IV region (which is insignificant) is shown on the right panels of Figure 2. We use Model A for display in Figure 2 (Model B would look almost identical). We discuss the modeling results in Section 4.
The blueshifted Ly absorption line at 1192.0 Å has an equivalent width (EW) of 0.42 Å and is a significant feature in the COS spectrum (S/N = 6 ). By including the Ly line in our modeling, the best fit is improved from () to (). This is statistically highly significant. The corresponding F-test statistic value is 19.9 with a p-value of . The significance of the Ly feature is also evident by the fact that the fitted model parameters are constrained (relatively small errors in Table 3). On the other hand, the inclusion of blue-shifted C IV absorption (Figure 2, right panels) makes no significant difference to the fit in that region of the spectrum: () to ().
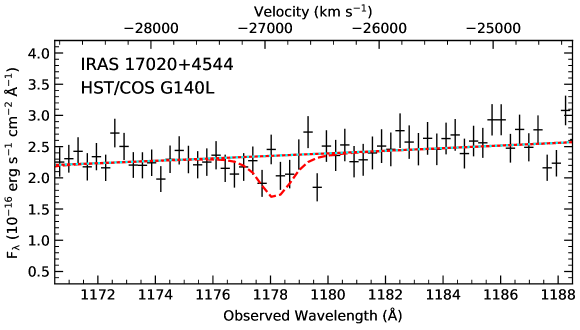
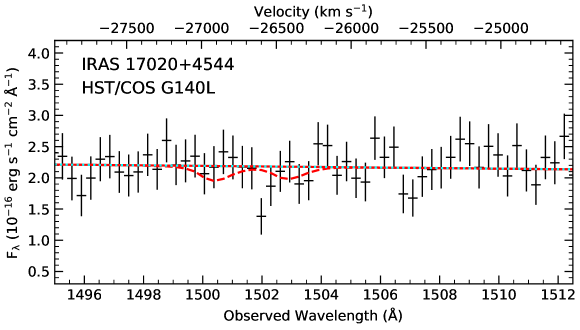
Apart from the low-velocity components of the X-ray UFO, which we have modeled above, there are also two high-velocity components (UFO 1 and UFO 2 in Table 2). These two components have an outflow velocity of about (Sanfrutos et al., 2018), and thus would fall in a different region of the COS spectrum. To check for the UV presence of these components, we calculated their model spectra with Cloudy using the parameters of Sanfrutos et al. (2018) given in Table 2. We assumed a case of full-covering fraction. The predicted Cloudy models, which are blueshifted with and convolved with the COS LSF, are plotted over the COS spectrum in Figure 4. The COS data show no significant UV counterparts of these high-velocity X-ray UFO components are present in either the Ly region (top panel) or the C IV region (bottom panel). The model for UFO 2 shows that it is too highly ionized to produce any UV absorption line (Figure 4), which is consistent with the COS data. The UFO 1 component produces some Ly absorption when assuming full covering fraction (Figure 4). However, considering that this component may partially cover the UV source (such as in our Model B scenario), and hence the Ly absorption model could be even weaker than that displayed in Figure 4 (top panel) with , the predicted Cloudy model is consistent with the lack of significant detection in the COS spectrum.
If we adopt a scenario of a full-covering UV absorber (our Model A) the that fits the Ly line matches that of the X-ray UFO 3 component. However, if both UFO 3 and UFO 4 components contribute to the Ly absorption (hence a higher ), then the partially-covering scenario (our Model B) becomes applicable. Nonetheless, whichever way the Ly feature is fitted, the other associated lines, such as the C IV and N V doublets, are still too weak to be significantly detected in the COS spectrum according to our Cloudy calculations (see Figure 5, top right panel).
3.3 Reasoning for the Ly explanation of the 1192 Å feature
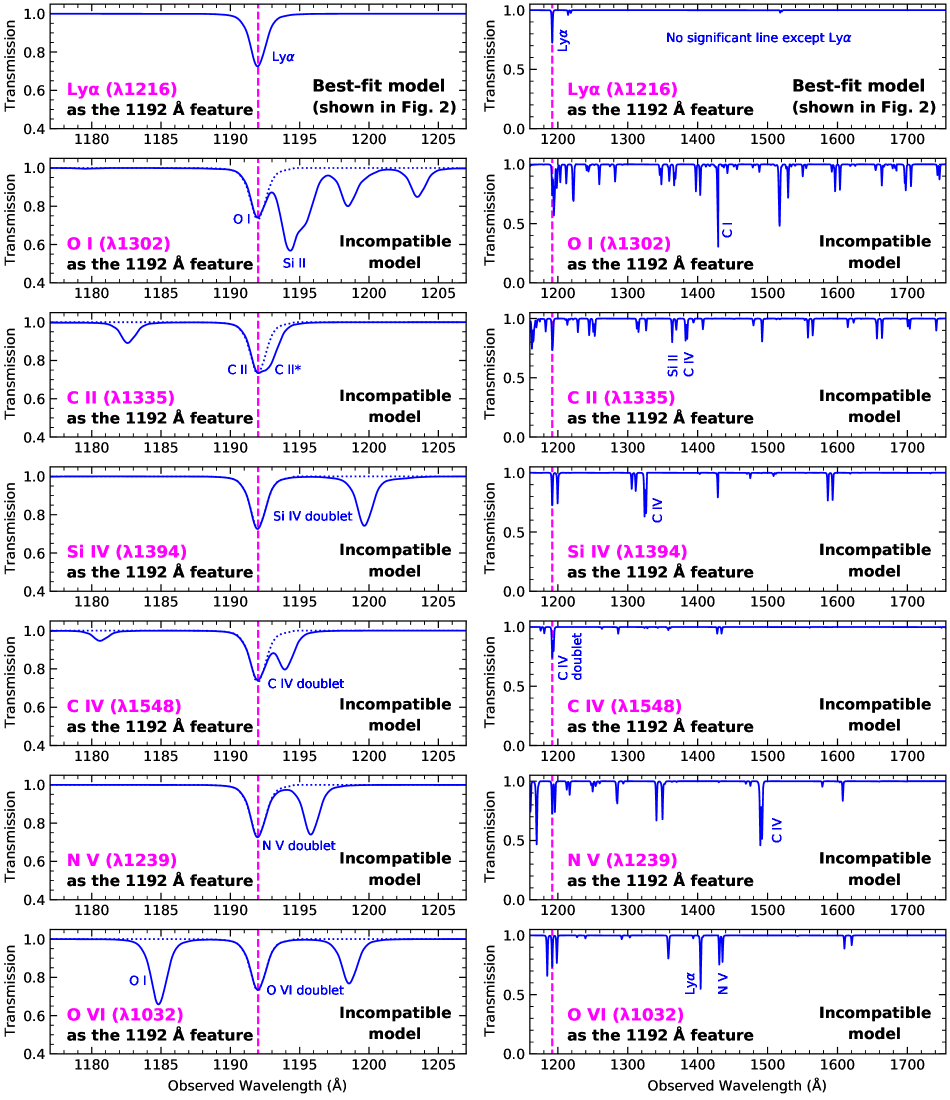
As mentioned earlier in Section 3, the observed 1192 Å feature (Figure 2) can only be modeled as a Ly line. Here, we present spectral calculations using Cloudy that demonstrate this point. We modeled the 1192 Å feature with different ions, from a wide range of ionization levels, that can produce absorption lines in the UV band: O I, C II, Si IV, C IV, N V, and O VI. In each case, the modeling was carried out at the ionization parameter where each ion becomes most abundant, thus maximizing the potential of modeling the 1192 Å feature with that ion. The results of our modeling are shown in Figure 5, where in the left panels close-ups of the 1192 Å region are displayed, and on the right panels the models across the COS energy band are plotted. The top panels of Figure 5 provide our best-fit model (from Figure 2), where the 1192 Å UFO feature is modeled as a Ly line. In this best-fit model the only significant UV line that is produced in the COS band is the Ly line (Figure 5, top panels). However, in the other models, shown in the subsequent panels of Figure 5, other significant absorption lines are also produced (either doublet of the same ion or lines from other ions), which are not seen in the COS spectrum (Figures 1 and 2).
The spectral models shown in Figure 5 are convolved with the LSF of COS/G140L. In the case of ions that produce doublets (Si IV, C IV, N V, and O VI), these lines are resolved and would be detected with COS/G140L. As shown in Figure 5, as a result of modeling the 1192 Å feature with one of the doublet lines, the other line of the doublet is also produced, which is incompatible with the COS spectrum of IRAS 17020+4544 (Figure 2, bottom left panel). Our spectral fitting presented in Figure 2 shows that the 1192 Å feature is a single narrow line, thus modeling it with either Si IV, C IV, N V, or O VI is not feasible. Furthermore, modeling the feature at 1192 Å with other ions, such as O I and C II, results in the production of other associated lines from similarly ionized species, which are not present in the COS spectrum (Figure 1). For example, the O I model also produces C I and Si II lines, and the C II model makes Si II and C IV lines. Similarly, the N V and O VI models are accompanied by C IV and Ly/N V absorption lines, respectively. We note that all the lines in the COS spectrum of IRAS 17020+4544 are identified (see Figure 1), and except the 1192 Å feature, they are all either from the Galactic ISM or the warm absorber of the AGN.
In the case of ions that produce multiple absorption lines at different wavelengths in the UV band (O I and C II), we selected the ones that have the best chance of being compatible with the COS spectrum, so that their associated strong Ly line falls outside the detection range of COS. Still all these non-Ly models for the 1192 Å feature are infeasible as described above. The ions that are selected for modeling the 1192 Å feature in Figure 5 are also representative of other similarly ionized species, and their absorption lines appear together in the UV band. We find that our results hold regardless of which ion/line is considered, and only the Ly model can fit the single narrow line at 1192 Å without becoming incompatible with the COS spectrum.
Furthermore, in the case of some ions (O VI), not only other infeasible associated lines would be produced in the COS spectrum, the required spectral shift to model the 1192 Å line would imply ultra-fast inflowing gas, which is likely not plausible. Also, in some cases such as the C IV model, the required blueshift would imply outflow velocities much greater than the outflow velocities of the X-ray UFOs in IRAS 17020+4544. However, the primary reason the C IV model is rejected is that the only C IV line in the UV band is a doublet (1548 and 1551), which is resolved by COS/G140L, whereas the 1192 Å feature is a single narrow line (Figure 2), making the C IV model incompatible with the COS data.
In summary, since (1) the non-Ly models for the 1192 Å feature are incompatible with the COS spectrum, and (2) the Ly model is the one that is consistent with the low-velocity components of the X-ray UFO in terms of outflow velocity, ionization parameter, and column density, it is hence most reasonable to conclude that the UFO feature at 1192 Å is a Ly absorption line. This is similar to the case of PG 1211+143 (Kriss et al., 2018a), where the UV spectral signature of the X-ray UFO is also only seen as a Ly line.
4 Discussion and conclusions
High-resolution UV spectroscopy complements X-ray observations of AGN, allowing a more detailed and complete picture of the ionization and kinematic structure of the outflows to be established. Our HST/COS spectroscopic study of IRAS 17020+4544 validates the X-ray UFO presence in this AGN. This UV UFO is seen in the far-UV band as a Ly absorption line at 1192.0 Å, with a S/N of , outflowing with a velocity of . The findings of our HST/COS investigation are consistent with those from previous X-ray studies of the UFO in IRAS 17020+4544 (Longinotti et al., 2015; Sanfrutos et al., 2018). Our modeling shows that the blueshifted Ly feature in the COS spectrum corresponds to the low-ionization, low-velocity component of the X-ray UFO. The UV spectral signature of the UFO is seen only through Ly absorption line because other associated absorption lines would be too weak to be significantly detected in the COS spectrum. This is according to the predictions from the photoionization modeling that we have carried out using the Cloudy code.
Our analysis of the COS spectrum of IRAS 17020+4544 shows that the other higher-velocity or higher-ionization components of the X-ray UFO (Table 2) are not significantly detected in the COS spectrum. As the production of UV absorption lines is dependent on the ionization parameter of the gas, towards higher ionizations the column densities of the neutral and ionized UV species are greatly reduced, making their absorption lines too weak for detection. Also, the increased thermal line-broadening at higher ionizations makes the lines appear too shallow and blended with the continuum. In the case of the low-ionization, low-velocity component () that produces the Ly UFO feature, our Cloudy photoionization calculations show that this Ly line would have not been detectable in the COS spectrum if . Furthermore, components of the X-ray UFO may not fully cover the UV source (which is larger in size than the X-ray source), thus further weakening their UV absorption lines.
IRAS 17020+4544 stands out as one of only few AGN showing a truly multi-component UFO in terms of both ionization and velocity. Our finding of the Ly UFO feature makes IRAS 17020+4544 the first energy-conserving-outflow AGN with a UV counterpart. On the other hand, the UV counterpart of the UFO in PDS 456 (Hamann et al., 2018) belongs to a momentum-conserving outflow (Bischetti et al., 2019). The multi-component nature of the UFO in IRAS 17020+4544, and the relatively low , , and of the Ly UFO component, points to a scenario where a ‘primary’ powerful UFO has interacted with the ambient medium, entraining and shocking it, resulting in weaker ‘secondary’ UFO components, such as the component seen in the UV. This may also explain why unlike broad UV absorption lines of powerful AGN winds, the Ly line in IRAS 17020+4544 is narrow. Such entrained-UFO explanations have been proposed in the past for multi-component and low-ionization UFOs (Sanfrutos et al., 2018; Serafinelli et al., 2019; Longinotti, 2020).
The profile of the UFO Ly line in the COS spectrum (Figure 2) is consistent with instrumental broadening and any smaller thermal broadening which is produced by the Cloudy modeling. The narrowness of the UFO Ly line in IRAS 17020+4544 is in contrast to the Ly counterpart of the X-ray UFO in PG 1211+143 (Kriss et al., 2018a), which is a broad feature. This demonstrates that in searches for the UV counterpart of X-ray UFOs both narrow and broad features should be investigated. A recent study of a sample of quasars at high redshifts by Chartas et al. (2021) finds coexistence of intrinsic narrow UV absorption lines in quasars with X-ray UFOs. This is similar to the narrow UV absorption lines often associated with the X-ray warm absorbers (Laha et al., 2014), which also have a considerable fraction of UFOs present. Multiphase outflows are thus seen in both low and high redshift AGN, which typically have different outflows in terms of their power and impact on their host galaxies. The multi-phase outflows, such as the one established in IRAS 17020+4544, provide useful observational clues for linking the outflows at small scales near the black hole to the large scales of the host galaxy in a physically-consistent fashion.
Currently, X-ray spectroscopy of UFOs with CCD instruments leaves large uncertainties in the derived parameters of the photoionized gas. In particular, the ionization parameter and the outflow velocity cannot be constrained accurately as individual lines from different ionic species are blended together in the low-resolution CCD spectra. Also, high-resolution X-ray grating spectroscopy is often unfeasible due to the impractical amount of exposure time that is required. IRAS 17020+4544 is one of the few rare cases, where owing to its multi-component UFO and brightness, its components have been seen in the soft X-rays and the UV band. The upcoming high-resolution microcalorimeter X-ray missions, namely XRISM (Tashiro et al., 2018) and Athena/X-IFU (Barret et al., 2016), will provide a major leap forward in X-ray studies of UFOs and overcome the shortcomings of the current missions. The tantalizing possibility of joint X-ray (XRISM) and UV (HST/COS) spectroscopy in the near future would open a new window in the UFO studies. They will facilitate all ionization and velocity components of the UFO to be mapped, from highly-ionized Fe XXVI to the neutral H I Ly. Such X-ray/UV observations of UFOs, alongside theoretical predictions from hydrodynamical simulations of UFOs and their interaction with their environment, will advance our understanding of the UFO phenomenon in AGN.
References
- Barret et al. (2016) Barret, D., Lam Trong, T., den Herder, J.-W., et al. 2016, in Society of Photo-Optical Instrumentation Engineers (SPIE) Conference Series, Vol. 9905, Space Telescopes and Instrumentation 2016: Ultraviolet to Gamma Ray, ed. J.-W. A. den Herder, T. Takahashi, & M. Bautz, 99052F, doi: 10.1117/12.2232432
- Bischetti et al. (2019) Bischetti, M., Piconcelli, E., Feruglio, C., et al. 2019, A&A, 628, A118, doi: 10.1051/0004-6361/201935524
- Blustin et al. (2005) Blustin, A. J., Page, M. J., Fuerst, S. V., Branduardi-Raymont, G., & Ashton, C. E. 2005, A&A, 431, 111, doi: 10.1051/0004-6361:20041775
- Chartas et al. (2020) Chartas, G., Davidson, E., Brusa, M., et al. 2020, MNRAS, 496, 598, doi: 10.1093/mnras/staa1534
- Chartas et al. (2021) Chartas, G., Cappi, M., Vignali, C., et al. 2021, ApJ, 920, 24, doi: 10.3847/1538-4357/ac0ef2
- Davidson (1977) Davidson, K. 1977, ApJ, 218, 20, doi: 10.1086/155653
- de Grijp et al. (1992) de Grijp, M. H. K., Keel, W. C., Miley, G. K., Goudfrooij, P., & Lub, J. 1992, A&AS, 96, 389
- den Herder et al. (2001) den Herder, J. W., Brinkman, A. C., Kahn, S. M., et al. 2001, A&A, 365, L7, doi: 10.1051/0004-6361:20000058
- Di Matteo et al. (2005) Di Matteo, T., Springel, V., & Hernquist, L. 2005, Nature, 433, 604, doi: 10.1038/nature03335
- Ferland et al. (2017) Ferland, G. J., Chatzikos, M., Guzmán, F., et al. 2017, Rev. Mexicana Astron. Astrofis., 53, 385. https://arxiv.org/abs/1705.10877
- Fox et al. (2018) Fox, A., James, B., Roman-Duval, J., Rafelski, M., & Sonnentrucker, P. 2018, The Spectral Resolution of the COS FUV channel at Lifetime Position 4, Instrument Science Report COS 2018-7
- Gaspari & Sądowski (2017) Gaspari, M., & Sądowski, A. 2017, ApJ, 837, 149, doi: 10.3847/1538-4357/aa61a3
- Giroletti et al. (2017) Giroletti, M., Panessa, F., Longinotti, A. L., et al. 2017, A&A, 600, A87, doi: 10.1051/0004-6361/201630161
- Gofford et al. (2013) Gofford, J., Reeves, J. N., Tombesi, F., et al. 2013, MNRAS, 430, 60, doi: 10.1093/mnras/sts481
- Green et al. (2012) Green, J. C., Froning, C. S., Osterman, S., et al. 2012, ApJ, 744, 60, doi: 10.1088/0004-637X/744/1/60
- Gupta et al. (2015) Gupta, A., Mathur, S., & Krongold, Y. 2015, ApJ, 798, 4, doi: 10.1088/0004-637X/798/1/4
- Gupta et al. (2013) Gupta, A., Mathur, S., Krongold, Y., & Nicastro, F. 2013, ApJ, 772, 66, doi: 10.1088/0004-637X/772/1/66
- Hamann et al. (2018) Hamann, F., Chartas, G., Reeves, J., & Nardini, E. 2018, MNRAS, 476, 943, doi: 10.1093/mnras/sty043
- Hirschauer (2021) Hirschauer, A. S. 2021, COS Instrument Handbook v. 13.0, 13
- Hopkins & Elvis (2010) Hopkins, P. F., & Elvis, M. 2010, MNRAS, 401, 7, doi: 10.1111/j.1365-2966.2009.15643.x
- Kalberla et al. (2005) Kalberla, P. M. W., Burton, W. B., Hartmann, D., et al. 2005, A&A, 440, 775, doi: 10.1051/0004-6361:20041864
- King & Pounds (2015) King, A., & Pounds, K. 2015, ARA&A, 53, 115, doi: 10.1146/annurev-astro-082214-122316
- Kormendy & Ho (2013) Kormendy, J., & Ho, L. C. 2013, ARA&A, 51, 511, doi: 10.1146/annurev-astro-082708-101811
- Kriss et al. (2018b) Kriss, G. A., Lee, J. C., & Danehkar, A. 2018b, ApJ, 859, 94, doi: 10.3847/1538-4357/aabf38
- Kriss et al. (2018a) Kriss, G. A., Lee, J. C., Danehkar, A., et al. 2018a, ApJ, 853, 166, doi: 10.3847/1538-4357/aaa42b
- Krolik et al. (1981) Krolik, J. H., McKee, C. F., & Tarter, C. B. 1981, ApJ, 249, 422, doi: 10.1086/159303
- Krongold et al. (2021) Krongold, Y., Longinotti, A. L., Santos-Lleó, M., et al. 2021, ApJ, 917, 39, doi: 10.3847/1538-4357/ac0977
- Laha et al. (2014) Laha, S., Guainazzi, M., Dewangan, G. C., Chakravorty, S., & Kembhavi, A. K. 2014, MNRAS, 441, 2613, doi: 10.1093/mnras/stu669
- Lodders et al. (2009) Lodders, K., Palme, H., & Gail, H. P. 2009, Landolt Börnstein, 4B, 712, doi: 10.1007/978-3-540-88055-4_34
- Longinotti (2020) Longinotti, A. L. 2020, in Perseus in Sicily: From Black Hole to Cluster Outskirts, ed. K. Asada, E. de Gouveia Dal Pino, M. Giroletti, H. Nagai, & R. Nemmen, Vol. 342, 90–96, doi: 10.1017/S1743921318007779
- Longinotti et al. (2015) Longinotti, A. L., Krongold, Y., Guainazzi, M., et al. 2015, ApJ, 813, L39, doi: 10.1088/2041-8205/813/2/L39
- Longinotti et al. (2018) Longinotti, A. L., Vega, O., Krongold, Y., et al. 2018, ApJ, 867, L11, doi: 10.3847/2041-8213/aae5fd
- Mehdipour et al. (2015) Mehdipour, M., Kaastra, J. S., Kriss, G. A., et al. 2015, A&A, 575, A22, doi: 10.1051/0004-6361/201425373
- Pounds et al. (2003a) Pounds, K. A., Reeves, J. N., King, A. R., et al. 2003a, MNRAS, 345, 705, doi: 10.1046/j.1365-8711.2003.07006.x
- Reeves et al. (2018a) Reeves, J. N., Braito, V., Nardini, E., et al. 2018a, ApJ, 854, L8, doi: 10.3847/2041-8213/aaaae1
- Reeves et al. (2018b) Reeves, J. N., Lobban, A., & Pounds, K. A. 2018b, ApJ, 854, 28, doi: 10.3847/1538-4357/aaa776
- Salomé et al. (2021) Salomé, Q., Longinotti, A. L., Krongold, Y., et al. 2021, MNRAS, 501, 219, doi: 10.1093/mnras/staa3626
- Sanfrutos et al. (2018) Sanfrutos, M., Longinotti, A. L., Krongold, Y., Guainazzi, M., & Panessa, F. 2018, ApJ, 868, 111, doi: 10.3847/1538-4357/aae923
- Serafinelli et al. (2019) Serafinelli, R., Tombesi, F., Vagnetti, F., et al. 2019, A&A, 627, A121, doi: 10.1051/0004-6361/201935275
- Silk & Rees (1998) Silk, J., & Rees, M. J. 1998, A&A, 331, L1
- Tashiro et al. (2018) Tashiro, M., Maejima, H., Toda, K., et al. 2018, in Society of Photo-Optical Instrumentation Engineers (SPIE) Conference Series, Vol. 10699, Space Telescopes and Instrumentation 2018: Ultraviolet to Gamma Ray, ed. J.-W. A. den Herder, S. Nikzad, & K. Nakazawa, 1069922, doi: 10.1117/12.2309455
- Tombesi et al. (2010) Tombesi, F., Cappi, M., Reeves, J. N., et al. 2010, A&A, 521, A57, doi: 10.1051/0004-6361/200913440
- Tombesi et al. (2015) Tombesi, F., Meléndez, M., Veilleux, S., et al. 2015, Nature, 519, 436, doi: 10.1038/nature14261