X-ray variability of transitional millisecond pulsars: a faint, stable and fluctuating disk
Abstract
Transitional millisecond pulsars (tMSPs) have emerged in the last decade as a unique class of neutron stars at the crossroads between accretion- and rotation-powered phenomena. In their (sub-luminous) accretion disk state, with X-ray luminosities of order erg s-1, they switch rapidly between two distinct X-ray modes: the disk-high (DH) and disk-low (DL) states. We present a systematic XMM-Newton and Chandra analysis of the aperiodic X-ray variability of all three currently known tMSPs, with a main focus on their disk state and separating DH and DL modes. We report the discovery of flat-topped broadband noise in the DH state of two of them, with break frequencies of 2.8 mHz (PSR J1023+0038) and 0.86 mHz (M28-I). We argue that the lowest frequency variability is similar to that seen in disk-accreting X-ray binaries in the hard state, at typical luminosities at least 2 orders of magnitude higher than tMSPs. We find strong variability in the DH state around 1 Hz, not typical of hard state X-ray binaries, with fractional rms amplitudes close to 30%. We discuss our results and use them to constrain the properties of the accretion disk, assuming that the X-ray variability is produced by fluctuations in mass accretion rate, and that the break frequency corresponds to the viscous timescale at the inner edge of the disk. In this context, we find that the newly found break frequencies are broadly consistent with a disk truncated close to the light cylinder with g s-1 and a viscosity parameter 0.2.
keywords:
X-rays: individual(IGR J18245-2452, 2XMM J102347.6+003841, XSS J12270-4859) — stars: neutron — X-rays: binaries — globular clusters: individual(M28) — pulsars: individual(PSR J1824–2452I, PSR J1023+0038, PSR J1227-4853 — accretion, accretion discs)1 Introduction
Millisecond radio pulsars (MSPs) have X-ray luminosities LX (0.5–10 keV) of order 1029–1033 erg s-1, powered by the loss of rotational energy of a rapidly spinning low magnetic field neutron star (Possenti et al. 2002). Low-mass X-ray binaries (LMXBs), when active or in outburst, show typically L1035–1038 erg s-1 thanks to the gravitational potential energy released during the accretion process. These two types of neutron star binaries represent two phases of an evolutionary sequence, where LMXBs are thought to precede and produce MSPs (Alpar et al. 1982).
The link between MSPs and LMXBs has been confirmed in the last decade with the discovery of three neutron stars that alternate between rotation-powered (MSP) and accretion-disk (LMXB) states, on timescales of days to months (Archibald et al. 2009; Papitto et al. 2013; Bassa et al. 2014). All three systems, known as “transitional millisecond pulsars” (tMSPs), have low-mass main-sequence companion stars in compact orbits (period Porb4–11 hr). Thus they belong to the growing class of compact binary or “spider” MSPs, in particular to the “redback” type (Roberts 2013).
Linares (2014) studied the global behavior of redbacks and identified three main X-ray states: i) (radio) pulsar state (10L1032 erg s-1); ii) disk state (41032LX1034 erg s-1) ; and iii) outburst state (1034LX1037 erg s-1)111Hereafter, all LX are corrected for absorption and quoted in the 0.5–10 keV band.. The outburst state, which shows thermonuclear X-ray bursts and peculiar X-ray variability, has been seen only in PSR J1824–2452I/IGR J18245–2452 (M28-I hereafter, in the globular cluster M28; see Papitto et al. 2013; Ferrigno et al. 2014; Wijnands et al. 2017). The pulsar state (PS) of most redbacks shows a characteristic double-peaked orbital modulation of the X-ray flux (Bogdanov et al. 2011), and no optical evidence for the presence of an accretion disk.
The disk state, at the intersection between accretion and rotation power, is of particular interest as it allows unprecedented studies of underluminous accretion flows, pulsar winds and their mutual interaction. Linares et al. (2014) discovered striking rapid X-ray variability in the disk state of the transitional millisecond pulsar M28-I. While in the disk state, M28-I switches rapidly between two clearly distinct modes/states: the disk-high mode (DH; also known as disk-active) with LX=3.91033 erg s-1 and the disk-low mode (DL; also known as disk-passive) with LX=5.61032 erg s-1. Linares (2014) pointed out that this phenomenon, labeled X-ray mode switching, is ubiquitous in the disk state of all three tMSPs (see also de Martino et al. 2013; Tendulkar et al. 2014), yet it is not observed in LMXBs at similar LX. In fact, X-ray mode switching has been used since to identify new candidate tMSPs (e.g., Bogdanov & Halpern 2015).
| System | Epoch | Mission | Exp. | Long gtis | FFTs | – | Total/BKG | ||
| (tMSP) | (yr) | (instr.) | (ms) | (ks) | (ks) | (nr.,s) | (Hz) | rate(c/s) | |
| M28-I | 2008 | Chandra (ACIS-S) | 2222Obs. IDs: 9132,9133 | 3141 | 199 | DH: 101 | 319299 | 5.210-5–0.053 | 0.08/1.810-4 |
|---|---|---|---|---|---|---|---|---|---|
| DL: 67 | 96433 | 1.610-4–0.16 | 0.014/1.810-4 | ||||||
| 2015 | 2333Obs. IDs: 16749,16750 | 3241 | 60 | PS: 60 | 69956 | 1.010-4–0.051 | 1.710-3/1.810-4 | ||
| PSR J1023+0038 | 2013- | XMM | 18444Obs. IDs: 0720030101, 0742610101, 0748390-101/501/601/701, 0770581-001/101, 0783330301, 0784700201, 0794580-801/901, 0803620-201/301/401/501, 0823750-301/401 | 0.122 | 828 | DH: 123 | 44096 | 2.410-4–128 | 3.17/0.22 |
| -2018 | (EPIC-pn) | DL: 28 | 15768 | 1.310-3–683 | 0.44/0.07 | ||||
| 2010 | Chandra | 1555Obs. ID: 11075 | 1141 | 83 | PS: 83 | 418695 | 5.310-5–0.22 | 0.038/1.910-4 | |
| XSS J12270-4859 | 2011 | XMM | 1666Obs. ID: 0656780901 | 0.122 | 30 | DH: 7.2 | 22048 | 4.910-4–256 | 2.98/0.12 |
| DL: 2.4 | 4512 | 2.010-3–1024 | 0.46/0.07 | ||||||
| 2014 | Chandra | 1777Obs. ID: 16561 | 3141 | 30 | PS: 30 | 39649 | 1.010-4–0.053 | 0.032/1.310-4 |
In this work we take a closer look at the aperiodic X-ray variability of tMSPs in the disk and pulsar states, using Chandra and XMM-Newton observations of all three confirmed tMSPs: M28-I, PSR J1023+0038 (J1023 hereafter) and XSS J12270-4859 (J1227 hereafter). We find strong X-ray variability in the disk state (DH mode), in the form of flat-top noise and a characteristic break frequency, all typical of LMXBs in the hard state. This gives X-ray evidence for the presence of an accretion disk in the disk state of tMSPs, and the lowest break frequencies ever detected in a LMXB. We also discuss the implications of these new results on the models proposed for the disk state of tMSPs.
2 Analysis
We analyzed all XMM-Newton and Chandra observations of the three confirmed tMSPs, available in mid 2021 and taken when they were in the disk state. For each observation we selected manually the “long good time intervals” when the tMSPs were in the disk-active/high (DH) and disk-passive/low (DL) states, using 10 and 100 s-resolution light curves for XMM-Newton and Chandra, respectively. We excluded intrinsic flaring states, a few background flaring periods in the case of XMM-Newton, and those intervals shorter than about 1 and 0.3 ks for the DH and DL states, respectively (since we are interested on long timescale variability). This careful selection is necessary to study and quantify the X-ray variability in the DH and DL states and results in just 5–50% of the data being used, depending on the source and state.
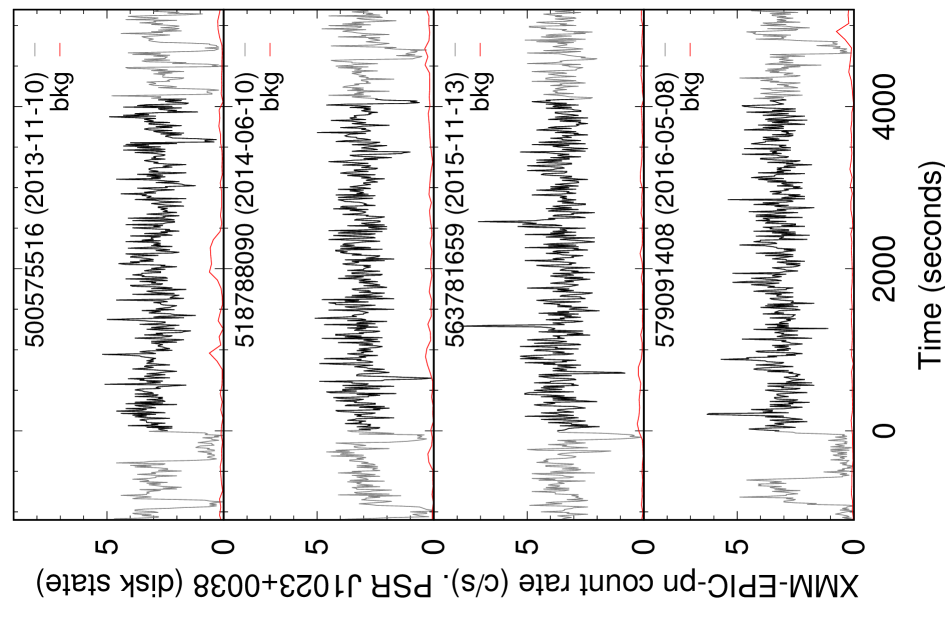
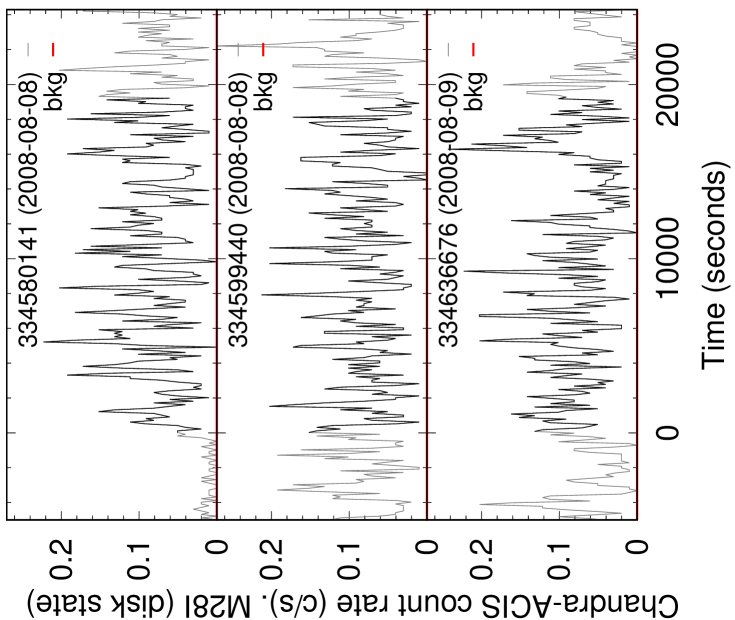
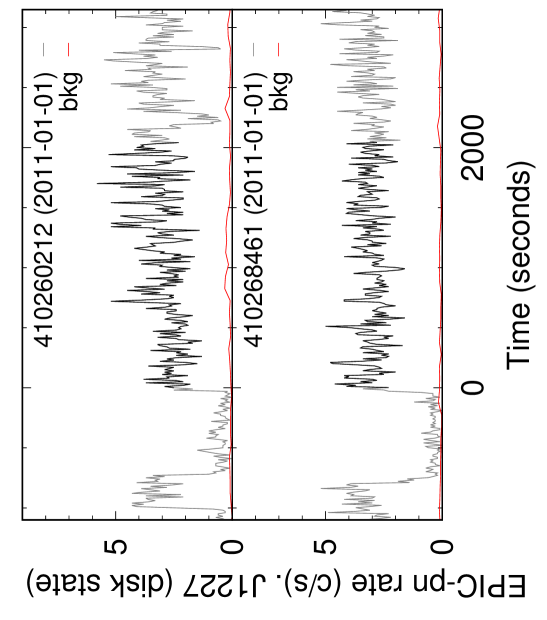
We also included selected Chandra observations of all three systems in the pulsar state, in order to compare the X-ray variability of these different states quantitatively. Table 1 shows the details of all analyzed observations, and the resulting effective exposure times after summing all the long good time intervals in the DH & DL modes (“long gtis”). We show in Figure 1 light curves of the three tMSPs in the disk state, as well as the exact time segments used to extract all DH mode power spectra.
2.1 XMM-Newton
We analyzed all EPIC-pn timing data of the disk state of the two tMSPs J1023 and J1227, for a total exposure time of 828 ks and 30 ks, respectively. All XMM-Newton-EPIC-pn observations were reprocessed with EPPROC (SAS version 20180620-1732-17.0.0) to generate calibrated event lists. Since the analysed XMM-Newton observations were taken in timing mode (with a time resolution of 122 s), the two-dimensional imaging information is lost. Filtered source event files were extracted with XMMSELECT/EVSELECT, keeping events with energies in the 0.5–10 keV range (and pattern 0–4), within a 7-pixel-wide box centered on the source (RAWX 38). These events were used to generate power spectra as explained below, including only time intervals when the sources were in the DH and DL state. For J1023 and J1227 this led to average total EPIC-pn count rates of about 3 and 0.5 c/s for the DH and DL states, respectively (Table 1).
The background in XMM-Newton has multiple components, is energy dependent and strongly variable (even outside proton flares). We first monitored the proton flare background by extracting light curves between 10–15 keV, in the same source extraction region, and verified that no flares affect our DH/DL time intervals. We also excluded the lowest (0.2–0.5 keV) energies and restricted our analysis to the 0.5–10 keV band (Burwitz et al. 2004), which reduces the background rate by a factor 10. To measure the background rate we extracted events in the same energy range from one identical region far from the source extraction region (centered on RAWX=10), where the count profile is approximately flat and we expect a negligible source contribution. This is not the case in brighter sources (see, e.g., Appendix B in Wijnands et al. 2017), but our tMSPs are faint so that the tail of the PSF is fainter than the true background. We also checked another region on the opposite side of the detector (at RAWX=55), and obtained consistent background rates. This gives our final measurement of the average background rate in the same energy band (0.5–10 keV), the same region (7100 pixel box) and the exact same time intervals used for the FFTs. These background rates used for the power spectral rms normalization are about 5% and 15% of the total rates for the DH and DL states, respectively, as shown more precisely in Table 1.
2.2 Chandra
We analyzed both Chandra-ACIS-S observations of M28 taken in 2008, using CIAO (version 4.13). These provide the only ACIS imaging data of the tMSP M28-I in the disk state, for a total exposure time of 199 ks. We extracted filtered source event files with DMCOPY, keeping events with energies in the 0.2–10 keV range, within a 3-pixel-radius circle centered on M28-I (source 23 in Becker et al. 2003). These events were used to generate power spectra as explained below, including only time intervals when the source was in the DH and DL state. The resulting average total ACIS count rate was about 0.08 and 0.014 c/s for the DH and DL states, respectively (Table 1).
We also extracted power spectra of the pulsar state of J1023 and J1227 using Chandra-ACIS-S observations taken in 2010 and 2014, respectively (Table 1). In this case we did not select specific time intervals, since the orbital X-ray variability in the pulsar state is relatively smooth and happens on timescales of several hours, longer than those we are studying. Since the background in Chandra is low and stable, and the observations were taken in an imaging (TIMED/VFAINT) mode, we use a nearby source-free region with the same radius to measure the average background rate in each observation. These background count rates used for the power spectral rms normalization are about 0.2 and 1% of the total rates for the DH and DL states, respectively, as shown in Table 1.
2.3 Timing analysis
We binned the original event files (with time resolution ) by a factor to reach a Nyquist frequency =1/(2). We applied fast Fourier transforms (FFTs) on light curve segments with duration , obtaining power density spectra (PDS) of the DH and DL states separately (with a minimum Fourier frequency =1/; see Table 1). The resulting PDS were averaged and rebinned logarithmically. We explored the range =[0.3–20] ks, and chose the optimum value in each case to reach the lowest possible Fourier frequencies.
A constant Poisson noise contribution was subtracted (matching the level above 0.75; see, e.g., Klein-Wolt 2004), and the PDS were normalized in the rms-normalization using the average background rates (van der Klis 1995, see Section 2.1). In this normalization, the integrated power, , gives the fractional variance, where is the average power between two frequencies and such that . We use this property to measure the fractional root-mean-squared amplitude of the variability () from the Poisson-subtracted, rms-normalized PDS in two frequency bands: 0.001–0.1 Hz (low frequency, LF) and 0.1–10 Hz (high-frequency, HF). When calculating the uncertainties on the we take into account a 20% systematic error from the XMM-Newton background rates used in the PDS normalization (but in most cases the statistical error from the dispersion of PDS powers dominates). When the measured was consistent with zero in a given frequency band, we placed 90% upper limits on the assuming a normal distribution of powers, i.e., using 1.3 times the standard deviation of powers in that band.
We fit the PDS of J1023 and M28-I in the DH state with a broken power-law model with the slope/index before the break fixed at zero, to account for the flat-topped noise that we find and report below (we chose this simple model to allow for direct comparison with the early work of Belloni & Hasinger 1990). When necessary, we add one Lorentzian to account for additional power at higher frequencies, as is customary in more recent studies of accreting X-ray binaries (e.g., Wijnands & van der Klis 1999).


In order to verify that background variability does not affect our results for the faintest tMSP states, we extracted PDS using events in the XMM-Newton background region. We find that the EPIC-pn (timing mode) background is strongly variable at frequencies in the 0.1-100 Hz range (1000% fractional rms), but it is not strongly variable at lower frequencies in our chosen time intervals (fractional rms less than 51% in the 0.0039–0.1 Hz frequency band). Since we select periods of low background rates for our XMM-Newton analysis (and in general the background is only between 0.2% and 15% of the total count rate, see Table 1), we can be confident that the X-ray variability that we detect is intrinsic to the tMSPs studied.
3 Results
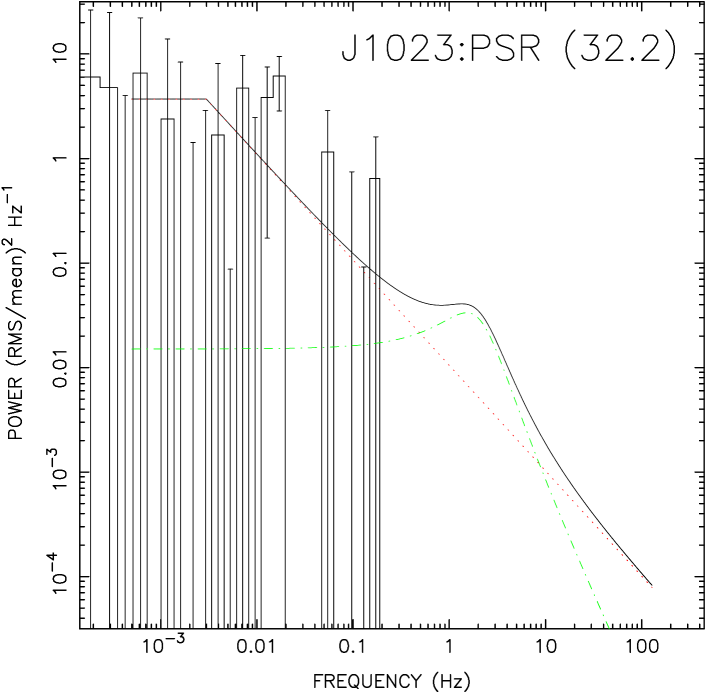
The disk state of tMSPs is strongly variable both within the DH and DL modes, as can be already seen from the X-ray lightcurves shown in Figure 1. Beyond the X-ray mode switching discovered in 2013 (Linares et al. 2014), we find intrinsic variability in the X-ray flux from tMSPs on a broad range of frequencies, between 10-4 and 10 Hz (Figure 2). This corresponds to a wide range of timescales, between the orbital (4.8–11 hr, i.e., 10-5 Hz) and NS spin (1.7–3.9 ms, i.e., 102 Hz) periods.
| System | State | rmsLF (%) | rmsHF (%) | |
| (tMSP) | /mode | (mHz) | 0.001-0.1 Hz | 0.1-10 Hz |
| M28-I | DH | 0.860.15 | 423 | - |
| DL | - | 45 | - | |
| PS | - | 167 | - | |
| J1023 | DH | 2.80.7888A double zero-centered Lorentzian model fit yields a higher characteristic frequency, =123 mHz. | 18.41.0 | 32.12.9 |
| DL | 8.5 | 35.15.2 | 49 | |
| PS | - | 27 | - | |
| J1227 | DH | 23 | 17.41.7 | 27.06.7 |
| DL | 37 | 608 | 70 | |
| PS | - | 44 | - |
3.1 Disk-high mode
We find that the disk-high state (DH mode) of J1023 shows flat-topped broad-band noise with a break frequency =2.80.7 mHz (see Figure 2 and Table 2). The variability is strong, with a fractional rms amplitude =37.02.6 % in the 0.001–10 Hz frequency band (Section 2.3 for details). We obtain a good fit to the DH power spectrum (/d.o.f.=35.0/36) with the simple broken power-law plus Lorentzian model shown in Figure 2 (top left). For this Lorentzian component, we find a centroid frequency =1.50.5 Hz, a full-width at half-maximum of 2.41.1 Hz and . This component thus peaks around 1 Hz, with a quality factor . The variability at lower frequencies (0.001–0.1 Hz) is less strong, with =18.41.0 % (Table 2). The power-law index above is consistent with 1 (0.920.07). Interestingly, upon inspection of the individual PDS from the DH state of J1023, we also find that both and the integrated power are approximately constant between 2013 and 2016.
Furthermore, we find that the tMSP M28-I in the disk state (DH mode; Fig. 2, top center) shows very similar and even stronger flat-topped noise, with a lower break frequency =0.860.15 mHz and =423 % (Table 2). The power-law index above the break is slightly higher too (1.60.2). In this case we cannot study variability at higher frequencies (0.1 Hz) since we are limited by the time resolution (Table 1).
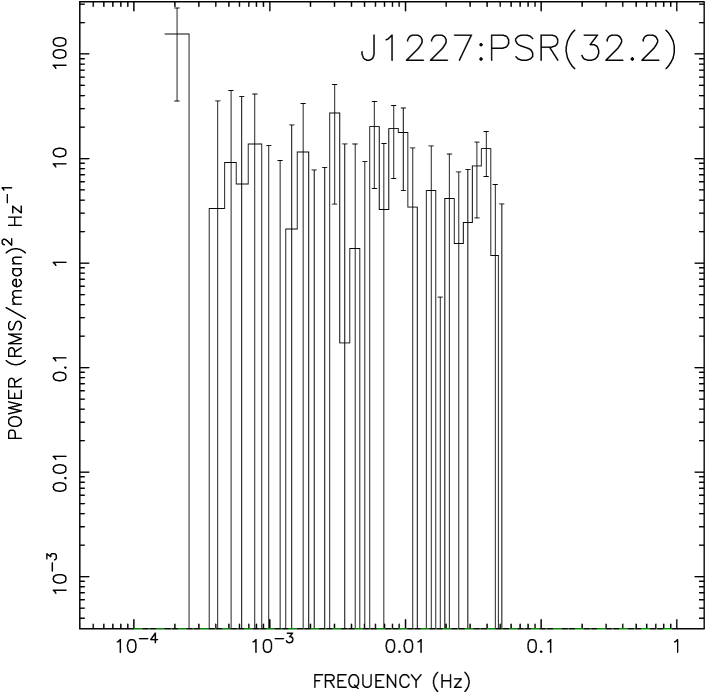
For the tMSP J1227 the X-ray variability is less constrained, as there is only one 30-ks XMM-Newton observation of the disk state in timing mode (much less than the 828 ks available for J1023). Still, we find strong variability between 10-3 and 1 Hz (Figure 2, top right). The fractional rms amplitude in the 0.001–10 Hz frequency band is =326 %. Like in the DH mode of J1023, this variability is stronger at higher frequencies (cf. =27.06.7 % and =17.41.7 %; Table 2). Even though the DH mode power spectrum starts at =2.010-3 Hz, we can use it to constrain the break frequency and we estimate a 90% upper limit of 23 mHz (a broken power-law fit yields break frequencies consistent with 0 at the 2.4 level). Thus, in this case we cannot measure but the upper limits are consistent with the values we find for the two other tMSPs.
3.2 Disk-low mode
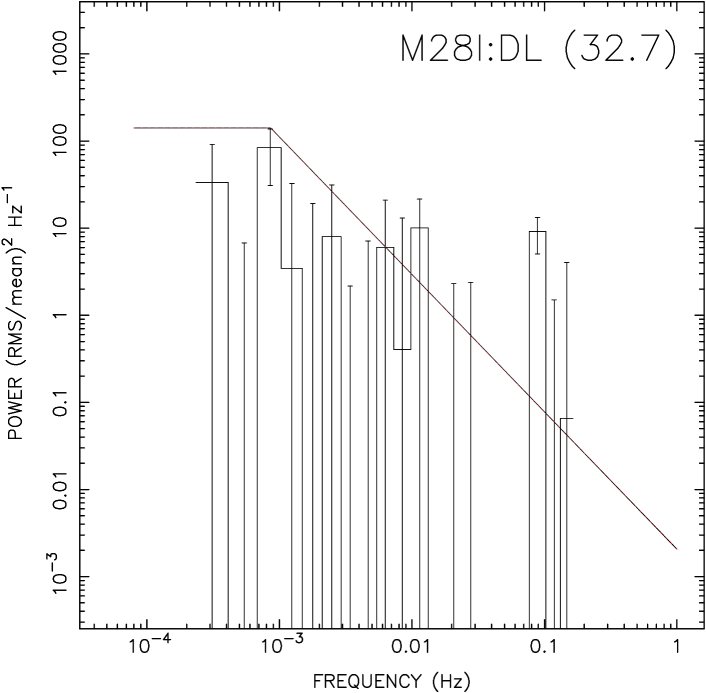
The disk-low (DL, or “passive”) state of tMSPs shows different X-ray variability, as can be seen from Figure 2 (middle panels). We do not detect a low-frequency break to a flat-topped noise, down to the lowest available frequencies (between 0.2 and 2 mHz; Table 1). We set upper limits on of 8.5 mHz and 37 mHz for the DL mode of J1023 and J1227, respectively (broken power law fits give a consistent with 0 within 1–2.5 sigma, which we use to estimate 90% upper limits). These are consistent with the break frequencies that we find in the DH mode, so we cannot assess with the current data if the flat-topped noise persists in the DL mode.


Interestingly, we find that the low-frequency variability is stronger in the DL mode, going from rmsLF=18% to rmsLF=35% in the case of J1023. The same is true for J1227, within the available constraints (Table 2). On the other hand, the strong rapid variability around 1 Hz in the DH mode is not detected in the DL mode (as can be seen from the power spectra in Figure 2). However, the upper limits on the amplitude of the DL mode high-frequency variability (rms49 % in J1023) are consistent with the values of the DH mode. The constraints on the X-ray variability of the DL mode of M28-I are weaker, since the source is further away and fainter than the two other tMSPs. To summarize, low-frequency variability is stronger when going from the more luminous DH mode to the less luminous DL mode.
3.3 Pulsar state
For completeness, we also quantify the aperiodic X-ray variability of the pulsar state (PS), using the observations and PDS listed in Table 1. With an LX more than ten times lower, and exposure times typically shorter than those accumulated in the DH state, the constraints are weaker. We do not detect intrinsic source variability in the PS state on timescales between 10–1000 s (the power in the 10-3-10-1 Hz band is consistent with that expected from Poissonian counting noise). We set upper limits of 27%, 44% and 167% for J1023, J1227 and M28-I, respectively. Thus for both J1023 and J1227, we find that the fractional rms amplitude in the pulsar state is significantly lower than that in the disk state.
4 Discussion
We have presented the discovery of intrinsic broad-band X-ray variability in the DH state-mode of the tMSPs J1023 and M28-I, in the form of flat-topped noise which breaks (to an approximately 1/ form) above 2.8 and 0.86 mHz, respectively (Section 3.1). This provides a new observed signature of the presence of an accretion disk in the X-ray emission of the disk state of tMSPs, since flat-topped noise is regularly seen in disk-accreting LMXBs in their hard states (e.g., van der Klis 2006; Linares 2009). Our results also open a new way to potentially identify tMSP candidates in the disk state, based on their aperiodic X-ray variability. This is especially important in Globular clusters, where identifying the presence of an accretion disk via optical spectroscopy is challenging (but see Cohn et al. 2013). Previous X-ray timing studies of tMSPs did not detect this flat-topped noise, perhaps due to the careful time interval selection required, or because those have focused on lower (orbital) or higher (spin) variability frequencies (e.g., Tendulkar et al. 2014; Coti Zelati et al. 2019).
The X-ray luminosity of J1023 and M28-I in the DH state-mode is LX=2.9 and 3.91033 erg s-1, respectively (Linares 2014). This corresponds to 1–210-5 LEdd,NS (where LEdd,NS=2.31038 erg s-1 is the Eddington luminosity of a 1.8 M⊙ NS), i.e., a highly sub-Eddington low-level accretion regime. As noted previously, the LX of the disk state of tMSPs is remarkably constant on timescales of years (mode switching aside), while we have found to be also constant in J1023 within the errors (Section 3.1). This shows that the disk fluctuates on short (sub-second to hours) timescales but is remarkably stable on long (year) timescales.
We can also compare the disk state LX with the spin-down luminosity which powers pulsar winds, L 4.3 and 9.01034 erg s-1 for J1023 and J1227, respectively (Deller et al. 2012; Roy et al. 2015). We see that in the DH state LX is 5–7% of LSD (this fraction increases during flares, or if we take into account bolometric corrections). The DL state of J1023 and J1227 has LX=5.7 and 9.11032 erg s-1, respectively, which is 1% of LSD. If we assume that accretion takes place down to the light cylinder radius R (81 and 188 km for J1023/J1227 and M28-I, respectively), the accretion luminosity released L becomes similar to the observed L erg s-1 for g s-1. Both energy sources are plausible, and as pointed out by previous work the disk state of tMSPs is powered most likely by a mix of NS rotation and accretion power (e.g., Linares 2014; Campana et al. 2016). This allows us to study the interaction between NS magnetospheres, pulsar winds and underluminous accretion flows, as we discuss in more detail below.
4.1 Low-level accretion: comparison with LMXBs
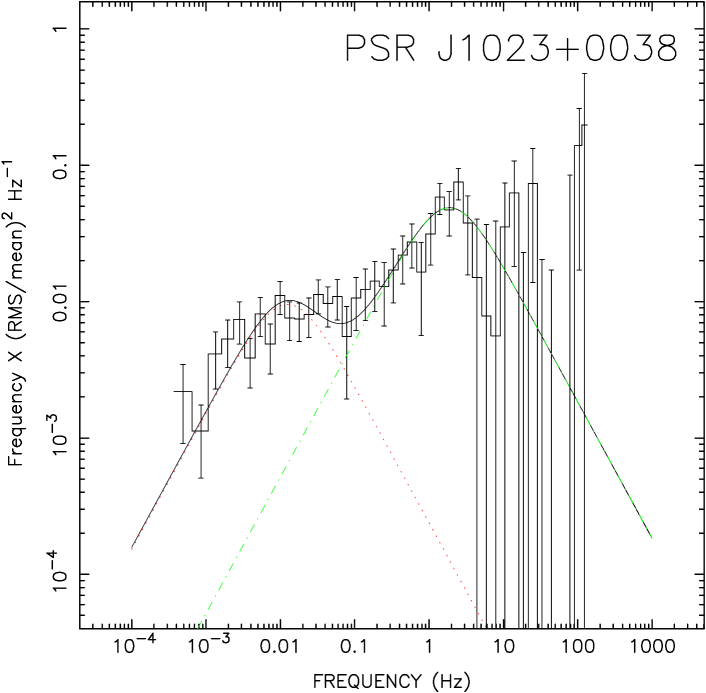
Our results reveal, to our knowledge, the lowest characteristic (break) frequencies ever detected in the X-ray variability of LMXBs. Tomsick, Kalemci & Kaaret (2004) found 3.5 mHz in a black hole (BH) LMXB accreting at LX=3.31034 erg s-1=2.510-5 LEdd,BH, where we take LEdd,BH=1.31039 erg s-1 as the Eddington luminosity of a 10 M⊙ BH (we have converted their X-ray flux to the 0.5-10 keV band and used an updated distance of 4.5 kpc, from Corral-Santana et al. 2016). In a study of very hard NS-LMXBs, Wijnands et al. (2017) found PDS breaks down to 10-2 Hz. We show in Figure 3 the power spectrum of J1023 in the DH state-mode (now in powerfrequency form), compared to those of the accreting millisecond X-ray pulsars IGR J00291+5934 and Aquila X-1. The lower frequencies in J1023 are readily apparent: is 1–3 orders of magnitude lower than what is seen in most NS LMXBs in the hard state (Linares 2009). It is also interesting to note that J1023 and J1227 in the DH state show strong variability around 1 Hz ( about 30%, Table 2), stronger than what we find at lower frequencies ( about 18%). This is different than LMXBs, where the fractional variability in those frequency ranges is similar, and could perhaps reflect additional variability imprinted on the inner accretion disk by the interaction with the pulsar wind.
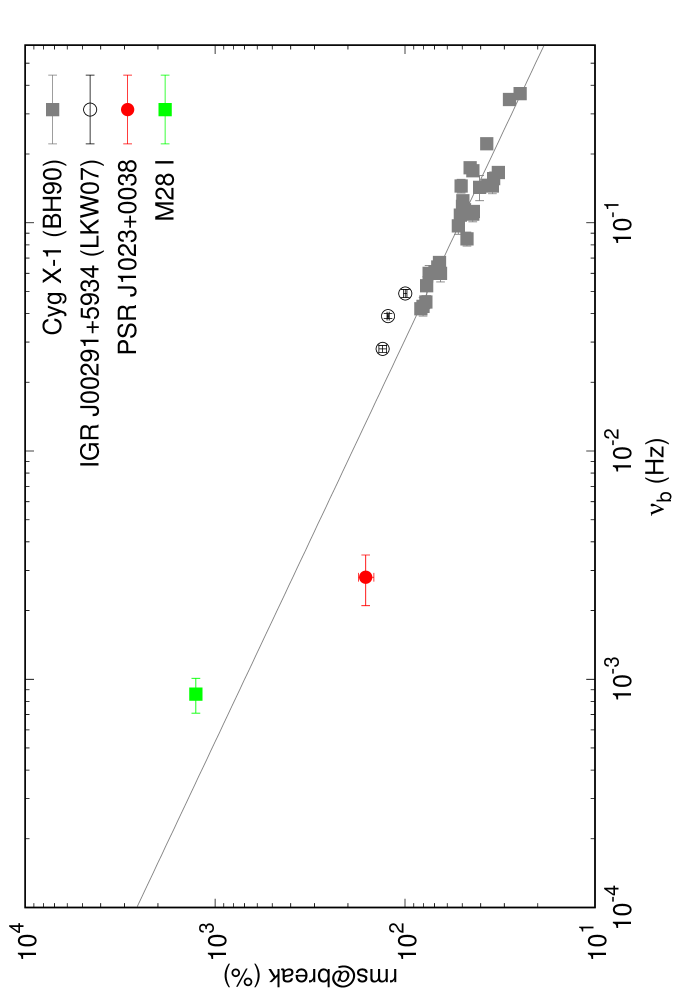
It is widely accepted that the X-ray variability in LMXBs is generated in the accretion flow, so that most variability frequencies reflect dynamical and/or viscous timescales in the disk. An interesting property of the flat-topped noise in the hard state of disk-accreting X-ray binaries was found by Belloni & Hasinger (1990) from EXOSAT studies of the black hole system Cygnus X-1: the power level of the flat-top and the break frequency are anti-correlated. We measure this power level in the DH state of J1023 and M28-I, by averaging the PDS bins below in each case, and convert it to fractional rms in order to compare with previous results. As show in Figure 4, the tMSPs J1023 and M28-I are broadly consistent with the anti-correlation established for X-ray binaries at higher luminosities, and extend it by 2 orders of magnitude in , down to the mHz range. This strongly suggests that the flat-topped noise in tMSPs is produced by the same physical mechanism that produces this component in X-ray binaries.
The flat-topped noise in the hard state of LMXBs is thought to be caused by fluctuations in the mass accretion rate at a range of radii in the accretion disk/flow, which propagate inwards and are superposed in the innermost regions giving rise to variability in LX at a range of frequencies (Lyubarskii 1997; Psaltis & Norman 2000; Done, Gierliński & Kubota 2007). In most models the break frequency is given by the viscous timescale of the inner edge of the disk, at a radial distance Rin from the center of the accreting NS or BH. The power-spectral model propfluc (Ingram & Done 2012; Ingram & van der Klis 2013) implements this by assuming that accretion rate fluctuations propagate through an inner (precessing) hot flow, located within the truncated disk inside Rin, where the surface density radial profile is given by a smoothly broken power law. We attempted to match the PDS from J1023 in the DH state by varying the most important parameters of propfluc: the outer radius of the hot flow Ro (which in this model is the inner truncation radius of the disk), and the normalization of the surface density profile in the flow (). We set the compact object mass to 1.8 M⊙, the bending wave radius to 4.6 Rg (where =2.7 km is the gravitational radius) and all QPO normalizations to 0, while fixing the fractional variability per decade in radius at Fvar=0.2. The remaining parameters are fixed at their default values and have little or no impact on (=3, =0.9, =0; see Ingram & Done 2012, for details). Figure 5 shows that propfluc can roughly reproduce the shape, power and order of magnitude of in the PDS of J1023 in the DH state, for large values of R1000 Rg=2.7108 cm. This apparently large truncation radius cannot be easily interpreted, since propfluc models the hot inner flow of BH X-ray binaries and it uses viscous frequencies which are higher than those of a standard accretion disk (by 2-4 orders of magnitude in the innermost regions; see Fig. 6).

4.2 Mode switching in tMSPs: where is the disk truncated?
One of the most interesting questions brought by the discovery of tMSPs is how and where the disk is truncated in their (intermediate/sub-luminous) disk state. Linares et al. (2014) proposed in their “tug-of-war” model that the disk is truncated just outside the light cylinder in the DL state, and fluctuations in move it inside Rlc in the transition to the DH state/mode. They noted that in this case the rotation-powered pulsar would be active at least in the DL mode. This scenario seemed to be supported by Campana et al. (2016), who found X-ray spectral evidence for an accretion disk truncated at R km in the DH state, while constraining R km in the DL state. Some of the early models for X-ray mode switching and the disk state of tMSPs invoke a disk with a high g s-1 truncated close to the co-rotation radius (Rco=26 km for J1023/J1227, where equals the Keplerian frequency ; Papitto, Torres & Li 2014).
However, the discovery of X-ray (Archibald et al. 2015; Papitto et al. 2015) and optical (Ambrosino et al. 2017) pulsations in the DH state changed this picture. Papitto et al. (2019) argued that the optical pulsations cannot be produced by magnetically channeled accretion on the NS polar cap, and also suggested that a rotation-powered pulsar is active in the disk state. There have also been claims of a disk truncated further out, at 200-300 Rlc, based on models of the observed (broadband) spectral energy distribution (Coti Zelati et al. 2014; Hernandez Santisteban 2016).
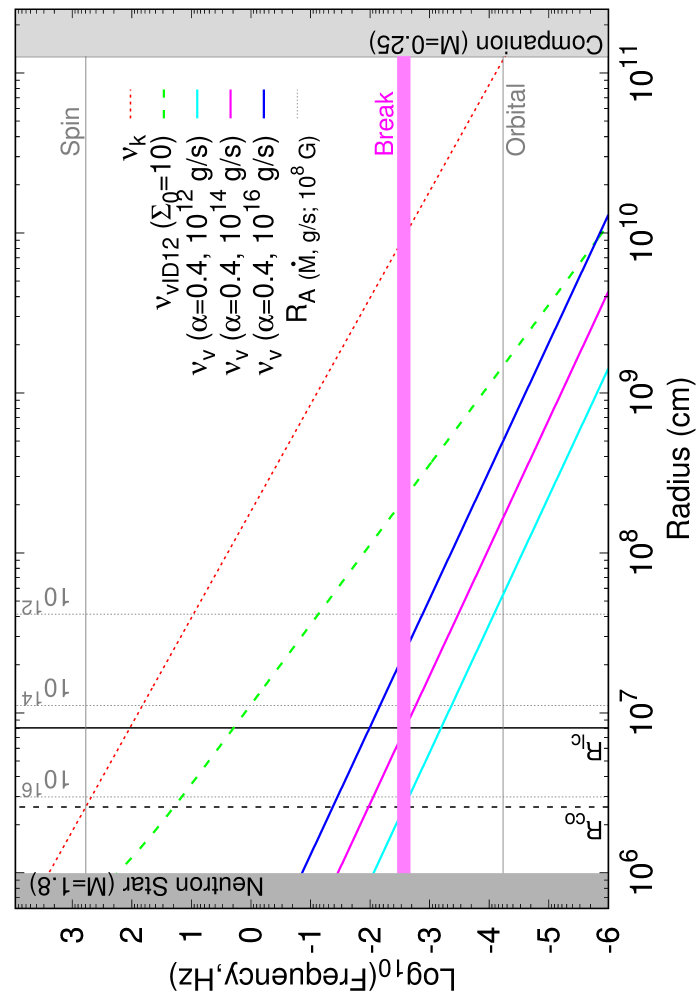
More recently, Veledina, Nättilä & Beloborodov (2019) presented a detailed physical model of the disk state of tMSPs, where they propose that the disk is truncated outside Rlc in the DH state, and enters the light cylinder in the transition to the DL state. Note this is opposite to the original “tug-of-war” model, which proposed an inside-out transition to the less luminous DL mode. We can use our results to test these models, under the common assumption that the break frequency is the viscous frequency at the inner edge of the disk (see discussion in Section 4.1). We show in Figure 6 the viscous frequency for a standard “alpha” disk (Shakura & Sunyaev 1973) with viscosity parameter and different values of g s-1 (from Equation 5.69 in Frank, King & Raine 2002). This is compared to the relevant frequencies for J1023: and (assuming a 1.8 M⊙ NS, Shahbaz et al. 2019). If the DHDL mode transition involves a decrease in Rin by a factor 3 (say from 150 km to 50 km across Rlc, with constant average and ), then we would expect to increase by a factor due to the higher viscous frequencies at smaller radii in the disk (reaching about 11 mHz for the DL state of J1023). We have placed an upper limit on mHz in the DL state (Table 2), which seems to disfavour an outside-in DHDL transition of this magnitude. Furthermore, our discovery of X-ray variability typical of LMXBs favors an accretion-powered DH state, instead of a mostly rotation-powered one.

If we neglect other forces acting on the innermost accretion flow, magnetic pressure will disrupt the flow inside the Alfven radius (RA, for spherical accretion, see e.g. Frank, King & Raine 2002). In our case RA is between 30 and 400 km, as shown in Figure 6, for a 108 G surface magnetic field strength and the same values of g s-1 covering the most likely range for the disk state of tMSPs. One should keep in mind that this is a simple prescription, which ignores the potentially important effect of the pulsar wind on the accretion disk. Ekşi̇ & Alpar (2005) studied such effect analytically and found that there are stable disk solutions around an active rotation-powered pulsar, but these are restricted to a narrow range of R Rlc. This may be the physical reason behind the long-term stability of the disk state of tMSPs: the disk can exist only with a narrow range of inner radii. Furthermore, they find that such stable disk solutions can exist only for g s-1: at higher rates the disk enters Rlc, and at lower rates it is blown away by the pulsar wind.
We can see from Figure 6 that, if we assume that the disk is truncated near the light cylinder (RRlc), the observed break frequency of J1023 (=2.8 mHz) matches the viscous frequency of a disk with =0.4 and g s-1. Interestingly, the same is true for the break frequency in M28-I: =0.86 mHz is lower but the light cylinder is larger (Rlc=188 km), so the viscous frequency there is lower. This offers a possible explanation for the significantly different values of that we find.
If we now put our main results for J1023 and M28-I together, assuming that in both cases corresponds to at Rin, we can place constraints on the disk parameters and (as shown in Figure 7). To summarize, our results are broadly consistent with a disk truncated at RRlc with g s-1 (where the upper limit comes from Ekşi̇ & Alpar 2005) and a viscosity parameter 0.2. This range is consistent with most observational constraints on the viscosity parameter of a thin and fully ionized disk, derived from studies of accreting white dwarfs and black holes (see, e.g., King, Pringle & Livio 2007; Tetarenko et al. 2018, and references therein).
Without regard to the exact location of Rin, our work reveals strong fluctuations in that may trigger the transitions between X-ray modes that are seen in the disk state. Future studies may be able to find a flat-topped noise in the DL state/mode as well, perhaps with a different break frequency, and may even allow a sensitive search for quasi-periodic oscillations. To illustrate this, we estimate that Athena (X-IFU) will be able to collect 0.5-10 keV count rates from J1023 of about 25, 5 and 0.7 c s-1 in the DH, DL, and PS states, respectively (between 8 and 20 times those listed in Table 1).
5 Acknowledgments
We thank A. Ingram for insightful discussions on the propfluc model. We acknowledge the support of the PHAROS COST action (CA16214). This research has made use of data obtained from the Chandra Data Archive, and software provided by the Chandra X-ray Center (CXC) in the application package ciao. Partly based on observations obtained with XMM-Newton, an ESA science mission with instruments and contributions directly funded by ESA Member States and NASA. This research has made use of data and software provided by the High Energy Astrophysics Science Archive Research Center (HEASARC), which is a service of the Astrophysics Science Division at NASA/GSFC. MK acknowledges support from NWO through a Spinoza grant. BDM acknowledges support from a Ramón y Cajal Fellowship (RYC2018-025950-I). ML acknowledges funding from the ERC under the EU’s Horizon 2020 research and innovation programme (consolidator grant agreement No. 101002352).
6 Data availability:
The data underlying this article are available in HEASARC, at https://heasarc.gsfc.nasa.gov/cgi-bin/W3Browse/w3browse.pl.
References
- Alpar et al. (1982) Alpar M. A., Cheng A. F., Ruderman M. A., Shaham J., 1982, Nature, 300, 728
- Ambrosino et al. (2017) Ambrosino F. et al., 2017, Nature Astronomy, 1, 854
- Archibald et al. (2015) Archibald A. M. et al., 2015, ApJ, 807, 62
- Archibald et al. (2009) Archibald A. M. et al., 2009, Science, 324, 1411
- Bassa et al. (2014) Bassa C. G. et al., 2014, MNRAS, 441, 1825
- Becker et al. (2003) Becker W. et al., 2003, ApJ, 594, 798
- Belloni & Hasinger (1990) Belloni T., Hasinger G., 1990, A&A, 227, L33
- Bogdanov et al. (2011) Bogdanov S., Archibald A. M., Hessels J. W. T., Kaspi V. M., Lorimer D., McLaughlin M. A., Ransom S. M., Stairs I. H., 2011, ApJ, 742, 97
- Bogdanov & Halpern (2015) Bogdanov S., Halpern J. P., 2015, ApJL, 803, L27
- Burwitz et al. (2004) Burwitz V., Haberl F., Freyberg M. J., Dennerl K., Kendziorra E., Kirsch M. G. F., 2004, in Society of Photo-Optical Instrumentation Engineers (SPIE) Conference Series, Vol. 5165, X-Ray and Gamma-Ray Instrumentation for Astronomy XIII, Flanagan K. A., Siegmund O. H. W., eds., pp. 123–130
- Campana et al. (2016) Campana S., Coti Zelati F., Papitto A., Rea N., Torres D. F., Baglio M. C., D’Avanzo P., 2016, A&A, 594, A31
- Cohn et al. (2013) Cohn H. N., Lugger P. M., Bogdanov S., Heinke C. O., Van Den Berg M., Sivakoff G., 2013, The Astronomer’s Telegram, 5031, 1
- Corral-Santana et al. (2016) Corral-Santana J. M., Casares J., Muñoz-Darias T., Bauer F. E., Martínez-Pais I. G., Russell D. M., 2016, A&A, 587, A61
- Coti Zelati et al. (2014) Coti Zelati F. et al., 2014, MNRAS, 444, 1783
- Coti Zelati et al. (2019) Coti Zelati F. et al., 2019, A&A, 622, A211
- de Martino et al. (2013) de Martino D. et al., 2013, A&A, 550, A89
- Deller et al. (2012) Deller A. T. et al., 2012, ApJL, 756, L25
- Done, Gierliński & Kubota (2007) Done C., Gierliński M., Kubota A., 2007, A&ARv, 15, 1
- Ekşi̇ & Alpar (2005) Ekşi̇ K. Y., Alpar M. A., 2005, ApJ, 620, 390
- Ferrigno et al. (2014) Ferrigno C. et al., 2014, A&A, 567, A77
- Frank, King & Raine (2002) Frank J., King A., Raine D. J., 2002, Accretion Power in Astrophysics: Third Edition, Frank J., King A., Raine D. J., eds.
- Hernandez Santisteban (2016) Hernandez Santisteban J. V., 2016, PhD thesis, University of Southampton
- Ingram & Done (2012) Ingram A., Done C., 2012, MNRAS, 419, 2369
- Ingram & van der Klis (2013) Ingram A., van der Klis M., 2013, MNRAS, 434, 1476
- King, Pringle & Livio (2007) King A. R., Pringle J. E., Livio M., 2007, MNRAS, 376, 1740
- Klein-Wolt (2004) Klein-Wolt M., 2004, Thesis, Universiteit van Amsterdam
- Linares (2009) Linares M., 2009, PhD thesis, Sterrenkundig Instituut ”Anton Pannekoek - University of Amsterdam. http://dare.uva.nl/record/1/308110
- Linares (2014) Linares M., 2014, ApJ, 795, 72
- Linares et al. (2014) Linares M. et al., 2014, MNRAS, 438, 251
- Linares, van der Klis & Wijnands (2007) Linares M., van der Klis M., Wijnands R., 2007, ApJ, 660, 595
- Lyubarskii (1997) Lyubarskii Y. E., 1997, MNRAS, 292, 679
- Papitto et al. (2019) Papitto A. et al., 2019, ApJ, 882, 104
- Papitto et al. (2015) Papitto A., de Martino D., Belloni T. M., Burgay M., Pellizzoni A., Possenti A., Torres D. F., 2015, MNRAS, 449, L26
- Papitto et al. (2013) Papitto A. et al., 2013, Nature, 501, 517
- Papitto, Torres & Li (2014) Papitto A., Torres D. F., Li J., 2014, MNRAS, 438, 2105
- Possenti et al. (2002) Possenti A., Cerutti R., Colpi M., Mereghetti S., 2002, A&A, 387, 993
- Psaltis & Norman (2000) Psaltis D., Norman C., 2000, arXiv e-prints, astro
- Roberts (2013) Roberts M. S. E., 2013, in IAU Symposium (arXiv:1210.6903), Vol. 291, IAU Symposium, pp. 127–132
- Roy et al. (2015) Roy J. et al., 2015, ApJL, 800, L12
- Shahbaz et al. (2019) Shahbaz T., Linares M., Rodríguez-Gil P., Casares J., 2019, MNRAS, 488, 198
- Shakura & Sunyaev (1973) Shakura N. I., Sunyaev R. A., 1973, A&A, 24, 337
- Tendulkar et al. (2014) Tendulkar S. P. et al., 2014, ArXiv e-prints (astro-ph 1406.7009)
- Tetarenko et al. (2018) Tetarenko B. E., Lasota J. P., Heinke C. O., Dubus G., Sivakoff G. R., 2018, Nature, 554, 69
- Tomsick, Kalemci & Kaaret (2004) Tomsick J. A., Kalemci E., Kaaret P., 2004, ApJ, 601, 439
- van der Klis (1995) van der Klis M., 1995, Proceedings of the NATO Advanced Study Institute on the Lives of the Neutron Stars, held in Kemer, Turkey, August 19-September 12, 1993. Editor(s), M. A. Alpar, U. Kiziloglu, J. van Paradijs; Publisher, Kluwer Academic, Dordrecht, The Netherlands, Boston, Massachusetts, 301
- van der Klis (2006) van der Klis M., 2006, in ”Compact Stellar X-ray Sources”, ed. W. H. G. Lewin & M. van der Klis (Cambridge Univ. Press) (astro-ph/0410551), 39
- Veledina, Nättilä & Beloborodov (2019) Veledina A., Nättilä J., Beloborodov A. M., 2019, ApJ, 884, 144
- Wijnands et al. (2017) Wijnands R., Parikh A. S., Altamirano D., Homan J., Degenaar N., 2017, MNRAS, 472, 559
- Wijnands & van der Klis (1999) Wijnands R., van der Klis M., 1999, ApJ, 514, 939