The intra-group baryons in the LEO I pair from the VST Early-type GAlaxy Survey
Abstract
1 In this paper we present the deep, wide-field and multi-band imaging of the LEO I pair NGC 3379-NGC 3384, from the VST Early-type GAlaxy Survey (VEGAS). The main goal of this study is to map the intra-group baryons in the pair, in the form of diffuse light and globular clusters (GCs). Taking advantage from the large covered area, which extends for 3.9 square degrees around the pair, and the long integration time, we can map the light distribution out to 63 kpc and down to 30 mag/arcsec2 in the band and 29 mag/arcsec2 in the band, deeper than previous data available for this target. The map of the intra-group light (IGL) presents two very faint ( 28-29 mag/arcsec2) streams protruding from the brightest group member NGC 3379 and elongated toward North-West and South. We estimate that the fraction of the stellar halo around NGC 3379 plus the IGL is in both and bands, with an average color -= mag. The color distribution of the GCs appears multi-modal, with two dominant peaks at (u-r) = 1.8 mag and (u-r) = 2.1 mag, respectively. The GC population stretches from North-East to South-West and from North-West to South of the pair, in the last case overlapping with the streams of IGL, as well as the PNe distribution found by Hartke et al. [1] and Hartke et al. [2]. Since these structures are elongated in the direction of the two nearby galaxies M96 and NGC 3338, they could be the remnant of a past gravitational interactions with the pair.
2 Keywords:
Galaxies: evolution - Galaxies: surface photometry - Galaxies: group: general - Galaxies: interactions- intergalactic medium - Galaxies: diffuse intragroup light
3 Introduction
It has been known for many years that in the CDM model the cosmic structures are formed and evolve according to the hierarchical accretion scenario. With this paradigm, the latest and largest gravitationally bound systems in the universe, i.e. galaxy clusters, are the result of past merging events of smaller elements, the galaxy groups [3], that differ from the galaxy clusters, in the local universe, for the different values of viral masses (), which range from 1013 for galaxy groups to 1015 for galaxy clusters [4]. In this framework, groups are interesting environments for studying the galaxy evolution, since they are the place where galaxies spend most of their evolutionary life [5, 6]. Galaxy groups are more abundant than galaxy clusters, and most galaxies in the local Universe, about 55, are found in group environments [7]. The whole scenario of groups or clusters mass assembly is tricky, involving many different physical mechanisms. During the infall of smaller system in larger ones, such as galaxies in clusters or groups, stars can be ripped out from the progenitor galaxies and some galaxies can also be totally destroyed. In addition, in a dense environment, the mutual interaction among galaxies can build up tidal structures such as tails, shells, bridges or tidal dwarf galaxies of baryonic matter stripped away from the outer parts of the interacting galaxies. During the assembly process, the stripped baryons can be in part reabsorbed by the parent galaxies and can in part merge into the Brightest Galaxy of the Group/Cluster (BGG, BCG) or in other massive members. The remaining part of the stripped material gets trapped in the group/cluster potential well and forms the extended, diffuse and very faint ( mag/arcsec2) component known as intragroup or intracluster diffuse light (IGL, ICL) [8, 9, 10, 11, 12, 13, 14, 15, 16, 17, 18, 19, 20]. In groups, the dynamical timescale is longer and IGL imprint (i.e. the stripped material) remains for many Gyrs [21]. According to this scenario, the IGL, the precursor of the ICL, can be considered as a fossil record of past interaction events [e.g. 22, 10, 23]. The IGL (ICL) inhabits the intragroup (intracluster) space between the galaxies and it is bound only to the group’s (cluster’s) potential well, and to none of the galaxies that build up the systems. Based on this assumption, ICL has also been used as a luminous tracer for dark matter [e.g. 14, 19]. The amount of IGL provides clear information on the dynamical evolution of the structures also because it traces the accretion history of the system and the tidal encounters [24]. Numerical simulations suggest that a larger amount of IGL (ICL) is expected when numerous interactions and encounters between the galaxies of the group (clusters) happen [25, 26, 27, 28, 29, 11, 30]. Recent studies revealed a fraction of diffuse light in a range of 10 - 50 of the total cluster light, despite these estimates are affected by large uncertainties (see e.g. Montes [31] for a recent literaure review on the history of the ICL). The observational studies on the distribution of ICL and its physical properties (e.g. amount, color) are fundamental to set constrains for numerical simulations [32, 33, 11, 15, 34], and to reduce the discrepancy between observations and cosmological simulations on the baryon component of the universe [35]. An aspect that is still much debated in literature, both from a theoretical and observational side, regards how the ICL fraction relates to the virial mass () of the host environment [36, 37]. From a theoretical point of view, Lin and Mohr [38], Murante et al. [25], Purcell et al. [26] and Henden et al. [39] found a slight increase in the ICL fraction in systems with higher . In particular, Purcell et al. [26] estimated that the ICL fraction increased from 20, in halos with M⊙, to in halos with M⊙. In contrast, Sommer-Larsen [40], Monaco et al. [41], Dolag et al. [42], Henriques and Thomas [43], Rudick et al. [29], Contini et al. [11] found a fraction of ICL in a range between 20% and 40% for all values of M⊙. Cui et al. [9] indicated a slight decrease of the ICL fraction with increasing . On the observational side, Sampaio-Santos et al. [44] for a sample of 528 clusters at 0.2 z 0.35, didn’t find an increasing dependence between the amount of ICL and . Also from observations in the local universe () it seems there is no evident relationship between the ICL fraction and the [e.g. 45, and reference therein]. A large scatter is observed, where high ICL amount ( 30 - 45) occurs both in groups with and in massive clusters of galaxies, like Fornax and Antlia (Ragusa et al. 2022 in preparation), as well as low ICL amount ( 5 - 10) results both in groups and in massive clusters of galaxies, like Coma and Abell85 [46, 47]. This scatter might depend on the different concentration (i.e. compact groups vs loose groups) and on the different formation time of the particular halo in which the ICL lies [see the review of 37, for more details]. Indeed, more dynamically evolved systems, should host a larger fraction of ICL, as stellar stripping and mergers are more frequent [e.g. 25, 29, 48, 11]. In the last two decades, thanks to enhancement of new deep photometric surveys, a great contribution was provided to the study of low-surface brightness (LSB) structures in galaxy groups/clusters out to the intragroup-intracluster space, and in particular to the detection of the ICL [e.g. 49, 50, 51, 52, 53, 54, 55, 56, 57, 58, 19, 59, 20, 47, 60]. The VST Early-type GAlaxy Survey [61] takes its place in this context as a pivotal survey with an increasingly important role in the development of the deep and wide-field photometry. VEGAS111Visit the website http://www.na.astro.it/vegas/VEGAS/Welcome.html is a multi-band ,,, imaging survey, able to map the surface brightness of galaxy down to the azimuthally averaged surface brightness 31 mag arcsec-2 and out to 15 effective radii () [see 62, 63, 64, 65, 66, 67, 68, 45, and references therein]. In this work we present new deep data of the LEO I pair, NGC 3379-NGC 3384, as part of the VEGAS sample. The new multi-band images represent the deepest data available for this target. These allowed us to map the distribution of the IGL and GCs, and to study the physical properties of these tracers in the intra-group region. This work is organized as follows. In Sec. 3.1 we introduce the target and the previous studies available in the literature. In Sec. 4 we present the observations and the data reduction. In Sec. 5 we describe in detail the method used for the data analysis (i.e. the surface photometry and GCs detection). In Sec. 6 we illustrate the results on the intra-group baryons (diffuse light and GCs) in the LEO I pair NGC 3379-NGC 3384 and compare our results with the previous studies, both on the observational and theoretical side. Finally, in Sec. 7 we discuss our results and draw the main conclusions of this work.
3.1 The LEO I pair NGC 3379-NGC 3384
The galaxies NGC 3379-NGC 3384 are members of the LEO I group. This is a very loose group composed, at least, of 11 bright galaxies where seven out of the total, including NGC 3379 (BGG) and NGC 3384, are associated with the subgroup NGC 3368 (M96) centered on the BGG. The other four galaxies are members of the LEO triplet [69]. In addition to both early and late morphological types of galaxies (ETGs, LTGs), a large number of dwarf galaxies have been revealed by Müller et al. [70]. There is extensive literature on the LEO I group, in particular about the presence of a fragmented ring of neutral hydrogen surrounding the pair NGC 3379-NGC 3384, with a radius of about 100 kpc. The debate on the history of the formation and evolution of this HI ring is still open and controversial. To date, no optical counterpart has been detected, except for three far and near-ultraviolet small sources [71] residing in the high density region of the HI map [72]. Schneider [73] studied the kinematics of the HI gas in the ring, providing an elliptical orbit centered in the light-weighted barycenter between NGC 3379 and NGC 3384. According to this kinematic model, the rotation period of the structure should be Gyr [73]. These findings, combined with the lack of optical counterpart and star formation associated with the ring, set at 4 Gyr the lower limit of its age [74, 73, 75]. Sil’chenko et al. [76] found that the ages and kinematics of both the circumnuclear stellar and gaseous disks in NGC 3384, NGC 3379 and M96 are consistent with a formation age on the Gyr scale. The primordial formation of the HI ring, however, is hindered by stability problems over large time scales, a fundamental inconsistency which suggests that a close encounter between disk galaxies is the most likely scenario for the formation of the ring. They might be M96 and NGC 3384, since the S0 NGC 3384 is the only galaxy of the group having the disk major axis aligned with the ring. NGC 3384 could have been transformed into a S0 galaxy after that encounter [77]. According to this hypothesis, Michel-Dansac et al. [78] reproduced all the most important features of the ring, such as the shape, the rotation and the lack of the optical counterpart brighter than 28 mag/arcsec2. Although the formation picture seems confirmed, the absence of any optical counterpart of this structure still remains an open issue. Watkins et al. [21], with the deepest photometry present in the literature on this target, did not find any optical counterpart of the ring, down to 30 mag/arcsec2 in the band. The authors also suggested that there is no IGL detected down to the SB limit they can explore. According with simulations, in the galaxy groups the expected IGL fraction should vary from 12% up to 45 [40, 79]. Since the halo mass of the LEO I group falls slightly below the resolution limit of the simulations, Watkins et al. [21] inferred that in this mass range the IGL could contribute significantly less than the larger masses.
The most recent estimate of the IGL amount in the LEO I group is provided by Hartke et al. [1], using photometric and kinematic data of the planetary nebulae (PNe). They derived 4 as a lower limit for the amount of IGL, updating the previous estimate of 1.6 predicted by Castro-Rodríguez et al. [80], also using the PNe as discrete tracers for the diffuse intra-group light. Other studies of the LEO I pair were conducted by Harris et al. [81], who found evidence of a transition from a metal rich stellar population to a metal poor stellar population towards the outside of the NGC 3379 stellar halo. Indeed Harris et al. [81] found a range of [Fe/H] for the NGC 3379 stellar halo, more metal poor than the inner regions. This result was confirmed later by Lee and Jang [82], who supported the existence of two different sub-populations of GCs both in colour and metallicity in the halo of NGC 3379: a dominant, red, metal rich population and a much fainter, blue, metal poor one. The origin of the stellar halo is still much debated. The most accredited scenario proposed by Lee and Jang [82], foresees two phases: the red and metal rich halo was formed through in situ star formation and/or accretion via major mergers of massive progenitors, while the blue and metal poor halo occurred through dissipationless mergers and accretion events.
4 Deep VEGAS images of the LEO I pair
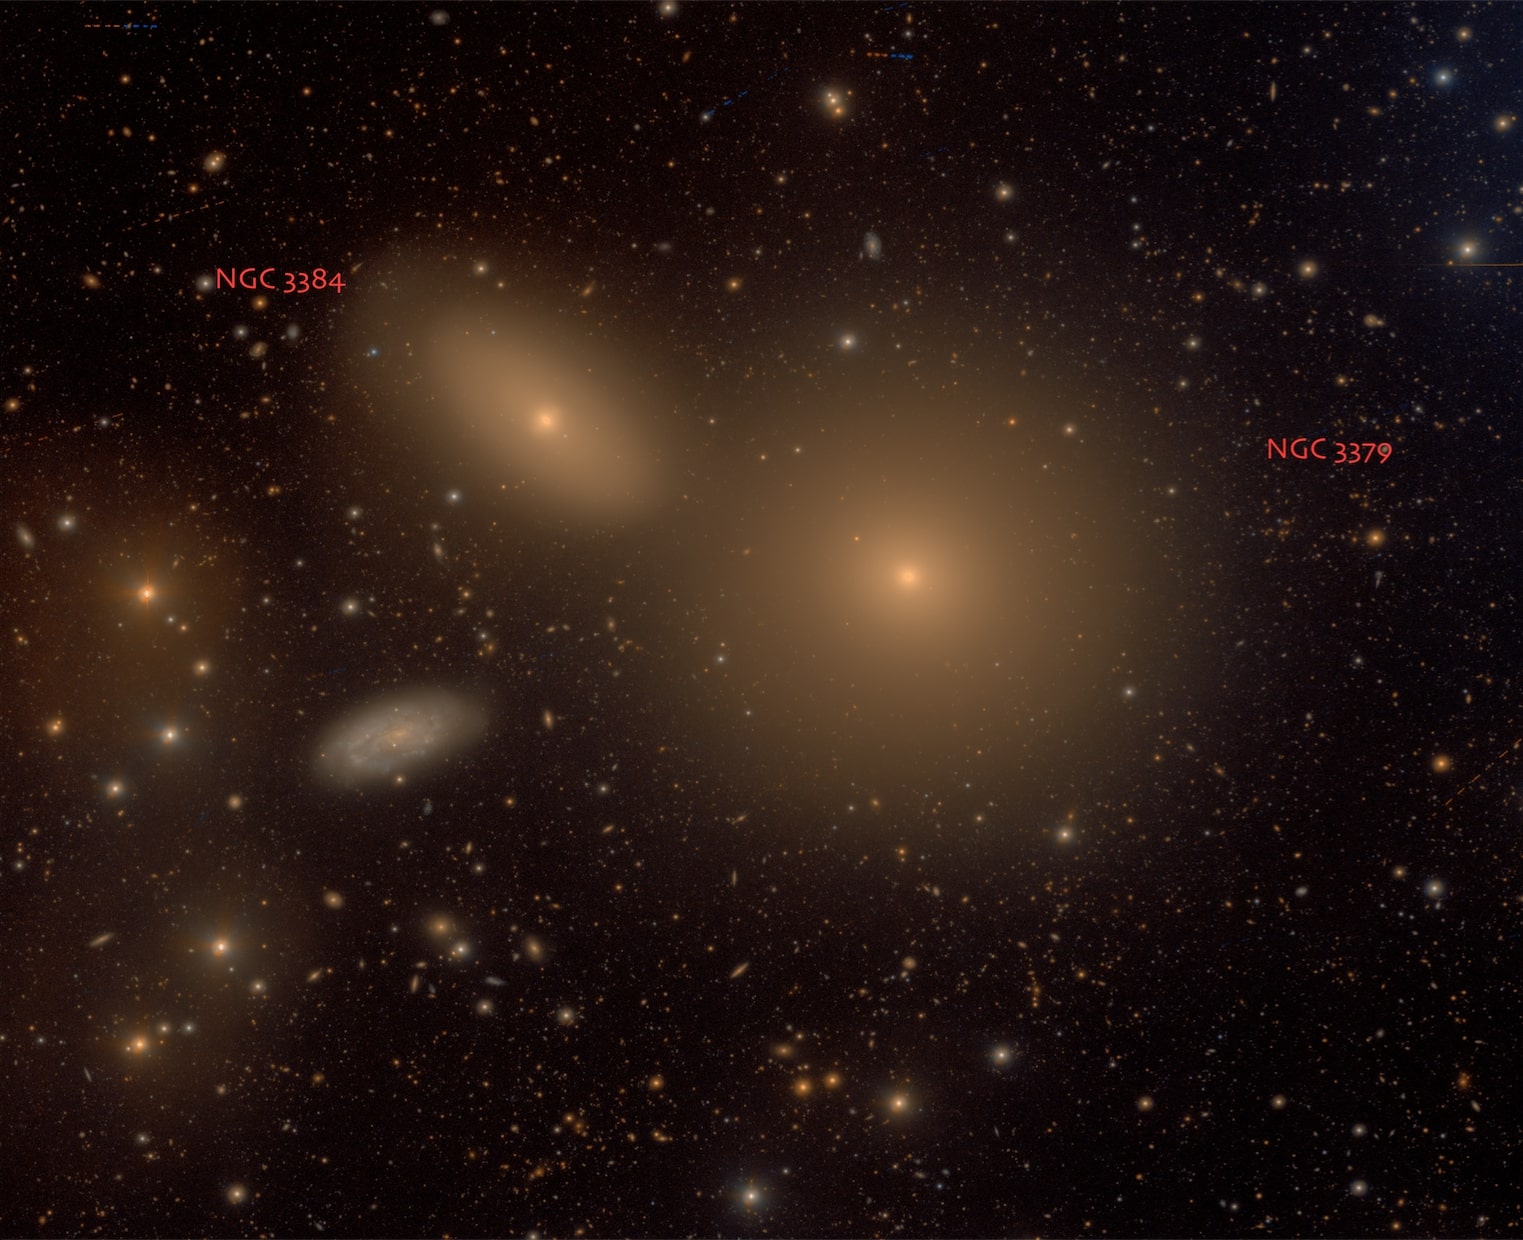
The LEO I pair is a target of VEGAS, a multi-band ,, and imaging survey, carried out with the Very Large Telescope Survey Telescope (VST). The VST is a 2.6 m wide field optical telescope [83] equipped with OmegaCAM, a one square degree camera with a resolution of 0.21 arcsec pixel-1. Fig. 1 shows the sky-subtracted color composite , and VST image obtained for LEO I pair. The bright spiral galaxy NGC 3389, also visible in the field-of-view (FOV) SW of NGC 3379, is a background source and it is not part of the group. The data used in this paper were acquired in service mode (run IDs: 096.B-0582(B), 097.B-0806(A), 090.B-0414(D)), in clear conditions during the dark time, with an average seeing of FWHM 1.0 arcsec in the band, FWHM 1.00 arcsec in the band, FWHM 0.81 arcsec in the band and FWHM 0.95 arcsec in the band. The total integration times are: 2.04 hours in band, 2.13 hours in band, 2.06 hours in band and 0.35 hours in band. The surface brightness depths at over the average seeing area listed above are about mag/arcsec2, mag/arcsec2, mag/arcsec2 [84]. The point source depth at 80 completeness level is 24.38 mag, 25.04 mag, 24.85 mag, 23.44 mag, in the , , and band, respectively.
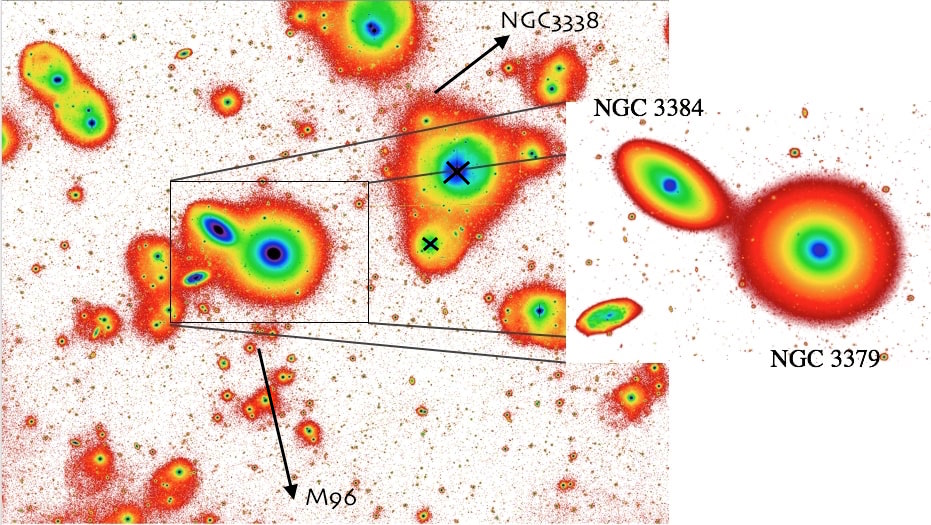
In the LSB regime, a fundamental step is the estimate of the sky background contribution. To this aim, the step-dither observing sequence is adopted. It consists of a cycle of short exposures (150 sec), both on the target (science frame) and the sky (offset frame). The latter is used to estimate the sky background contribution. This turned to be the best strategy to analyze the fields with very bright galaxies, having a very extended envelope [see e.g. 85, 86, 87]. In this particular approach, the offset frame is taken as close as possible, in space and time, to the science frame (offset by °), but far enough from the central bright galaxies, to avoid taking into account the diffuse light of the extended envelope of the galaxies and IGL. The data reduction was carried out by using the pipeline [88], which is described in detail by Capaccioli et al. [61] and Spavone et al. [86]. The VST mosaic covers an area of 3.65 square degrees centered on the LEO I pair. In Fig. 2 we present the deep VST image in band, of 1.34 1.05 square degree, centred on the LEO I pair. The main properties of the two galaxies are listed in Tab. 1. In this paper we adopted for LEO I pair the same average distance of the BGG, 10.23 0.08 Mpc [82], so 1 arcsec corresponds to 0.05 kpc. The extinction-corrected [89] magnitudes through-out the paper are in the AB system.
5 Data analysis: Surface photometry and GCs detection
The science goals of this study are to map the intra-group baryons made by diffuse light and GC systems. In particular, we aim at estimating the IGL contribution to the total luminosity of the group and to provide its color. To this aim the crucial task is to separate the contribution of the IGL from that of the scattered light by the foreground/background sources and by the light belonging to the group members. The main steps we performed for the data analysis are briefly summarised below and discussed in detail in the next subsections. They have been tested and successfully applied to all VST images [see 62, 63, 64, 65, 66, 67, 68, 45, and references therein], to study the LSB regime, in particular to detect the IGL. For the estimate and analysis of the IGL we use the and bands only, since these are the deepest images with the most efficient filters of OmegaCAM. On the sky-subtracted mosaic we proceed as follow:
-
•
the contamination from the foreground brightest stars in the field are removed by subtracting their models from the image (see Sec. 5.1);
-
•
the limiting radius of the photometry (Rlim) and the residual background fluctuations (see Sec. 5.2) are estimated;
-
•
the isophote fitting of the brightest group members out to Rlim (see Sec. 5.2) are performed to obtain the azimuthally-averaged surface brightness profiles and shape parameters;
-
•
the brightest group members have been modelled and subtracted out to their transition radius (Rtr) (see Sec. 5.4).
The tools and methods adopted in each step are described in the following subsections.
5.1 Scattered light from the bright stars
To account for the scattered light from the two bright foreground stars located North-West in projection of the BGG (R.A. 10:46:19.207 Decl. +12:44:47.19 with = 9.42 mag, and R.A. 10:47:00.015 Decl. +13:01:37.01 with = 10.49 mag, see Fig. 2), we have modelled their light distribution and subtracted it from the parent image. To this aim we have derived a 2-dimensional (2D) fit of the light distribution (using the IRAF222IRAF (Image Reduction and Analysis Facility) is distributed by the National Optical Astronomy Observatories, which is operated by the Associated Universities for Research in Astronomy, Inc. under cooperative agreement with the National Science Foundation task ELLIPSE [90]). Fit is made for both sources assuming a circular light distribution out to the edge of the frames ( 60 arcmin, see Fig. 2), keeping all parameters fixed to their initial values, i.e. center (,), ellipticity ( = 0.05) and position angle (P.A. = 0). Before performing the isophote fit of the stars, we accurately masked 333All the masks of this work were created by using the IRAF task MSKREGIONS. all the foreground/background sources. The core of the group is also masked out to 20 arcmin ( 19 Reff) of the BGG [91]. Using the IRAF task BMODEL, we built up the 2D models of the stars and subtracted them from both and parent images.
5.2 Estimate of Rlim and residual background fluctuations
Using the same method described by Ragusa et al. [45], the star-subtracted images are used to estimate the Rlim and the average value of the residual background level444The “residual background” in the sky-subtracted images are the deviations from the background with respect to the average sky frame obtained by the empty fields close to the target.. Since images are sky-subtracted the residual background level is close to zero. This value (and its RMS fluctuation) has been taken into account when computing the galaxies’ surface brightness and the relative uncertainties, i.e. all surface brightness profiles are corrected for such a residual value of the background. The Rlim corresponds to the outermost semi-major axis derived by the isophote fitting, with respect to the center of the target, where the galaxy’s light blends into the average residual background level. Beyond Rlim the residual background fluctuations are almost constant. Since the two galaxies in the LEO I pair are close in projection and mostly located at the image centre, the isophote fit is performed by adopting the BGG centre and, therefore, the is the same for both galaxies. As explained in Ragusa et al. [45], by using IRAF task ELLIPSE, light is fitted in circular annuli (i.e. the ellipticity and PA are fixed to zero), with constant step, out to the edge of the images. All the foreground/ background sources and the companion NGC 3384 galaxy are accurately masked. We found that R arcmin in both and bands. For , the residual background levels are Ig - 0.52 0.02 ADU and Ir - 0.90 0.03 ADU in the and band, respectively.
5.3 Isophote fitting
In order to derive the amount and physical properties of the IGL, we need to account for the contribution to the light from NGC 3379 and NGC 3384.
To this aim, for both galaxies, we derived the azimuthally-averaged surface brightness profiles and then we performed the 1-dimensional multi-component fit to set the scales of the contribution to the light from the galaxy and IGL (Sec. 5.4). Firstly, we fitted the isophotes of the BGG, NGC 3379, out to Rlim. We built a detailed mask on the sky-subtracted and star-removed images, of the foreground/background sources and of NGC 3384, by using IRAF task MSKREGIONS. The fit of the isophotes was performed using the IRAF task ELLIPSE, with all parameters left free (i.e. center, ellipticity and P.A.), over elliptical annuli, by applying a median sampling and k-sigma clipping algorithm. The combination of median sampling and k-sigma clipping algorithm has been shown to perform at best the fit of the isophotes, rejecting deviant sample points at each annulus. We derived the azimuthally averaged surface brightness, color and geometrical parameters profiles in each band.
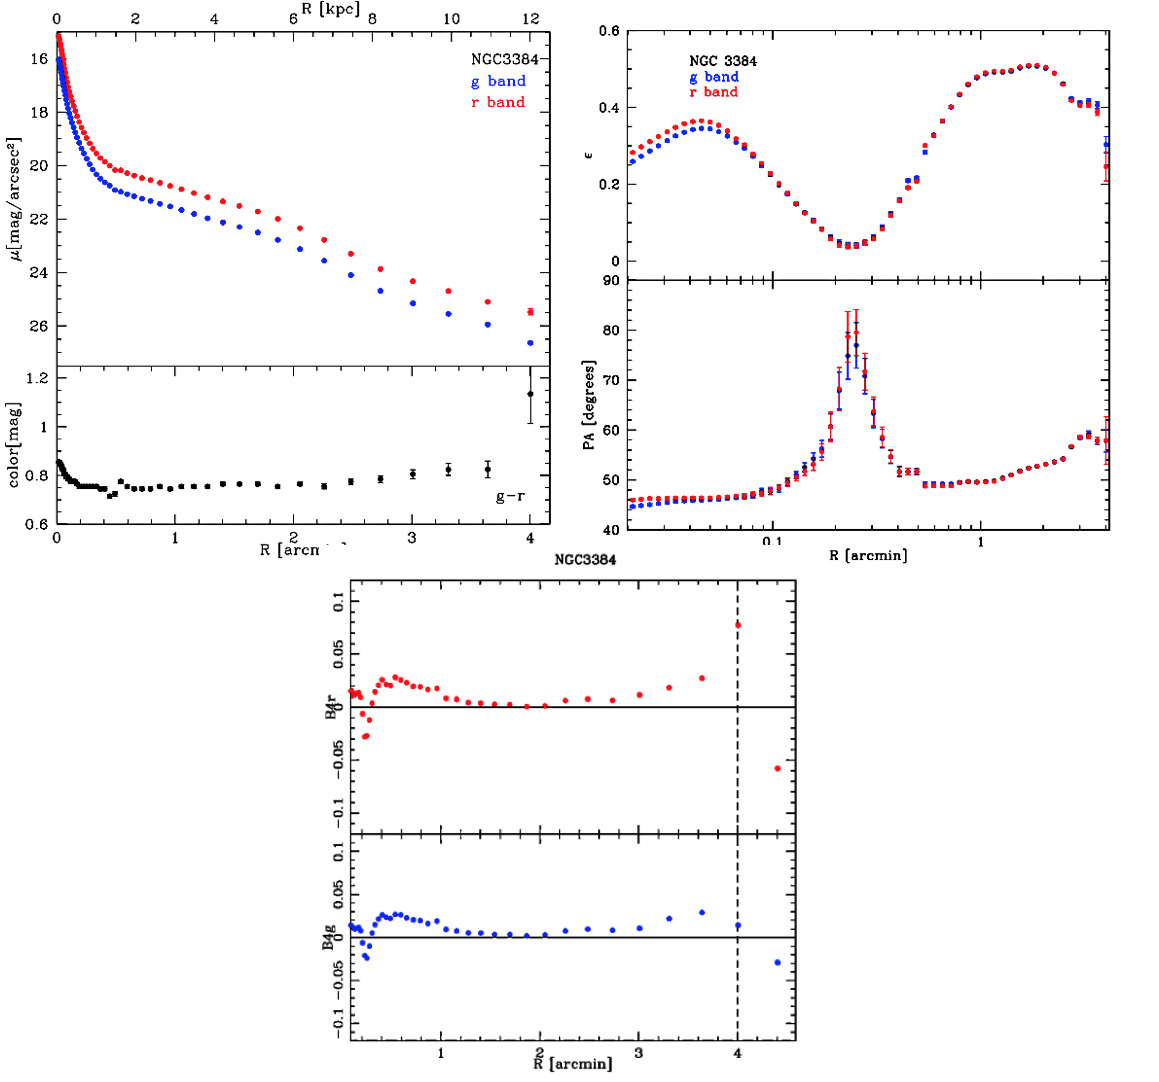
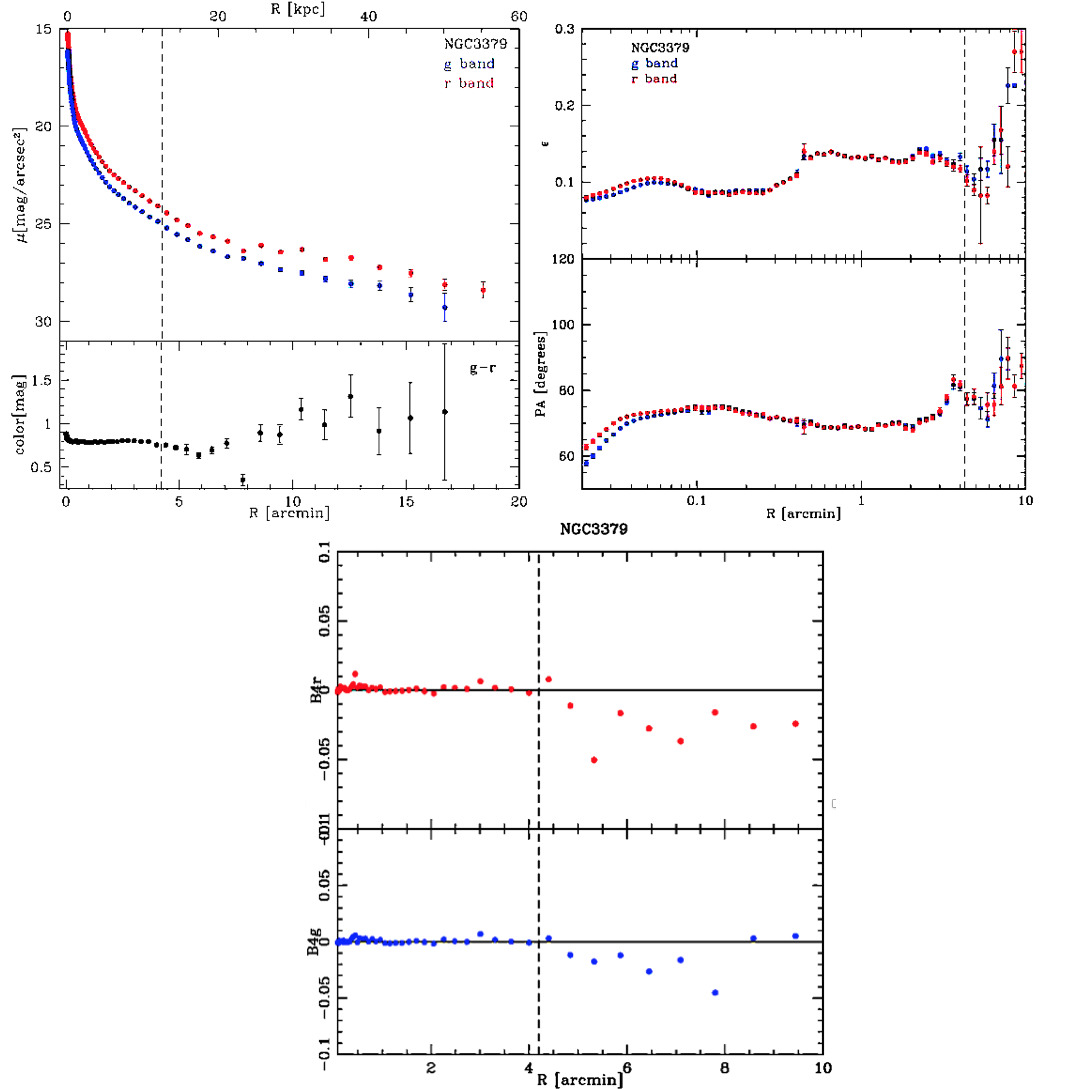
The total uncertainty on the surface brightness profile takes into account the uncertainties on the photometric calibration (i.e. on the zero points, zpg= 30.000 0.005 mag and zpr= 30.000 0.004 mag) and the RMS in the background fluctuations555 Calculated with the following formula: , where N is the number of pixels used in the fit, is the rms on the sky background, is the error on the photometric calibration, adu is the analog digital unit and [61, 92].. From the isophote fit, we derived the 2D model (using IRAF task BMODEL) of the light distribution for NGC 3379 up to Rlim in each band, and subtracted it from the parent image. On the residual images, we performed the isophote fit of the other galaxy of the pair, NGC 3384, up to Rlim in each band, following the same procedure used for NGC 3379. In the top left panels of the Fig.3 and of the Fig.4 we show the azimuthally-averaged surface brightness and - color profiles of the two galaxies, NGC 3379 and NGC 3384 respectively, as a function of isophote semi major-axis. We are able to map the surface brightness profile of the BGG NGC 3379 down to 30 mag arcsec-2 in the band and 29 mag arcsec-2 in the band. We also provide the reliable color profile of the galaxy out to 17 arcmin (i.e. 50 kpc) from the galaxy centre. The lower part of the top left panel in Fig. 3 shows that the color profile changes the trend at a radius of 4 arcmin (i.e. 12 kpc). Within this radius the color is almost constant, whit a value mag. At larger distances, the color profile has a negative gradient with a value ranging from 0.8 mag, at 4 arcmin ( 12 kpc), to 0.6 mag, at 6 arcmin ( 18 kpc). In the top right panels of the Fig.3 and the Fig.4 we show the azimuthally-averaged ellipticity and position angle profiles of the two galaxies NGC 3379 and NGC 3384, respectively, as a function of isophote semi major-axis. A break in the ellipticity and PA radial profiles is also evident, at the same radius ( 6 arcmin) in which the color profile of NGC 3379 becomes shallower. From the isophote fit we obtained the growth curve, used to compute the total magnitude mtot for NGC 3384 and NGC 3379 in both and bands. From the extinction-corrected magnitudes (see Tab. 3) we estimated: i) the average color = 0.76 mag and the total luminosity of NGC 3384, which is and ; ii) the average color = 0.82 mag and the luminosity of NGC 3379, out to its transition radius (i.e. the radius beyond which the IGL plus diffuse stellar envelope of the galaxy start to dominate, see Sec. 5.4), which is and .
5.4 1-dimensional fit of the light distribution: the contribution of the IGL
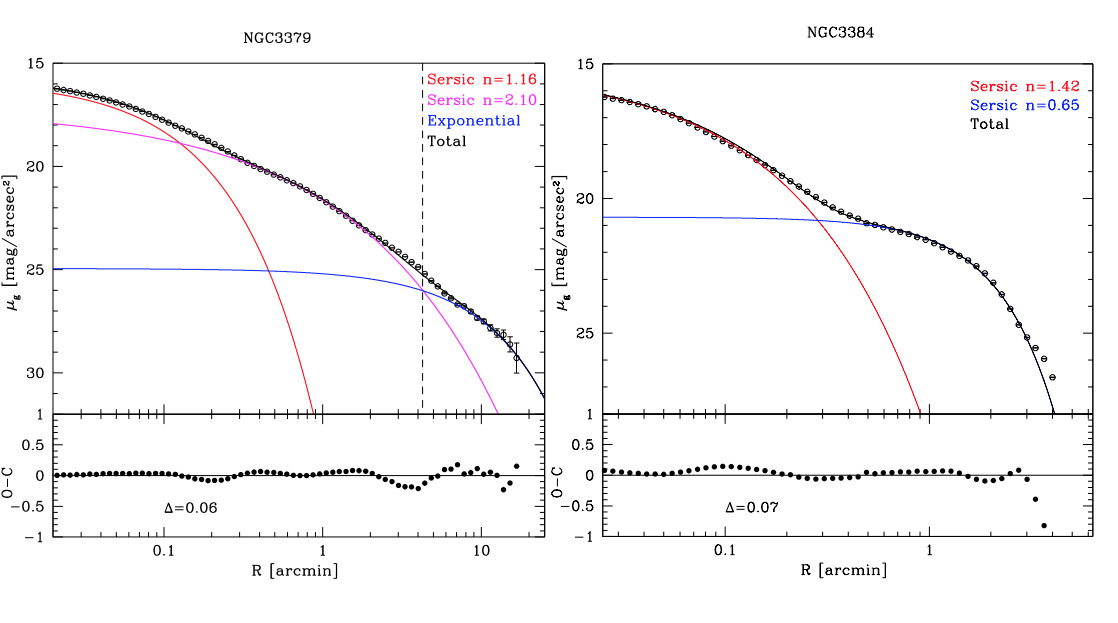
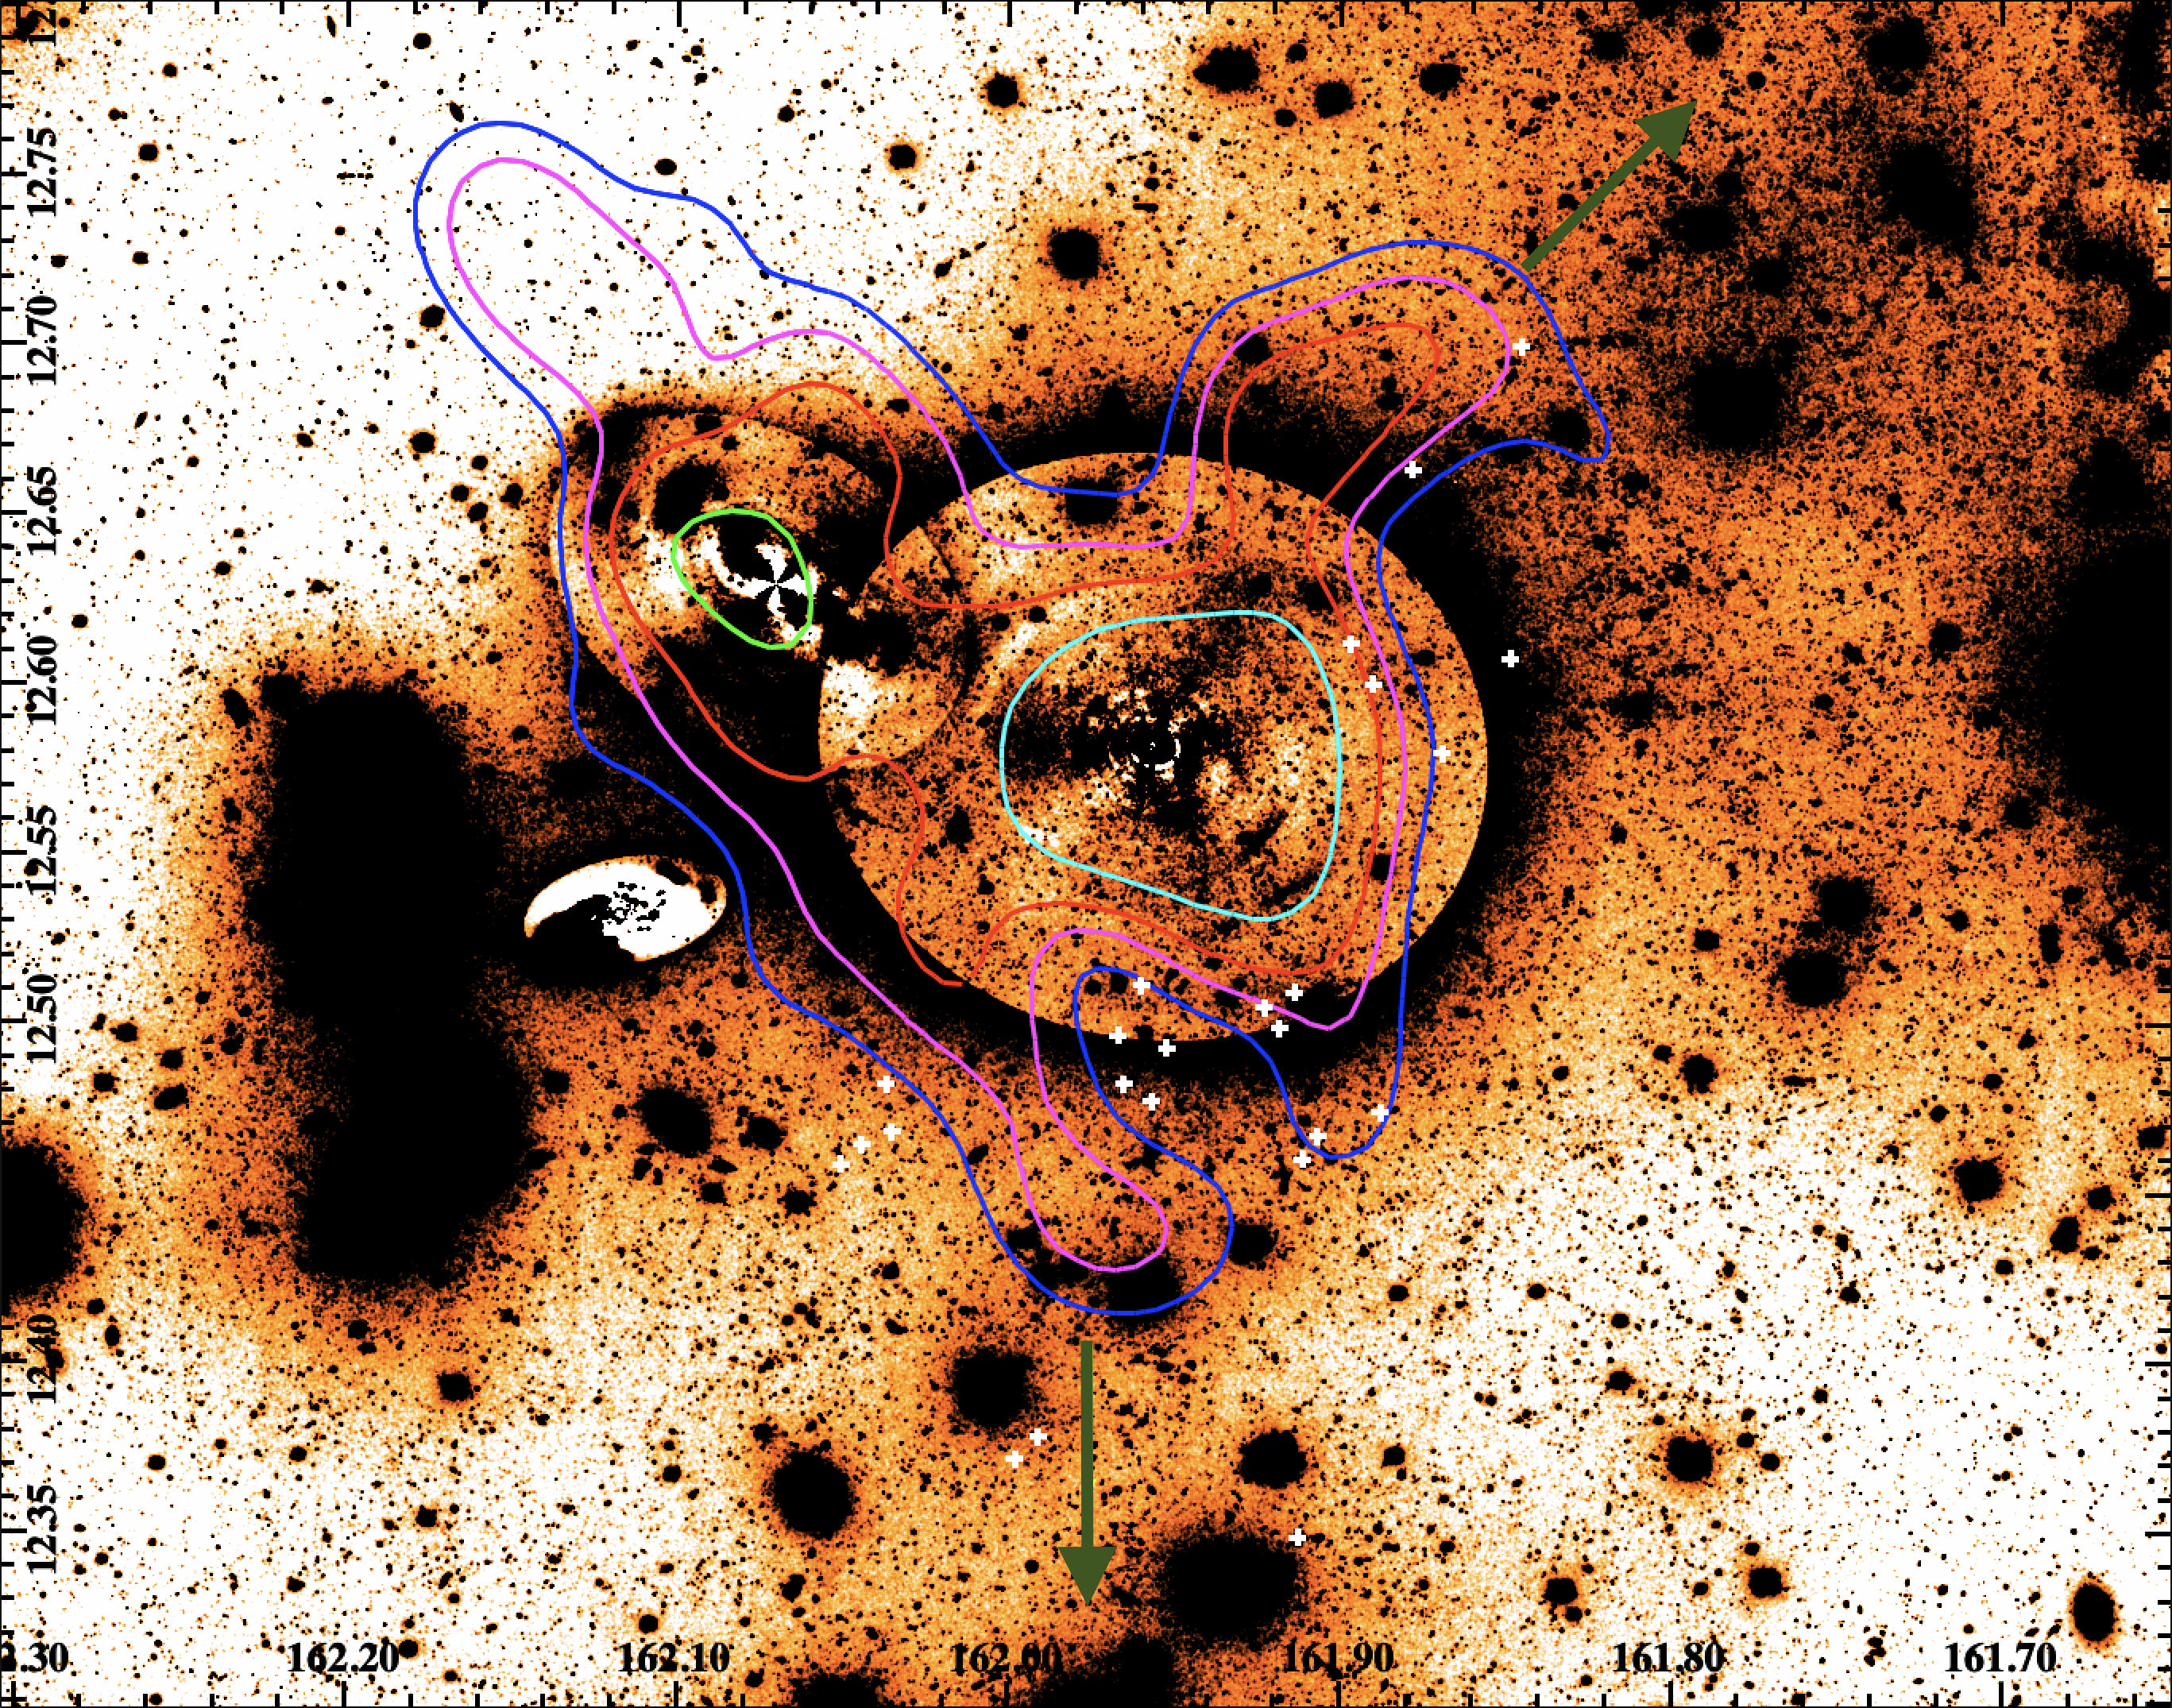
The massive galaxies at the center of clusters or groups are made by a very bright central component, fitted with one or two Sérsic law and a diffuse and very extended envelope, which is well reproduced by an exponential law [see e.g. 92, 93, 94, 95, 96, 85, 87, 97, 67, 45]. The exponential envelope takes into account both the stellar halo of the galaxy and the diffuse light component around it (i.e. IGL, ICL). Based on the deep photometric data, it is currently a challenge to unambiguously separate the extended stellar halo of the BGG (or BCG), which is gravitationally bounded to the galaxy, from the diffuse light around it. There is more than one photometric analysis used to separate the two components [see 36, as review]. In this work we adopted the same method described in Ragusa et al. [45]. In short, we have derived the transition radius (Rtr) between the brightest parts of the BGG and the galaxy outskirts by fitting the 1D azimuthally-averaged surface brightness profiles, adopting the fitting procedure introduced by Spavone et al. [97], also used in other VEGAS papers [see e.g. 63, 67, 64, 85, 66]. For the BGG of the pair, NGC 3379 (left panel of the Fig. 5), the best fit is reproduced by the combination of three components. The inner and brightest regions are well fitted by two Sérsic laws. The outskirts show an extended exponential component, for arcsec ( kpc), with a central surface brightness of mag/arcsec2 and a scale length arcsec ( kpc) in the band. The transition radius Rtr, which separates the inner and brighter regions of the galaxy from the fainter outskirts is 4.2 arcmin ( 12.5 kpc). The shape parameters (i.e. ellipticity, P.A. and the 4th coefficient of the series a4 and b4) also show a different trend for . In particular, the outskirts become flatter () and a twisting of degrees is observed (see top right panels of Fig. 3), with isophotes being more boxy (see bottom panels of Fig. 3). For , the color profile shows redder colors ( mag) with respect to the central regions that have mag (see Fig. 3). In order to separate the contribution of the bright part of NGC 3379 from the outskirts, we obtained the 2D model of the galaxy up to its Rtr 4.2 arcmin and subtracted it from the stars-subtracted images. The 2D model is obtained using the IRAF task BMODEL, having has input the outcome of the isophote fit out to the transition radius. For NGC 3384 (Fig. 5, right panel) the best fit is reproduced by the combination of two Sérsic components, which model the brightest regions of the galaxy and an outer disk, for 3 arcmin. The 2D model of NGC 3384 is derived and subtracted from the parent image, where the 2D model of NGC 3379 was also subtracted. The structural parameters obtained by the 1D fit, both for NGC 3379 and NGC 3384, are listed in Tab. 3. The final residual images map the light in the stellar envelopes around galaxies plus the IGL component in the LEO I pair. This is one of the main results of this work and it is shown in Fig. 7 for the band. Here, the light from the background spiral galaxy NGC 3389 has also been modelled and subtracted.
5.5 Census of the Globular clusters
Globular clusters (GCs) in massive galaxies are very old stellar systems, bright and typically fairly numerous. These characteristics, together with the many relevant properties that can be studied (radial and color distribution, luminosity function, etc.) make GCs a useful fossil record of the galaxy and its host environment [98, 99]. Thanks to the large area covered by the VEGAS images, and the number of available passbands, we took advantage of our VST data to study the GC population around the LEO I pair. The analysis is carried out using the same methods described on the previous papers of the Fornax Deep Survey (FDS) and VEGAS surveys [e.g. 100, 101, 99]. Here we briefly summarize the main steps of the GC photometry, selection and analysis.
5.5.1 GCs photometry
The photometry of point-like and background extended sources in the frame was obtained running SExtractor [102] independently on the and galaxy-subtracted frames. The detection parameters (SExtractor’s DETECT_MINAREA, DETECT_THRESH, SEEING, weighting maps, etc.) were optimized for each passband to improve the detection of the faintest sources. In particular, we visually inspected the central galaxy-subtracted regions to verify that no obvious source is missing, or that surface brightness fluctuations [103] are identified as real sources. We adopted the 8-pixel () aperture magnitude as our reference. The aperture correction to the 8-pixel magnitudes are derived using the classical curve of growth analysis on isolated and bright stars in the field [104]. The values of correction lie in the range of - mag (larger corrections for images with wider FWHM). The aperture and extinction corrected catalogs of each individual passbands are then matched using a matching radius, taking the as our reference passband, because of the better image quality. The final catalog of matched sources contains sources, composed by the MW stars, the background galaxies and the GCs in the area. For each detected source, SExtractor also provides other quantities that we used to identify GCs: Elongation, FWHM, Flux Radius [see 102, for a detailed description of these quantities]. We also measured the 4 and 6 pixels aperture magnitudes, to derive the concentration index (C.I.) of the sources which we also used to sort out GCs from the full matched catalog [105].
5.5.2 GCs selection
To identify GCs from the final matched photometric catalog, we relied on the observed properties of confirmed GCs from existing studies, and on the known properties of the GCs in the area. We built a master GCs catalog, to be used as reference for selecting GCs over the wide LEO I area, taking as reference the available catalogs of GCs identified: from spectroscopic analysis [106, 107], 64 GCs in total from combined and photometry [108, 109], 51 GCs; using X-ray selected sources from catalogs of LMXB [110, 111], 11 GCs. After matching the whole set of targets from the literature, our master catalog contained 67 GCs. Table 6 contains the master GCs catalog. Figure 6 shows the GCs from the master catalog overlaid with the 2D histograms of measured properties of sources in the full matched catalog.
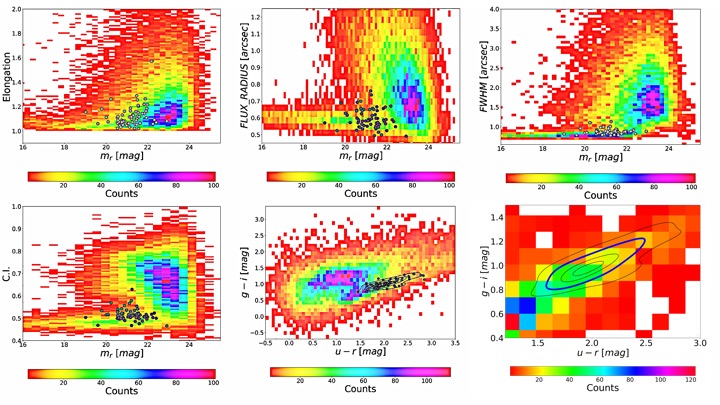
Adopting the observed ranges of GCs properties from the master catalog, we defined the intervals to be used for identifying bona-fide GCs. The values of FWHM, concentration index, elongation, flux radius, photometric uncertainty and magnitudes adopted are reported in Table 4. These ranges are obtained from the median of the master catalog . GCs also show a universal luminosity function [GCLF; 98], which we used to define the magnitude range for GCs. The GCLF has a gaussian shape with peak at mag [98, 112], and width that depends on the galaxy mass/luminosity. Using the empirical relations from Villegas et al. [112], we estimated mag in the band. At the adopted distance of 10.23 0.08 Mpc for LEO I, which implies GCLF peak at mag, we select as GCs candidates the objects within from the GCLF peak: mag. Using the parameter ranges defined as described above, 2397 GCs candidates are pre-identified. We finally inspected the color-color properties of the selected sources to further clean the sample. Figure 6 shows the color-color selection procedures adopted: the middle lower panel shows the color-color diagram for the full sample of matched sources, and the isodensity levels of the master catalog; the right lower panel shows the parameter-selected GCs with highlighted the isodensity level we finally adopted to obtain our final catalog of GC candidates (blue contours in the panel), containing a total of 268 candidates [see also 99]. The final list of matched and selected GCs is reported in Table 5. The final GCs catalog still contains unresolved contaminating sources matching with the properties of the GCs population we are interested in. Nevertheless, thanks to the large area covered by our images, and assuming that any population of contaminants is basically uniform over the inspected area, the GCs in the region will be analysed using background subtraction methods (Sect. 6.1).
6 Results: The intra-group diffuse light in the LEO I pair NGC 3379-NGC 3384
In this section we present the main properties of the IGL in the LEO I pair and the connection with the GCs population in the group, based on the deep optical images presented in this work. In addition, the photometric is compared with the kinematic transition radius found by [1] by using PNe. The distribution of the diffuse intra-group light in the LEO I pair NGC 3379-NGC 3384, derived in the band, is shown in Fig. 7. As described in Sec. 5.4, this comes from the sky-subtracted image in the band, where the brightest regions of the group members have been modelled and subtracted off. Residuals show the contribution of the stellar envelopes around the two brightest galaxies, which is symmetrical distributed around them, plus the diffuse light into the intra-group space. Here, two very faint streams are detected, emerging from the BGG. One extends to the South, towards the other bright group member of the LEO I group, M96, and the second one is protruding to the North-West, towards another bright member of the LEO I group, NGC 3338 (see Fig. 7). We cannot map the whole extension of this second stream since it partly overlaps with the residuals from the subtraction of the bright star located in this area (see Sec. 5.1). To estimate the integrated magnitude of the IGL component in both and bands, we have used the residual image shown in Fig. 7, where all the foreground and background sources are accurately masked. From this the residual image, using the IRAF task PHOT, we estimated the integrated the flux within ( 20 arcmin). The extinction-corrected integrated magnitude is = mag and = mag, in the and bands, respectively. These values correspond to the integrated magnitudes of the stellar envelope plus the IGL, which has an average color of mag. We then obtained the total luminosity of and in the and bands, respectively. The total luminosity of the pair () is given by the contribution of the total luminosity of NGC 3379 (= ), out to its transition radius, the total luminosity of NGC 3384 () and the total luminosity for the galaxy outskirts, i.e. stellar envelope plus the IGL (), derived above. This is and in the and bands, respectively. The fraction of IGL with respect to total luminosity of the pair is both in the and bands. Since the total luminosity of the BGG is in the band and in the band, the IGL fraction with respect to the BGG is in both the and bands. The IGL fraction of 17 we obtained in the pair is significantly larger than previous estimate for the LEO I group given by Watkins et al. [21]. Authors suggested that the amount of diffuse light they found for the whole LEO I group (including also the two bright galaxies M96 and M95) is negligible (0.01 ) with respect to the total luminosity of the group. The main difference between the IGL fraction provided in this work and that from Watkins et al. [21] is due to a different approach adopted for the IGL estimate. In detail, Watkins et al. [21] did not perform a photometric decomposition of the observed profile of NGC3379, modelling the whole light distribution of the galaxy, including the outer stellar envelope out to 45 kpc. Therefore, the residual image should include only the fraction of IGL outside the modelled radii. Conversely, as addressed in Sec. 5, we have estimated the total amount of the diffuse stellar envelope plus the IGL (i.e. the light beyond the , obtained from the 1D decomposition) with respect to the total brightness of the pair NGC 3379-NGC 3384, and not with respect to the total luminosity of the Leo I group. This approach, widely used in the literature (see references in Sec. 5) is motivated by the fact that, based on the photometry alone, the contribution to the light of the IGL cannot be separated from the light in the stellar envelope, since the two components are completely merged in the galaxy outskirts. Such a kind of separation is possible using the kinematics of discrete tracers, as done by [1], which found indeed a lower faction for the unbounded component of diffuse light of . Therefore, a lower amount of unbound intra-group diffuse light in the LEO I group could be reliable. In addition, the average surface brightness profile of NGC 3379 from Watkins et al. [21] (see left panel of Fig. 6 in Watkins et al. [21], for comparison) maps the outermost regions of the galaxy out to 14 arcmin in band and down to mag. In this work (see top left panel of Fig. 3), we are able to map the surface photometry out to 18.5 arcmin, and down to mag, which corresponds to mag [113]. Therefore, we are able to integrate the diffuse light contribution over a larger area and mag deeper.
6.1 IGL versus GCs distribution: intra-group baryons
Figure 8 shows the density distribution of the GCs, using the GCs catalog derived in Sec 5.5, obtained with a kernel density estimator666We used the KDEpy python package, which implements several kernel density estimators. In particular we used a Gaussian kernel with a deg. For the package used in this work see https://seaborn.pydata.org/generated/seaborn.kdeplot.html. The overdensity of GCs candidates on the LEO I pair with respect to the background contamination reveals some surprising features. Firstly, we observe that the global GC population, with center on the pair of galaxies, stretches from North-East to South-West with an inclination that nearly matches with the line connecting NGC 3379 and NGC 3384 to the other bright galaxy in the group, (M 96) and, in the South-West side, overlaps with what seems to be a patch of IGL. Furthermore, nearly orthogonal to such direction, in the side opposite to the irregular NGC 3389, we find evidence of a GCs over-density stretching along a further possible IGL patch in the same direction. The presence of these two sub-structures has been verified using different isodensity contours, or independently matched color catalogs (e.g. using the , the and the ), and in all cases the presence of both features is confirmed, although with different numbers of GCs candidates and contaminants. In spite of the small number of GCs expected in the area, and the shallow band images available, the 1:1 correspondence of these features with the IGL patches and with the possible links to interactions with bright companion galaxies in the field (M 96 and NGC 3338), would actually support them as real features rather than artifacts due to size-of-the-sample effects. We also inspected the color-distribution of our GCs catalog. Although we expect a large contamination, the presence of relatively large portions of sky far from the target galaxies, and with no obvious GCs overdensity related to the LEO I pair, allowed us to characterize the color distribution of background regions (i.e. of most likely non-GCs sources). Hence, we derived the color distribution of the sources on the two galaxies within arcmin and, after normalizing to the area, subtracted the color-density distributions on and off the galaxies. The top panel of Figure 8 shows the color density distribution over NGC 3379777To avoid the contamination of GCs from the bright companion, NGC 3384, we only considered the area on NGC 3379 within a circle centered on the photometric barycenter of two galaxies, extending on the half side of NGC 3379.. The background subtracted color distribution is shown in the botton panel of Figure 8. The distribution appears clearly multi-modal, with two dominant peaks at 1.8 mag and =2.1 mag, with width of and , respectively. The presence of such bi-modal distribution is indeed not unexpected [114]. We find also a possible third color peak, at mag with a , to whom no reference exist in the literature to best of our knowledge. The three peaks are also consistently found in the . Although the latter peak could possibly be a background artefact, by inspecting the positions of the GCs we find a number of red GCs lies close to the galaxy core, where the more metal-rich population of GCs would indeed be expected [115, 116, 117]. Moreover, five of the red core-GCs, out of ten, belong to the master catalog. In summary, although the field of the LEO I pair is relatively close and its GCs population has already been targeted by several other studies, the availability of the large area high-quality VST images allowed us to identify several GCs system properties previously unknown. Further spectroscopic follow-ups would be of great interest to confirm the existence of a direct link between the new features and the other galaxies in the region.
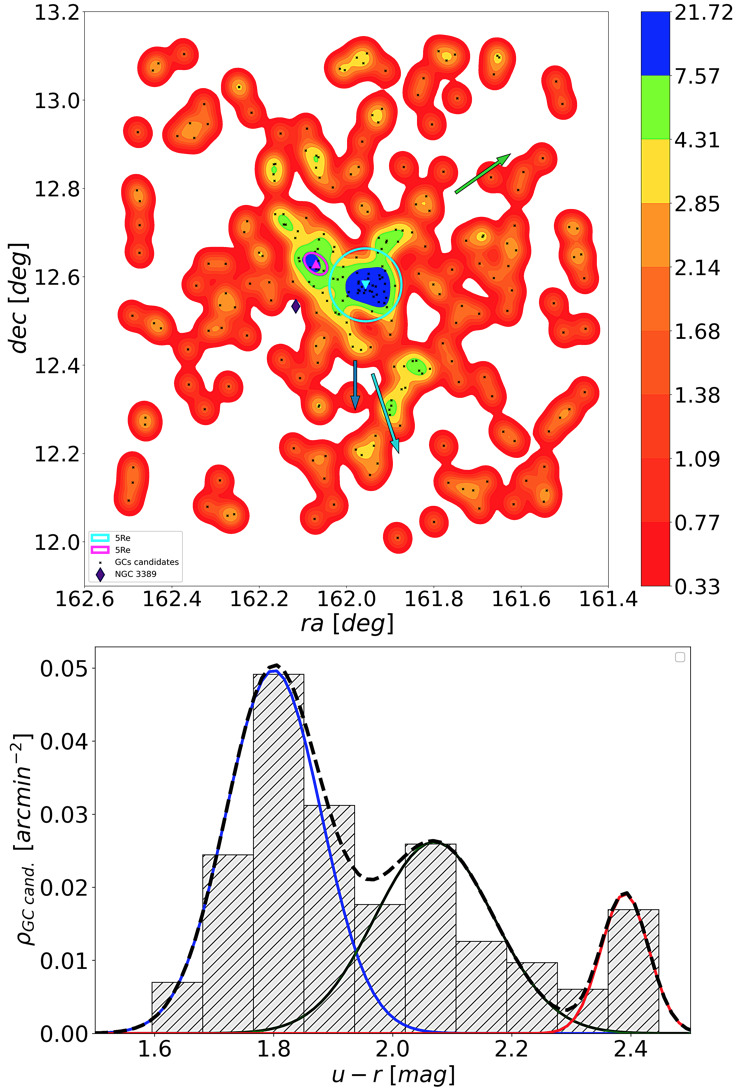
. Lower panel: color density distribution (corrected for background contamination, see text) over NGC 3379. The position of the blue, ”green” and red GCs, as derived with GMM, are shown with blue, green and red (solid line) gaussians, respectively, together with the combined fit to the entire population (black dashed line).
7 Discussion and Conclusions
In this work we have presented new multi-band () deep imaging data for the LEO I pair of galaxies, as part of the VEGAS project. Thanks to the large covered area (3.9 deg2 around the core of the pair) and the long integration time, we map the light distribution down to mag/arcsec2 and out to 63 kpc from the BGG NGC 3379, and we provided a census of the GCs in this system. The main goal of this work was to derive the amount of IGL and its color, which are fundamental indicators of the formation history of the group.
The main results of this work are summarised below.
-
•
The new map of diffuse intra-group light extends out to 63 kpc and presents two very faint ( mag/arcsec2) streams protruding from NGC 3379 and elongated toward North-West and South.
-
•
The fraction of the diffuse light, coming from the stellar envelope plus the IGL, is in both and bands, with an average color of mag.
-
•
The GCs population stretches both from North-East to South-West and from North-West to South of the pair, in the last case overlapping with the streams of IGL.
-
•
The color distribution of the GCs appears clearly multi-modal, with two dominant peaks at (u-r)=1.8 mag and 2.1 mag, respectively.
The IGL fraction we derived is consistent with estimates already present in other observational works derived for groups and clusters of galaxies, which ranges between and . This is evident from Fig. 9 (left panel), where we plot the fraction of diffuse light as a function of the virial mass () of the environment, from several observational studies. The virial mass and virial radius of LEO I group, centered on NGC 3379, are taken from Karachentsev et al. [118] (= 1.26 x M⊙, = 467 kpc). Since our field covers 0.53 , we scaled the virial mass according to this radius (=1.9 x M⊙), used to derive the for the LEO I pair. As already pointed out by Ragusa et al. [45], given the large scatter, Fig. 9 further suggests the absence of any trend between the fraction of diffuse light and . This result is consistent with theoretical predictions from Sommer-Larsen [40], Monaco et al. [41], Henriques and Thomas [43], Rudick et al. [29], Contini et al. [11], which provide an estimate for the ICL fraction ranging from 20% to 40% for any value of . Conversely, an increasing value of the ICL fraction with the virial mass is predicted by several other theoretical studies, also based on simulations [26, 38, 25, 15]. Based on the distribution of PNe in the halo of NGC 3379, Hartke et al. [1] estimated a 3.8 as lower limit for the diffuse light in this group. Authors found that the PNe profile flattens at about 250 arcsec from the galaxy centre and it is well approximated by an exponential profile with a scale radius of arcsec. They suggested that such an excess of PNe can maps an additional diffuse light component in the outskirts of NGC 3379, since it differs from the halo of the galaxy for its distinct -parameter value (which is the luminosity-specific PNe number) and spatial density distribution. The transition radius of 250 arcsec, based on the PNe distribution is fully consistent with the transition radius of 250 arcsec, we derived from the multi-component fit to separate the brightest central part of the galaxy from its outskirts (i.e. stellar envelope plus IGL, see Sec. 5.4). Furthermore, the scale-length they derived for the exponential profile of the PNe distribution in the galaxy outskirts is fully consistent with arcsec we obtained from the photometric decomposition. The consistency between the photometric and kinematic tracers suggests that the estimate of the IGL fraction we derived in this work for the LEO I pair is robust. Moreover, in a recent study, Hartke et al. [2] present a new and extended kinematic survey of PNe around NGC 3379, inside an area of . They found three distinct kinematic regimes that are linked to different stellar population properties:
-
•
the innermost one, i.e. the ”rotating core”, extends up to 0.9 arcmin and corresponds to the stellar population formed in situ and metal rich. We identify this innermost component with the first Sérsic (red curve) presented in the left panel of Fig. 3, which also extends up to 1 arcmin;
-
•
the halo, from 0.9 arcmin to 7 arcmin, consisting of a mixture of intermediate-metallicity and metal-rich stars, formed in situ or through major merger events. The scales of this component are consistent with the second Sérsic (magenta curve) photometric component we fitted to reproduce the surface brightness profile of NGC 3379 (see Fig. 3);
-
•
the exponential envelope, beyond 7 arcmin, composed mostly of metal-poor stars, which traces the IGL component, which turns to be consistent with the exponential stellar envelope found from our three components model of NGC 3379 (see left panel of Fig. 3), for 7 arcmin.
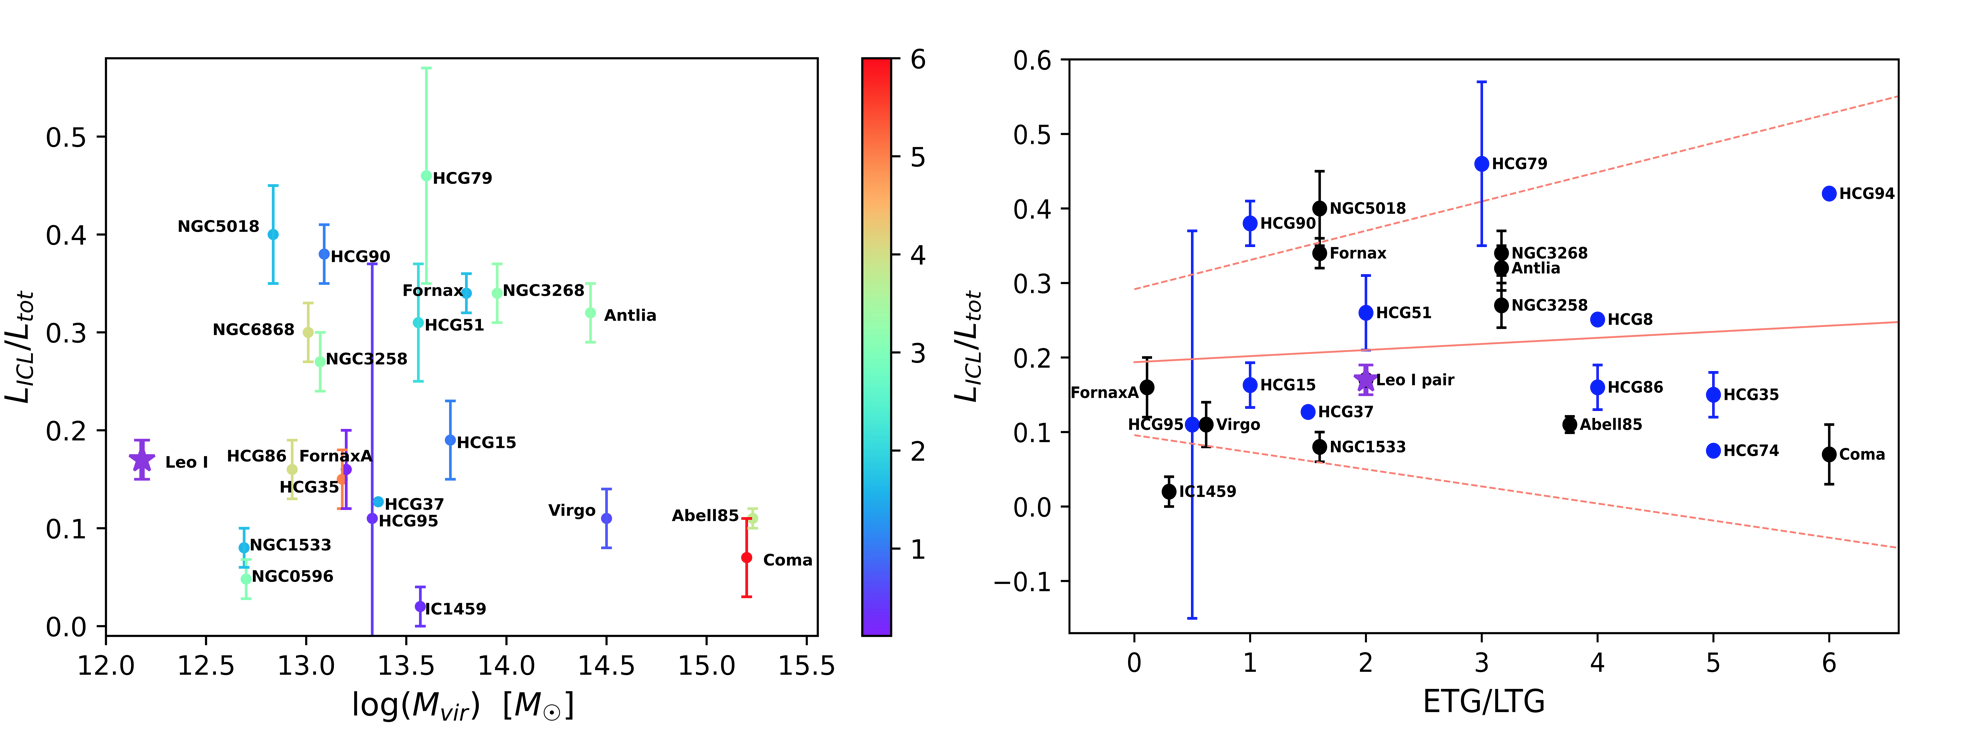
The average color mag for the IGL in LEO I pair is comparable with the color estimated for the diffuse light component in other groups and cluster of galaxies, in the nearby universe [ mag in the Fornax cluster, mag in HCG 86 62, 68, 45]. Moreover, such a value for the IGL color is also consistent with the range of colors predicted for the diffuse light by Contini et al. [18], where mag at z = 0. In the left panel of the Fig. 9 we have color-coded the fraction of diffuse light in groups and clusters based on their ETGs-to-LTGs ratio. In the right panel of the Fig. 9 we present the fraction of the diffuse light with respect to the total luminosity of the environment as a function of the ETGs-to-LTGs ratio. Since the LEO I pair is made up of only one elliptical galaxy and one S0 galaxy, . In this plot, the IGL fraction estimated for the LEO I pair is consistent with the amount of diffuse light expected and observed for other environments of comparable ETGs-to-LTGs ratio, as some Hickson Compact groups of galaxies and the NGC 1533 triplet. As already noticed in previous works [119, 45], a weak trend between the amount of diffuse light and the ETGs-to-LTGs ratio in groups and clusters of galaxies seems to be present. Since the more dynamically evolved groups have the largest ETGs-to-LTGs fraction and the higher probability of tidal interactions, such as stellar stripping and mergers, a larger amount of diffuse light is expected for environments dominated by early-type galaxies. In conclusion, the new deep photometry we have performed and presented in this work revealed an amount of IGL in the LEO I pair which is comparable with the diffuse light in other environments of similar virial mass. The estimated photometric transition between the inner and brighter region of the BGG and the diffuse envelope of stellar halo plus IGL is consistent with the kinematic one obtained for this target by Hartke et al. [1] and Hartke et al. [2]. The VEGAS deep images have also revealed the presence of two faint stellar streams that might be associated at the IGL distribution. The 2-dimensional distribution both of the GCs found in this work and PNe found by Hartke et al. [1] show an over-density overlapping with the two faint stellar streams. This would suggest that they are coherent structures of the intra-group baryons. Since they are elongated in the direction of the two nearby galaxies M96 and NGC 3338, they could be evidence of gravitational interactions with the pair. In particular, the stream in the direction of M96 could result from a head-on collision between LEO group members NGC 3384 and M96 [78].
Acknowledgments
This work is based on observations collected at the European Southern Observatory (ESO) La Silla Paranal Observatory within the VST Guaranteed Time Observations, Programme IDs: 096.B-0582(B), 097.B-0806(A), 090.B-0414(D). Authors acknowledge financial support from the VST project (P.I. P. Schipani). ALM acknowledges financial support from the INAF-OAC. We are grateful to M. Arnaboldi and J. Hartke for the enlightening discussions about the comparison between kinematics and photometry.
References
- Hartke et al. [2020] Hartke J, Arnaboldi M, Gerhard O, Coccato L, Pulsoni C, Freeman KC, et al. The halo of M 105 and its group environment as traced by planetary nebula populations. I. Wide-field photometric survey of planetary nebulae in the Leo I group. A&A 642 (2020) A46. 10.1051/0004-6361/202038009.
- Hartke et al. [2022] Hartke J, Arnaboldi M, Gerhard O, Coccato L, Merrifield M, Kuijken K, et al. The halo of M105 and its group environment as traced by planetary nebula populations: II. Using kinematics of single stars to unveil the presence of intragroup light around the Leo I galaxies NGC 3384 and M105. arXiv e-prints (2022) arXiv:2201.08710.
- De Lucia et al. [2006] De Lucia G, Springel V, White SDM, Croton D, Kauffmann G. The formation history of elliptical galaxies. MNRAS 366 (2006) 499–509. 10.1111/j.1365-2966.2005.09879.x.
- Bower and Balogh [2004] Bower RG, Balogh ML. The Difference Between Clusters and Groups: A Journey from Cluster Cores to Their Outskirts and Beyond. Mulchaey JS, Dressler A, Oemler A, editors, Clusters of Galaxies: Probes of Cosmological Structure and Galaxy Evolution (2004), 325.
- Miles et al. [2004] Miles TA, Raychaudhury S, Forbes DA, Goudfrooij P, Ponman TJ, Kozhurina-Platais V. The Group Evolution Multiwavelength Study (GEMS): bimodal luminosity functions in galaxy groups. MNRAS 355 (2004) 785–793. 10.1111/j.1365-2966.2004.08356.x.
- Robotham et al. [2011] Robotham ASG, Norberg P, Driver SP, Baldry IK, Bamford SP, Hopkins AM, et al. Galaxy and Mass Assembly (GAMA): the GAMA galaxy group catalogue (G3Cv1). MNRAS 416 (2011) 2640–2668. 10.1111/j.1365-2966.2011.19217.x.
- Eke et al. [2004] Eke VR, Baugh CM, Cole S, Frenk CS, Norberg P, Peacock JA, et al. Galaxy groups in the 2dFGRS: the group-finding algorithm and the 2PIGG catalogue. MNRAS 348 (2004) 866–878. 10.1111/j.1365-2966.2004.07408.x.
- Rudick et al. [2009] Rudick CS, Mihos JC, Frey LH, McBride CK. Tidal Streams of Intracluster Light. ApJ 699 (2009) 1518–1529. 10.1088/0004-637X/699/2/1518.
- Cui et al. [2013] Cui W, Murante G, Monaco P, Borgani S, Granato GL, Killedar M, et al. Characterizing diffused stellar light in simulated galaxy clusters. Monthly Notices of the Royal Astronomical Society 437 (2013) 816–830. 10.1093/mnras/stt1940.
- Mihos [2015] Mihos C. Intragroup and Intracluster Light. IAU General Assembly 22 (2015) 2247903.
- Contini et al. [2014] Contini E, De Lucia G, Villalobos Á, Borgani S. On the formation and physical properties of the intracluster light in hierarchical galaxy formation models. MNRAS 437 (2014) 3787–3802. 10.1093/mnras/stt2174.
- Montes and Trujillo [2014] Montes M, Trujillo I. Intracluster Light at the Frontier: A2744. ApJ 794 (2014) 137. 10.1088/0004-637X/794/2/137.
- Jiménez-Teja et al. [2019a] Jiménez-Teja Y, Dupke RA, Lopes de Oliveira R, Xavier HS, Coelho PRT, Chies-Santos AL, et al. J-PLUS: Analysis of the intracluster light in the Coma cluster. A&A 622 (2019a) A183. 10.1051/0004-6361/201833547.
- Montes and Trujillo [2018] Montes M, Trujillo I. Intracluster light at the Frontier - II. The Frontier Fields Clusters. MNRAS 474 (2018) 917–932. 10.1093/mnras/stx2847.
- Pillepich et al. [2018] Pillepich A, Nelson D, Hernquist L, Springel V, Pakmor R, Torrey P, et al. First results from the IllustrisTNG simulations: the stellar mass content of groups and clusters of galaxies. MNRAS 475 (2018) 648–675. 10.1093/mnras/stx3112.
- DeMaio et al. [2018] DeMaio T, Gonzalez AH, Zabludoff A, Zaritsky D, Connor T, Donahue M, et al. Lost but not forgotten: intracluster light in galaxy groups and clusters. MNRAS 474 (2018) 3009–3031. 10.1093/mnras/stx2946.
- Henden et al. [2019] [Dataset] Henden NA, Puchwein E, Sijacki D. The baryon content of groups and clusters of galaxies in the fable simulations (2019).
- Contini et al. [2019] Contini E, Yi SK, Kang X. Theoretical Predictions of Colors and Metallicity of the Intracluster Light. ApJ 871 (2019) 24. 10.3847/1538-4357/aaf41f.
- Montes and Trujillo [2019] Montes M, Trujillo I. Intracluster light: a luminous tracer for dark matter in clusters of galaxies. MNRAS 482 (2019) 2838–2851. 10.1093/mnras/sty2858.
- DeMaio et al. [2020] DeMaio T, Gonzalez AH, Zabludoff A, Zaritsky D, Aldering G, Brodwin M, et al. The growth of brightest cluster galaxies and intracluster light over the past 10 billion years. MNRAS 491 (2020) 3751–3759. 10.1093/mnras/stz3236.
- Watkins et al. [2014] Watkins AE, Mihos JC, Harding P, Feldmeier JJ. Searching for Diffuse Light in the M96 Galaxy Group. ApJ 791 (2014) 38. 10.1088/0004-637X/791/1/38.
- Adami et al. [2005] Adami C, Slezak E, Durret F, Conselice CJ, Cuillandre JC, Gallagher JS, et al. Large scale diffuse light in the Coma cluster: A multi-scale approach. A&A 429 (2005) 39–48. 10.1051/0004-6361:20041322.
- Cañas et al. [2020] Cañas R, Lagos CdP, Elahi PJ, Power C, Welker C, Dubois Y, et al. From stellar haloes to intracluster light: the physics of the Intra-Halo Stellar Component in cosmological hydrodynamical simulations. MNRAS 494 (2020) 4314–4333. 10.1093/mnras/staa1027.
- Merritt [1984] Merritt D. Relaxation and tidal stripping in rich clusters of galaxies. II. Evolution of the luminosity distribution. ApJ 276 (1984) 26–37. 10.1086/161590.
- Murante et al. [2007] Murante G, Giovalli M, Gerhard O, Arnaboldi M, Borgani S, Dolag K. The importance of mergers for the origin of intracluster stars in cosmological simulations of galaxy clusters. MNRAS 377 (2007) 2–16. 10.1111/j.1365-2966.2007.11568.x.
- Purcell et al. [2007] Purcell CW, Bullock JS, Zentner AR. Shredded Galaxies as the Source of Diffuse Intrahalo Light on Varying Scales. ApJ 666 (2007) 20–33. 10.1086/519787.
- Conroy et al. [2007] Conroy C, Wechsler RH, Kravtsov AV. The Hierarchical Build-Up of Massive Galaxies and the Intracluster Light since z = 1. ApJ 668 (2007) 826–838. 10.1086/521425.
- Puchwein et al. [2010] Puchwein E, Springel V, Sijacki D, Dolag K. Intracluster stars in simulations with active galactic nucleus feedback. MNRAS 406 (2010) 936–951. 10.1111/j.1365-2966.2010.16786.x.
- Rudick et al. [2011] Rudick CS, Mihos JC, McBride CK. The Quantity of Intracluster Light: Comparing Theoretical and Observational Measurement Techniques using Simulated Clusters. ApJ 732 (2011) 48–66. 10.1088/0004-637X/732/1/48.
- Cooper et al. [2015] Cooper AP, Parry OH, Lowing B, Cole S, Frenk C. Formation of in situ stellar haloes in Milky Way-mass galaxies. MNRAS 454 (2015) 3185–3199. 10.1093/mnras/stv2057.
- Montes [2019a] Montes M. The intracluster light and its role in galaxy evolution in clusters. arXiv e-prints (2019a) arXiv:1912.01616.
- Lin and Mohr [2004a] Lin YT, Mohr JJ. K-band Properties of Galaxy Clusters and Groups: Brightest Cluster Galaxies and Intracluster Light. ApJ 617 (2004a) 879–895. 10.1086/425412.
- Arnaboldi and Gerhard [2010] Arnaboldi M, Gerhard O. JD2 - Diffuse Light in Galaxy Clusters. Highlights of Astronomy 15 (2010) 97–110. 10.1017/S174392131000846X.
- Contini and Gu [2020] Contini E, Gu Q. On the Mass Distribution of the Intracluster Light in Galaxy Groups and Clusters. ApJ 901 (2020) 128. 10.3847/1538-4357/abb1aa.
- Buote et al. [2016] Buote DA, Su Y, Gastaldello F, Brighenti F. The Entire Virial Radius of the Fossil Cluster RXJ 1159 + 5531. II. Dark Matter and Baryon Fraction. ApJ 826 (2016) 146. 10.3847/0004-637X/826/2/146.
- Montes [2019b] Montes M. The intracluster light and its role in galaxy evolution in clusters. arXiv e-prints (2019b) arXiv:1912.01616.
- Contini [2021] Contini E. On the Origin and Evolution of the Intra-Cluster Light: A Brief Review of the Most Recent Developments. Galaxies 9 (2021) 60. 10.3390/galaxies9030060.
- Lin and Mohr [2004b] Lin YT, Mohr JJ. K-band Properties of Galaxy Clusters and Groups: Brightest Cluster Galaxies and Intracluster Light. ApJ 617 (2004b) 879–895. 10.1086/425412.
- Henden et al. [2019] Henden NA, Puchwein E, Sijacki D. The redshift evolution of X-ray and Sunyaev-Zel’dovich scaling relations in the FABLE simulations. MNRAS 489 (2019) 2439–2470. 10.1093/mnras/stz2301.
- Sommer-Larsen [2006] Sommer-Larsen J. Properties of intra-group stars and galaxies in galaxy groups: ‘normal’ versus ‘fossil’ groups. MNRAS 369 (2006) 958–968. 10.1111/j.1365-2966.2006.10352.x.
- Monaco et al. [2006] Monaco P, Murante G, Borgani S, Fontanot F. Diffuse Stellar Component in Galaxy Clusters and the Evolution of the Most Massive Galaxies at z¡~1. ApJl 652 (2006) L89–L92. 10.1086/510236.
- Dolag et al. [2010] Dolag K, Murante G, Borgani S. Dynamical difference between the cD galaxy and the diffuse, stellar component in simulated galaxy clusters. MNRAS 405 (2010) 1544–1559. 10.1111/j.1365-2966.2010.16583.x.
- Henriques and Thomas [2010] Henriques BMB, Thomas PA. Tidal disruption of satellite galaxies in a semi-analytic model of galaxy formation. MNRAS 403 (2010) 768–779. 10.1111/j.1365-2966.2009.16151.x.
- Sampaio-Santos et al. [2021] Sampaio-Santos H, Zhang Y, Ogando RLC, Shin T, Golden-Marx JB, Yanny B, et al. Is diffuse intracluster light a good tracer of the galaxy cluster matter distribution? MNRAS 501 (2021) 1300–1315. 10.1093/mnras/staa3680.
- Ragusa et al. [2021] Ragusa R, Spavone M, Iodice E, Brough S, Raj MA, Paolillo M, et al. VEGAS: A VST Early-type GAlaxy Survey. VI. Diffuse light in HCG 86 as seen from the ultra-deep VEGAS images. A&A 651 (2021) A39. 10.1051/0004-6361/202039921.
- Jiménez-Teja et al. [2019b] Jiménez-Teja Y, Dupke RA, Lopes de Oliveira R, Xavier HS, Coelho PRT, Chies-Santos AL, et al. J-PLUS: Analysis of the intracluster light in the Coma cluster. A&A 622 (2019b) A183. 10.1051/0004-6361/201833547.
- Montes et al. [2021] Montes M, Brough S, Owers MS, Santucci G. The buildup of the intracluster light of Abell 85 as seen by Subaru’s Hyper Suprime-Cam. arXiv e-prints (2021) arXiv:2101.08290.
- Martel et al. [2012] Martel H, Barai P, Brito W. The Fate of Dwarf Galaxies in Clusters and the Origin of Intracluster Stars. II. Cosmological Simulations. ApJ 757 (2012) 48. 10.1088/0004-637X/757/1/48.
- Ferrarese et al. [2012] Ferrarese L, Côté P, Cuillandre JC, Gwyn SDJ, Peng EW, MacArthur LA, et al. The Next Generation Virgo Cluster Survey (NGVS). I. Introduction to the Survey. ApJs 200 (2012) 4. 10.1088/0067-0049/200/1/4.
- van Dokkum et al. [2014] van Dokkum PG, Abraham R, Merritt A. First Results from the Dragonfly Telephoto Array: The Apparent Lack of a Stellar Halo in the Massive Spiral Galaxy M101. ApJl 782 (2014) L24. 10.1088/2041-8205/782/2/L24.
- Duc et al. [2015] Duc PA, Cuillandre JC, Karabal E, Cappellari M, Alatalo K, Blitz L, et al. The ATLAS3D project - XXIX. The new look of early-type galaxies and surrounding fields disclosed by extremely deep optical images. MNRAS 446 (2015) 120–143. 10.1093/mnras/stu2019.
- Fliri and Trujillo [2016] Fliri J, Trujillo I. The IAC Stripe 82 Legacy Project: a wide-area survey for faint surface brightness astronomy. MNRAS 456 (2016) 1359–1373. 10.1093/mnras/stv2686.
- Muñoz et al. [2015] Muñoz RP, Eigenthaler P, Puzia TH, Taylor MA, Ordenes-Briceño Y, Alamo-Martínez K, et al. Unveiling a Rich System of Faint Dwarf Galaxies in the Next Generation Fornax Survey. ApJl 813 (2015) L15. 10.1088/2041-8205/813/1/L15.
- Merritt et al. [2016] Merritt A, van Dokkum P, Danieli S, Abraham R, Zhang J, Karachentsev ID, et al. The Dragonfly Nearby Galaxies Survey. II. Ultra-Diffuse Galaxies near the Elliptical Galaxy NGC 5485. ApJ 833 (2016) 168. 10.3847/1538-4357/833/2/168.
- Watkins et al. [2016] Watkins AE, Mihos JC, Harding P. The Red and Featureless Outer Disks of Nearby Spiral Galaxies. ApJ 826 (2016) 59. 10.3847/0004-637X/826/1/59.
- Trujillo and Fliri [2016] Trujillo I, Fliri J. Beyond 31 mag arcsec-2: The Frontier of Low Surface Brightness Imaging with the Largest Optical Telescopes. ApJ 823 (2016) 123. 10.3847/0004-637X/823/2/123.
- Mihos et al. [2017] Mihos JC, Harding P, Feldmeier JJ, Rudick C, Janowiecki S, Morrison H, et al. The Burrell Schmidt Deep Virgo Survey: Tidal Debris, Galaxy Halos, and Diffuse Intracluster Light in the Virgo Cluster. ApJ 834 (2017) 16. 10.3847/1538-4357/834/1/16.
- Huang et al. [2018] Huang S, Leauthaud A, Greene J, Bundy K, Lin YT, Tanaka M, et al. A detection of the environmental dependence of the sizes and stellar haloes of massive central galaxies. MNRAS 480 (2018) 521–537. 10.1093/mnras/sty1136.
- Zhang et al. [2019] Zhang Y, Yanny B, Palmese A, Gruen D, To C, Rykoff ES, et al. Dark Energy Survey Year 1 Results: Detection of Intracluster Light at Redshift 0.25. ApJ 874 (2019) 165. 10.3847/1538-4357/ab0dfd.
- Martinez-Delgado et al. [2021] Martinez-Delgado D, Cooper AP, Roman J, Pillepich A, Erkal D, Pearson S, et al. Hidden Depths in the Local Universe: the Stellar Stream Legacy Survey. arXiv e-prints (2021) arXiv:2104.06071.
- Capaccioli et al. [2015] Capaccioli M, Spavone M, Grado A, Iodice E, Limatola L, Napolitano NR, et al. VEGAS: A VST Early-type GAlaxy Survey. I. Presentation, wide-field surface photometry, and substructures in NGC 4472. A&A 581 (2015) A10. 10.1051/0004-6361/201526252.
- Iodice et al. [2017] Iodice E, Spavone M, Cantiello M, D’Abrusco R, Capaccioli M, Hilker M, et al. Intracluster Patches of Baryons in the Core of the Fornax Cluster. ApJ 851 (2017) 75. 10.3847/1538-4357/aa9b30.
- Spavone et al. [2018] Spavone M, Iodice E, Capaccioli M, Bettoni D, Rampazzo R, Brosch N, et al. VEGAS: A VST Early-type Galaxy Survey. III. Mapping the Galaxy Structure, Interactions, and Intragroup Light in the NGC 5018 Group. ApJ 864 (2018) 149. 10.3847/1538-4357/aad6e9.
- Cattapan et al. [2019] Cattapan A, Spavone M, Iodice E, Rampazzo R, Ciroi S, Ryan-Weber E, et al. VEGAS: A VST Early-type GAlaxy Survey. IV. NGC 1533, IC 2038, and IC 2039: An Interacting Triplet in the Dorado Group. ApJ 874 (2019) 130. 10.3847/1538-4357/ab0b44.
- Iodice et al. [2019a] Iodice E, Spavone M, Capaccioli M, Peletier RF, van de Ven G, Napolitano NR, et al. The Fornax Deep Survey with the VST. V. Exploring the faintest regions of the bright early-type galaxies inside the virial radius. A&A 623 (2019a) A1. 10.1051/0004-6361/201833741.
- Iodice et al. [2020] Iodice E, Spavone M, Cattapan A, Bannikova E, Forbes DA, Rampazzo R, et al. VEGAS: a VST Early-type GAlaxy Survey. V. IC 1459 group: Mass assembly history in low-density environments. A&A 635 (2020) A3. 10.1051/0004-6361/201936435.
- Spavone et al. [2020] Spavone M, Iodice E, van de Ven G, Falcón-Barroso J, Raj MA, Hilker M, et al. The Fornax Deep Survey with VST. VIII. Connecting the accretion history with the cluster density. A&A 639 (2020) A14. 10.1051/0004-6361/202038015.
- Raj et al. [2020] Raj MA, Iodice E, Napolitano NR, Hilker M, Spavone M, Peletier RF, et al. The Fornax Deep Survey with VST. X. The assembly history of the bright galaxies and intra-group light in the Fornax A subgroup. A&A 640 (2020) A137. 10.1051/0004-6361/202038043.
- de Vaucouleurs [1975] de Vaucouleurs G. Nearby Groups of Galaxies (1975), 557.
- Müller et al. [2018] Müller O, Jerjen H, Binggeli B. The Leo-I group: new dwarf galaxy and ultra diffuse galaxy candidates. A&A 615 (2018) A105. 10.1051/0004-6361/201832897.
- Thilker et al. [2009] Thilker DA, Donovan J, Schiminovich D, Bianchi L, Boissier S, Gil de Paz A, et al. Massive star formation within the Leo ‘primordial’ ring. Nature 457 (2009) 990–993. 10.1038/nature07780.
- Schneider et al. [1986] Schneider SE, Salpeter EE, Terzian Y. High-resolution observations of the intergalactic HI cloud in the M 96 group. AJ 91 (1986) 13–22. 10.1086/113975.
- Schneider [1985] Schneider S. Neutral hydrogen in the M 96 group : evidence for a giant intergalactic ring. ApJl 288 (1985) L33–L35. 10.1086/184416.
- Pierce and Tully [1985] Pierce MJ, Tully RB. The extragalactic H I cloud in Leo. AJ 90 (1985) 450–453. 10.1086/113750.
- Donahue et al. [1995] Donahue M, Aldering G, Stocke JT. Low Surface Brightness H alpha Observations of Local Intergalactic Hydrogen Clouds. ApJl 450 (1995) L45. 10.1086/316771.
- Sil’chenko et al. [2003] Sil’chenko OK, Moiseev AV, Afanasiev VL, Chavushyan VH, Valdes JR. The Leo I Cloud: Secular Nuclear Evolution of NGC 3379, NGC 3384, and NGC 3368? ApJ 591 (2003) 185–203. 10.1086/375315.
- Corbelli et al. [2021] Corbelli E, Cresci G, Mannucci F, Thilker D, Venturi G. Heavy Elements Unveil the Non-primordial Origin of the Giant H I Ring in Leo. ApJl 908 (2021) L39. 10.3847/2041-8213/abdf64.
- Michel-Dansac et al. [2010] Michel-Dansac L, Duc PA, Bournaud F, Cuillandre JC, Emsellem E, Oosterloo T, et al. A Collisional Origin for the Leo Ring. ApJl 717 (2010) L143–L148. 10.1088/2041-8205/717/2/L143.
- Rudick et al. [2006] Rudick CS, Mihos JC, McBride C. The Formation and Evolution of Intracluster Light. ApJ 648 (2006) 936–946. 10.1086/506176.
- Castro-Rodríguez et al. [2003] Castro-Rodríguez N, Aguerri JAL, Arnaboldi M, Gerhard O, Freeman KC, Napolitano NR, et al. Narrow band survey for intragroup light in the Leo HI cloud. Constraints on the galaxy background contamination in imaging surveys for intracluster planetary nebulae. A&A 405 (2003) 803–812. 10.1051/0004-6361:20030588.
- Harris et al. [2007] Harris WE, Harris GLH, Layden AC, Wehner EMH. The Leo Elliptical NGC 3379: A Metal-Poor Halo Emerges. ApJ 666 (2007) 903–918. 10.1086/520799.
- Lee and Jang [2016] Lee MG, Jang IS. Dual Stellar Halos in the Standard Elliptical Galaxy M105 and Formation of Massive Early-type Galaxies. ApJ 822 (2016) 70. 10.3847/0004-637X/822/2/70.
- Schipani et al. [2012] Schipani P, Noethe L, Arcidiacono C, Argomedo J, Dall’Ora M, D’Orsi S, et al. Removing static aberrations from the active optics system of a wide-field telescope. Journal of the Optical Society of America A 29 (2012) 1359. 10.1364/JOSAA.29.001359.
- Iodice et al. [2021] Iodice E, Spavone M, Raj MA, Capaccioli M, Cantiello M, VEGAS science team. The VST Early-type GAlaxy Survey (VEGAS) data release 1. arXiv e-prints (2021) arXiv:2102.04950.
- Iodice et al. [2016] Iodice E, Capaccioli M, Grado A, Limatola L, Spavone M, Napolitano NR, et al. The Fornax Deep Survey with VST. I. The Extended and Diffuse Stellar Halo of NGC 1399 out to 192 kpc. ApJ 820 (2016) 42. 10.3847/0004-637X/820/1/42.
- Spavone et al. [2017a] Spavone M, Capaccioli M, Napolitano NR, Iodice E, Grado A, Limatola L, et al. Unveiling the Nature of Giant Ellipticals and their Stellar Halos with the VST. The Messenger 170 (2017a) 34–39. 10.18727/0722-6691/5052.
- Iodice et al. [2019b] Iodice E, Sarzi M, Bittner A, Coccato L, Costantin L, Corsini EM, et al. The Fornax3D project: Tracing the assembly history of the cluster from the kinematic and line-strength maps. A&A 627 (2019b) A136. 10.1051/0004-6361/201935721.
- Grado et al. [2012] Grado A, Capaccioli M, Limatola L, Getman F. VST processing facility: first astronomical applications. Memorie della Societa Astronomica Italiana Supplementi 19 (2012) 362.
- Schlafly and Finkbeiner [2011] Schlafly EF, Finkbeiner DP. Measuring reddening with sloan digital sky survey stellar spectra and recalibrating sfd. The Astrophysical Journal 737 (2011) 103. 10.1088/0004-637x/737/2/103.
- Jedrzejewski [1987] Jedrzejewski RI. CCD surface photometry of elliptical galaxies - I. Observations, reduction and results. MNRAS 226 (1987) 747–768. 10.1093/mnras/226.4.747.
- Capaccioli et al. [1990] Capaccioli M, Held EV, Lorenz H, Vietri M. Photographic and CCD Surface Photometry of the Standard Elliptical Galaxy NGC 3379. AJ 99 (1990) 1813. 10.1086/115459.
- Seigar et al. [2007] Seigar MS, Graham AW, Jerjen H. Intracluster light and the extended stellar envelopes of cD galaxies: an analytical description. MNRAS 378 (2007) 1575–1588. 10.1111/j.1365-2966.2007.11899.x.
- Donzelli et al. [2011] Donzelli CJ, Muriel H, Madrid JP. The Luminosity Profiles of Brightest Cluster Galaxies. The Astrophysical Journal Supplement Series 195 (2011) 15. 10.1088/0067-0049/195/2/15.
- Arnaboldi et al. [2012] Arnaboldi M, Ventimiglia G, Iodice E, Gerhard O, Coccato L. A tale of two tails and an off-centered envelope: diffuse light around the cD galaxy NGC 3311 in the Hydra I cluster. A&A 545 (2012) A37. 10.1051/0004-6361/201116752.
- Huang et al. [2013] Huang S, Ho LC, Peng CY, Li ZY, Barth AJ. The Carnegie-Irvine Galaxy Survey. III. The Three-component Structure of Nearby Elliptical Galaxies. ApJ 766 (2013) 47. 10.1088/0004-637X/766/1/47.
- Cooper et al. [2013] Cooper AP, D’Souza R, Kauffmann G, Wang J, Boylan-Kolchin M, Guo Q, et al. Galactic accretion and the outer structure of galaxies in the CDM model. MNRAS 434 (2013) 3348–3367. 10.1093/mnras/stt1245.
- Spavone et al. [2017b] Spavone M, Capaccioli M, Napolitano NR, Iodice E, Grado A, Limatola L, et al. VEGAS: A VST Early-type GAlaxy Survey. II. Photometric study of giant ellipticals and their stellar halos. A&A 603 (2017b) A38. 10.1051/0004-6361/201629111.
- Harris [2001] Harris WE. Globular cluster systems. Saas-Fee Advanced Course 28: Star Clusters (2001).
- Cantiello et al. [2020] Cantiello M, Venhola A, Grado A, Paolillo M, D’Abrusco R, Raimondo G, et al. The Fornax Deep Survey with VST. IX. Catalog of sources in the FDS area with an example study for globular clusters and background galaxies. A&A 639 (2020) A136. 10.1051/0004-6361/202038137.
- Cantiello et al. [2015] Cantiello M, Capaccioli M, Napolitano N, Grado A, Limatola L, Paolillo M, et al. VEGAS-SSS. A VST early-type galaxy survey: analysis of small stellar systems. Testing the methodology on the globular cluster system in NGC 3115. A&A 576 (2015) A14. 10.1051/0004-6361/201425165.
- Cantiello et al. [2018] Cantiello M, D’Abrusco R, Spavone M, Paolillo M, Capaccioli M, Limatola L, et al. VEGAS-SSS. II. Comparing the globular cluster systems in NGC 3115 and NGC 1399 using VEGAS and FDS survey data. The quest for a common genetic heritage of globular cluster systems. A&A 611 (2018) A93. 10.1051/0004-6361/201730649.
- Bertin and Arnouts [1996] Bertin E, Arnouts S. SExtractor: Software for source extraction. A&As 117 (1996) 393–404. 10.1051/aas:1996164.
- Tonry and Schneider [1988] Tonry J, Schneider DP. A New Technique for Measuring Extragalactic Distances. AJ 96 (1988) 807. 10.1086/114847.
- Cantiello et al. [2007a] Cantiello M, Raimondo G, Blakeslee JP, Brocato E, Capaccioli M. Detection of Surface Brightness Fluctuations in Elliptical Galaxies Imaged with the Advanced Camera for Surveys: B- and I-Band Measurements. ApJ 662 (2007a) 940–951. 10.1086/517984.
- Peng et al. [2011] Peng EW, Ferguson HC, Goudfrooij P, Hammer D, Lucey JR, Marzke RO, et al. The HST/ACS Coma Cluster Survey. IV. Intergalactic Globular Clusters and the Massive Globular Cluster System at the Core of the Coma Galaxy Cluster. ApJ 730 (2011) 23. 10.1088/0004-637X/730/1/23.
- Puzia et al. [2004] Puzia TH, Kissler-Patig M, Thomas D, Maraston C, Saglia RP, Bender R, et al. VLT spectroscopy of globular cluster systems. I. The photometric and spectroscopic data set. A&A 415 (2004) 123–143. 10.1051/0004-6361:20031448.
- Bergond et al. [2006] Bergond G, Zepf SE, Romanowsky AJ, Sharples RM, Rhode KL. Wide-field kinematics of globular clusters in the Leo I group. A&A 448 (2006) 155–164. 10.1051/0004-6361:20053697.
- Whitlock et al. [2003] Whitlock S, Forbes DA, Beasley MA. UBRI photometry of globular clusters in the Leo group galaxy NGC 3379. MNRAS 345 (2003) 949–959. 10.1046/j.1365-8711.2003.07046.x.
- Faifer et al. [2011] Faifer FR, Forte JC, Norris MA, Bridges T, Forbes DA, Zepf SE, et al. Gemini/GMOS imaging of globular cluster systems in five early-type galaxies*. MNRAS 416 (2011) 155–177. 10.1111/j.1365-2966.2011.19018.x.
- Brassington et al. [2008] Brassington NJ, Fabbiano G, Kim DW, Zezas A, Zepf S, Kundu A, et al. Deep Chandra Monitoring Observations of NGC 3379: Catalog of Source Properties. ApJs 179 (2008) 142–165. 10.1086/591527.
- Kundu et al. [2007] Kundu A, Maccarone TJ, Zepf SE. Probing the Formation of Low-Mass X-Ray Binaries in Globular Clusters and the Field. ApJ 662 (2007) 525–543. 10.1086/518021.
- Villegas et al. [2010] Villegas D, Jordán A, Peng EW, Blakeslee JP, Côté P, Ferrarese L, et al. The ACS Fornax Cluster Survey. VIII. The Luminosity Function of Globular Clusters in Virgo and Fornax Early-type Galaxies and Its Use as a Distance Indicator. ApJ 717 (2010) 603–616. 10.1088/0004-637X/717/2/603.
- Kostov and Bonev [2018] Kostov A, Bonev T. Transformation of Pan-STARRS1 gri to Stetson BVRI magnitudes. Photometry of small bodies observations. Bulgarian Astronomical Journal 28 (2018) 3.
- Larsen et al. [2001] Larsen SS, Brodie JP, Huchra JP, Forbes DA, Grillmair CJ. Properties of Globular Cluster Systems in Nearby Early-Type Galaxies. AJ 121 (2001) 2974–2998. 10.1086/321081.
- Kissler-Patig et al. [1997] Kissler-Patig M, Richtler T, Storm J, della Valle M. Halo and bulge/disk globular clusters in the S0 galaxy NGC 1380. A&A 327 (1997) 503–512.
- Cantiello et al. [2007b] Cantiello M, Blakeslee JP, Raimondo G. The Globular Cluster System in NGC 5866: Optical Observations from Hubble Space Telescope Advanced Camera for Surveys. ApJ 668 (2007b) 209–220. 10.1086/521218.
- Harris [2009] Harris WE. The Globular Cluster System in M87: A Wide-Field Study with CFHT/Megacam. ApJ 703 (2009) 939–950. 10.1088/0004-637X/703/1/939.
- Karachentsev et al. [2015] Karachentsev ID, Nasonova OG, Karachentseva VE. Large-scale structure and galaxy motions in the Leo/Cancer constellations. Astrophysical Bulletin 70 (2015) 1–15. 10.1134/S1990341315010010.
- Da Rocha et al. [2008] Da Rocha C, Ziegler BL, Mendes de Oliveira C. Intragroup diffuse light in compact groups of galaxies - II. HCG 15, 35 and 51. MNRAS 388 (2008) 1433–1443. 10.1111/j.1365-2966.2008.13500.x.
- Selim and Iqbal [2008] Selim I, Iqbal N. Stability of Hickson Groups of Galaxies. Turkish Journal of Physics 32 (2008) 133–137.
- Pildis et al. [1995] Pildis RA, Bregman JN, Schombert JM. Deep Optical Observations of Compact Groups of Galaxies. AJ 110 (1995) 1498. 10.1086/117623.
- Poliakov et al. [2021] Poliakov D, Mosenkov AV, Brosch N, Koriski S, Rich RM. Quantified diffuse light in compact groups of galaxies. MNRAS 503 (2021) 6059–6077. 10.1093/mnras/stab853.
- Brough et al. [2017] Brough S, van de Sande J, Owers MS, d’Eugenio F, Sharp R, Cortese L, et al. The SAMI Galaxy Survey: Mass as the Driver of the Kinematic Morphology-Density Relation in Clusters. ApJ 844 (2017) 59. 10.3847/1538-4357/aa7a11.
- Riess et al. [2018] Riess AG, Casertano S, Yuan W, Macri L, Anderson J, MacKenty JW, et al. New Parallaxes of Galactic Cepheids from Spatially Scanning the Hubble Space Telescope: Implications for the Hubble Constant. ApJ 855 (2018) 136. 10.3847/1538-4357/aaadb7.
Note. Column 1 report the name of the two LEO I pair members. In Col. 2 is given the morphological type. In Cols. 3 and 4 are listed the celestial coordinates of each group member. In Col. 5 is listed the heliocentric radial velocity, and in Col. 6 is reported the distances of the pair members. The distance for NGC 3384 was estimated using the relationship: D = VHe H , with = 73 Km s-1 Mpc-1 [124].
| Target | morphological type | R.A. | Decl. | Helio. radial velocity | D |
|---|---|---|---|---|---|
| J200 | J200 | km s-1 | Mpc | ||
| (1) | (2) | (3) | (4) | (5) | (6) |
| E1 | 10h 47mm 49.588 s | +12d 34m 53.85s | 911.07 | 10.23 0.08 | |
| SB0-(s) | 10h 48mm 16.886 s | +12d 37m 45.38s | 703.9 | 9.64 |
Note. Column 1 report the name of the two pair members. In Col. 2 is reported the total magnitude in the band. In Cols. 3 and 4 are listed the magnitude at the transition radius in and bands, while in Cols. 5 and 6 are given the effective radius in the band, in arcsec and kpc respectively. The average color is listed in Col. 7. Magnitudes and colors were corrected for Galactic extinction using the extinction coefficients provided by Schlafly and Finkbeiner [89].
| Galaxy | g-r | |||||
| [mag] | [mag] | [mag] | [arcsec] | [kpc] | [mag] | |
| (1) | (2) | (3) | (4) | (5) | (6) | (7) |
| 9.28 0.04 | 9.31 0.01 | 8.51 0.01 | 86 | 4.3 | 0.82 0.06 | |
| 10.42 0.01 | 22 | 1.1 | 0.76 0.02 |
Note. Columns 2, 3, 4, 5, 6, 7 report the effective surface brightness, effective radius and Sérsic index for the two inner component of each fit, in the g band, whereas columns 8 and 9 list the central surface brightness and scale length for the outer exponential component. Columns 9 and 10 give a transition radii, in arcsec and kpc scale respectively, derived from the 1D fit of the azimuthally averaged surface brightness profiles of NGC 3379 (see Sec. 5.4)
| Object | ||||||||||
|---|---|---|---|---|---|---|---|---|---|---|
| [mag/arcsec2] | [arcsec] | [mag/arcsec2] | [arcsec] | [mag/arcsec2] | [arcsec] | [arcsec] | [kpc] | |||
| (1) | (2) | (3) | (4) | (5) | (6) | (7) | (8) | (9) | (10) | (11) |
| 18.000.02 | 5.1 0.1 | 1.16 | 21.45 0.03 | 55.0 0.5 | 2.10 | 24.95 0.02 | 2601 | 252 | 12.6 | |
| 17.85 0.01 | 6.0 0.3 | 1.42 | 21.75 0.03 | 70 1 | 0.65 |
| Parameters | Min | Max |
|---|---|---|
| FWHM | 0.73 | 0.95 |
| C.I. | 0.45 | 0.57 |
| Elongation | 0.92 | 1.28 |
| Flux radius | 0.4 | 0.75 |
| (g-i) | 0.3 | |
| (u-r) | 0.5 | |
| 19 | 26 |
R.A. Dec. Elon. C.I. deg (J2000) deg (J2000) mag mag mag mag mag mag mag mag pixel pixel mag (1) (2) (3) (4) (5) (6) (7) (8) (9) (10) (11) (12) (13) (14) (15) 161.8827105 12.0089343 20.807 0.008 21.449 0.012 22.756 0.102 20.455 0.031 1.206 2.441 3.79 0.979 0.47 161.7994979 12.0450087 22.259 0.024 22.914 0.034 24.417 0.442 21.906 0.075 1.038 2.366 4.15 0.941 0.477 162.272812 12.0591517 21.201 0.009 21.857 0.013 22.852 0.094 20.934 0.03 1.034 2.669 3.76 0.927 0.481 161.6174692 12.0853106 21.631 0.012 22.205 0.015 23.569 0.171 21.294 0.033 1.099 2.532 3.69 0.952 0.48 161.5480706 12.0908925 19.197 0.002 19.774 0.002 20.887 0.016 18.913 0.005 1.074 2.839 3.92 0.859 0.502 161.5412847 12.1161331 20.89 0.006 21.499 0.008 22.845 0.078 20.563 0.017 1.061 2.657 4.05 0.906 0.508 161.7331405 12.1196303 19.755 0.002 20.251 0.002 21.381 0.022 19.437 0.008 1.04 2.799 3.86 0.868 0.492 161.7668362 12.1338537 20.501 0.004 21.001 0.005 22.237 0.048 20.117 0.013 1.068 2.856 4.12 0.744 0.517 162.4898132 12.1341857 21.529 0.014 22.141 0.018 23.315 0.155 21.293 0.04 1.146 2.878 4.18 0.925 0.502 161.6778305 12.1365518 21.673 0.01 22.173 0.013 23.36 0.116 21.273 0.032 1.081 2.67 3.66 0.879 0.474 . . . . . . . . . . . . . . . . . . . . . . . . . . . . . . . . . . . . . . . . . . . . . . . . . . . . . . . . . . . .
| R.A. | Dec. | Elon. | F.R. | FWHM | C.S. | C.I | Tp | Ts | Tx | |||||||||
| deg (J2000) | deg (J2000) | mag | mag | mag | mag | mag | mag | mag | mag | pixel | pixel | mag | ||||||
| (1) | (2) | (3) | (4) | (5) | (6) | (7) | (8) | (9) | (10) | (11) | (12) | (13) | (14) | (15) | (16) | (17) | (18) | |
| 161.903091 | 12.5899022 | 21.249 | 0.006 | 21.874 | 0.008 | 22.893 | 0.059 | 20.926 | 0.025 | 1.121 | 3.507 | 5.4 | 0.029 | 0.629 | 1 | 0 | 0 | |
| 161.98628 | 12.5574202 | 20.234 | 0.003 | 20.811 | 0.004 | 22.007 | 0.027 | 19.887 | 0.014 | 1.262 | 2.726 | 5.28 | 0.931 | 0.569 | 1 | 2 | 0 | |
| 162.055516 | 12.7069587 | 21.218 | 0.005 | 21.881 | 0.007 | 23.368 | 0.091 | 20.841 | 0.025 | 1.116 | 3.618 | 4.82 | 0.033 | 0.579 | 0 | 2 | 0 | |
| 161.973382 | 12.5818206 | 20.884 | 0.007 | 21.466 | 0.008 | 22.675 | 0.048 | 20.594 | 0.024 | 1.162 | 3.092 | 4.75 | 0.323 | 0.556 | 1 | 2 | 0 | |
| 161.94939 | 12.5773175 | 21.133 | 0.012 | 21.773 | 0.013 | 23.348 | 0.092 | 20.823 | 0.023 | 1.032 | 2.822 | 4.7 | 0.969 | 0.515 | 1 | 0 | 0 | |
| 162.002186 | 12.5464099 | 20.745 | 0.004 | 21.374 | 0.005 | 22.673 | 0.049 | 20.417 | 0.018 | 1.089 | 3.327 | 4.68 | 0.137 | 0.542 | 1 | 2 | 0 | |
| 161.913558 | 12.5406199 | 19.786 | 0.002 | 20.439 | 0.002 | 21.787 | 0.023 | 19.438 | 0.008 | 1.18 | 3.281 | 4.57 | 0.219 | 0.534 | 1 | 2 | 0 | |
| 162.057819 | 12.6206602 | 21.124 | 0.008 | 21.981 | 0.012 | 23.745 | 0.128 | 20.668 | 0.022 | 1.116 | 2.783 | 4.57 | 0.921 | 0.567 | 0 | 2 | 0 | |
| 162.065532 | 12.5984584 | 21.477 | 0.007 | 22.282 | 0.011 | 24.112 | 0.178 | 20.971 | 0.028 | 1.102 | 2.845 | 4.47 | 0.135 | 0.554 | 0 | 2 | 0 | |
| 161.918018 | 12.6234968 | 21.518 | 0.007 | 22.136 | 0.01 | 23.375 | 0.102 | 21.264 | 0.033 | 1.122 | 3.17 | 4.43 | 0.138 | 0.541 | 1 | 2 | 0 | |
| . | . | . | . | . | . | . | . | . | . | . | . | . | . | . | . | . | . | |
| . | . | . | . | . | . | . | . | . | . | . | . | . | . | . | . | . | . | |
| . | . | . | . | . | . | . | . | . | . | . | . | . | . | . | . | . | . | |
| . | . | . | . | . | . | . | . | . | . | . | . | . | . | . | . | . | . |