Sympathetic Quiet and Active Region Filament Eruptions
keywords:
Sun - flares: Sun - filament eruptions: Sun - magnetic fields1 Introduction
sect_Introduction
Solar filaments/prominences are well-known phenomenon in the solar atmosphere. They present a variety of cool and dense objects, ranging from long-lived quiescent filament/prominence to short-lived active region filament/prominence. Their nature is described in many studies (van Ballegooijen and Martens, 1989; Chae, 2001; Labrosse et al., 2010; Mackay et al., 2010; Schmieder, Démoulin, and Aulanier, 2013; Gibson, 2018). It is believed that they are supported in magnetic dips (Aulanier, DeVore, and Antiochos, 2002; Mackay et al., 2010; Gibson, 2018), observed on polarity inversion line (PIL).
When the balance between magnetic pressure and magnetic tension in the filaments becomes unstable by any kind of mechanism, they can erupt. Observations show that based on the relation between the filament mass and corresponding supporting magnetic structure filaments can erupt fully (Gopalswamy et al., 2003; Schrijver et al., 2008; Chandra et al., 2010) or partially (Gibson and Fan, 2006; Joshi et al., 2014; Cheng, Kliem, and Ding, 2018; Monga et al., 2021) and sometimes the eruption can be failed (e.g., Liu, Wang, and Alexander, 2009; Kumar et al., 2011; Joshi et al., 2013). The full or partial eruption are usually associated with the coronal mass ejections (CMEs), which later on become Interplanetary CME (ICME), responsible for space weather disturbances (Gopalswamy, Yashiro, and Akiyama, 2007; Schmieder et al., 2020).
Sometimes, merging of the filaments is also observed (Schmieder et al., 2004; Chandra et al., 2011; Jiang et al., 2014; Luna et al., 2017). Merging can tell us about the formation and the dynamical evolution of the filaments. Cases are reported, where two filaments merge and the result can be stable or eruptive filament. Such phenomena were simulated in high beta plasma condition by Linton (2006) and in low beta plasma coronal condition by Aulanier, DeVore, and Antiochos (2006) and Török et al. (2011). In Addition to it laboratory experiment has also been performed (Gekelman, Lawrence, and Van Compernolle, 2012).
Occasionally, the eruptions occur in a short interval of time at same or different locations on the solar surface (Biesecker and Thompson, 2000; Moon et al., 2002; Wang et al., 2002; Zhukov and Veselovsky, 2007; Liu, Wang, and Alexander, 2009). The consecutive eruptions, occurring in the same active region within a relatively short time interval, are defined as sympathetic eruptions. Other cases could also be recognized as sympathetic eruptions, such as the recurring/successive eruptions that appear at different locations of the solar surface. Such events can occur in both quiet and active regions (Moon et al., 2002; Wheatland and Craig, 2006; Schrijver and Title, 2011). Sympathetic eruptions have already been observed in the past (Richardson, 1936, 1951; Becker, 1958) and it is believed that they can be physically connected by the coronal loops. It was found that in case of sympathetic eruptions, the multiple flux systems erupt. First, the eruption starts in one active region, pushing the overlaying magnetic flux and causing other flux systems to erupt (Delannée and Aulanier, 1999; Wang et al., 2002; Liu, Webb, and Zhao, 2006; Zhukov and Veselovsky, 2007). Another possibility was suggested by Khan and Hudson (2000). According to them, the propagation of EUV waves can destabilize the adjacent loop system and ultimately lead to another eruption.
The sympathetic eruptions were modelled in MHD numerical simulations. Ding, Hu, and Wang (2006) performed the 2.5 D time-dependent MHD model. In this model they scrutinized the catastrophic behavior of a multiple flux rope system, which contains three magnetic flux ropes in three sets of separate loop arcades. They concluded that the eruption of the first flux rope disturbed the stability of the second and third flux ropes and forced them to erupt. According to the model proposed by Wheatland and Craig (2006), if a flare occurs in the location of a separator, it temporary increases the probability of flaring at all separators (a complex of reconnecting structures). Recently Török et al. (2011) presented 3 D MHD simulation of two magnetic flux ropes and reproduced the 2010 August 1 quiet filament eruptions. Their results support the hypothesis that the trigger mechanisms of sympathetic eruptions can be related to the large-scale coronal magnetic field. Despite the numerous observations and simulations, the exact reason for the sympathetic eruptions is still not well understood.
In this paper we present the observations of three sympathetically erupting filaments. Each eruption was associated with a CME. In addition to this, the observations also show the merging of two filaments. The paper is organized as follows: Section \irefsect_Observations describes the data sets used in the study. The results of our analysis are presented in Section \irefsect_results. Finally, the discussion and summary of the investigation are presented in Section \irefdiscussion.
2 Observational Data Sets
sect_Observations For this study, we used the data from following sources:
-
1.
SDO/AIA data: For the evolution and dynamics/kinematics study of the filament eruptions, we used data from the Atmospheric Imaging Assembly (AIA; Lemen et al., 2012) onboard the Solar Dynamics Observatory (SDO; Pesnell, Thompson, and Chamberlin (2012)). The AIA consists of seven Extreme Ultra-Violet (EUV) and three Ultra-Violet (UV) channels which probe the solar corona with a pixel resolution of 0.6′′ and an average cadence of 12 s. The AIA image field-of-view (FOV) reaches 1.3 solar radii. For the present study we used 1 min cadence data from the AIA 171, 193 and 304 Å channels.
-
2.
H Data: H images from Global Oscillation Network Group (GONG; Harvey et al., 1996) were used to study the chromospheric evolution of filament eruptions. GONG observes the full Sun in H with a cadence of 1 min and a pixel resolution of 1′′.
-
3.
SDO/HMI magnetic field data : The line-of-sight magnetograms taken by Helioseismic and Magnetic Imager (HMI; Scherrer et al., 2012; Schou et al., 2012) on board SDO were used to explore the photospheric magnetic fields configuration in the corresponding regions. The HMI LOS magnetograms used in this study have a cadence of 10 min and pixel size of 0.5′′. The 1 noise level for HMI line-of-sight magnetogram is 10 G (Liu et al., 2012). The HMI magnetograms and AIA images were co-aligned by using the UV AIA 1600 Å images, which was consequently aligned with the AIA EUV channels. All data were corrected for projection effect and derotated to 23:20 UT on 18 July 2015.
-
4.
LASCO CME data: The CME association of the erupted filaments was traced in the field-of-view (FOV) of the C2 Coronagraph (2.2 – 6 R⊙) of Large Angle and Spectrometric Coronagraph (LASCO; Brueckner et al., 1995) on board the SOHO satellite.
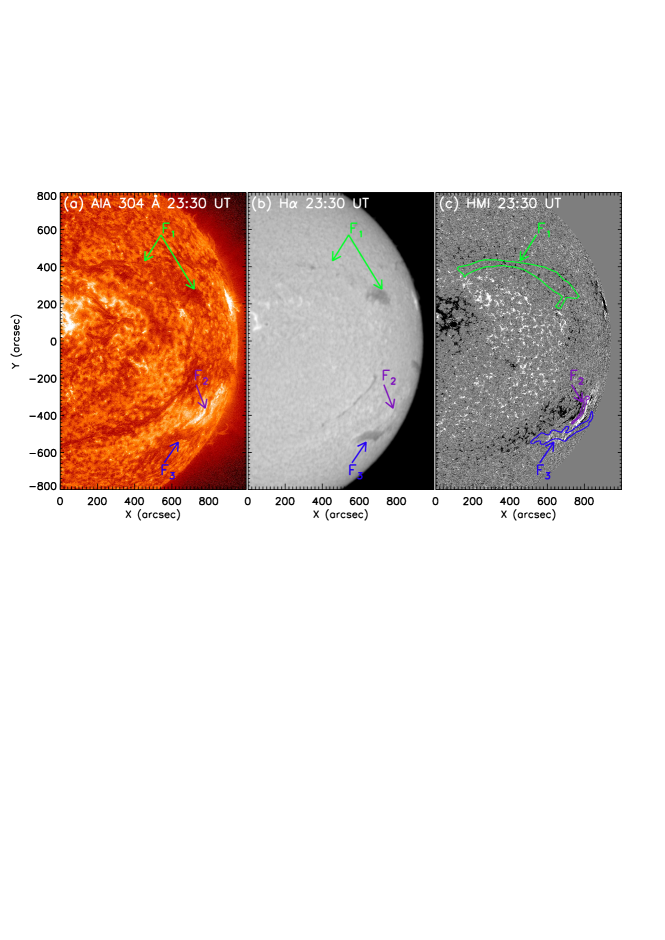
fig_304_hal_hmi
3 Results
sect_results
On 19 July 2015, three filaments erupted sympathetically. First one was a quiescent filament, while the other two filaments were situated in an active region. The dynamics and the kinematics of these eruptions are presented in the following sub-sections.
3.1 Dynamics
We named the three filaments as F1, F2, and F3 respectively. Filament F1 was located in northern hemisphere, on the other hand filaments F2, and F3 were located in southern hemisphere. The location of all these three filaments are shown in panels ‘a’ and ‘b’ of Figure \ireffig_304_hal_hmi in AIA 304 Å and H respectively. In panel ‘c’ of the figure the AIA 304 Å filament contours are overlaid on photospheric magnetic field by green, pink and blue colours. This image was obtained before the eruption on 18 July 2015. Filament F1 was a large filament (projection length 450 Mm) that was observed on the solar disk between 11 – 19 July 2015. It survived around eight days on solar disk and erupted on 19 July 2015. The filaments F2 and F3 were located in the NOAA active region (AR) 12384. Initially these filaments were observed as a single filament up to 16 July 2015, which on 17 July 2015 splitted into two smaller parts as earlier named as F2 and F3.
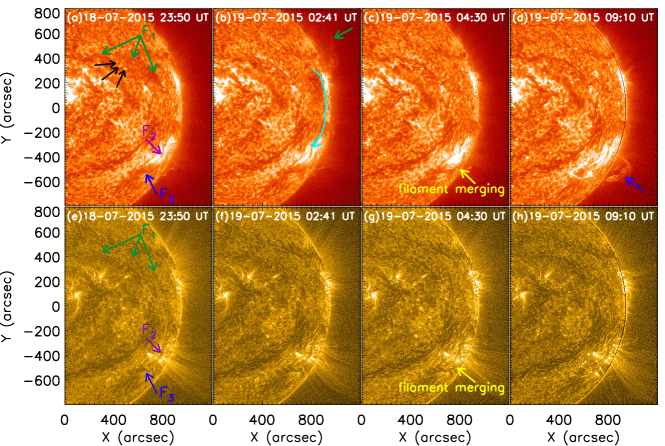
Figure \ireffig_evolution304_171 illustrates the filament eruption evolution in AIA 304 Å and 171 Å wavelengths in top and bottom rows, respectively. To make the evolution more clear, we have created the MGN processed images in 171 Å. This method is proposed by Morgan and Druckmüller (2014). It is based on the localized normalization of the data at different spatial levels. There are several parameters in this code, which can be changed according to the waveband namely ‘’ , ‘k’, ‘h’. The ‘’ parameter is useful for the global gamma transformation of the image, the parameter ‘k’ controls the sharpness of the gamma transformation and ‘h’ is the approximate weight of the global normalized image. We used the original default values of ‘’ and ‘k’ described in the original code as 3.2 and 0.7, respectively. We modified slightly the value of ‘h’ to 0.9, as it can be changed for the type of input image and for the desired output. Before applying the MGN technique, firstly the AIA data is pre-processed using procedure and all the images are aligned at a fixed time, to compensate the solar rotation effect, using routine available in SSWIDL. Such image processing is useful to present clearly the structural evolution of the eruption (Devi et al., 2021). Here we discuss the eruption evolution of the filaments step-by-step. The filament F1 started to rise 01:00 UT on 19 July 2015. The erupted material went into two major directions. Part of the erupted filament moved towards northwest direction. This erupted part became visible in LASCO C2 FOV as a CME at 03:36 UT with a speed of 126 km s-1. As the filament erupted two parallel elongated brightening along the PIL, where the F1 filament was situated before its eruptions, were observed. These two ribbons were very faint. We could not see any enhancement in the GOES X-ray flux at this time. This could be due to the weak reconnection occurrence during the filament eruption as illustrated in the study of Chandra et al. (2021).
Remaining part of the erupted F1 filament advanced into south direction, as shown by cyan arrows in Figure \ireffig_evolution304_171. Finally it fell down towards the filament F2 and reached up to its north feet (see Figure \ireffig_evolution304_171(b)). As a result filament F2 started to rise and merged with filament F3 around 04:33 UT. Part of the filament F2 was skipped from the solar surface and appeared as a very faint CME at 05:24 UT in LASCO C2 FOV.
The merged filament started to rise slowly in southwest direction at 05:10 UT. This eruption was associated with a C-class GOES solar flare and a partial halo (width 194∘) CME with a linear speed of 782 km s-1, which was first observed in the LASCO C2 FOV at 09:48 UT at a height of 2.9 Rsun.
The chronology of these eruptions and related activities are presented in Table 1.
| Time (UT) | Activities | Notes |
|---|---|---|
| 23:40∗ – 00:50 | Activation of filament F1 | * time one day earlier |
| 00:50 – 03:20 | Part of F1 material moved northwest | – |
| 03:36 | CME appearance in LASCO FOV | Related with northwest part |
| 01:30 – 04:00 | Part of F1 material moved southward | Reached upto F2 |
| 04:11 | Activity in filament F2 | Partial eruption |
| 04:33 | Start of the merging of F2 and F3 filaments | – |
| 04:33 – 05:10 | Small oscillations in F3 | – |
| 05:24 | small CME in LASCO FOV | Related to F2 partial eruption |
| 05:00 | Final merging of F2 and F3 filaments | |
| 05:10 | F3 starts to rise | Small velocity (few km s-1 ) |
| 07:00 | F3 starts faster velocity | velocity 12 km s-1 |
| 09:00 | F3 acceleration phase | velocity 138 km s-1 |
| 09:10 | GOES C2 flare onset | Long duration flare ( 7 hrs) |
| 09:48 | CME appearance in LASCO FOV | A partial halo CME |
3.2 Kinematics
To investigate the temporal and spatial connection between the three erupted filaments, we performed the time-distance analysis. This technique is based on the exploration of the motion of plasma material along an artificial slit. For this purpose, we have selected different slits in some selected directions. These slits were named as S1, S2, S3, and S4 respectively.
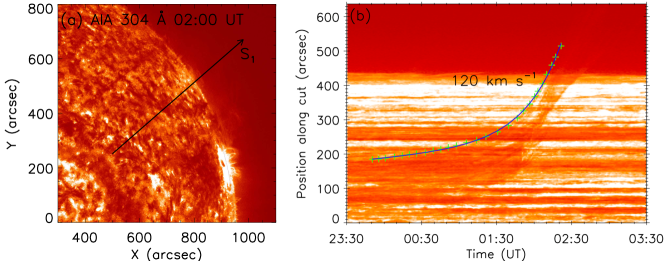
The slit S1 was selected in order to analyse the kinematic behavior of eruption in the north west direction. The selected slit and the corresponding time-distance plot are shown in Figure \ireffig_slit_S1. We have selected some points in the edge of the time-distance slice and overplotted them in the same image (Figure \ireffig_slit_S1b) with ‘plus’ symbol in green color. Further, these data points were fitted by a combination of linear and exponential functions, namely (), as done by Cheng et al. (2020). Where a, b, c, and are arbitrary constants and the time is fixed at 23:50 UT on 18 July 2015. The fitted function is plotted as blue solid line in panel ‘b’ of the Figure. The computed speed is 120 6 km s-1. To determine the exact start time of the eruption, we used the equation ln). According to our results the eruption started at 00:42 UT on 19 July 2015.
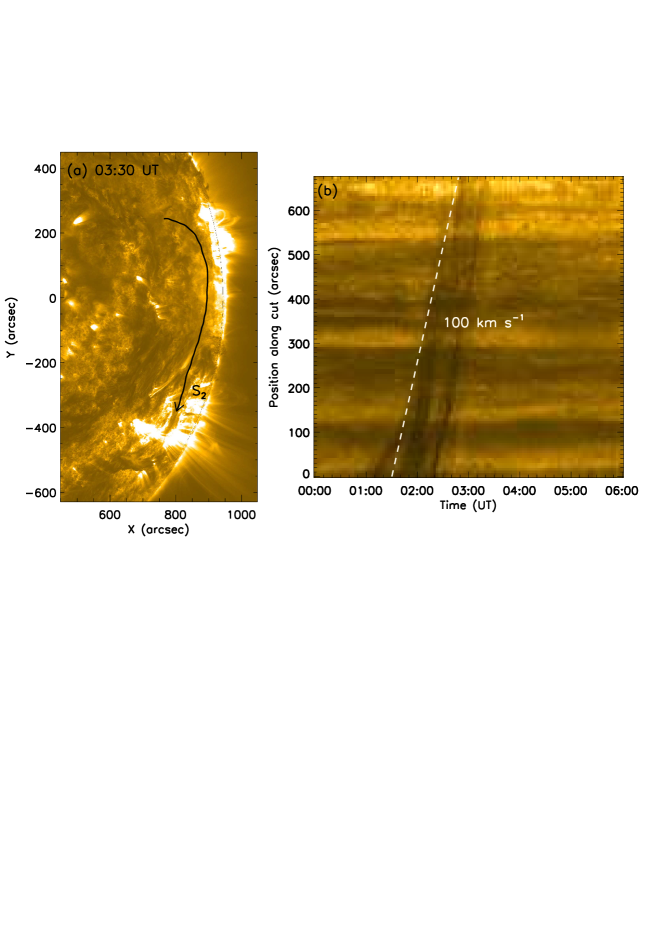
The slit S2 was chosen at southward direction where part of F1 material was observed to move. The slit position and the time-slice is depicted in Figure \ireffig_slit_S2. The speed of material going in this direction was computed using the straight-line fit. The estimated speed value is about 100 2 km s-1, which is comparable but slightly slower than the speed of filament in north-west direction. This slower speed could be due to the following possibilities: Due to long curved path of S2 along the closed loop channel (evidenced by the PFSS extrapolation in Figure \ireffig_pfss), the material ejected from the filament F1 decelerated and result as a slower speed. Another reason for the slower speed could be the expansion of the filament F1. The erupting filament material reached the feet of filament F2 at 03:20 UT.
fig_slit_S2
The slit S3 is placed between the filaments F2 and F3. The purpose of this slit is to comprehend the observed merging of these two filaments. The results are plotted in Figure \ireffig_slit_S3. The time-distance plot indicates that the filament F2 was in stationary state up to 04:10 UT and it started to rise at 04:20 UT. Around this time the filament F2 became unstable due to the continuous flow of plasma material of F1 filament. As a result the filament F2 merged with F3 at around 05:00 UT.
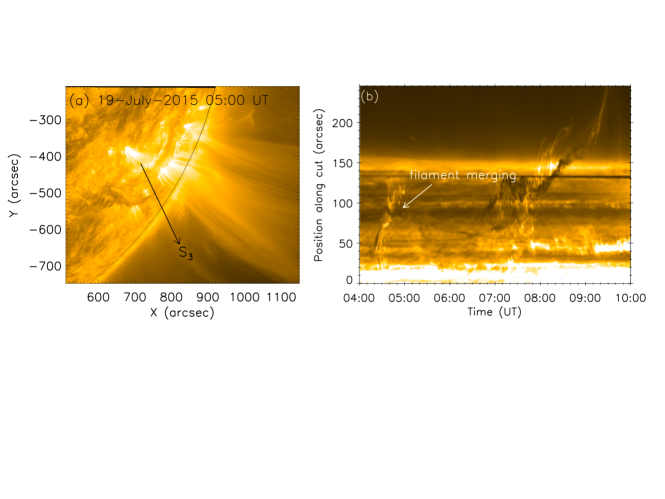
fig_slit_S3
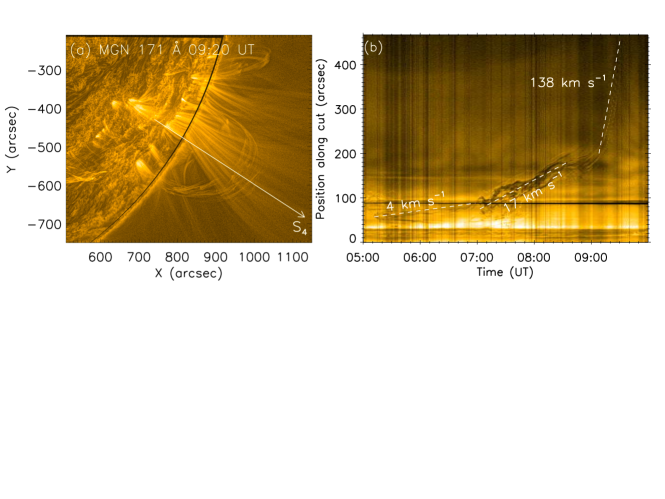
fig_slit_S4
To examine the eruption of filament after merging, we have fixed the slit S4 as shown in Figure \ireffig_slit_S4. From the time-distance plot shown on the figure, it is evident that the eruption started at 05:10 UT, just after the F2 and F3 merging. Further from the image, it is noticeable that the eruption had three phases. The first phase, starting at 05:10 UT was a slow phase with a speed of 4 km s-1 and lasted up to 07:00 UT. After 07:00 UT the second phase started, where the eruption speed increased to about 17 km s-1. The second phase lasted up to 09:00 UT. Another interesting feature observed in this phase was the observation of oscillations during the filament eruption. This oscillatory behaviour was observed throughout the second phase. Finally, the third phase started, where the eruption speed was maximum of 138 km s-1. The eruption of this filament produced a large partial halo CME.
3.3 Magnetic field analysis
To examine the photospheric magnetic field evolution we performed a careful inspection of the HMI magnetic field movies (see online movies) and found regions of small-scale flux emergence/cancellation at the F1 filament site and much more flux cancellation at the location of F2 and F3 filaments.
Figure \irefhmi presents the magnetic field evolution between 14 – 19 July 2015, with overploted the filament positions in panels ‘b’ and ‘d’. The analyzed region, which is located at from the central meridian, is marked by red box in panel ‘c’ of the Figure \irefhmi.
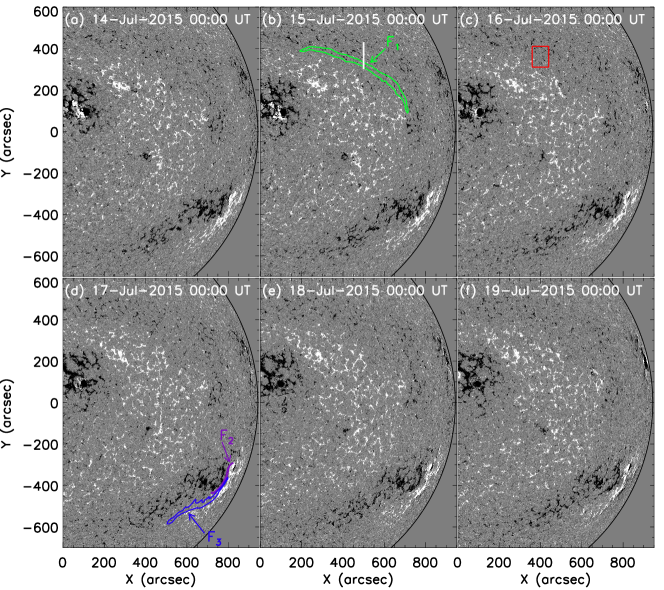
The photospheric magnetic fields shown in Figure \irefhmi indicate that F1 is lying down along the neutral line. The F1 eastern part is ending in the bipolar region (500′′, 371, where at 00:42 UT an emerging flux (EF) was observed. At the same time i.e. at 00:42 UT, the filament F1 started to erupt and part of its material lifted up in northwest direction up to 03:20 UT, when it escaped the AIA FOV. Moreover, between 01:30 UT and 03:20 UT we observed a part of F1 material to move down in southward direction up to the F2 position. In Figure \ireffig8 are shown a co-aligned image of AIA 304 (with a rising F1) and LOS HMI magnetic field image. The close-up magnetic field evolution, zoomed into the area shown as red rectangle Figure \irefhmi (c), is presented for the magnetic field quiet state Figure \ireffig8 (e), while during its pre-eruptive state (Figure \ireffig8 f, g), the cancellations and emergence of the magnetic field are shown.
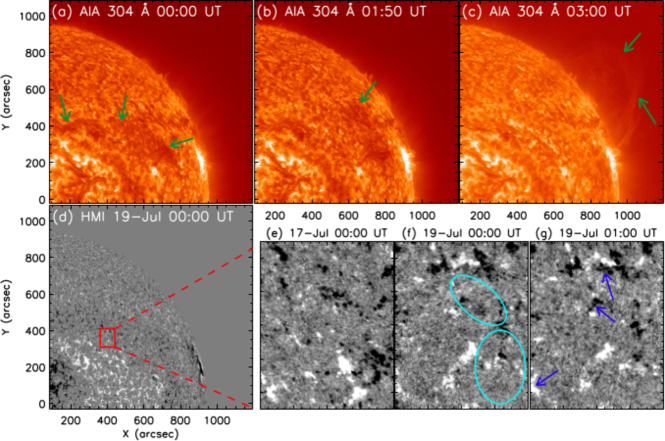
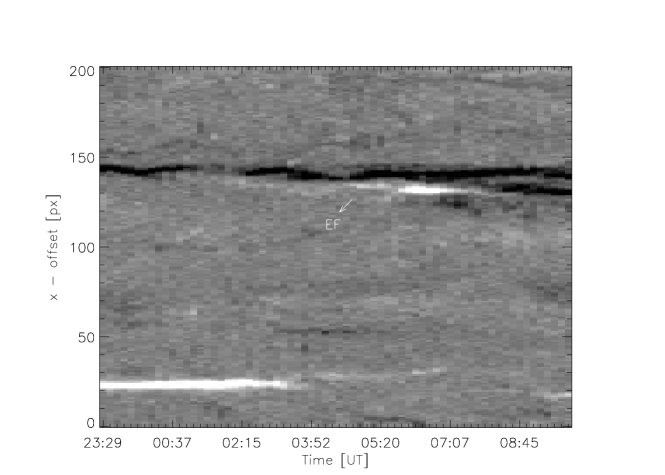
The emerging flux close to the F1 location is well visible in time-distance plot, shown in Figure \irefts_hmi. The slit position is shown in Figure \irefhmi(b) by white vertical line. The time variations of both positive and negative LOS magnetic fluxes in the cancellation region, estimated in the box area shown in Figure \irefhmi(c) from 23:19 UT on 18 July to 10:19 UT on 19 July, are presented in Figure \irefmf_F1. During the pre-eruptive phase of the F1 eruption, the positive flux steeply decreased up to 00:00 UT, when was the start time of EF close the eastern F1 footpoint (see Figure \ireffig8) Then, it undergone a small increasing up to the F1 eruption onset. After the eruption, the positive flux gradually decreased with an amplitude oscillations. During the pre-eruptive phase, the negative magnetic flux showed a similar behavior. After the eruption it gradually decreased with an amplitude oscillations up to 04:30 UT and then the negative flux steeply decreased up to 09:00 UT. In the pre-eruption phase (i.e. 18 July 23:30 UT – 19 July 00:00 UT), the decrease in both positive and negative fluxes can be considered as evidence of flux cancellation at the neutral line of the filament (Sterling et al., 2010; Green, Kliem, and Wallace, 2011). Hence, there were sites of flux emergence and cancellation in and around the filament, influencing its stability.

The pre-eruptive EUV brightening was observed in the vicinity of the filament channel prior to the F1 eruption, between 23:40 UT on July 18 and 00:50 UT on July 19 (see Figure \ireffig_evolution304_171). This pre-eruptive brightening represents series of small-scale patches aligned to the neutral line beneath the filament. The brightening was visible not only in 304 Å and 171 Å channels, but also in the high temperature AIA channels 193 Å, 131 Å and 94 Å. The flux cancellations presented prior to the F1 eruption are probably caused by the slow magnetic reconnections between the moving negative fluxes and its nearby positive fluxes (Wang and Shi, 1993), which would lead to some small-scale activities observed as the EUV brightenings, for example (Chen et al., 2019).
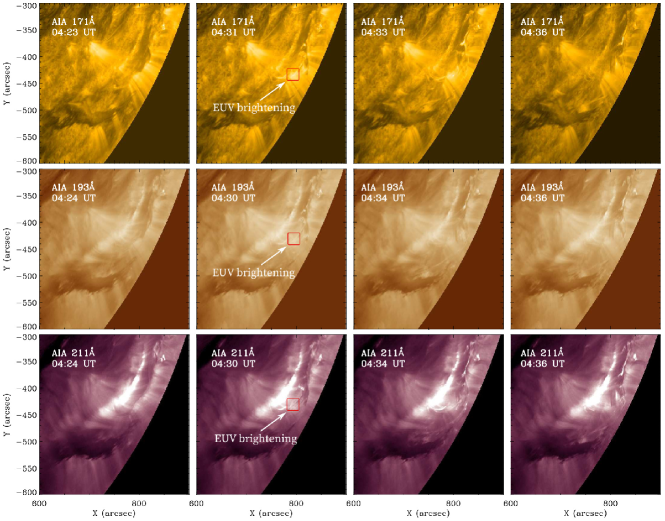
The pre-eruptive brightening in the vicinity of F2 and F3 was visible in all AIA channels. In Figure \irefeuv_br the evolution of EUV brightening is presented in three high temperature AIA channels, such as 171 Å, 193 Å and 211 Å. We found that the first indications of the pre-eruptive brightening enhancement occurred after 02:40 UT. This brightening enhancement was slow and fragmented, i.e. in different small-scale locations of filament vicinity along the PIL. Such brightening could be caused by a slow reconnection acting in the course of the flux cancellations process during the pre-eruptive phase (Chen et al., 2019). After 04:00 UT significant and dynamic changes in the brightening occurred. The brightening enhancement covered the all filament vicinity, rapidly increasing and reaching a peak at 04:30 UT, i.e. when an extreme brightening was observed in some parts of the interacting and merging F2 and F3 flux ropes (FRs). Afterward, the brightening rapidly decreased and after 05:00 UT, when the F2–F3 compound flux rope rose up, it returned to the initial rate.
4 Discussion and Summary
discussion
We analyze the sympathetic eruption of three filaments observed on 19 July 2015. The filament F1 was a quiet filament located in the northern hemisphere, while the F2 and F3 filaments were located in the active region NOAA AR 12384 in the southern hemisphere. The main results of this study are summarized as follows:
-
•
All the eruptions are sympathetic and are associated with CMEs.
-
•
The time-distance analysis and the morphology of the filaments suggest that filament F1 triggered F2, which consequently triggered F3.
-
•
We found that flux emergence/cancellation plays an important role in the observed filament eruption. We suggest that the emergence/cancellation of magnetic fluxes near the F1 causes the flux rope to rise.
-
•
In addition to these processes, the material movement from F1 to the F2-F3 location can additionally contribute to the F2–F3 compound FR destabilization.
- •
Our analysis of the magnetic flux evolution beneath the eastern part of filament F1 suggest that the flux emergence via magnetic flux cancellation caused F1 destabilization. An important feature of the F1, F2 and F3 evolution is the pre-eruptive EUV brightening. During the slow rise of filaments F2 and F3 an extreme EUV brightening occurred at some parts of the merging F2 and F3 (see Figure \irefeuv_br), that suggests a sequence of partial merging episodes. Such brightening could be caused by the plasma heating, due to the energy released from reconnection site, below the rising prominence (Su et al., 2015).
The merging of F2 and F3 is due to the stronger instability of the lower F2 FR in comparison to those of the upper F3 FR, which according to Kliem et al., 2014 is the condition for FRs merging mechanism to work. Another condition for the merging of the two filaments could be the magnetic flux cancellation between them. Such a condition for the two filament merging was discussed in the study of Chandra et al. (2011). They found that the continuous decrease in the magnetic flux between the filaments brings them close to each other for the merging. Later the same observations were simulated by Török et al. (2011) who confirmed these observational results.
About the eruption of F2–F3 compound FR, it is important to note the suggestion of Aulanier et al., 2010 that flux cancellation and tether-cutting reconnection are a key pre-eruption mechanisms for the buildup and the slow rise of an MFR, but they cannot trigger solar eruption alone. Moreover, the authors suggest the torus instability as an additional destabilizing mechanism.
Another event that can also cause significant EUV brightening and subsequently to affect the F2 stability is the inflow of F1 material in the vicinity of F2. Such a brightening is considered as an observational signature of falling material and its impact on the solar atmosphere (Gilbert et al., 2013). Moreover, the fluid instabilities associated with the falling material were described recently by Innes et al., 2012. There are two mechanisms, compression and reconnection, that can explain the EUV brightening observed in the SDO/AIA channels. Which of them is responsible or dominant, depends on the amount of the energy associated with the observed emission. As Gilbert et al., 2013 pointed out, although the dominance of one mechanism over the other, both are likely occurring, since the falling material undoubtedly carries frozen-in magnetic flux. Therefore, the falling F1 material in the vicinity of F2 could be considered as additional mechanism that also facilitates the destabilization of F2 filament. Moreover, this event provides an observational evidence for the physical linkage between the three eruptions.
Ding, Hu, and Wang (2006) proposed the 2.5D MHD model for the sympathetic eruption. They consider three FRs embedded in different arcade system and same large scale magnetic field contributes for all these FRs systems. When one FR becomes unstable (or erupted) due to catastrophic behaviour, the global shared magnetic filed changes significantly for the unfinished FRs. As a result, these undisturbed FRs becomes catastrophically unstable and erupt.
The 3D MHD simulation was proposed by Török et al. (2011) for the sympathetic eruption of 1 August 2010. According to their model two mechanism are proposed. The first FR erupted due to the converging flow and the another two FR are initiated by the removal of magnetic flux above the FRs due to the magnetic reconnection triggered by first FR eruption.
In current observations, we believe that the first filament F1 eruption could allow to reconnect the open field lines with the overlying field lines of F2 and F3 filament system. As a result of this the magnetic tension above F2 and F3 filament becomes weaker and they start to erupt. After comparing our reported observations with the above models, we believe our events can be explained by the combination of both above discussed models.
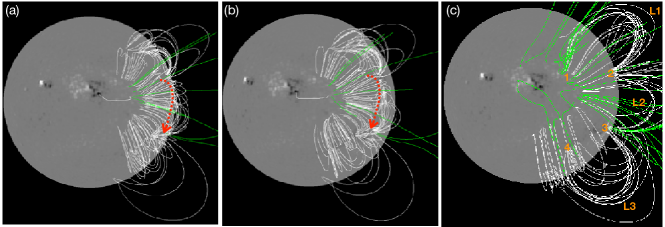
To explain the possible scenarios of the observations, we have performed the PFSS extrapolation of the pohospheric magnetic filed. The result is presented in Figure \ireffig_pfss. In panel (a) the PFSS extrapolation on 19 July 2015 at 00:00 UT is presented. In panel (b) the PFSS extrapolation is shown from different view, rotated to the top of the moving channel. Using this figure, we present the following explanation for the current eruption: The erupted part of the filament F1 partially went through the open field lines (shown by green color in the figure) in north-west direction, which later observed as a CME. Major part of the erupted filament F1 went towards the location of filaments F2 through the channel of closed field lines (shown by red arrow). This part disturbed the filament F2 and allows it to erupt. Since the erupted material probably was channeled under the closed magnetic fields, the observed case can be similar to the scenario of Wang et al. (2016), i.e., the filament (F1) does not completely erupt under the closed field lines, but trigger the filament (F2) nearby the open fields to erupt. Another scenario of the sympathetic eruption can be explained by panel ‘c’ of Figure \ireffig_pfss. In this scenario filament F1 and F2-F3 are connected by following set of loops: Loop system L1 connects site ‘1’ to site ‘2’, Loop system L2 connects site ‘2’ to site ‘3’ and similarly site ‘3’ is connected to site ‘4’ by loops L3. The erupted material from F1 went towards F2-F3 through loop system L1, L2, and L3 and it disturbed the stability of filaments F2 and F3. As a result of this disturbance, filament F2 and F3 erupted.
Disclosure of Potential Conflicts of Interest The authors declare that they have no conflicts of interest.
Acknowledgments
We are thankful to the referee for the constructive comments and suggestions. We acknowledge the open data policy of SDO, SOHO and GONG missions. This work is supported by the Bulgarian Science Fund and the Department of Science & Technology, Government of India Fund under Indo-Bulgarian bilateral project No. DST/INT/BLS/P-11/2019 and KP-06-India/14 (19 -Dec-2019). PD thank the CSIR, New Delhi, for providing the research fellowship.
References
- Aulanier, DeVore, and Antiochos (2002) Aulanier, G., DeVore, C.R., Antiochos, S.K.: 2002, Prominence Magnetic Dips in Three-Dimensional Sheared Arcades. ApJ 567(1), L97. DOI. ADS.
- Aulanier, DeVore, and Antiochos (2006) Aulanier, G., DeVore, C.R., Antiochos, S.K.: 2006, Solar Prominence Merging. ApJ 646(2), 1349. DOI. ADS.
- Aulanier et al. (2010) Aulanier, G., Török, T., Démoulin, P., DeLuca, E.E.: 2010, Formation of Torus-Unstable Flux Ropes and Electric Currents in Erupting Sigmoids. ApJ 708(1), 314. DOI. ADS.
- Becker (1958) Becker, U.: 1958, Beobachtungen von drei Eruptionen im weien Licht. Mit 5 Textabbildungen. ZAp 46, 168. ADS.
- Biesecker and Thompson (2000) Biesecker, D.A., Thompson, B.J.: 2000, Sympathetic flaring with BATSE, GOES, and EIT data. Journal of Atmospheric and Solar-Terrestrial Physics 62(16), 1449. DOI. ADS.
- Brueckner et al. (1995) Brueckner, G.E., Howard, R.A., Koomen, M.J., Korendyke, C.M., Michels, D.J., Moses, J.D., Socker, D.G., Dere, K.P., Lamy, P.L., Llebaria, A., Bout, M.V., Schwenn, R., Simnett, G.M., Bedford, D.K., Eyles, C.J.: 1995, The Large Angle Spectroscopic Coronagraph (LASCO). Sol. Phys. 162(1-2), 357. DOI. ADS.
- Chae (2001) Chae, J.: 2001, Observational Determination of the Rate of Magnetic Helicity Transport through the Solar Surface via the Horizontal Motion of Field Line Footpoints. ApJ 560(1), L95. DOI. ADS.
- Chandra et al. (2010) Chandra, R., Pariat, E., Schmieder, B., Mandrini, C.H., Uddin, W.: 2010, How Can a Negative Magnetic Helicity Active Region Generate a Positive Helicity Magnetic Cloud? Sol. Phys. 261(1), 127. DOI. ADS.
- Chandra et al. (2011) Chandra, R., Schmieder, B., Mandrini, C.H., Démoulin, P., Pariat, E., Török, T., Uddin, W.: 2011, Homologous Flares and Magnetic Field Topology in Active Region NOAA 10501 on 20 November 2003. Sol. Phys. 269(1), 83. DOI. ADS.
- Chandra et al. (2021) Chandra, R., Démoulin, P., Devi, P., Joshi, R., Schmieder, B.: 2021, Filament Eruption Driving EUV Loop Contraction and Then Expansion above a Stable Filament. ApJ 922(2), 227. DOI. ADS.
- Chen et al. (2019) Chen, H., Zheng, R., Li, L., Ma, S., Bi, Y., Yang, S.: 2019, Untwisting and Disintegration of a Solar Filament Associated with Photospheric Flux Cancellation. ApJ 871(2), 229. DOI. ADS.
- Cheng, Kliem, and Ding (2018) Cheng, X., Kliem, B., Ding, M.D.: 2018, Unambiguous Evidence of Filament Splitting-induced Partial Eruptions. ApJ 856(1), 48. DOI. ADS.
- Cheng et al. (2020) Cheng, X., Zhang, J., Kliem, B., Török, T., Xing, C., Zhou, Z.J., Inhester, B., Ding, M.D.: 2020, Initiation and Early Kinematic Evolution of Solar Eruptions. ApJ 894(2), 85. DOI. ADS.
- Delannée and Aulanier (1999) Delannée, C., Aulanier, G.: 1999, Cme Associated with Transequatorial Loops and a Bald Patch Flare. Sol. Phys. 190, 107. DOI. ADS.
- Devi et al. (2021) Devi, P., Démoulin, P., Chandra, R., Joshi, R., Schmieder, B., Joshi, B.: 2021, Observations of a prominence eruption and loop contraction. A&A 647, A85. DOI. ADS.
- Ding, Hu, and Wang (2006) Ding, J.Y., Hu, Y.Q., Wang, J.X.: 2006, Catastrophic Behavior of Multiple Coronal Flux Rope System. Sol. Phys. 235(1-2), 223. DOI. ADS.
- Gekelman, Lawrence, and Van Compernolle (2012) Gekelman, W., Lawrence, E., Van Compernolle, B.: 2012, Three-dimensional Reconnection Involving Magnetic Flux Ropes. ApJ 753(2), 131. DOI. ADS.
- Gibson (2018) Gibson, S.E.: 2018, Solar prominences: theory and models. Fleshing out the magnetic skeleton. Living Rev. of Solar Phys. 15(1), 7. DOI. ADS.
- Gibson and Fan (2006) Gibson, S.E., Fan, Y.: 2006, The Partial Expulsion of a Magnetic Flux Rope. ApJ 637(1), L65. DOI. ADS.
- Gilbert et al. (2013) Gilbert, H.R., Inglis, A.R., Mays, M.L., Ofman, L., Thompson, B.J., Young, C.A.: 2013, Energy Release from Impacting Prominence Material Following the 2011 June 7 Eruption. ApJ 776(1), L12. DOI. ADS.
- Gopalswamy, Yashiro, and Akiyama (2007) Gopalswamy, N., Yashiro, S., Akiyama, S.: 2007, Geoeffectiveness of halo coronal mass ejections. Journal of Geophysical Research (Space Physics) 112(A6), A06112. DOI. ADS.
- Gopalswamy et al. (2003) Gopalswamy, N., Shimojo, M., Lu, W., Yashiro, S., Shibasaki, K., Howard, R.A.: 2003, Prominence Eruptions and Coronal Mass Ejection: A Statistical Study Using Microwave Observations. ApJ 586(1), 562. DOI. ADS.
- Green, Kliem, and Wallace (2011) Green, L.M., Kliem, B., Wallace, A.J.: 2011, Photospheric flux cancellation and associated flux rope formation and eruption. A&A 526, A2. DOI. ADS.
- Harvey et al. (1996) Harvey, J.W., Hill, F., Hubbard, R.P., Kennedy, J.R., Leibacher, J.W., Pintar, J.A., Gilman, P.A., Noyes, R.W., Title, A.M., Toomre, J., Ulrich, R.K., Bhatnagar, A., Kennewell, J.A., Marquette, W., Patron, J., Saa, O., Yasukawa, E.: 1996, The Global Oscillation Network Group (GONG) Project. Science 272(5266), 1284. DOI. ADS.
- Innes et al. (2012) Innes, D.E., Cameron, R.H., Fletcher, L., Inhester, B., Solanki, S.K.: 2012, Break up of returning plasma after the 7 June 2011 filament eruption by Rayleigh-Taylor instabilities. A&A 540, L10. DOI. ADS.
- Jiang et al. (2014) Jiang, Y., Yang, J., Wang, H., Ji, H., Liu, Y., Li, H., Li, J.: 2014, Interaction and Merging of two Sinistral Filaments. ApJ 793(1), 14. DOI. ADS.
- Joshi et al. (2013) Joshi, N.C., Srivastava, A.K., Filippov, B., Uddin, W., Kayshap, P., Chandra, R.: 2013, A Study of a Failed Coronal Mass Ejection Core Associated with an Asymmetric Filament Eruption. ApJ 771(1), 65. DOI. ADS.
- Joshi et al. (2014) Joshi, N.C., Srivastava, A.K., Filippov, B., Kayshap, P., Uddin, W., Chandra, R., Prasad Choudhary, D., Dwivedi, B.N.: 2014, Confined Partial Filament Eruption and its Reformation within a Stable Magnetic Flux Rope. ApJ 787(1), 11. DOI. ADS.
- Khan and Hudson (2000) Khan, J.I., Hudson, H.S.: 2000, Homologous sudden disappearances of transequatorial interconnecting loops in the solar corona. Geophys. Res. Lett. 27(8), 1083. DOI. ADS.
- Kliem et al. (2014) Kliem, B., Török, T., Titov, V.S., Lionello, R., Linker, J.A., Liu, R., Liu, C., Wang, H.: 2014, Slow Rise and Partial Eruption of a Double-decker Filament. II. A Double Flux Rope Model. ApJ 792(2), 107. DOI. ADS.
- Kumar et al. (2011) Kumar, P., Srivastava, A.K., Filippov, B., Erdélyi, R., Uddin, W.: 2011, Multiwavelength Observations of a Failed Flux Rope in the Eruption and Associated M-Class Flare from NOAA AR 11045. Sol. Phys. 272(2), 301. DOI. ADS.
- Labrosse et al. (2010) Labrosse, N., Heinzel, P., Vial, J.-C., Kucera, T., Parenti, S., Gunár, S., Schmieder, B., Kilper, G.: 2010, Physics of Solar Prominences: I—Spectral Diagnostics and Non-LTE Modelling. Space Sci. Rev. 151(4), 243. DOI. ADS.
- Lemen et al. (2012) Lemen, J.R., Title, A.M., Akin, D.J., Boerner, P.F., Chou, C., Drake, J.F., Duncan, D.W., Edwards, C.G., Friedlaender, F.M., Heyman, G.F., Hurlburt, N.E., Katz, N.L., Kushner, G.D., Levay, M., Lindgren, R.W., Mathur, D.P., McFeaters, E.L., Mitchell, S., Rehse, R.A., Schrijver, C.J., Springer, L.A., Stern, R.A., Tarbell, T.D., Wuelser, J.-P., Wolfson, C.J., Yanari, C., Bookbinder, J.A., Cheimets, P.N., Caldwell, D., Deluca, E.E., Gates, R., Golub, L., Park, S., Podgorski, W.A., Bush, R.I., Scherrer, P.H., Gummin, M.A., Smith, P., Auker, G., Jerram, P., Pool, P., Soufli, R., Windt, D.L., Beardsley, S., Clapp, M., Lang, J., Waltham, N.: 2012, The Atmospheric Imaging Assembly (AIA) on the Solar Dynamics Observatory (SDO). Sol. Phys. 275(1-2), 17. DOI. ADS.
- Linton (2006) Linton, M.G.: 2006, Reconnection of nonidentical flux tubes. Journal of Geophysical Research (Space Physics) 111(A12), A12S09. DOI. ADS.
- Liu, Wang, and Alexander (2009) Liu, R., Wang, H., Alexander, D.: 2009, Implosion in a Coronal Eruption. ApJ 696(1), 121. DOI. ADS.
- Liu, Webb, and Zhao (2006) Liu, Y., Webb, D.F., Zhao, X.P.: 2006, Magnetic Structures of Solar Active Regions, Full-Halo Coronal Mass Ejections, and Geomagnetic Storms. ApJ 646(2), 1335. DOI. ADS.
- Liu et al. (2012) Liu, Y., Hoeksema, J.T., Scherrer, P.H., Schou, J., Couvidat, S., Bush, R.I., Duvall, T.L., Hayashi, K., Sun, X., Zhao, X.: 2012, Comparison of Line-of-Sight Magnetograms Taken by the Solar Dynamics Observatory/Helioseismic and Magnetic Imager and Solar and Heliospheric Observatory/Michelson Doppler Imager. Sol. Phys. 279(1), 295. DOI. ADS.
- Luna et al. (2017) Luna, M., Su, Y., Schmieder, B., Chandra, R., Kucera, T.A.: 2017, Large-amplitude Longitudinal Oscillations Triggered by the Merging of Two Solar Filaments: Observations and Magnetic Field Analysis. ApJ 850(2), 143. DOI. ADS.
- Mackay et al. (2010) Mackay, D.H., Karpen, J.T., Ballester, J.L., Schmieder, B., Aulanier, G.: 2010, Physics of Solar Prominences: II—Magnetic Structure and Dynamics. Space Sci. Rev. 151(4), 333. DOI. ADS.
- Monga et al. (2021) Monga, A., Sharma, R., Liu, J., Cid, C., Uddin, W., Chandra, R., Erdélyi, R.: 2021, On the partial eruption of a bifurcated solar filament structure. MNRAS 500(1), 684. DOI. ADS.
- Moon et al. (2002) Moon, Y.-J., Choe, G.S., Park, Y.D., Wang, H., Gallagher, P.T., Chae, J., Yun, H.S., Goode, P.R.: 2002, Statistical Evidence for Sympathetic Flares. ApJ 574(1), 434. DOI. ADS.
- Morgan and Druckmüller (2014) Morgan, H., Druckmüller, M.: 2014, Multi-Scale Gaussian Normalization for Solar Image Processing. Sol. Phys. 289(8), 2945. DOI. ADS.
- Pesnell, Thompson, and Chamberlin (2012) Pesnell, W.D., Thompson, B.J., Chamberlin, P.C.: 2012, The Solar Dynamics Observatory (SDO). Sol. Phys. 275, 3. DOI. ADS.
- Richardson (1936) Richardson, R.S.: 1936, Further Solar Observations in Connection with High-Frequency Radio Fadeouts. PASP 48(282), 122. DOI. ADS.
- Richardson (1951) Richardson, R.S.: 1951, Characteristics of Solar Flares. ApJ 114, 356. DOI. ADS.
- Scherrer et al. (2012) Scherrer, P.H., Schou, J., Bush, R.I., Kosovichev, A.G., Bogart, R.S., Hoeksema, J.T., Liu, Y., Duvall, T.L., Zhao, J., Title, A.M., Schrijver, C.J., Tarbell, T.D., Tomczyk, S.: 2012, The Helioseismic and Magnetic Imager (HMI) Investigation for the Solar Dynamics Observatory (SDO). Sol. Phys. 275(1-2), 207. DOI. ADS.
- Schmieder, Démoulin, and Aulanier (2013) Schmieder, B., Démoulin, P., Aulanier, G.: 2013, Solar filament eruptions and their physical role in triggering coronal mass ejections. Adv. Space Res. 51(11), 1967. DOI. ADS.
- Schmieder et al. (2004) Schmieder, B., Mein, N., Deng, Y., Dumitrache, C., Malherbe, J.-M., Staiger, J., Deluca, E.E.: 2004, Magnetic changes observed in the formation of two filaments in a complex active region: TRACE and MSDP observations. Sol. Phys. 223(1-2), 119. DOI. ADS.
- Schmieder et al. (2020) Schmieder, B., Kim, R.S., Grison, B., Bocchialini, K., Kwon, R.Y., Poedts, S., Démoulin, P.: 2020, Low geo-effectiveness of fast halo CMEs related to the 12 X-class flares in 2002. arXiv e-prints, arXiv:2003.10777. ADS.
- Schou et al. (2012) Schou, J., Scherrer, P.H., Bush, R.I., Wachter, R., Couvidat, S., Rabello-Soares, M.C., Bogart, R.S., Hoeksema, J.T., Liu, Y., Duvall, T.L., Akin, D.J., Allard, B.A., Miles, J.W., Rairden, R., Shine, R.A., Tarbell, T.D., Title, A.M., Wolfson, C.J., Elmore, D.F., Norton, A.A., Tomczyk, S.: 2012, Design and Ground Calibration of the Helioseismic and Magnetic Imager (HMI) Instrument on the Solar Dynamics Observatory (SDO). Sol. Phys. 275, 229. DOI. ADS.
- Schrijver and Title (2011) Schrijver, C.J., Title, A.M.: 2011, Long-range magnetic couplings between solar flares and coronal mass ejections observed by SDO and STEREO. Journal of Geophysical Research (Space Physics) 116(A4), A04108. DOI. ADS.
- Schrijver et al. (2008) Schrijver, C.J., Elmore, C., Kliem, B., Török, T., Title, A.M.: 2008, Observations and Modeling of the Early Acceleration Phase of Erupting Filaments Involved in Coronal Mass Ejections. ApJ 674(1), 586. DOI. ADS.
- Sterling et al. (2010) Sterling, A.C., Chifor, C., Mason, H.E., Moore, R.L., Young, P.R.: 2010, Evidence for magnetic flux cancelation leading to an ejective solar eruption observed by Hinode, TRACE, STEREO, and SoHO/MDI. A&A 521, A49. DOI. ADS.
- Su et al. (2015) Su, Y., van Ballegooijen, A., McCauley, P., Ji, H., Reeves, K.K., DeLuca, E.E.: 2015, Magnetic Structure and Dynamics of the Erupting Solar Polar Crown Prominence on 2012 March 12. ApJ 807(2), 144. DOI. ADS.
- Török et al. (2011) Török, T., Panasenco, O., Titov, V.S., Mikić, Z., Reeves, K.K., Velli, M., Linker, J.A., De Toma, G.: 2011, A Model for Magnetically Coupled Sympathetic Eruptions. ApJ 739(2), L63. DOI. ADS.
- van Ballegooijen and Martens (1989) van Ballegooijen, A.A., Martens, P.C.H.: 1989, Formation and Eruption of Solar Prominences. ApJ 343, 971. DOI. ADS.
- Wang et al. (2002) Wang, H., Ji, H., Schmahl, E.J., Qiu, J., Liu, C., Deng, N.: 2002, Sudden Disappearance of a Small Sunspot Associated with the 2002 February 20 M2.4 Flare. ApJ 580(2), L177. DOI. ADS.
- Wang and Shi (1993) Wang, J., Shi, Z.: 1993, The Flare-Associated Magnetic Changes in an Active Region - Part Two. Sol. Phys. 143(1), 119. DOI. ADS.
- Wang et al. (2016) Wang, R., Liu, Y.D., Zimovets, I., Hu, H., Dai, X., Yang, Z.: 2016, Sympathetic Solar Filament Eruptions. ApJ 827(1), L12. DOI. ADS.
- Wheatland and Craig (2006) Wheatland, M.S., Craig, I.J.D.: 2006, Including Flare Sympathy in a Model for Solar Flare Statistics. Sol. Phys. 238(1), 73. DOI. ADS.
- Zhukov and Veselovsky (2007) Zhukov, A.N., Veselovsky, I.S.: 2007, Global Coronal Mass Ejections. ApJ 664(2), L131. DOI. ADS.