DermX: an end-to-end framework for explainable automated dermatological diagnosis
Abstract
Dermatological diagnosis automation is essential in addressing the high prevalence of skin diseases and critical shortage of dermatologists. Despite approaching expert-level diagnosis performance, convolutional neural network (ConvNet) adoption in clinical practice is impeded by their limited explainability, and by subjective, expensive explainability validations. We introduce DermX and DermX+, an end-to-end framework for explainable automated dermatological diagnosis. DermX is a clinically-inspired explainable dermatological diagnosis ConvNet, trained using DermXDB, a 554 image dataset annotated by eight dermatologists with diagnoses, supporting explanations, and explanation attention maps. DermX+ extends DermX with guided attention training for explanation attention maps. Both methods achieve near-expert diagnosis performance, with DermX, DermX+, and dermatologist F1 scores of 0.79, 0.79, and 0.87, respectively. We assess the explanation performance in terms of identification and localization by comparing model-selected with dermatologist-selected explanations, and gradient-weighted class-activation maps with dermatologist explanation maps, respectively. DermX obtained an identification F1 score of 0.77, while DermX+ obtained 0.79. The localization F1 score is 0.39 for DermX and 0.35 for DermX+. These results show that explainability does not necessarily come at the expense of predictive power, as our high-performance models provide expert-inspired explanations for their diagnoses without lowering their diagnosis performance.
1 Introduction
Skin diseases affect a third of the global population (Hay et al., 2014) and are the fourth leading cause of disability worldwide (Karimkhani et al., 2017). The increasing demand for dermatological care is exacerbated by the low performance of general practitioners when diagnosing skin conditions (Federman et al., 1999), and by the global scarcity of expert dermatologists (Feng et al., 2018; Kringos et al., 2015).
Automation may help alleviate this problem. Convolutional neural networks (ConvNets) have been shown to achieve near expert-level performance in diagnosing dermatological conditions from images of skin lesions (Thomsen et al., 2020; Esteva et al., 2017), and that they are able to assist general practitioners as well as less experienced dermatologists in improving their diagnostic performance (Tschandl et al., 2020; Jain et al., 2021). However, the lack of a good explanation mechanism (Kelly et al., 2019) for ConvNet decisions is one of the main obstacles to their adoption as automated diagnosis systems (Goodman and Flaxman, 2017; Kelly et al., 2019; Topol, 2019). A good explanation is expected to be both plausible, i.e. as similar as possible to a human explanation, and faithful, i.e. to accurately represent the inner workings of the network (Jacovi and Goldberg, 2020).
Different mechanisms for explaining ConvNet decisions have been proposed (Simonyan et al., 2014; Selvaraju et al., 2017; Ribeiro et al., 2016). Within the medical imaging literature, the most common explainability methods are saliency-based methods, such as raw saliency maps (Simonyan et al., 2014) and gradient-weighted class-activation attention maps (Grad-CAM) (Singh et al., 2020). While other methods were criticized due to their lack of faithfulness, Grad-CAMs have been shown to perform well (Adebayo et al., 2018). However, there remains a lack of standard metrics for plausibility validation, as the explanations they provide are often incomplete and difficult to quantify (Tschandl et al., 2020). More specifically, common ConvNet explainability methods provide no semantic information alongside the explanation, but rather focus on the image section where the network pays attention. In complex domains such as dermatology, this information is not enough to explain the decision mechanisms: knowing that the network focuses on the skin lesion does not explain why it diagnosed a case as acne and not rosacea. Moreover, such complex tasks require that thorough explanation validation be done by domain experts, which is a time consuming and expensive process. Current dermatological datasets focus either solely on disease diagnosis, or on lesion segmentation (DermNetNZ, 2021; Sun et al., 2016; Tschandl et al., 2018). Having access to expert-annotated dermatological diagnosis explanations would improve the validation of explainability methods and allow the training of intrinsically explainable models. However, to the best of our knowledge, no such dataset exists.
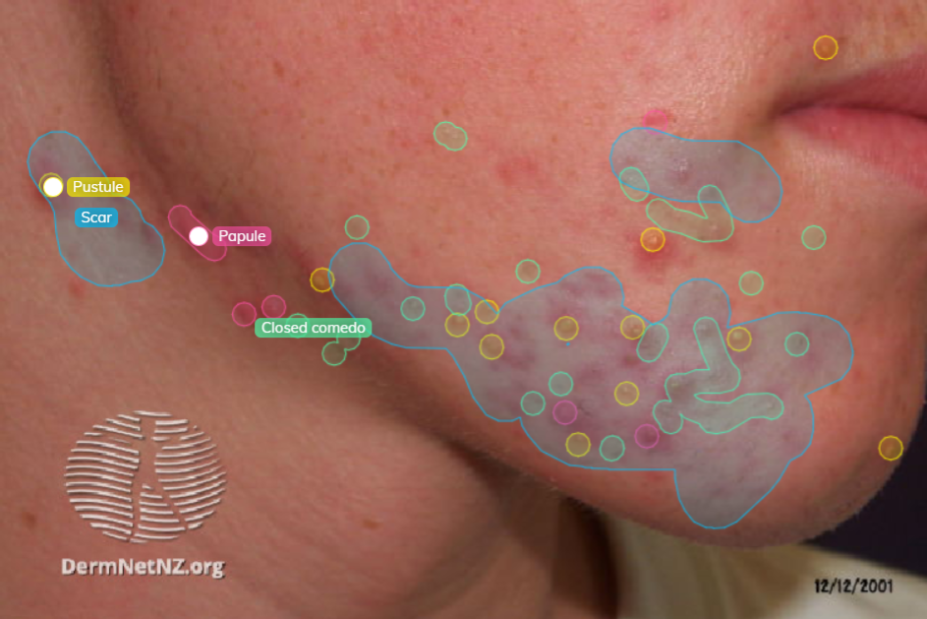
Our contributions are twofold. First, to enable a quantitative assessment of the explainability of dermatological diagnosis models, we introduce DermXDB, a dermatological explainability dataset with gold standard diagnostic explanations provided by eight board-certified dermatologists. DermXDB consists of 554 images from DermNetNZ (DermNetNZ, 2021) and SD-260 (Sun et al., 2016) associated with one of six diagnoses and their explanations in the form of skin lesion characteristics, as defined by Nast et al. (2016). This labeling procedure mimics clinical practice, where dermatologists assess the characteristics of skin lesions to derive and support a tentative diagnosis (Oakley, 2017). An annotation example can be seen in Figure 2.
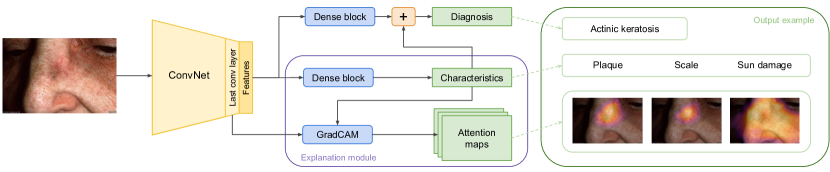
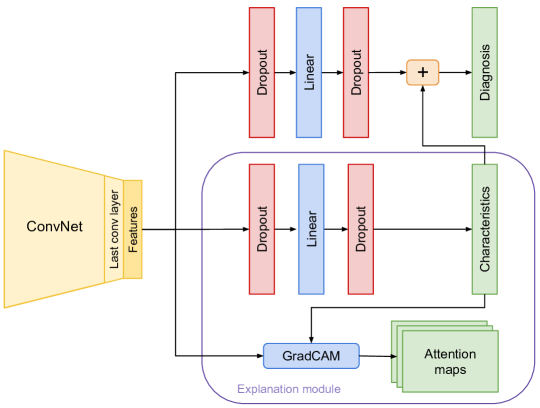
Second, we introduce DermX – a novel, clinically-inspired ConvNet architecture for skin disease diagnosis and explanations. This architecture is illustrated in Figure 1. Following the clinical approach of explaining dermatological diagnoses through skin lesion characteristics, DermX first identifies relevant characteristics in the image (which can also be interpreted as diagnosis explanations), and then relies on them, alongside the image features, to diagnose the case. Using Grad-CAM (Selvaraju et al., 2017), we then localize the predicted characteristics in the image. We validate the plausibility and faithfulness of our explanations using DermXDB as the gold standard for explanations 111The DermXDB dataset and the implementation of DermX and DermX+ are available at https://github.com/ralucaj/dermx.
1.1 Related work
Machine learning-based dermatological diagnosis systems have been widely investigated, achieving results on par with human experts (Esteva et al., 2017; Tschandl et al., 2020; Jain et al., 2021). These advances in automated diagnosis of skin lesions were made possible in part by the emergence of various dermatological datasets, which contain images diagnosed by medical experts (Tschandl et al., 2018; DermNetNZ, 2021; Sun et al., 2016). The widely used ISIC dataset (Tschandl et al., 2018) also includes lesion segmentations that can partially serve as a basis for objective explanation measurement. However, these segmentations were not collected to explain the diagnosis, but rather to localize the lesions. This shortcoming becomes critical in diseases such as actinic keratosis, where the area surrounding the lesion is just as important for the diagnosis as the lesion itself (Tschandl et al., 2020).
Explainability is an important topic in machine learning in general and in medical imaging in particular. Saliency-based explainability methods, e.g. Grad-CAM (Selvaraju et al., 2017), are often used as a way to investigate if the models learn relevant features (Tschandl et al., 2020; Zhang et al., 2019; Barata et al., 2021). Other explainability methods, such as LIME (Ribeiro et al., 2016), Kernel-SHAP (Lundberg and Lee, 2017), and Sharp-LIME (Graziani et al., 2021) are less commonly used in the medical imaging literature.
Two works, one in natural language processing and the other in dermatological imaging, have a similar approach to explainability as ours. Within natural language processing, Mathew et al. (2021) propose a framework that explains hateful speech identification. Human readers were asked to identify the most important tokens in a sentence for the prediction of hateful speech. Then, the explanation plausibility and faithfulness of the model-generated explanations were quantified by comparing to the human annotations. Within dermatological image analysis, Barata et al. (2021) investigate how hierarchical taxonomies for skin lesion classification can be used to improve ConvNet skin cancer diagnosis capabilities. They train networks to follow the hierarchical classification of diseases in their prediction, and to focus on relevant parts of the image.
In this work, we combine the two approaches by detecting diagnosis-explaining characteristics, each with its own localization, and train two ConvNets to focus on the relevant part of the image for each characteristic. Both networks are evaluated for the plausibility and faithfulness of their explanations.
| Acne | Actinic keratosis | Psoriasis | Seborrheic dermatitis | Viral warts | Vitiligo | Total | |
|---|---|---|---|---|---|---|---|
| DermNetNZ | 58 | 48 | 47 | 15 | 46 | 77 | 291 |
| SD-260 | 61 | 43 | 51 | 79 | 20 | 9 | 263 |
| Total | 119 | 91 | 98 | 94 | 66 | 86 | 554 |
2 Material and methods
2.1 Explainability dataset
To enable explainable modeling, we first identified the clinically relevant explanation taxonomy, designed an appropriate annotation protocol, and collected expert-labeled data. This resulted in DermXDB: a novel dermatological explainability dataset designed to enable the training of the proposed end-to-end explainable models and quantitative explainability evaluation. The dataset consists of 554 images that belong to one of the following classes: acne, actinic keratosis, psoriasis, seborrheic dermatitis, viral warts, or vitiligo. Images were sourced from DermNetNZ (DermNetNZ, 2021) and SD-260 (Sun et al., 2016) with written permission from the owners. The distribution over datasets and diseases is described in Table 1. All images were evaluated by eight board-certified dermatologists, with between four and twelve years of clinical experience. Each evaluation consists of a diagnosis and supporting explanations in the form of global tags, localizable characteristics, their segmentations, and additional descriptive terms for basic characteristics.
The development of this dataset included several steps. First, we performed several experiments to define the target diseases and the nature of the explanations. Second, we selected the six diagnoses and defined the explanation taxonomy illustrated in Figure 3. Third, the labellers were allowed a short period of time to get accustomed to the annotation protocol and the labeling tool by evaluating images from an internal dataset. Finally, DermXDB images were selected and sent to the dermatologists for labeling.
Preliminary investigation
Nine diseases were initially investigated: psoriasis, rosacea, vitiligo, seborrheic dermatitis, pityriasis rosea, viral warts, actinic keratosis, acne, and impetigo. These diseases were chosen based on prevalence (Lim et al., 2017) and by the expectation that they could be diagnosed using images as the only source of patient information (Oakley, 2017). Dermatologists were asked to diagnose and explain their decision in free-text for over 100 images. During this step, dermatologists could see the original diagnosis of the image, but had the option to disagree with it. This step led to the exclusion of rosacea, impetigo, and pityriasis rosea from future experiments due to the difficulty in diagnosing them in the absence of the patient medical history. It also led to the introduction of a structured ontology for the diagnosis explanations to avoid manual processing of typos and synonyms.
Diagnosis and explanation ontology
Preliminary investigations also highlighted the importance of having a consistent explanation ontology. After analyzing free-text explanations, they were formalized as an extended list of skin lesion characteristics (Nast et al., 2016). The characteristics set was selected to sufficiently explain the six target diseases (Oakley, 2017). With the help of two senior dermatologists, several other relevant characteristics were added.
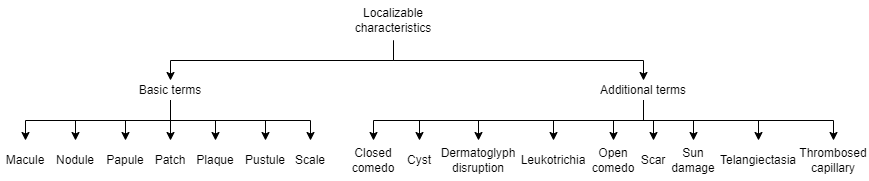
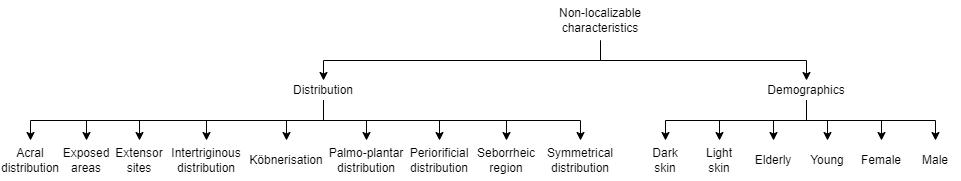
The resulting set of characteristics was split into non-localizable characteristics (e.g. age or sex), localizable characteristics (e.g. plaque or open comedo), and additional descriptive terms (e.g. red or well-circumscribed), according to the International League of Dermatological Societies’ classification (Nast et al., 2016). Figure 3 illustrates the final DermXDB explanation taxonomy, while more information about the other two types of labels is available in Appendix Figures 11 and 12.
Annotation Protocol
Dermatologists were first asked to diagnose the image, and then tag it with characteristics that explain their diagnosis. No information about the gold standard diagnosis or the disease distribution was made available. If the dermatologists were unable to evaluate the image due to poor quality, or if the image depicted a different disease than the target conditions, they had the option to discard it.
Dermatologists could then select diagnosis-supporting non-localizable characteristics as global image tags. Afterwards, they could select and outline localizable characteristics. Dermatologists were instructed to highlight all relevant areas for each characteristic, and were only allowed to include irrelevant areas if separating them from the characteristic was too time consuming or difficult. In other words, they were instructed to favor sensitivity over specificity. Finally, basic terms (as defined in Figure 3) could be enriched with additional descriptive terms when required for the diagnosis explanation. Once all tags and characteristics were added, the image could be marked as complete.
After the taxonomy and annotation protocol were defined, all dermatologists underwent two rounds of on-boarding in Darwin, a browser-based labeling tool (V7-Labs, 2021). A screenshot of the labeling interface is shown in Appendix Figure 13. Following this, they were asked to annotate a set of 630 images from the DermNetNZ and SD-260 datasets.
Data cleaning
Once annotations were performed, the dataset went through two cleanup steps. First, to avoid ambiguities in the dataset, annotations with diagnoses outside the target conditions were discarded. This resulted in 33 images being removed from the dataset because all eight dermatologists tagged these as ‘other disease’, e.g. acne keloidalis nuchae. The second step was to manually group images from the same patients. For all patients with more than one image, only the first image based on alphabetical order was kept. After cleanup, 554 images were left. Out of all evaluations performed on these images, 150 were discarded due to reports of low image quality, resulting in 4202 individual evaluations.
2.2 Explainable models
We propose two inherently explainable models for joint prediction of diagnosis and explanations. First, we design DermX: an end-to-end clinically-inspired architecture for explainable diagnosis, and train it on the reference diagnosis and expert-identified explanation labels. Next, we build an enhanced model that also includes learning of the explanation localization – DermX+. In the following, we the provide detailed description of each of the models.
DermX model
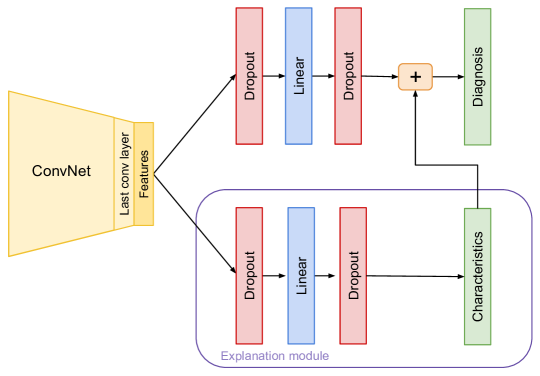
We propose a clinically-inspired model trained using the data described above. Following the multi-task learning paradigm, the model learns how to predict a diagnosis and its supporting characteristics at the same time. Using a ConvNet as an image feature extractor, we flatten and pass these features into the two prediction modules. The explainability module passes the features through a dense block, composed of a dropout layer, a linear layer with ReLU activations, and another dropout layer. This output is then passed into a linear layer with ten neurons and a logistic function is applied to each to give the probabilistic multi-label predictions, i.e. multiple characteristics can be predicted at the same time. The diagnosis module processes the image features using a similar dense block, after which they are concatenated to the characteristic logits. For this module, the dense block also doubles as a dimensionality reduction component, allowing the image features and the characteristics to have the same order of magnitude. The concatenated features are then passed through a linear layer with six neurons, followed by a softmax function to give our single-label prediction head for diagnoses. Figure 4 illustrates the DermX architecture.
DermX optimizes the loss defined as follows. Let and be the target diagnosis and target characteristics for image in a batch of size , where and denote the diagnosis and characteristic class, and let and be the diagnosis and characteristics predictions, respectively. The loss can then be written as
| (1) |
where is the categorical cross-entropy diagnosis loss defined as
| (2) |
and where is the binary cross-entropy characteristics loss defined as
| (3) |
and where and are hyper-parameters for weighing the relative loss contributions.
DermX+ model
We build on top of the DermX architecture by introducing a guided attention element (Li et al., 2018). Figure 5 highlights the difference between DermX and DermX+, namely the addition of a characteristic attention component.
In addition to the two losses optimized by DermX and described in Equation 1, the DermX+ model also optimizes the attention loss term :
| (4) |
where is the Dice loss for attention
| (5) |
with being the attention map, and being the fuzzy localization label, both for image and characteristic .
2.3 Model training and validation
Data
Given the limited size of the dataset, we create a stratified ten-fold cross-validation setup to train explainable models, leading to approximately 500 training images and 50 test images for each fold. Results presented in this paper are aggregated over all ten folds. For diagnosis prediction we use the gold standard diagnosis label, as defined in the source datasets. A characteristic was marked as relevant for a diagnosis if at least one dermatologist included the characteristic in their decision explanation. Characteristic labels for localization were created as aggregated fuzzy maps, i.e. each pixel value in a mask was generated as a fraction of how many dermatologists included it in their characteristic localization. Only characteristics selected for the correct diagnosis with regard to the gold standard were included both in defining the presence of a characteristic and in the fuzzy map aggregation. This way, we avoid introducing noise due to a mismatch between the diagnosis a dermatologist was explaining and the diagnosis label used to train the network. Additionally, we exclude characteristics that appear in fewer than 30 samples throughout the dataset and characteristics with an inter-rater F1 score below 0.30. We thus focus on closed comedo, dermatoglyph disruption, open comedo, papule, patch, plaque, pustule, scale, scar, and sun damage.
Implementation details
In all experiments, we use an EfficientNet-B2 (Tan and Le, 2019) ConvNet pre-trained on the ImageNet image recognition dataset (Deng et al., 2009) for feature extraction, with all layers fine-tuned on the DermXDB data. Both models were trained for 93 epochs using the AdamW optimizer (Loshchilov and Hutter, 2018), the cosine annealing with warm restarts learning rate scheduler (Loshchilov and Hutter, 2016), and a starting learning rate of 0.0005. Within the dense block we use linear layers with 64 neurons, dropout layers with 0.2 probability, and ReLU activations. DermX is trained with , , while DermX+ uses , , and . Further information about the hyper-parameters used for training and other implementation details can be found in Appendix Table 12.
2.4 Explainability evaluation
We measure the performance with regard to the image diagnosis of both our dermatologists and our trained models using the F1 score, sensitivity, and specificity. The same metrics are used to quantify the inter-rater agreement on image diagnosis and characteristics selection between dermatologists. The model performance on characteristics is measured with regard to the fuzzy fusion label for characteristics using the same three metrics. F1 score (also known as the Dice-Sørensen coefficient for pixel-level segmentation), sensitivity, and specificity are also used to measure the inter-rater agreement for the localizable characteristics region outlining overlap. All values are reported as the mean and the standard deviation (std) over the 10 folds.
We define the explainability of our models as having two components: plausibility and faithfulness. For plausibility, we focus on both the identification and the localization of characteristics. First, we measure the F1 score, sensitivity, and specificity per characteristic to measure the models’ ability to correctly identify the right explanations. Similar to Mathew et al. (2021), we compare the Grad-CAM activations per characteristic with the fuzzy attention maps for each characteristic, and measure their similarity using the F1 score, sensitivity, and specificity. All pixel-based metrics are implemented using fuzzy logic, as follows:
| (6) |
| (7) |
| (8) |
where represents the pixels included in the analysis, defines the class activations, and represents the fuzzy label maps.
Following the comprehensiveness evaluation described by DeYoung et al. (2020), we measure the faithfulness of our models through the use of contrastive examples. Given a model , an input image , a set of explanation outlines , a contrastive image where all areas marked as an explanation for the image were occluded, and the class probability output for the predicted class on the original input we measure the faithfulness as
| (9) |
In other words, the faithfulness describes what impact removing the explanations from the image would have on the decision of model . We decided not to include the sufficiency metric as it would lead to out-of-distribution images, such as a blank background with a plaque or a couple of pustules.
Finally, given the intrinsic disagreement between experts within medical fields, we postulate that explainable models should be able to properly argue their decisions, regardless of whether it matches the gold standard or not. Similar to how dermatologists may debate the correct diagnosis for a case by highlighting different explanations that support their decision, we expect an explainable model to do the same. However, as we do not always have the gold standard explanation for a wrong diagnosis, we need to define a basic set of explanations for any disease. To this end, we define the expected explanation as the prevalence of each characteristic within the dermatologists explanations for a diagnosis (Appendix Table 11). Then, for the wrongly predicted diagnoses we compare the set of characteristics associated with that prediction with the expected explanation for the predicted diagnosis. For example, a case incorrectly classified as psoriasis is expected to be explained using one or several of papule, plaque, and scale, which are commonly used by dermatologists in their explanations of psoriasis. We evaluate how the model explanation for wrong diagnoses by computing the precision of the model’s explanations with regard to the expected explanation for a diagnosis.
3 Results
3.1 DermXDB analysis
We first analyzed the data focusing on dermatologist performance with regard to the gold standard diagnosis and their inter-rater agreement on both diagnoses and supporting characteristics. A total of 554 images were included in this analysis, each with eight evaluations performed by board-certified dermatologists.
The dermatologist diagnostic performance in terms of mean F1 score with regard to the gold standard varies between 0.75 for seborrheic dermatitis and 0.95 for vitiligo. Aggregated F1 scores can be seen in Table 4. A full description of the dermatologist performance with regard to the gold standard is available in Appendix Table 8.
| F1 score | Average selection | |
|---|---|---|
| Dermatoglyph disruption | ||
| Closed comedo | ||
| Open comedo | ||
| Papule | ||
| Patch | ||
| Plaque | ||
| Pustule | ||
| Scale | ||
| Scar | ||
| Sun damage | ||
| Mean |
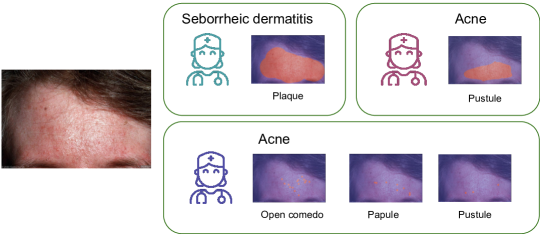
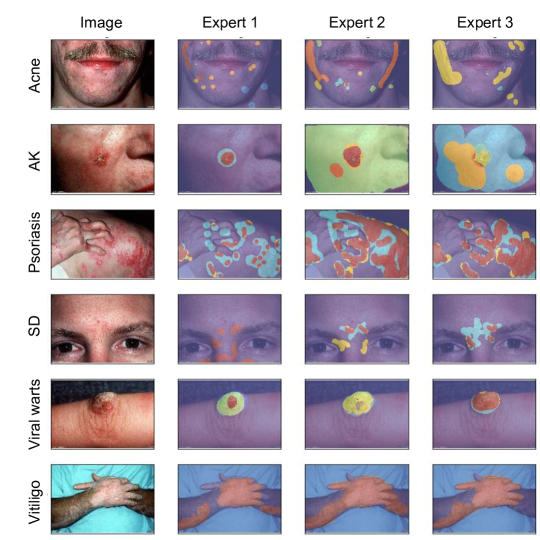
Inter-rater agreement on characteristics, as described in Table 2, varies significantly more, partially due to the lower number of selections per class. Most basic terms display high levels of agreement, with F1 scores between 0.67 and 0.89. The exceptions are macule with an F1 score of 0.12 and nodule with an F1 score of 0.17, both also displaying low selection rates. Several additional terms, such as open and closed comedones, display levels of agreement similar to the basic terms. Fig. 6 illustrates an example of disagreement between three dermatologists on the location of supporting characteristics on one random case for each disease. Additional metrics for the full set of characteristics are described in Appendix Table 9.
Outlining characteristics is a more difficult task, as confirmed by the low inter-rater F1 scores reported in Table 3. The lower F1 values can also be explained by how difficult outlining small or poorly circumscribed characteristics is. In terms of sensitivity, we notice the same trend as in binary agreement: dermatologists tend to agree more on the basic terms. Metrics for the full set of localizable characteristics are presented in Appendix Table 10.
| F1 score | Sensitivity | Specificity | |
|---|---|---|---|
| Dermatoglyph | |||
| disruption | |||
| Closed comedo | |||
| Open comedo | |||
| Papule | |||
| Patch | |||
| Plaque | |||
| Pustule | |||
| Scale | |||
| Scar | |||
| Sun damage | |||
| Mean |
3.2 Explainable model
| Dx | DermX | DermX+ | Expert | |
|---|---|---|---|---|
| Acne | ||||
| Actinic keratosis | ||||
| Psoriasis | ||||
| Seborrheic dermatitis | ||||
| Viral warts | ||||
| Vitiligo | ||||
| Mean |
| DermX | DermX+ | Expert | Samples | |
|---|---|---|---|---|
| Closed comedo | 96 | |||
| Dermatoglyph disruption | 54 | |||
| Open comedo | 110 | |||
| Papule | 278 | |||
| Patch | 249 | |||
| Plaque | 352 | |||
| Pustule | 106 | |||
| Scale | 275 | |||
| Scar | 115 | |||
| Sun damage | 78 | |||
| Mean |
| Sensitivity | Specificity | F1 score | Samples | |
|---|---|---|---|---|
| Closed comedo | 75 | |||
| Dermatoglyph disruption | 36 | |||
| Open comedo | 90 | |||
| Papule | 219 | |||
| Patch | 188 | |||
| Plaque | 314 | |||
| Pustule | 88 | |||
| Scale | 222 | |||
| Scar | 90 | |||
| Sun damage | 50 | |||
| Mean |
| Sensitivity | Specificity | F1 score | Samples | |
|---|---|---|---|---|
| Closed comedo | 63 | |||
| Dermatoglyph disruption | 34 | |||
| Open comedo | 93 | |||
| Papule | 232 | |||
| Patch | 191 | |||
| Plaque | 312 | |||
| Pustule | 91 | |||
| Scale | 224 | |||
| Scar | 93 | |||
| Sun damage | 47 | |||
| Mean |
We trained a clinically-inspired model from Figure 1 (DermX), and the same model architecture trained with guided attention (DermX+) for characteristics localization. We also train a diagnosis-only model (Dx) to check whether adding explanations impact the diagnosis performance of DermX and DermX+. Table 4 compares the diagnostic performance between all three models and the dermatologists with regard to the gold standard diagnosis. More information about their diagnostic performance is presented in B. For comparison, we trained a diagnosis-only model with a ResNet50 (He et al., 2016) base to validate the choice of architecture, and a diagnosis-only model trained with proportional class weights. The ResNet-based model achieved a macro F1-score of , while the weighted class model showed a similar macro F1-score of . More information about these two models is available in Appendix Table 13. Additionally, we trained four interpretable models on the characteristics data for diagnosis prediction: a logistic regression model, a decision tree, a k-nearest neighbor with five neighbors, and a categorical naive Bayes models. These models obtained macro F1 scores of , , , and , respectively.
All models display similar F1 scores on all six diseases. The best results are obtained for vitiligo and acne, two disease classes where dermatologists also display high F1 score values. Seborrheic dermatitis on the other hand seems to be a difficult disease class for both dermatologists and models. For the rest of the results section we will focus on DermX and DermX+.
In terms of explanation plausibility, we look at both the identification of explanations, defined as the ability to detect the same characteristics as a dermatologist, and at their localization in the image. A comparison of F1 scores is described in Table 5. The two models perform well for explanation identification, with DermX+ obtaining slightly better results on most characteristics. Compared to dermatologists, the models perform within standard deviation bounds of the inter-rater agreement. Additional metrics are reported in Appendix Tables 16 and 17.
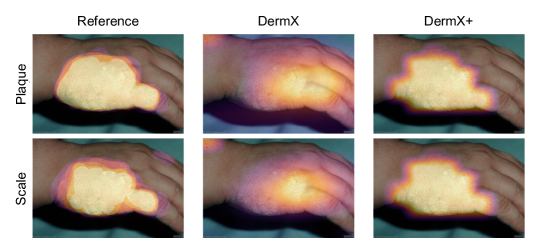
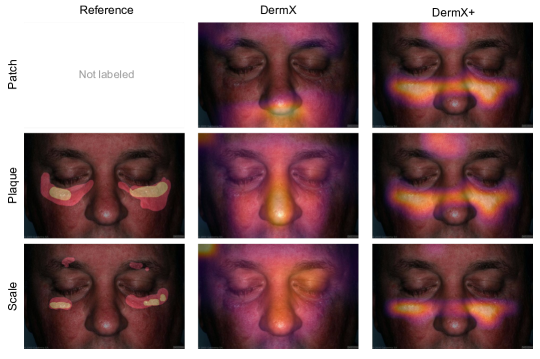
The localization plausibility of the models’ explanation is quantified in Tables 6 and 7, with more statistics being presented in Appendix Tables 18, 19, 20, and 21. DermX performs adequately well on all characteristics. DermX+ is better at localizing large characteristics, e.g. patches or scales, but performs poorly on smaller characteristics, e.g. open and closed comedones. Dermatologists F1 scores indicate that the two models are, in some characteristics, within standard deviation of the inter-rater agreement. For other characteristics, such as dermatoglyph disruption for DermX and pustule for DermX+, the model performance is below the expert inter-rater agreement. Figure 8 illustrates the explanations given for a correctly predicted psoriasis case by DermX and DermX+, respectively, while Figure 9 shows the explanations given by the two ConvNets for a misclassified psoriasis case.
Explanation precision scores for the correct diagnosis prediction were computed with regard to the dermatologist labels. The resulting values are for DermX and for DermX+. On the wrong diagnosis prediction, DermX precision is , while DermX+ precision is . Mean faithfulness results are for DermX and for DermX+.
4 Discussion
To the best of our knowledge, DermX is the first end-to-end framework created for the purpose of explaining automated dermatological diagnoses. The two ConvNets we introduce, DermX and DermX+, mimic the dermatological approach to diagnosing skin conditions: first they recognize supporting characteristics, then they use these characteristics as well as other high level information to arrive at a diagnosis. In addition to identifying supporting characteristics as explanations to a diagnosis, DermX+ also learns the localization of the explanations via the guided attention loss. The decision to use an attention mechanism for localization rather than a semantic segmentation approach was guided by the design of the annotation protocol. Because dermatologists were instructed to highlight explanation regions in an image with a focus on sensitivity instead of specificity, the resulting outlines are not well suited as segmentation masks. For this work to be possible, we collected diagnoses and supporting characteristics for 554 images from eight board-certified dermatologists.
During the process of collecting the DermXDB data, we found that dermatologists often focus on different characteristics when diagnosing a case. While most explanations for diseases display a set of common characteristics, such as scales, plaques, and papules for psoriasis, there is also a long tail of relevant characteristics that are not always selected. In addition, we found that inter-rater agreement was low for characteristics localization. This may be caused by the difficulty in outlining characteristics with poorly defined boundaries, such as patch, but also by dermatologists differing in their approach to outlining smaller characteristics, such as open and closed comedones.
The contrast between high agreement on diagnoses and low agreement on supporting characteristics illustrates how different experts perceive explanations in different ways. Although they generally agree on the diagnosis, dermatologists focus on different characteristics to explain their decision. To properly evaluate a model’s explanations, we must therefore consider the opinions of multiple experts. Moreover, this intrinsic variability in how experts approach explanations lends more urgency to the need for quantifiable explanation methods.
From a modeling perspective, our results contradict the common adage that there must be a trade-off between predictive power and explainability. DermX and DermX+ both report the same diagnosis performance as a standard diagnosis-only ConvNet, while also offering plausible explanations for their decisions. Even in cases where they predict the wrong diagnosis, both models provide arguments that make sense for their prediction. Most explanations given by both models are within standard deviation of the inter-rater agreement on characteristics, suggesting that either model may function as a second opinion with realistic decision explanations.
When compared to interpretable models trained on the characteristics data, both DermX and DermX+ obtain a diagnosis performance within standard deviation of the models using manually labeled features. None of the models we trained obtains a diagnosis performance as high as that of experts. We postulate that this is due to the difficulty of the dataset, as shown by the inter-rater agreement in Table 4, and due to the limited amount of training data. On the other hand, our results are on par with the diagnosis accuracy reported by other research groups using dermatological clinical photography, which varies between 56.7% on 134 classes (Han et al., 2020) and 86.53% on four classes (Burlina et al., 2019).
Our localization results for both models are lower than the inter-rater agreement on expert-derived maps for most characteristics. This may in part be due to the low inter-rater agreement on the localization data, and in part due to the small scale at which the maps were computed (nine by nine pixels for the EfficientNet-B2 architecture). However, the high sensitivity values show that these maps are often good enough to give a visual hint as to the location of the characteristic in an image. Such a hint would be useful in cases where an expert using DermX or DermX+ as a second opinion did not notice that characteristic. Comparing the two models, DermX+ displays lower overall F1 scores than DermX, while showcasing higher overall specificity and high sensitivity on large characteristics. This may be explained by its training target: dermatologist attention maps were linearly scaled down to the size of the feature maps, which may have reduced the target attention map of small characteristics to an almost empty mask. Another possible explanation is DermX’s reliance on the sometimes noisy localization data. In particular, for characteristics smaller than 1cm (closed comedo, open comedo, papule, and pustule), DermX+ is clearly outperformed by DermX due to the lower specificity and higher sensitivity of DermX. In the future, we plan on investigating different ways of downscaling the masks, and to increase the feature map size to take advantage of the high resolution gold standard attention maps.
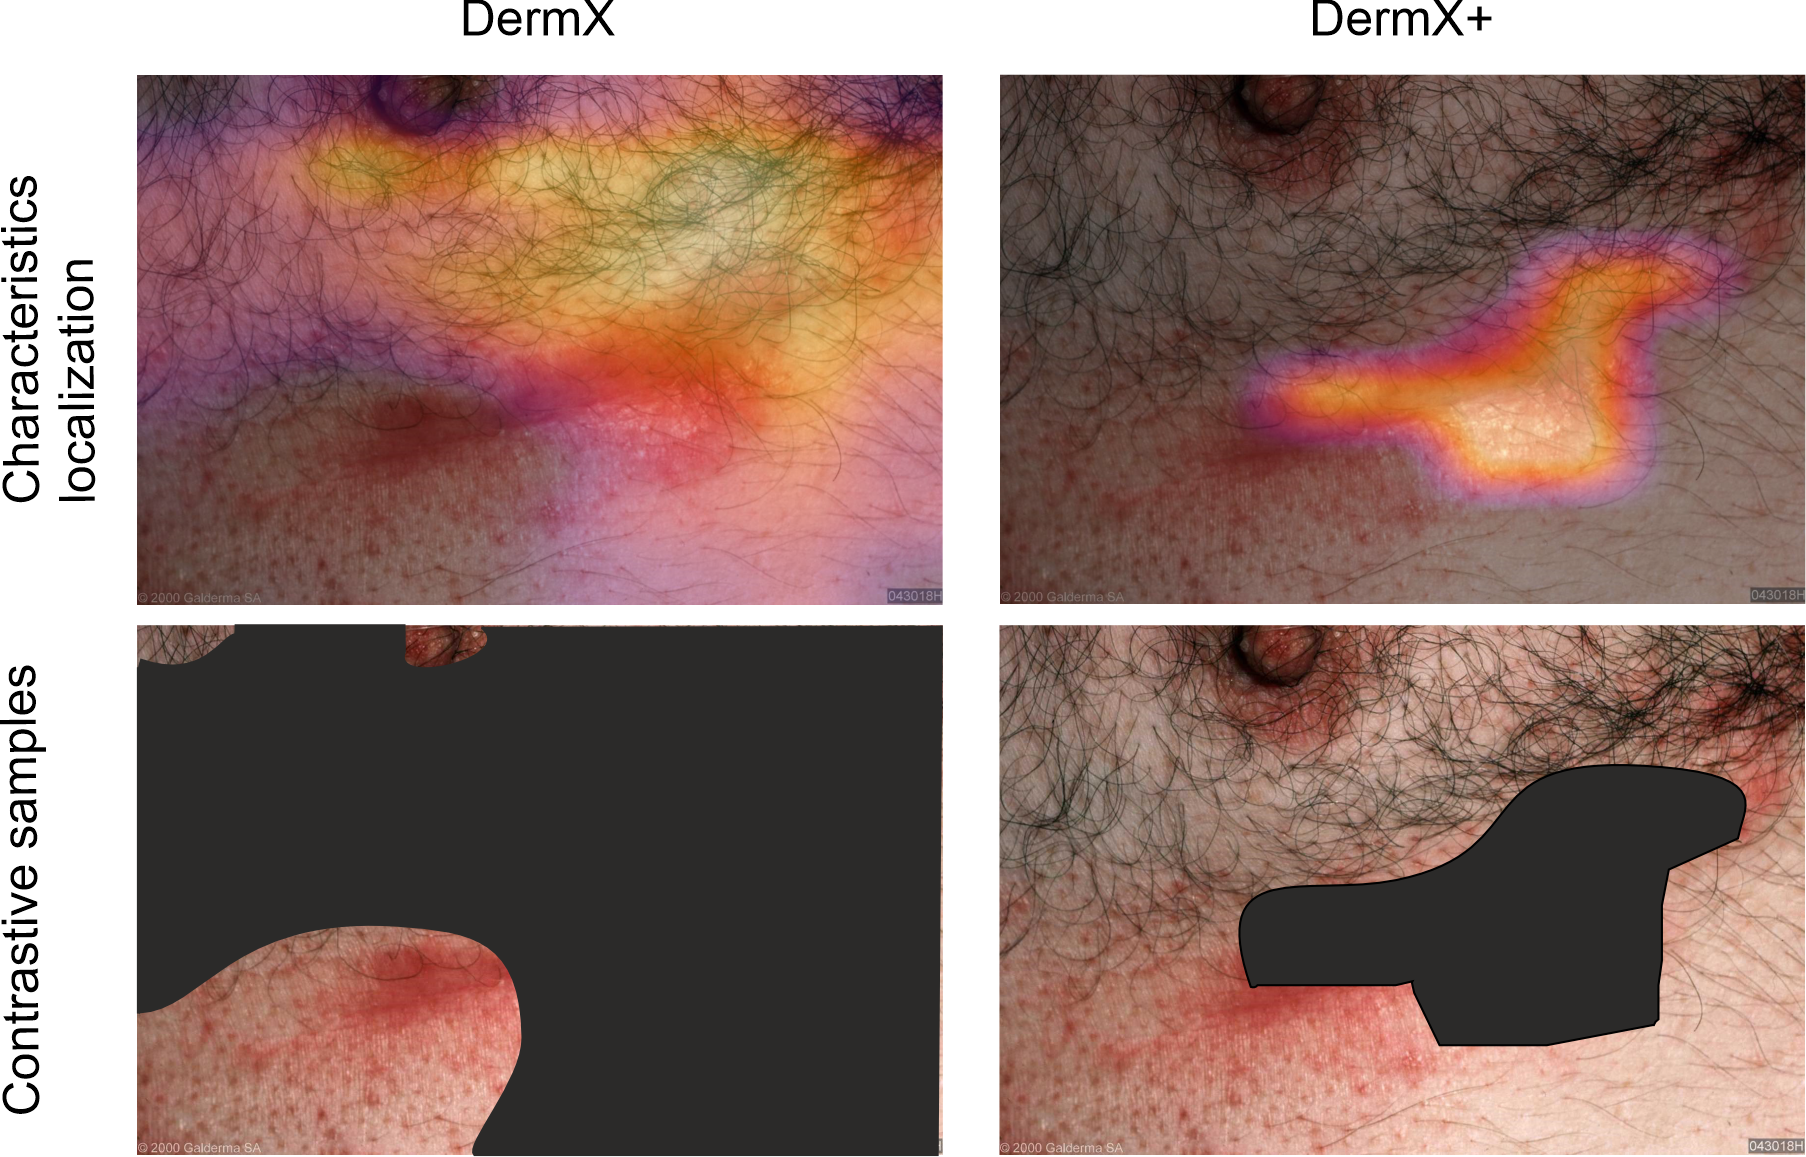
Mean faithfulness scores above zero for both models prove that the characteristic localizations are indeed explanations about the diagnosis decision mechanisms of the models. DermX+, a more specific model in terms of characteristic localization, has lower faithfulness scores than DermX, which tends to include adjacent regions in its localizations. Figure 10 showcases the impact a model’s specificity and sensitivity have on the contrastive samples, and therefore on the faithfulness metric. In this example, the contrastive sample created by DermX+ still displays image-level non-localizable characteristics, information which is occluded in the DermX contrastive sample. This further confirms the importance of image-level tags in skin lesion diagnosis, e.g. by noticing that acne is predominantly located on the face or upper trunk, or that actinic keratosis most commonly affects elderly people.
This work opens many new research avenues in the domain of medical image diagnosis explainability. From a dermatological data perspective, we plan on adding more diseases and supporting characteristics to DermXDB. The annotation protocol developed as part of DermXDB can serve as an inspiration not only for explaining other dermatological diseases, but also for different radiology and pathology investigations. In radiology, imaging findings are routinely recorded, including the supporting characteristics for the diagnosis. For example, the malignancy of a lesion seen on a mammogram could be supported by localized characteristics such as calcifications and dense tissue (Sickles et al., 2013). The network architectures we proposed could also be applied to learning the supporting radiological findings as explanations to diagnoses provided appropriately labeled datasets. From a modeling perspective, we will focus on leveraging the full potential of DermXDB by adding image-level explanations to the diagnosis models, and by incorporating the additional descriptive terms into the explanation setup. More work can be done in improving the characteristic localization. We will be focusing in particular on introducing the adversarial loss described in Li et al. (2018) for semi-supervised attention guidance. Another approach we will be to train object detection networks (Tan et al., 2020; Redmon and Farhadi, 2018) to detect the supporting characteristics alongside the diagnosis. Once the localization reaches a higher performance, a true test of the DermX architecture would be to set up a clinical trial where its predictions would be used as a second opinion for health care professionals of various levels of expertise.
5 Conclusions
In this work, we introduce DermX – a novel, clinically-inspired explainable ConvNet architecture for skin lesion diagnosis. We also introduce a variation named DermX+ that adds a guided attention loss such that localization of lesion characteristics becomes a part of the supervised training. We quantify the explanation quality by comparing it with explanations given by board-certified dermatologists with different levels of clinical experience. To facilitate future work, we release this explainability dataset to the public, and describe the annotation protocol used for its creation.
Acknowledgments
Raluca Jalaboi’s work was supported in part by the Danish Innovation Fund under Grant 0153-00154A. Ole Winther’s work was funded in part by the Novo Nordisk Foundation through the Center for Basic Machine Learning Research in Life Science (NNF20OC0062606). Ole Winther acknowledges supporting the Pioneer Centre for AI, DNRF grant number P1.
References
- Hay et al. [2014] Roderick J Hay, Nicole E Johns, Hywel C Williams, Ian W Bolliger, Robert P Dellavalle, David J Margolis, Robin Marks, Luigi Naldi, Martin A Weinstock, Sarah K Wulf, et al. The global burden of skin disease in 2010: an analysis of the prevalence and impact of skin conditions. Journal of Investigative Dermatology, 134(6):1527–1534, 2014.
- Karimkhani et al. [2017] Chante Karimkhani, Robert P. Dellavalle, Luc E. Coffeng, Carsten Flohr, Roderick J. Hay, Sinéad M. Langan, Elaine O. Nsoesie, Alize J. Ferrari, Holly E. Erskine, Jonathan I. Silverberg, Theo Vos, and Mohsen Naghavi. Global Skin Disease Morbidity and Mortality: An Update From the Global Burden of Disease Study 2013. JAMA Dermatology, 153(5):406–412, 05 2017. ISSN 2168-6068. doi:10.1001/jamadermatol.2016.5538.
- Federman et al. [1999] Daniel G Federman, John Concato, and Robert S Kirsner. Comparison of dermatologic diagnoses by primary care practitioners and dermatologists: a review of the literature. Archives of Family Medicine, 8(2):170, 1999.
- Feng et al. [2018] Hao Feng, Juliana Berk-Krauss, Paula W Feng, and Jennifer A Stein. Comparison of dermatologist density between urban and rural counties in the United States. JAMA Dermatology, 154(11):1265–1271, 2018.
- Kringos et al. [2015] Dionne S Kringos, Wienke GW Boerma, Allen Hutchinson, Richard B Saltman, World Health Organization, et al. Building primary care in a changing Europe. World Health Organization. Regional Office for Europe, 2015.
- Thomsen et al. [2020] Kenneth Thomsen, Lars Iversen, Therese Louise Titlestad, and Ole Winther. Systematic review of machine learning for diagnosis and prognosis in dermatology. Journal of Dermatological Treatment, 31(5):496–510, 2020.
- Esteva et al. [2017] Andre Esteva, Brett Kuprel, Roberto A Novoa, Justin Ko, Susan M Swetter, Helen M Blau, and Sebastian Thrun. Dermatologist-level classification of skin cancer with deep neural networks. Nature, 542(7639):115–118, 2017.
- Tschandl et al. [2020] Philipp Tschandl, Christoph Rinner, Zoe Apalla, Giuseppe Argenziano, Noel Codella, Allan Halpern, Monika Janda, Aimilios Lallas, Caterina Longo, Josep Malvehy, et al. Human–computer collaboration for skin cancer recognition. Nature Medicine, 26(8):1229–1234, 2020.
- Jain et al. [2021] Ayush Jain, David Way, Vishakha Gupta, Yi Gao, Guilherme de Oliveira Marinho, Jay Hartford, Rory Sayres, Kimberly Kanada, Clara Eng, Kunal Nagpal, et al. Development and assessment of an artificial intelligence–based tool for skin condition diagnosis by primary care physicians and nurse practitioners in teledermatology practices. JAMA Network Open, 4(4):e217249–e217249, 2021.
- Kelly et al. [2019] Christopher J Kelly, Alan Karthikesalingam, Mustafa Suleyman, Greg Corrado, and Dominic King. Key challenges for delivering clinical impact with artificial intelligence. BMC Medicine, 17(1):1–9, 2019.
- Goodman and Flaxman [2017] Bryce Goodman and Seth Flaxman. European union regulations on algorithmic decision-making and a “right to explanation”. AI magazine, 38(3):50–57, 2017.
- Topol [2019] Eric J Topol. High-performance medicine: the convergence of human and artificial intelligence. 25(1):44–56, 2019.
- Jacovi and Goldberg [2020] Alon Jacovi and Yoav Goldberg. Towards faithfully interpretable nlp systems: How should we define and evaluate faithfulness? In Proceedings of the 58th Annual Meeting of the Association for Computational Linguistics, pages 4198–4205, 2020.
- Simonyan et al. [2014] Karen Simonyan, Andrea Vedaldi, and Andrew Zisserman. Deep inside convolutional networks: Visualising image classification models and saliency maps, 2014.
- Selvaraju et al. [2017] Ramprasaath R Selvaraju, Michael Cogswell, Abhishek Das, Ramakrishna Vedantam, Devi Parikh, and Dhruv Batra. Grad-CAM: Visual explanations from deep networks via gradient-based localization. In Proceedings of the IEEE International Conference on Computer Vision, pages 618–626, 2017.
- Ribeiro et al. [2016] Marco Tulio Ribeiro, Sameer Singh, and Carlos Guestrin. "Why should i trust you?" Explaining the predictions of any classifier. In Proceedings of the 22nd ACM SIGKDD international conference on knowledge discovery and data mining, pages 1135–1144, 2016.
- Singh et al. [2020] Amitojdeep Singh, Sourya Sengupta, and Vasudevan Lakshminarayanan. Explainable deep learning models in medical image analysis. Journal of Imaging, 6(6):52, 2020.
- Adebayo et al. [2018] Julius Adebayo, Justin Gilmer, Michael Muelly, Ian Goodfellow, Moritz Hardt, and Been Kim. Sanity checks for saliency maps. In Proceedings of the 32nd International Conference on Neural Information Processing Systems, pages 9525–9536, 2018.
- DermNetNZ [2021] DermNetNZ. Dermnetnz. https://dermnetnz.org/, 2021. Accessed: 2021-04-01.
- Sun et al. [2016] Xiaoxiao Sun, Jufeng Yang, Ming Sun, and Kai Wang. A benchmark for automatic visual classification of clinical skin disease images. In European Conference on Computer Vision, pages 206–222. Springer, 2016.
- Tschandl et al. [2018] Philipp Tschandl, Cliff Rosendahl, and Harald Kittler. The HAM10000 dataset, a large collection of multi-source dermatoscopic images of common pigmented skin lesions. Scientific Data, 5(1):1–9, 2018.
- Nast et al. [2016] Alexander Nast, Chris E M Griffiths, Roderick Hay, Wolfram Sterry, and Jean L Bolognia. The 2016 International League of Dermatological Societies’ revised glossary for the description of cutaneous lesions. British Journal of Dermatology, 174(6):1351–1358, 2016.
- Oakley [2017] Amanda Oakley. Dermatology Made Easy. Scion Publishing Ltd, The Old Hayloft, Vantage Business Park, Bloxham Road, Banbury OX16 9UX, UK, 2017.
- Zhang et al. [2019] Jianpeng Zhang, Yutong Xie, Yong Xia, and Chunhua Shen. Attention residual learning for skin lesion classification. IEEE transactions on medical imaging, 38(9):2092–2103, 2019.
- Barata et al. [2021] Catarina Barata, M Emre Celebi, and Jorge S Marques. Explainable skin lesion diagnosis using taxonomies. Pattern Recognition, 110:107413, 2021.
- Lundberg and Lee [2017] Scott M Lundberg and Su-In Lee. A unified approach to interpreting model predictions. In I. Guyon, U. V. Luxburg, S. Bengio, H. Wallach, R. Fergus, S. Vishwanathan, and R. Garnett, editors, Advances in Neural Information Processing Systems, volume 30. Curran Associates, Inc., 2017.
- Graziani et al. [2021] Mara Graziani, Iam Palatnik de Sousa, Marley MBR Vellasco, Eduardo Costa da Silva, Henning Müller, and Vincent Andrearczyk. Sharpening local interpretable model-agnostic explanations for histopathology: Improved understandability and reliability. In International Conference on Medical Image Computing and Computer-Assisted Intervention, pages 540–549. Springer, 2021.
- Mathew et al. [2021] Binny Mathew, Punyajoy Saha, Seid Muhie Yimam, Chris Biemann, Pawan Goyal, and Animesh Mukherjee. Hatexplain: A benchmark dataset for explainable hate speech detection. In Proceedings of the AAAI Conference on Artificial Intelligence, volume 35, pages 14867–14875, 2021.
- Lim et al. [2017] Henry W Lim, Scott AB Collins, Jack S Resneck Jr, Jean L Bolognia, Julie A Hodge, Thomas A Rohrer, Marta J Van Beek, David J Margolis, Arthur J Sober, Martin A Weinstock, et al. The burden of skin disease in the united states. Journal of the American Academy of Dermatology, 76(5):958–972, 2017.
- V7-Labs [2021] V7-Labs. Darwin v7-labs. https://darwin.v7labs.com, 2021. Accessed: 2021-05-01.
- Li et al. [2018] Kunpeng Li, Ziyan Wu, Kuan-Chuan Peng, Jan Ernst, and Yun Fu. Tell me where to look: Guided attention inference network. In Proceedings of the IEEE Conference on Computer Vision and Pattern Recognition, pages 9215–9223, 2018.
- Tan and Le [2019] Mingxing Tan and Quoc Le. EfficientNet: Rethinking model scaling for convolutional neural networks. In International Conference on Machine Learning, pages 6105–6114. PMLR, 2019.
- Deng et al. [2009] Jia Deng, Wei Dong, Richard Socher, Li-Jia Li, Kai Li, and Li Fei-Fei. Imagenet: A large-scale hierarchical image database. In 2009 IEEE conference on computer vision and pattern recognition, pages 248–255. Ieee, 2009.
- Loshchilov and Hutter [2018] Ilya Loshchilov and Frank Hutter. Decoupled weight decay regularization. In International Conference on Learning Representations, 2018.
- Loshchilov and Hutter [2016] Ilya Loshchilov and Frank Hutter. Sgdr: Stochastic gradient descent with warm restarts. 08 2016.
- DeYoung et al. [2020] Jay DeYoung, Sarthak Jain, Nazneen Fatema Rajani, Eric Lehman, Caiming Xiong, Richard Socher, and Byron C Wallace. Eraser: A benchmark to evaluate rationalized nlp models. Transactions of the Association for Computational Linguistics, 2020.
- He et al. [2016] Kaiming He, Xiangyu Zhang, Shaoqing Ren, and Jian Sun. Deep residual learning for image recognition. In Proceedings of the IEEE Conference on Computer Vision and Pattern Recognition, pages 770–778, 2016.
- Han et al. [2020] Seung Seog Han, Ilwoo Park, Sung Eun Chang, Woohyung Lim, Myoung Shin Kim, Gyeong Hun Park, Je Byeong Chae, Chang Hun Huh, and Jung-Im Na. Augmented intelligence dermatology: deep neural networks empower medical professionals in diagnosing skin cancer and predicting treatment options for 134 skin disorders. Journal of Investigative Dermatology, 140(9):1753–1761, 2020.
- Burlina et al. [2019] Philippe M Burlina, Neil J Joshi, Elise Ng, Seth D Billings, Alison W Rebman, and John N Aucott. Automated detection of erythema migrans and other confounding skin lesions via deep learning. Computers in biology and medicine, 105:151–156, 2019.
- Sickles et al. [2013] EA Sickles, D’Orsi CJ, Bassett LW, et al. ACR BI-RADS Mammography. In ACR BI-RADS® Atlas, Breast Imaging Reporting and Data System. American College of Radiology, 2013.
- Tan et al. [2020] Mingxing Tan, Ruoming Pang, and Quoc V Le. Efficientdet: Scalable and efficient object detection. In Proceedings of the IEEE/CVF conference on computer vision and pattern recognition, pages 10781–10790, 2020.
- Redmon and Farhadi [2018] Joseph Redmon and Ali Farhadi. Yolov3: An incremental improvement. arXiv preprint arXiv:1804.02767, 2018.
Appendix A Additional dataset information


| F1 score | Sensitivity | Specificity | Average selection | |
|---|---|---|---|---|
| Acne | ||||
| Actinic keratosis | ||||
| Psoriasis | ||||
| Seborrheic dermatitis | ||||
| Viral warts | ||||
| Vitiligo | ||||
| Mean |
| F1 score | Sensitivity | Specificity | Cohen’s kappa | Average selection | |
| Basic terms | |||||
| Macule | |||||
| Nodule | |||||
| Papule | |||||
| Patch | |||||
| Plaque | |||||
| Pustule | |||||
| Scale | |||||
| Additional terms | |||||
| Closed comedo | |||||
| Cyst | |||||
| Dermatoglyph disruption | |||||
| Leukotrichia | |||||
| Open comedo | |||||
| Scar | |||||
| Sun damage | |||||
| Telangiectasia | |||||
| Thrombosed capillaries | |||||
| Mean |
| F1 score | Sensitivity | Specificity | |
| Basic terms | |||
| Macule | |||
| Nodule | |||
| Papule | |||
| Patch | |||
| Plaque | |||
| Pustule | |||
| Scale | |||
| Additional terms | |||
| Closed comedo | |||
| Cyst | |||
| Dermatoglyph disruption | |||
| Leukotrichia | |||
| Open comedo | |||
| Scar | |||
| Sun damage | |||
| Telangiectasia | |||
| Thrombosed capillaries | |||
| Mean |
| Acne | Actinic keratosis | Psoriasis | Seborrheic dermatitis | Viral warts | Vitiligo | |
|---|---|---|---|---|---|---|
| Closed comedo | 0.40 | 0.00 | 0.00 | 0.00 | 0.00 | 0.00 |
| Dermatoglyph disruption | 0.00 | 0.00 | 0.00 | 0.00 | 0.38 | 0.00 |
| Open comedo | 0.49 | 0.00 | 0.00 | 0.01 | 0.00 | 0.00 |
| Papule | 0.70 | 0.13 | 0.18 | 0.04 | 0.65 | 0.00 |
| Patch | 0.02 | 0.32 | 0.02 | 0.24 | 0.00 | 0.97 |
| Plaque | 0.04 | 0.59 | 0.96 | 0.71 | 0.46 | 0.01 |
| Pustule | 0.56 | 0.00 | 0.01 | 0.00 | 0.00 | 0.00 |
| Scale | 0.01 | 0.81 | 0.89 | 0.78 | 0.05 | 0.00 |
| Scar | 0.38 | 0.03 | 0.00 | 0.00 | 0.00 | 0.00 |
| Sun damage | 0.00 | 0.47 | 0.01 | 0.01 | 0.00 | 0.01 |
Appendix B Model training and extended performance
| Hyperparameter | Value |
|---|---|
| Batch size | 32 |
| Rotation | 10 |
| Zoom | 0.15 |
| Brightness | 0.35 |
| Contrast | 0.20 |
| Saturation | 0.20 |
| Scale | (0.85, 1.15) |
| Translate | (0.15, 0.15) |
| Hue | 0.15 |
| Dropout | 0.2 |
| Dx | DxRN | DxW | DermX | DermX+ | Expert | |
|---|---|---|---|---|---|---|
| Acne | ||||||
| Actinic keratosis | ||||||
| Psoriasis | ||||||
| Seborrheic dermatitis | ||||||
| Viral warts | ||||||
| Vitiligo | ||||||
| Mean |
| F1 score | Sensitivity | Specificity | |
|---|---|---|---|
| Acne | |||
| Actinic keratosis | |||
| Psoriasis | |||
| Seborrheic dermatitis | |||
| Viral warts | |||
| Vitiligo | |||
| Mean |
| F1 score | Sensitivity | Specificity | |
|---|---|---|---|
| Acne | |||
| Actinic keratosis | |||
| Psoriasis | |||
| Seborrheic dermatitis | |||
| Viral warts | |||
| Vitiligo | |||
| Mean |
| F1 score | Sensitivity | Specificity | Samples | |
|---|---|---|---|---|
| Closed comedo | 96 | |||
| Dermatoglyph disruption | 54 | |||
| Open comedo | 110 | |||
| Papule | 278 | |||
| Patch | 249 | |||
| Plaque | 352 | |||
| Pustule | 106 | |||
| Scale | 275 | |||
| Scar | 115 | |||
| Sun damage | 78 | |||
| Mean |
| F1 score | Sensitivity | Specificity | Samples | |
|---|---|---|---|---|
| Closed comedo | 75 | |||
| Dermatoglyph disruption | 36 | |||
| Open comedo | 90 | |||
| Papule | 219 | |||
| Patch | 188 | |||
| Plaque | 314 | |||
| Pustule | 88 | |||
| Scale | 222 | |||
| Scar | 90 | |||
| Sun damage | 50 | |||
| Mean |
| F1 score | Sensitivity | Specificity | Samples | |
|---|---|---|---|---|
| Closed comedo | 96 | |||
| Dermatoglyph disruption | 54 | |||
| Open comedo | 110 | |||
| Papule | 278 | |||
| Patch | 249 | |||
| Plaque | 352 | |||
| Pustule | 106 | |||
| Scale | 275 | |||
| Scar | 115 | |||
| Sun damage | 78 | |||
| Mean |
| F1 score | Sensitivity | Specificity | Samples | |
|---|---|---|---|---|
| Closed comedo | 83 | |||
| Dermatoglyph disruption | 34 | |||
| Open comedo | 93 | |||
| Papule | 232 | |||
| Patch | 191 | |||
| Plaque | 312 | |||
| Pustule | 91 | |||
| Scale | 224 | |||
| Scar | 93 | |||
| Sun damage | 47 | |||
| Mean |
| F1 score | Sensitivity | Specificity | Samples | |
|---|---|---|---|---|
| Closed comedo | 96 | |||
| Dermatoglyph disruption | 54 | |||
| Open comedo | 110 | |||
| Papule | 278 | |||
| Patch | 249 | |||
| Plaque | 352 | |||
| Pustule | 106 | |||
| Scale | 275 | |||
| Scar | 115 | |||
| Sun damage | 78 | |||
| Mean |