The Puzzling Story of Flare Inactive Ultra Fast Rotating M dwarfs. II. Searching for radial velocity variations
Abstract
Observations made using TESS revealed a sample of low mass stars which show a periodic modulation on a period d. Surprisingly many of these Ultra Fast Rotating (UFR) stars showed no evidence of flare activity which would be expected from such rapidly rotating stars. We present results from a spectroscopic survey of UFRs using the Nordic Optical Telescope to search for radial velocity variations which could reveal evidence for binarity. Our sample of 29 sources have a photometric period between 0.1-0.2d, cover spectral classes of M0-4V, and show no evidence for flares. We detect only one source with clear radial velocity shifts, with another two having Gaia RUWE values which suggests they are binaries. Further observations reveal the former star possibly contains a brown dwarf companion with a mass of M2>58 MJup and probability P(M2<90 MJup) = 50%. There is no evidence for the companion in our spectra, strengthening the case for a brown dwarf companion. We also examine the folded TESS light curves of all our targets, finding at least two are eclipsing binaries and one which has been contaminated by a spatially nearby Sct star. We estimate that around 1/4 of our targets may have been contaminated by short period variable stars. However, the majority of our targets are consistent with being single, low mass stars whose variability is due to starspots. We outline the possible reasons why they are not flare active despite being such rapid rotators.
keywords:
Physical data and processes: accretion, accretion discs – stars: binaries close – stars: activity – stars: flare – stars: low-mass – stars: magnetic fields1 Introduction
It has long been known that the rotation period of stars increases as they age (e.g. Skumanich, 1972). However, until recently determining the precise rotation period of stars was a laborious and time consuming process. This is because stars were generally observed on a star-by-star basis and had data gaps introduced by diurnal and poor weather effects, which is especially true for stars with rotational periods longer than 4–5 hours. Matters changed with the launch of Kepler (Borucki et al., 2010) which provided the data to measure the rotation period of tens of thousands of stars along the main sequence (e.g. McQuillan et al., 2014). After the initial four year mission, Kepler made a series of observations of fields along the ecliptic plane each lasting several months, with the mission being re-named K2. Studies of open clusters of different ages were able to determine in more detail how the stellar rotation period varies as a function of age and mass (e.g. Rebull et al., 2016). However, binarity can also effect the rotation rate of stars. For example, in a study of stars in the Open Cluster Blanco 1, Gillen et al. (2020) showed that mid-F to mid-K stars which were in binaries have faster rotation rates than single stars of the same type. This suggests the companion reduces angular momentum loss even at ages of 100 Myr.
As stellar activity is related to a stars rotation period (Hartmann & Noyes, 1987; Yang et al., 2017), stars become less magnetically active as they age (see Davenport et al., 2019, and references within). Stellar activity can manifest itself in different ways including: starspots, narrow optical line emission, X-ray emission and flare activity. Although flares have been seen on stars with earlier spectral-types, they appear more common on low mass, fully convective (later than M3/4) stars in particular (e.g. Pettersen, 1989).
Optical flares have been studied on low mass stars using Kepler (e.g. Ramsay et al., 2013; Hawley et al., 2014) and K2 (e.g. Ramsay & Doyle, 2015; Gizis et al., 2017; Doyle et al., 2018). The launch of TESS in April 2018 opened up a window on nearly the whole sky and allowed at least month long photometric observations with 2-min cadence for tens of thousands of stars (Ricker et al., 2015). In a study utilising 2-min cadence lightcurves from TESS, Doyle et al. (2019) conducted an analysis of stellar flares on 149 M dwarfs. During our study, a small group of low mass Ultra Fast Rotating stars (UFRs) were identified which have rotation periods 0.3 d and show low levels of flaring activity. We did not find evidence that the lack of activity is related to stellar age or rotational velocities. Similarly, Gunther et al. (2020) used data taken from the first two months of the TESS mission and found there was a ‘tentative’ decrease in the flare rate for stars with 0.3 d. Given that fast rotating stars should display high levels of activity, why do these rapidly rotating stars show little to no flaring activity?
To address this question further, we made a systematic search for UFRs using all the southern ecliptic 2-min cadence data in Ramsay et al. (2020). Out of 9887 stars brighter than =14 mag and close to the main sequence, 609 were found to be low mass stars with a period 1 d. Of these, only 288 showed at least one flare. For stars with periods 0.4 d, 51% of stars are flare active, whilst for stars with periods 0.2 d the fraction is 11%. Overall, these findings from Ramsay et al. (2020) strengthened the initial findings of Doyle et al. (2019) and Gunther et al. (2020).
In Doyle et al. (2019) and Ramsay et al. (2020) we suggested several reasons why the majority of low mass stars with rotation periods 0.2 d do not appear to show optical flares:
-
1.
They do show low-energy flares, perhaps at bluer wavelengths that would not be detected using TESS (which has a response between 6000–10000 Å). For instance Namekata et al. (2020) show multi-band observations of AD Leo in which one flare was seen in and bands but not . High-cadence photometry of low mass stars with a 0.2 d, especially in the band, could reveal these ‘missing’ flares.
-
2.
The binary system GJ 65, contains two variable stars (UV Cet and BL Cet) which possess dramatically different magnetic field strength and configurations along with varying degrees of activity at different energies (Kochukhov & Lavail, 2017). Shulyak et al. (2017) find evidence that low mass stars with simple dipole fields can have the strongest magnetic fields, whilst those stars with multipole fields cannot generate fields stronger than 4 kG. This suggests the magnetic field configuration of the stars plays an important role in their magnetic activity, perhaps more so than their rotation period or age. Therefore, could the magnetic field configuration be the cause of those UFR showing no or few optical flares?
-
3.
The TESS pixels are 21" square implying that light from spatially nearby stars may dilute the light from the target. If a variable star were nearby then this could contaminate the light curve of the target making the target variable on an unrelated period and also dilute or mask any flares from the target. Similarly other binary stars such as short period contact binaries or cataclysmic variables have light curves which resemble those expected from isolated low mass stars with starspots.
-
4.
Binary stars with orbital periods 4 d are likely to be synchronised (Lurie et al., 2017; Fleming et al., 2019) with stars with the shortest periods likely to be non-spherical due to the tidal force. It is, therefore, possible that the period we detect in the TESS data could be a signature of an orbital period rather than the rotation period of a single star. However, it is not clear why the magnetic activity of both binary components would be suppressed, given that they both co-rotate with the same short period.
To explore these issues further, in a companion paper (Doyle et al., 2022, hereafter referred to as Paper I), we used the VLT/FORS2 instrument to make spectropolarimetric observations of ten UFRs and found that five had a line of sight magnetic field 1–2 kG. However, with only half of our sample having a detectable line of sight magnetic field, and four of those being the more active stars in the sample, it would appear the magnetic field strength may not be the answer to the lack of flaring activity in UFRs. We note, however, that FORS2 low-resolution spectropolarimetry is only sensitive to the component of the magnetic field along the line of sight, averaged over the stellar disk. This quantity may be very small or null, even in the presence of a relatively strong surface field. The lack of detection with FORS2 cannot be used to rule out the present of a magnetic field with a complex morphology. Stronger conclusions could be reached with high S/N, high-resolution spectropolarimetry, exploiting the fact that regions of the stellar disk characterised by different field strength may have different radial velocities, due to stellar rotation, and may be responsible each of them for local Stokes profiles centred at different wavelengths (this is the well known "cross-over" phenomenon already discovered by Babcock, 1951). The average Stokes profiles would still have a null zero-order moment about the line centre (to be interpreted as a zero mean longitudinal field), but the presence of a magnetic field could be revealed by ripples on the Stokes profile that would pass undetected at lower spectral resolution.
In this paper, we search for evidence for binarity in a sample of UFRs. To do this we use the Nordic Optical Telescope (NOT) to obtain spectra of a sample of UFRs made over three days to search for radial velocity variations.
2 Selection of Targets using TESS data
In Ramsay et al. (2020) we reported the results of a search of UFRs in the southern ecliptic hemisphere (TESS Cycle 1) using TESS 2 min cadence data. In this paper we report on a similar study using data from the northern ecliptic hemisphere (TESS Cycle 2).
2.1 Determining Periods and searching for Flares
In summary, we downloaded the calibrated lightcurves of our targets from the MAST data archive111https://archive.stsci.edu/tess/. We used the flux values for PDCSAP_FLUX, which are the Simple Aperture Photometry values, SAP_FLUX, after correction for systematic trends. We removed photometric points which did not have QUALITY=0 flag. To determine the rotation period of the stars, we used the generalised Lomb Scargle (LS, Zechmeister & Kürster, 2009; Press et al, 1992) and Analysis of Variance (AoV, Schwarzenberg-Czerny, 1996) periodograms to identify the most prominent period in each of the stars light curves from each sector. The results from the LS and AoV periodograms were consistent although the significance of the main period could vary between different sectors.
To search for flares in the light curves, we removed the signature of the rotational modulation using a routine in the lightkurve package (Lightkurve Collaboration, 2018). We then searched these flattened light curves for flares using the Altaipony222https://altaipony.readthedocs.io/en/latest suite of software which is an update of the Appaloosa (Davenport, 2016) software package.
In selecting targets to be observed using the NOT we had four main criteria: their visibility from La Palma at the time of the observations; they showed a clear periodic modulation in their TESS 2 min cadence light curve; were 14 mag (we used the Pan-STARRS DR2 catalogue Chambers et al., 2016) and had a position in the Gaia HRD (Gaia Collaboration, 2021) which was close to the main sequence, so we did not target stars which were either very young or likely binary stars.
In Table 1 we show the targets, the number of sectors where the source was observed in Cycle 2, and include the period which we derived from TESS 2 min data. All targets have the most prominent peak in their LS and AoV periodogram 0.2 d and none show optical flares.
| TIC | RA | DEC | #Sectors | Period | Amplitude | SpT | Notes | ||||
|---|---|---|---|---|---|---|---|---|---|---|---|
| (J2000) | (J2000) | (mag) | (d) | fraction | (K) | ||||||
| 452912864 | 00:33:14.8 | +55:55:21.5 | 13.7 | 1 | 0.054 | 0.0130 | 2.19 | 9.13 | 3630 | 1.6 | |
| 421117621 | 00:46:11.8 | +63:03:20.6 | 13.5 | 3 | 0.159 | 0.0046 | 2.27 | 9.49 | 3570 | 1.9 | |
| 285039638 | 00:48:43.8 | +61:16:42.6 | 13.0 | 2 | 0.168 | 0.0157 | 1.90 | 8.02 | 3860 | 0.7 | |
| 351876189 | 00:54:48.6 | +66:07:30.0 | 12.7 | 3 | 0.175 | 0.0039 | 2.00 | 8.55 | 3770 | 1.0 | |
| 288500817 | 02:34:14.9 | +45:42:38.8 | 13.1 | 1 | 0.161 | 0.0091 | 2.70 | 10.56 | 3330 | 3.1 | U |
| 418207289 | 03:19:44.2 | +72:51:57.2 | 13.8 | 1 | 0.147 | 0.0099 | 2.46 | 10.18 | 3460 | 2.5 | |
| 418208790 | 03:19:54.3 | +74:49:12.9 | 13.1 | 1 | 0.180 | 0.0039 | 2.00 | 8.93 | 3770 | 1.0 | |
| 354790015 | 03:31:45.5 | +49:42:37.4 | 12.7 | 1 | 0.063 | 0.0052 | 1.90 | 8.21 | 3860 | 0.6 | |
| 256738604 | 03:51:26.5 | +82:38:44.6 | 13.2 | 1 | 0.148 | 0.0035 | 2.60 | 10.24 | 3380 | 2.9 | U |
| 187254179 | 04:49:42.5 | +39:35:03.5 | 12.6 | 1 | 0.170 | 0.0093 | 1.96 | 8.21 | 3810 | 0.9 | |
| 281571049 | 04:49:55.7 | +71:09:47.1 | 11.9 | 1 | 0.174 | 0.0103 | 2.70 | 10.43 | 3330 | 3.1 | |
| 327871640 | 05:08:38.8 | +49:56:33.8 | 13.3 | 1 | 0.169 | 0.0049 | 2.76 | 11.02 | 3300 | 3.2 | |
| 310162555 | 05:30:00.5 | +51:08:49.1 | 13.9 | 1 | 0.161 | 0.0118 | 2.81 | 11.13 | 3270 | 3.3 | |
| 116609201 | 05:42:22.6 | +34:52:44.0 | 13.5 | 1 | 0.161 | 0.0505 | 1.94 | 8.08 | 3830 | 0.9 | Sct like |
| 155657579 | 13:45:54.3 | +79:23:15.0 | 13.8 | 2 | 0.184 | 0.0077 | 2.74 | 10.58 | 3300 | 3.2 | EB |
| 85407625 | 17:10:11.0 | +41:39:34.2 | 11.7 | 2 | 0.176 | 0.0329 | 2.45 | 9.11 | 3460 | 2.4 | RV mod, X, U |
| 329248235 | 17:35:32.4 | +54:27:36.4 | 13.2 | 9 | 0.128 | 0.0022 | 2.57 | 9.90 | 3390 | 2.7 | |
| 258922572 | 19:14:36.1 | +69:28:51.6 | 12.9 | 12 | 0.183 | 0.0020 | 2.10 | 8.76 | 3690 | 1.3 | U |
| 282773740 | 20:06:42.2 | +19:21:42.5 | 11.2 | 1 | 0.188 | 0.0014 | 2.03 | 8.62 | 3750 | 1.1 | |
| 387330194 | 20:39:34.5 | +68:22:12.7 | 12.6 | 6 | 0.192 | 0.0030 | 2.05 | 8.31 | 3730 | 1.2 | U |
| 136513953 | 21:09:50.1 | +42:57:20.2 | 13.8 | 2 | 0.137 | 0.0200 | 2.66 | 10.66 | 3350 | 3.0 | |
| 137188834 | 21:12:30.3 | +42:55:35.1 | 13.3 | 2 | 0.154 | 0.0068 | 1.92 | 7.89 | 3840 | 0.7 | |
| 429916899 | 21:33:12.8 | +55:01:23.0 | 12.6 | 1 | 0.142 | 0.0159 | 1.85 | 7.86 | 3910 | 0.5 | |
| 394885751 | 21:39:17.5 | +49:24:47.2 | 13.0 | 2 | 0.164 | 0.0051 | 1.95 | 8.17 | 3820 | 2.0 | |
| 419666455 | 21:40:18.0 | +41:08:03.5 | 13.7 | 2 | 0.197 | 0.0033 | 2.39 | 9.77 | 3500 | 2.2 | EB |
| 346130527 | 21:49:56.0 | +47:25:48.7 | 12.8 | 2 | 0.187 | 0.0041 | 1.99 | 8.27 | 3780 | 1.0 | |
| 66635046 | 22:46:13.7 | +48:15:12.6 | 13.3 | 2 | 0.191 | 0.0073 | 2.60 | 10.65 | 3380 | 2.8 | |
| 279606560 | 23:06:00.5 | +71:42:31.4 | 13.5 | 1 | 0.178 | 0.0070 | 2.31 | 8.85 | 3540 | 2.9 | |
| 251922596 | 23:28:19.2 | +58:12:19.8 | 13.1 | 2 | 0.159 | 0.0113 | 2.08 | 8.39 | 3700 | 1.3 | EB? |
.
2.2 Targets
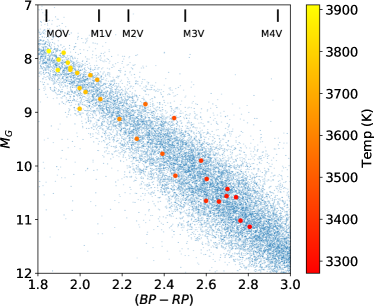
In Figure 1 we show the location of our targets in the Gaia HRD, i.e. in the plane, which implies they have spectral types in the range M0-M4V333https://www.pas.rochester.edu/~emamajek/EEM_dwarf_UBVIJHK_colors_Teff.txt (Pecaut & Mamajek, 2013). The spectral type determinations are broadly consistent with those determined using the Gaia colour relationship with spectral type (Kiman et al., 2019) which we show in Table 1. All targets are located very close to the main locus of the main sequence, with only three being slightly offset. We also searched Galex all-sky survey in the UV (Bianchi et al., 2017) and the Rosat all-sky Faint Catalogue Survey in soft X-rays (Voges et al., 2000) and find five UV matches (indicated as a ’UV’ in Table 1 and one X-ray match (TIC 85407625).
2.3 Folded light curves
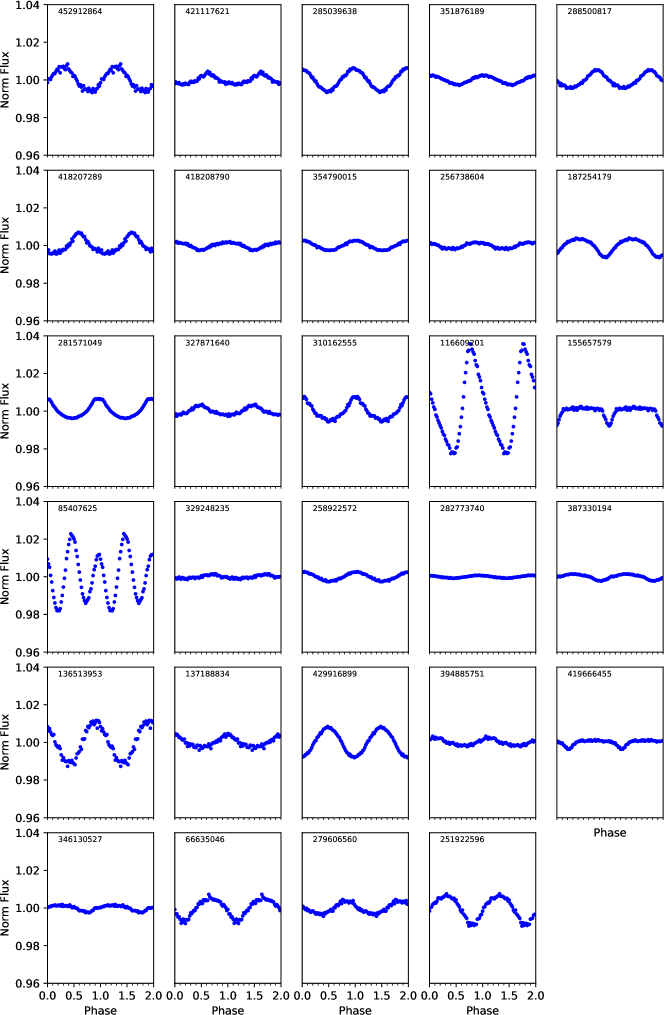
To gain further insight to the nature of our targets we folded the data on the period shown in Table 1. These folded light curves are shown in Figure 2 with the semi-amplitude expressed as fraction indicated in Table 1. The vast majority of our targets show a low amplitude modulation which, at face value, appear consistent with the presence of starspots which emerge into and out of view as the star rotates.
There are, however, some stars which have folded light curves which are clearly not signatures of stars with starspots. TIC 116609201 shows a light curve (and period) which is similar to that of Sct stars or related pulsating stars. There is a relatively bright star (=12.0) which is 50.2 distant from TIC 116609201. Data from Gaia DR2 indicates it lies in a position on the HRD which is consistent with it being a Sct or related pulsator. Given the size of the TESS pixels (21/pixel) some of the light from this star likely contaminates the light from TIC 116609201. TIC 155657579 and TIC 419666455 appear to be eclipsing binaries with a period of 4.42 h and 4.73 h respectively (these could be faint eclipsing binaries which are spatially nearby the target star). TIC 251922596 may show an eclipse like feature at phase minimum. One further source, TIC 85407625, shows a more complex light curve, with two peaks and two minima per cycle. We discuss the nature of this source in more detail in §3.2.
To search for other targets which may have been affected by light from other stars we made a systematic search for stars within 1 of our targets using tpfplotter (Aller et al., 2020). (Although the FWHM of the TESS PSF is 1.9 pixels, the number of pixels which are used to extract the lightcurves in the TESS pipeline are typically 3–4). For those stars within our search radius we placed them on the Gaia HRD (Gaia Collaboration, 2018). We then searched for stars which lay close to the location where Sct or SX Phe stars lie: these are one of the few types of variable star which show periodic pulsations on a period between 0.1–0.2 d. To affect the light curve of our target we required the nearby star to be at most 1 mag fainter. We find that up to 1/4 of our targets may have light curves which have been influenced to a degree by stars which were spatially nearby and which fall in the Gaia HRD which is consistent with the location of Sct or SX Phe stars. However, none of these light curves have a shape which is similar to a classical Sct profile suggesting the effect is minimum. Further high cadence observations with higher spatial resolution would be required to identify their location. We note that although pulsations from low mass stars have been predicted, their amplitudes are expected to have a fraction of a few 10-6 (Rodríguez-López, 2019).
2.4 Short Period Binaries
In the previous section we highlighted the need for an examination of phase folded light curves and also an assessment of the immediate field for variable stars which could affect the TESS photometry of the target. This led to the identification of two, possibly three, eclipsing binaries. TIC 155657579 and 419666455 show folded light curves which are consistent with a low mass - low mass binary. They have periods which we associate as being the binary orbital period which are 0.184 and 0.197 d respectively. Such short period low mass binaries are rare, with only a few being known around the 0.2 d period (c.f. Zhang et al., 2019; Fang et al., 2019). Given we find no evidence for a variability of the radial velocity of these stars we expect that these binaries are not related to the low mass star we obtained spectra for and are likely spatially nearby sources.
3 Spectroscopic Observations
We obtained spectroscopy of our targets using the 2.56m NOT on La Palma for three contiguous nights starting on 27th Oct 2020 using ALFOSC. We used Grism# 8, which covers the wavelength range 5680-8580 Å, using a 0.5`` slit, giving a spectral resolution of 2000. Exposure times were 300 sec with three spectra being taken consecutively and later combined to form a single spectrum after the reductions. For most targets we obtained one set of three spectra on each of the three nights. These were followed by HeNe arc lamp exposures. The spectra were bias-subtracted and flatfielded using the Halogen lamp exposures. The spectra were then extracted using the OPTSPECEXTR package 444https://physics.ucf.edu/~jh/ast/software/optspecextr-0.3.1, that performs optimal extraction of spectra along the lines described in Horne (1986). The spectra are shown in Fig 9.


3.1 Searching for Radial Velocity Variations
In order to search for radial velocity changes in each of the sources, we cross-correlated the combined spectra of each target from the second and the third nights against the combined spectrum from the first night. This was carried out in two specific regions, where M dwarfs show sharp features in their spectra (i.e. 7000-7160 Å and 8300-8600 Å). We used an average radial velocity shift from these two bands. To fully utilise the information content of the spectra, we interpolated the spectra by a factor of three using splines before cross-correlating them. In order to correct for any changes in the instrumental wavelengths more accurately than using the arc lamp spectra, we cross-correlated two different regions in the spectra that contain sharp telluric features (i.e. 6840-6890 Å and 7570-7630 Å). This correction was computed separately for each pair or source spectra from the nights 1-3. As a result, we obtained spectra from three nights for 24 sources and from two nights for the remaining 5 sources. These triplets/pairs of spectra where cross-correlated in order to search for any evidence for radial velocity shifts. The typical error for the velocity shifts from cross-correlation is 6 km s-1. This also agrees with the standard deviation of detected radial velocity shifts for the 28 stars that do not show any significant velocity shifts. The results are shown in Fig 3. We detect only one source (TIC 85407625), that shows clear changes in its radial velocity between different nights.
3.2 TIC 85407625
In order to further investigate the radial velocity shifts in TIC 85407625, we obtained a time series of spectroscopic observations with the same instrumental setup as was used for our survey of all 29 targets. The observations took place on 2nd July 2021. The spectra were cross-correlated against the first spectrum of the sequence using the 8300-8600 Å wavelength range (see Fig. 4 for the full spectrum of TIC 85407625). At the time of the observations it was thought that based on the TESS periodogram, the orbital period of the system was 0.088 d. However, once the phase-folded data revealed unequal depths for every second maxima and minima, and the results of a Bayesian analysis of the radial velocity curve were taken into account, it became clear that the true (orbital) period was 0.1764 d. We show the resulting radial velocity variation as a function of orbital period in Fig 5. We note that for binaries with orbital periods 4 d it is likely that the rotation period of each star in the binary is synchronised or close to being synchronised (Lurie et al., 2017; Fleming et al., 2019). It is therefore likely that the 0.1764 d period is both the binary orbital period and the rotation period of the binary components.
To determine the amplitude of the radial velocity variation, we assume any companion at such short period would have a circular orbit and we can fix the period at 0.1764 d. The resulting radial velocity curve, together with a sinusoidal fit, are shown in Fig. 5. We determine a K velocity of 42.6 1.5 km s-1: the velocity is not calibrated. This yields a mass function of 58 MJup for the companion star (i.e. a minimum mass for =90∘). Since a random inclination has a 50% chance of being above 60∘, there is a 50% probability that the companion mass is 90 MJup. There is no sign of a companion in the spectra, strengthening the case for the brown dwarf companion. However, a very late type (M7+) companion cannot be ruled out. We note that the source appears in the catalogue of NIR spectroscopic survey of nearby M dwarfs (Terrien et al., 2015) with a radial velocity of –3.64.7 km s-1 and it is slightly overluminous for its spectral class.
The spectra of TIC 85407625 also shows strong H emission (see Fig. 4), indicative of stellar magnetic activity. The radial velocities of the H line (Fig. 6) follow the motion of the multiple narrow absorption lines used for the radial velocity measurements, thus confirming the association with the M dwarf. In addition to the radial velocity modulation (tracking the movement of the M dwarf), we determined the FWHM and EW of the H emission line, which also shows evidence for variation consistent with the orbital period (Fig. 7). This was estimated by fitting a Gaussian line profile to each of the individual spectra. The maximum in both FWHM and EW occurs during the phase of maximum blue shift. The resulting K velocity from the H is somewhat larger (56.01.9 km s-1) then the value obtained from the cross-correlation analysis of the absorption features (42.6 1.5 km s-1). However, as the H line also shows changes in its shape and is much wider, we do not consider the discrepancy between the two values as a serious issue. We do have to be careful interpreting these results though, since we have observations only covering 0.6 in orbital phase, even if we can relatively safely assume an underlying sinusoidal modulation for the radial velocity.
4 Discussion
The underlying aim of this study (and Paper I) is to address the issue of why some late type stars show evidence of rapid rotation (0.2 d) but little (or no) flare activity. In particular, our observations made using the NOT aimed to determine if these stars could be components of short period binaries.
It is clear from our analysis of the 29 targets outlined in this paper, that none apart from TIC 85407625 show any clear evidence for binarity in their radial velocity measurements. However, given the limited size of our survey population and the small number of radial velocity measurements per source, we now set out to place upper limits on the mass of any second binary component to these stars.
4.1 Evidence for low mass companions
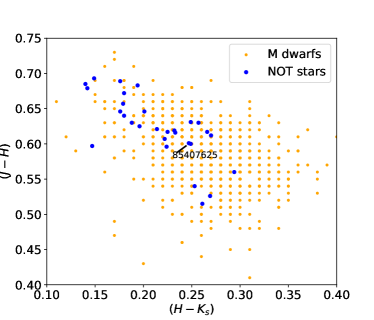
To explore the possibility that any potential binary companion star to our targets is visible in the near IR we extracted their 2MASS magnitudes (Skrutskie et al., 2006). We compare their colours to the sample of nearby M dwarfs of Terrien et al. (2015). We show their colours in Figure 8: the colours of the stars in our NOT sample are entirely consistent with nearby M dwarfs. Furthermore, if we compare the absolute magnitude of a M3.5V star (the latest spectral type of our sample, c.f. Figure 1) with a M8V star (there is a 50% probability that the companion mass of TIC 85407625 is below 90 MJup = 0.084 ), there is a difference of 3.1, 3.0 and 2.8 mag in their absolute mag. We therefore do not expect such companions to be detected in colours.
4.2 Searching for binarity using the Gaia RUWE parameter
The Gaia data releases (Gaia Collaboration, 2018, 2021) incorporate a parameter called the Renormalised Unit Weight Error (RUWE) which is a measure of how much the photo-center of a star moves over the course of the Gaia observations (Lindegren et al., 2021a). Initial indications suggest that for stars with RUWE1.4 the star is an unresolved binary system (Lindegren et al., 2021b). Gaia EDR3 (Gaia Collaboration, 2021) show that two sources (TIC 137188834 and TIC 279606560) have RUWE values significantly above 1.4 (6.6 and 11.8 respectively), suggesting these stars are wide binaries. TIC 85407625 which shows a radial velocity variation in our NOT data has RUWE=1.35, although given the low mass for the secondary star it is not clear what its effect on the RUWE value would be. Stassun & Torres (2021) present evidence that even for stars which have RUWE=1.0–1.4 may also be unresolved binaries: all but one of our targets have RUWE1.0. At this stage there is strong evidence that one of our targets is a binary (TIC 85407625), and that an additional two stars are possible binaries.
4.3 Limits on the fraction of binaries
Although a secondary star to our targets may not be expected to be seen in near IR colours we now simulate the expected radial velocity variations which we would have expected to detect given our sampling rate and an underlying binary model. In our simulation, we exclude the five sources that only have spectra from two epochs and are therefore left with 24 sources with spectra from three epochs.
We simulated 10,000 datasets, each of which contained 24 sources, drawn from a pool of random binaries. These random binaries have random inclinations; an orbital period between 0.1-0.2 d; M dwarf masses between 0.3-0.6M⊙ (to match the spectral classes of our sample) and secondary masses between 10-80 MJup. The values are uniformly distributed (apart from the inclination). The three observation epochs are taken at random orbital phases. As a result we find that, on the average, we should observe 2.3 sources that show one radial velocity difference 20 km s-1 and another with 40 km s-1: the distribution is Poissonian. We find that in 30% of cases we would observe 0 or 1 sources, with radial velocity shift detections at the level which we observed in TIC 85407615. However, the scatter in the radial velocity shifts of the remaining sources is so small, that it cannot originate from the aforementioned distribution.
The two sample Kolmogorov-Smirnov test yields a probability for our sample to originate from the simulated binary distribution described above. It is therefore not feasible that the sources in our sample could originate from the underlying distribution of M dwarf-brown dwarf binaries (and even less feasible that they could have late type M companions) and most of them are likely to be single M dwarfs.
4.4 Amplitude of modulation
In Table 1 we note the semi-amplitude of the modulation seen in TESS light curves of our targets. If we omit TIC 116609201 (contamination from a Sct star); TIC 155657579 and TIC 419666455 (contamination from an eclipsing binary) and TIC 85407625 (the binary system noted in §3.2) we find they have a mean fractional semi-amplitude of 0.00752. In Ramsay et al. (2020) we explored the flare rate of low mass stars in TESS Cycle 1 data. There were only 6 stars which had rotational periods 0.2 d and were classed as flare active (at a rate 0.044 flares/day). The mean fractional semi-amplitude of these stars is 0.0375. Using the two-sample Anderson-Darling test we find the two samples differ at the 3 level: we therefore find marginal evidence that the flare in-active UFRs reported here have a smaller amplitude of modulation than flare active UFRs. Our sample of stars with NOT spectra show no optical flares; show no evidence of H in emission and appear to also show some evidence of having a comparatively lower amplitude of modulation in their TESS light curves. It is possible that a signature of their rotation period was only possible because of the sensitivity of TESS and that they have starspots covering a relatively small fraction of the stars photosphere. Alternatively, they could have a large number of small spots which are widely distributed over the star (Jackson & Jeffries, 2013), and see Luger et al. (2021) for a recent paper outlining the difficulties of predicting the distribution of spots from single band light curves.
4.5 Super-saturation?
The lack of any flares in these systems is puzzling, as such fast rotation should generate magnetic activity due to the dynamo process, which should manifest itself also in the form of flares. However, as noted in our Paper I (Doyle et al., 2022), this might be explained by the effect thought to be behind the supersaturation of X-ray emission in the fast rotating M dwarfs i.e. the fast enough rotation opens up the magnetic loops in the corona due to centrifugal force (Jeffries et al., 2011), which disables the storage of magnetic energy in the coronal loops. As a consequence, the magnetic reconnection is inhibited and no flares are detected, even if star spots are observed in the photosphere. In early M dwarfs, the centrifugal force is a factor of four greater for a star with a rotation period of 0.15 d compared to 0.3 d. However, the centrifugal force is also a factor of five times stronger for a star of spectral type M0 compared to M4. We are searching for more low mass UFRs in TESS data to attempt to disentangle these effects.
5 Conclusions
We have shown that in studies which explore the activity levels of low mass stars, it is essential to examine their phase folded light curves. A small number show light curves where the variability is clearly not due to starspots. Further examination shows that around 1/4 of our targets may have light curves which could have been effected to a small degree by stellar pulsators, such as Sct stars, which are spatially nearby our target. However, the majority of our targets appear to be consistent with being low mass stars in which the variability is due to starspots.
We have set out to address the question of why a significant number of low mass stars which have a periodic modulation in their TESS light curve 0.2 d do not show clear evidence for flare activity. We have presented the results of a radial velocity survey of 29 stars which show a periodic modulation in the TESS light curve. One star shows a clear radial velocity variation with another two stars showing high RUWE values (§4.2) which suggests that they too maybe binary systems.
In Paper I, where we reported that half the sample of ten stars showed evidence for a line of sight magnetic field strength of 1–2 kG, we suggested that the lack of flares in UFRs which also show evidence for a magnetic field, could be related to super-saturation which inhibits magnetic reconnection and hence the production of flares. In Ramsay et al. (2020) we suggested that stars whose activity is saturated could produce flares through micro-flares in the band. Observations of flare inactive UFRs using high cadence instruments on mid-sized telescope which have -band sensitivity are encouraged. In this paper we note that UFRs which are not flare active appear to show some evidence for a lower modulation amplitude to flare active UFRs. Further observations of low-mass stars using TESS data (especially the 20 sec cadence mode introduced in Cycle 3) should help address this question. Also, medium resolution spectroscopic observations could reveal the presence of Doppler broadened lines which would be expected from rapidly rotating stars. Finally, we report the discovery of a possible M3 dwarf - brown dwarf binary TIC85407625 with the mass function of 58 MJup and an orbital period of 0.176 d. Close M dwarf - brown dwarf binaries are extremely rare. The companion mass has a 90 MJup upper limit with 50% probability and there is no sign of a companion in the spectra ruling out a binary M dwarf, although a very late type (M7+) companion cannot be ruled out.
Acknowledgements
The data presented here were obtained, in part, with ALFOSC, which is provided by the Instituto de Astrofisica de Andalucia (IAA) under a joint agreement with the University of Copenhagen and NOT. This paper includes data collected by the TESS mission. Funding for the TESS mission is provided by the NASA Explorer Program. The Gaia archive website is https://archives.esac.esa.int/gaia. Armagh Observatory and Planetarium is core funded by the Northern Ireland Executive through the Dept. for Communities. LD acknowledges funding from a UKRI Future Leader Fellowship, grant number MR/S035214/1. JGD would like to thank the Leverhulme Trust for a Emeritus Fellowship. We thank the anonymous referee for a helpful report.
Data Availability
TESS data are available from the NASA MAST portal. NOT spectra can be obtained on request from the authors.
References
- Aller et al. (2020) Aller, A., Lillo-Box, J., Jones, D., et al., 2020, A&A, 635, 128
- Babcock (1951) Babcock, H.W., 1951, ApJ 114, 1
- Bianchi et al. (2017) Bianchi, L., Shiao, B., Thilker, D., 2017, ApJS, 230, 24
- Borucki et al. (2010) Borucki W. J., et al., 2010, Sci, 327, 977
- Chambers et al. (2016) Chambers, K C., et al., 2016, arXiv-1612.05560
- Davenport (2016) Davenport, J. R. A., 2016, Astrophysics Source Code Library, 1608.003
- Davenport et al. (2019) Davenport, J. R. A., et al., 2019, ApJ, 871, 241
- Doyle et al. (2018) Doyle, L., Ramsay, G., Doyle, J. G., et al., 2018, MNRAS, 480, 2153,
- Doyle et al. (2019) Doyle, L.; Ramsay, G.; Doyle, J. G.; Wu, K., 2019, MNRAS, 489, 437
- Doyle et al. (2022) Doyle, L., Bagnulo, S., Ramsay, G., Doyle, J. G., Hakala, P., et al., 2022, accepted, MNRAS, Paper I
- Fang et al. (2019) Fang, X.-H., et al., 2019, PASJ, 71, 125
- Fleming et al. (2019) Fleming, D. P., Barnes, R., Davenport, J. R. A., Luger, R., 2019, ApJ, 881, 88
- Gaia Collaboration (2018) Gaia Collaboration, Brown, A.G.A., Vallenari, A., et al., 2018, A&A, 616, A1
- Gaia Collaboration (2021) Gaia Collaboration, Brown, A.G.A., et al., 2021, A&A, 649, A1
- Gillen et al. (2020) Gillen, E., et al., 2020, MNRAS, 492, 1008
- Gizis et al. (2017) Gizis, J. E., Paudel, R. R., Schmidt, S. J., et al., 2017, ApJ, 838, 22
- Gunther et al. (2020) Günther, M. N., et al., 2020, AJ, 159, 60
- Hawley et al. (2014) Hawley, S. L., Davenport, J. R. A., Kowalski, A. F., et al., 2014, ApJ, 797, 121
- Hartmann & Noyes (1987) Hartmann, L. W., Noyes, R. W., 1987, ARA&A, 25, 271
- Horne (1986) Horne, K., 1986, PASP, 98, 609
- Jeffries et al. (2011) Jeffries, R. D., Jackson, R. J., Briggs, K. R., Evans, P. A., Pye, J. P., 2011, MNRAS, 411, 2099
- Jackson & Jeffries (2013) Jackson, R. J., Jeffries, R. D., 2013, MNRAS, 431, 1833
- Lightkurve Collaboration (2018) Lightkurve Collaboration, Cardoso, J. V. d. M., Hedges, C., Gully-Santiago, M., et al., 2018, Astrophysics Source Code Library, 1812.013
- Lindegren et al. (2021a) Lindegren, L., 2021a, A&A, 649, A2
- Lindegren et al. (2021b) Lindegren, L., 2021b, A&A, 649, A4
- Luger et al. (2021) Luger, R., Foreman-Mackey, D., Hedges, C., Hogg, D. W., 2021, AJ, 162, 123
- Lurie et al. (2017) Lurie, J. C., et al., 2017, AJ, 154, 250
- Kiman et al. (2019) Kiman, R., Schmidt, S. J., Angus, R., Cruz, K. L., Faherty, J. K., Rice, E., 2019, AJ, 157, 231
- Kochukhov & Lavail (2017) Kochukhov, O., Lavail, A., 2017, ApJ, 835, L4
- McQuillan et al. (2014) McQuillan, A., Mazeh, T., Aigrain, S., 2014, ApJS, 211, 24
- Namekata et al. (2020) Namekata, K., et al., PASJ, 2020, 72, 68
- Pecaut & Mamajek (2013) Pecaut M. J., Mamajek E. E., 2013, ApJS, 208, 9
- Pettersen (1989) Pettersen, B. R., 1989, SoPh, 121, 299
- Press et al (1992) Press W.H., Teukolsky S.A., Vetterling W.T., Flannery B.P., 1992, Numerical Recipes in C, 2nd ed., New York, Cambridge University Press
- Ramsay et al. (2013) Ramsay, G., Doyle, J. G., Hakala, P., et al., 2013, MNRAS, 434, 2451
- Ramsay & Doyle (2015) Ramsay, G., Doyle, J. G., 2015, MNRAS, 449, 3015
- Ramsay et al. (2020) Ramsay, G., Doyle, J. G., Doyle, L., 2020, MNRAS, 497, 2320
- Rebull et al. (2016) Rebull, L. M., et al., 2016, AJ, 152, 113
- Ricker et al. (2015) Ricker G. et al., 2015, JATIS, 1a4003
- Rodríguez-López (2019) Rodríguez-López, C., 2019, FrASS, 6, 76
- Schwarzenberg-Czerny (1996) Schwarzenberg-Czerny A., 1996, ApJ, 460, L107
- Shulyak et al. (2017) Shulyak, D., Reiners, A., Engeln, A., Malo, L., Yadav, R., Morin, J., Kochukhov, O., 2017, NatAs, 1E, 184
- Skrutskie et al. (2006) Skrutskie, M. F. et al., 2006, AJ, 131, 1163
- Skumanich (1972) Skumanich, A., 1972, ApJ 171 565
- Stassun et al. (2019) Stassun, K., et al., 2019, AJ, 158, 138
- Stassun & Torres (2021) Stassun, K. G., Torres, G., 2021, ApJ, 907, L33
- Terrien et al. (2015) Terrien R. C., Mahadevan S., Deshpande R., Bender C. F., 2015, ApJS, 220, 16
- Voges et al. (2000) Voges, V., 2000, IAUC, 7432, 3
- Yang et al. (2017) Yang, H., et al., 2017, ApJ, 849, 36
- Zhang et al. (2019) Zhang, B., et al., 2019, PASP, 131:034201
- Zechmeister & Kürster (2009) Zechmeister, M. & Kürster, M., 2009, A&A, 496, 577
Appendix A Figures
In Figure 9 we show the first optical spectra of each of our target stars, with the exception of TIC 85407625 which is shown in Figure 4.
