Shear-induced mixing of granular materials featuring broad granule size distributions
Abstract
Granular flows during a shear-induced mixing process are studied using Discrete Element Methods. The aim is to understand the underlying elementary mechanisms of transition from unmixed to mixed phases for a granular material featuring a broad distribution of particles, which we investigate systematically by varying the strain rate and system size. Here the strain rate varies over four orders of magnitude and the system size varies from ten thousand to more than a million granules. A strain rate-dependent transition from quasistatic to purely inertial flow is observed. At the macroscopic scale, the contact stresses drop due to the formation of shear-induced instabilities that serves as an onset of granular flows and initiates mixing between the granules. The stress-drop displays a profound system size dependence. At the granular scale, mixing dynamics are correlated with the formation of shear bands, which result in significantly different timescales of mixing, especially for those regions that are close to the system walls and the bulk. Overall, our results reveal that although the transient dynamics display a generic behavior these have a significant finite-size effect. In contrast, macroscopic behaviors at steady states have negligible system size dependence.
I Introduction
The mixing of granular particles has long been recognized as a complex process which affects the performance of many products in many industries including pharmaceutical, food and cosmetic. The outcomes of a mixing process, or more generically referred to as the flow properties, markedly depend on the particle size distribution, density, roughness, moisture and cohesion [1, 2, 3, 4, 5], as well as externally supplied energy [6, 7]. It is also well-known reality that particles with similar properties tend to segregate themselves from others [8]. For granular particles, they also exhibit percolation, whereby small particles under the influence of gravity ends up staying at the bottom of a test-bed, or they percolate under the influence of shear. Experiments as well as computer simulations have explored shear-induced percolation extensively. Many different industrially relevant geometries are examined such as ball mills, blenders, hoppers [9, 10, 11]. The results obtained from such complex geometries are crucial, however, these could be geometry specific. The complexity in geometries poses a problem to rationalize the pure response of particle properties from the geometric effects.
Over the years, especially in discrete element methods (DEM), minimal geometries such as simple shear or plane shear have been extensively employed either via Lees-Edwards boundary conditions or via simulation walls to explore the elementary mechanisms of flow behaviors [12, 13, 14, 15, 16, 17]. These geometries have also been utilized to understand the shear-induced transition dynamics of mixing in granular materials. Lu and Hsiau [18] imposed shear through rough parallel walls and studied the mixing process of a binary assembly starting from an unmixed phase. They concluded that the mixing is governed by diffusion mechanisms. Aarons et al [19] adopted a similar sheared geometry with a binary mixture of significantly high diameter ratio of 7:1, and investigated the role of interparticle cohesive force on mixing. They found that the homogeneity of the binary mixture is correlated with the cohesive forces between small particles, even though locally they did not find any correlation between solid volume fraction and homogeneity. In addition, Obregón et al [20, 21] in their periodic shear experiments found that a faster mixing is achieved with increasing particle size as the large diameter reduces the frictional contact area. Similarly, they found that particles near the moving walls mix better than the rest of the system.
One major drawback in using DEM simulations is in its inability to experimentally match the relevant scales of mixing due to limited computational power. The standard procedures to overcome such computational shortcomings involve either enlarging the particle-sizes by a constant factor, or shortening the simulation dimensions [22]. The majority of the DEM studies on mixing focused on the binary assemblies of similar size-order. In real industrial products, however, this is not the case as the sizes of the granular particles are often distributed over a few orders of magnitude [23]. In these materials, such adhoc dimensional adjustments need to be implemented carefully as the wide distributions of sizes introduce different length-scales and time-scales during the mixing processes. Thus, an in-depth understanding on how to set an optimum simulation scale to study the mixing of industrially relevant granular products has a significant commercial impact, but it has thus far received little research attention.
In this study, we investigate systematically the finite-size effect of mixing in a cohesion-less granular assembly featuring a broad distribution of particle sizes. We begin from an unmixed phase and shear the system using a pair of parallel flat walls, forcing the granules to be mixed. We then study the transition dynamics from unmixed to mixed phases for several strain rates in the absence of gravity. We show that the shear-induced transition dynamics display qualitatively similar behavior, however, quantitatively the transient behavior depends on the system size. Upon further examination of the steady state regimes of the granular flows, we show that the macroscopic variables are insensitive to the finite size effect. Results obtained from this study display a significant influence of shear bands on mixing which is crucial in developing a continuum model for granular mixing.
The rest of the paper is organised in following sections. In the next section, we describe the granular model and details of the DEM simulations. In the following section, we discuss the mixing dynamics, effects of finite-size and effects of strain rates on mixing and steady state properties. Finally, we summarize the key findings in the summary section.
II Model and methodology
II.1 Model specification
Inspired from industrially relevant powders [23], we prepare a polydisperse granular assembly containing seven different types of granules which are of significantly different sizes and masses, and present with unique weight proportions (Table 1). We select a cubic box with a volume fraction of 0.6, whereby volume fraction is defined as the ratio of the total volume occupied by the granules to the box volume. We prepare three different system sizes where the total number of particles are 13147, 131441, 1314378, respectively.
| type | diameter | mass | weight(%) |
|---|---|---|---|
| 1 | 1.0 | 1.0 | 0.3 |
| 2 | 1.23 | 2.504 | 1.5 |
| 3 | 1.944 | 5.161 | 4.7 |
| 4 | 2.212 | 4.12 | 55.4 |
| 5 | 3.998 | 41.85 | 27 |
| 6 | 4.269 | 48.16 | 10.8 |
| 7 | 21.39 | 13157 | 0.2 |
II.2 DEM modeling
In our modelling, we use the open source software LAMMPS to perform discrete element simulations for the shear-induced mixing studies [24]. Here the particles are assumed to be soft spheres. Two particles exert a contact force only when they overlap. The overlapped distance is measured as the difference between the sum of radii and the center-to-center distance , i.e., . The pair vector is the vector difference between the two position vectors and .
The contact force is comprised of a normal force term and a tangential force term. The normal force, , is further comprised of an elastic force and a damping force . Both the forces are acting along the normal direction of the pair . We express the elastic force using the Hertzian model
| (1) |
where is the stiffness coefficient of the interparticle bond, having the dimension of pressure with the value set at . The damping force is proportional to the relative velocity between particle and particle
| (2) |
where is the damping coefficient which follows the relation
| (3) |
proposed by Tsuji et al [25]. Here and are the masses of particle and , and is a constant, whose value depends on the coefficient of restitution , set to 0.5.
Similar to the normal force, the tangential force, or more precisely the friction force, is also comprised of two forces, the Mindlin force [26] and a damping force , both acting along the tangential direction with respect to the pair vector . The tangential force
| (4) |
reaches the Coulomb limit when the sum of Mindlin and damping force overcomes a fraction of the normal force. The limit is controlled by the coefficient of friction , a scalar quantity whose value is set to 0.5 in this study. is the unit vector along the tangential direction. The Mindlin force
| (5) |
depends on both the overlapped distance and the tangential distance which further depends on the contact history. The tangential displacement is the integration of the relative tangential velocity over time ranging from the initial time of the contact formation to the present time . The history is erased and is set to zero once the contact breaks. The tangential stiffness parameter, , is set to . The tangential damping force
| (6) |
is proportional to , which includes translation velocities in the form of relative velocity along , and the rotation velocities and , and it is defined as
| (7) |
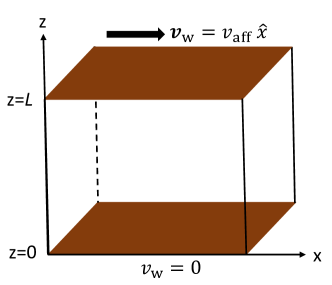
From the schematic of the cubic simulation box in Fig. 1, it can be deduced that the granular particles also experience contact forces from the two parallel flat walls, implemented at the bottom () and at the top () of the cubic simulation box (length ), to perform simple shear operations. The other two dimensions, x and y, are not bounded, implying that the particles can move back and forth based on the periodic boundary conditions. The top wall moves with a constant velocity along the horizontal direction, while the bottom wall is static, i.e. . The particle which comes into contact with the top wall will experience a shear force due to . Thus, the velocity facilitates generating a simple shear profile in the simulation box across the z-axis that can be described by an imposed strain rate
| (8) |
It is, however, a known fact that the shear profile will not be uniform. Rather than being a constant profile, the system will have a z-dependent strain rate profile [27]. It is possible to achieve a uniform simple shear profile using the Lees-Edwards boundary conditions, but this behavior is not observable experimentally [28]. Note that with increasing system size , we increase accordingly such that the imposed remains constant.
When a particle comes into contact with a wall , the wall exerts: (i) a normal force
| (9) |
and (ii) a tangential force
| (10) |
on the particle, where is the Mindlin force, is the overlap distance, is the magnitude of the vector , is the z-position of the particle. Here, all the parameters carry the same meanings and values as defined in equations (1,4,5).
Thus, the net force acting on a particle is the sum of all contact forces due to pair contacts and due to walls . In addition, a damping force, which is proportional to particle-velocity , is added to . The damping term restricts a particle to free flow, drains the kinetic energy out of the system, and prevents the occurrence of any oscillatory instability [29, 30]. Similarly, the particle experiences a net torque which is the accumulation of torques induced by tangential pair forces (4) , and torques induced by tangential wall forces (10) . The net force and torque acting on a particle generate translation and rotational motions, which are numerically estimated over time using the standard velocity-Verlet algorithm. In this study, the time step is selected for numerical integration to ensure stable numerical computations.
In our DEM simulations, the cut-off distance is set equal to the largest particle size in building the neighbor list, it results in long computational times for the neighbors and long communication times between the parallel processors. However, the maximum number of neighbors per particle on average is about 5, which is small because of our implementation of a repulsive interaction. We have used 120 parallel CPUs (Intel Xeon CPU E5-2690 GHz) to simulate our largest system consisting of more than one-million particles, which take approximately s to compute one smallest time step, addressing an important consideration in computational efficiency and effectiveness.
The fundamental mass () and length () units in our simulations are defined by the mass and diameter of the smallest particle (see Table 1) and the time unit () is defined by
| (11) |
II.3 Preparation protocol
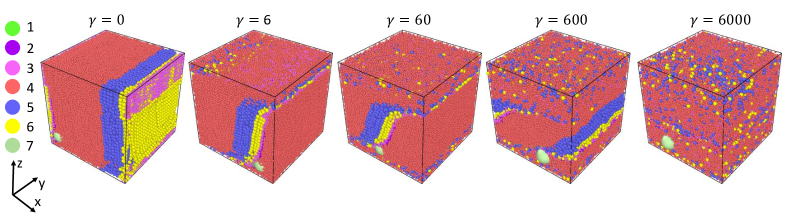
We prepare an initial configuration where seven granule types are stacked side by side, representing an unmixed granular phase. During the stacking process we keep the box elongated along the x-axis, whilst the other two dimensions are kept constant at value and start stacking each type of granule one after another. We checked that the choice of stacking-orders of granular types has mere influence on the results reported in this article. Once the stacking is completed, we gently shrink the x-dimension to length . Next, we bring the configuration at mechanical equilibrium, i.e., the net force and torque acting on each particle become negligible. An unmixed configuration prepared using the above protocol can be seen in the top left panel of Fig. 2. Once the initial configuration is prepared, we switch on the velocity of the top wall of the simulation box and start our shear-induced mixing study.
II.4 Local variables
Experimentally, the mixing status is evaluated by using a statistical index, which determines the homogeneity of the particle distribution. Normally a few sub-domains from the entire system are chosen for statistical sampling to conduct the homogeneity test. The dimension of the sub-domain is then carefully selected such that it is much larger than the typical size of particles but smaller than the experimental system [31].
In this study, we divide the simulation box into equal cubes of dimension , which is larger than the largest particle. The length is large enough to accommodate all types of granules with right proportions. The mixing status at each cube is then quantified by examining the relative density fluctuations of the granules with respect to the global density. We define a dimensionless parameter as follows
| (12) |
where and are the global densities for all granules and only for granules of type-, respectively. Similarly, and are the local densities for all granules and only for granules of type- at the test cube, respectively. is the total types of granules present in the system. The ideal mixing proportions of the granules at the test cube correspond to values of equal to zero, whereas the non-zero values of indicate deviations from the ideal. In addition, we calculate the local strain rate for each test cube
| (13) |
where is the number of granules in the cube, and are the z-position and x-velocity of granule . Similarly, we calculate the coordination number for each test cube
| (14) |
where is the number of granules in contact with granule .
Furthermore, in order to study the response of the three local variables against shear, we compute the average , and over all of the cubes lying on the same z-plane, denoted as , and , respectively.
III Results and discussions
III.1 Dynamics of mixing
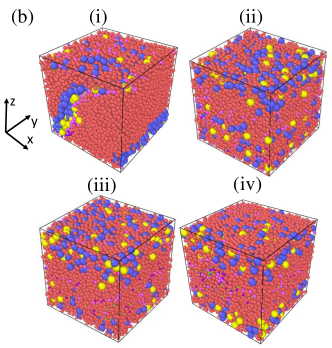
From the initial unmixed condition, particles move as layers along the horizontal direction with shear strain (see Fig. 2): It can be clearly observed that the particles close to the top wall move fast as the wall moves with a constant velocity , whilst those particles at the bottom are the slowest, which is unsurprising as the bottom wall is static, so the wall-friction opposes the sheared motion. A layer formation across the z-axis is also apparent when looking at the blue particles in the top panel, . Eventually, those particles close to the top and bottom walls start to mix (panels ). The particles in the middle are mixed later after applying a large amount of shear (panel ).
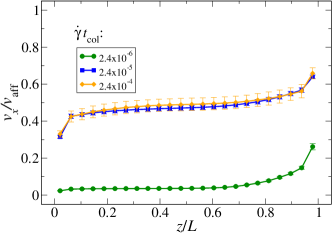
Such layerwise motion can be quantified through the study of velocity profile as a function of . Here, we divide the z-dimension of the box into several layers with equal thicknesses. Next, we compute the average x-velocity of the particles for each layer. rescaled by as a function of is displayed in the bottom row of Fig. 2. The mechanical equilibrium state of the initial configuration results in zero velocity (panel ). Once the shearing process starts, a non-zero velocity profile is established. Theoretically, a straight line velocity profile with slope one is expected for simple shear. Instead, we find a non-linear velocity profile signifying the formation of shear bands, typically observed in amorphous and jammed systems [32, 33]. Here, the non-linear velocity profile can be characterized into three regimes, namely, the top, bottom, and middle or bulk regimes. The bulk regime appears nearly flat with varying as the particles move with a constant velocity. The magnitude of the velocity at the bulk is smaller than , and it further drops with increasing . In comparison to the bulk, the other two regimes display sharp non-zero slopes. The bottom regime appears always shorter than the top regime. A similar type of shear band formation in granular assemblies was previously reported by Shojaaee et al [34].
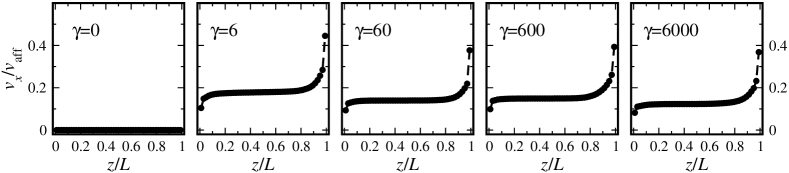
The existence of shear bands restricts the system in having a uniform strain rate profile locally. In understanding the local strain rate behavior over strain, we study the average local strain rate , as defined in section II.4. In Fig. 3(a), we discover an oscillatory profile for , saturating to a plateau at large strain intervals. It can also be observed that the oscillations have a systematic z-dependence, with the oscillation-amplitude increasing with increasing z. Even in the plateau regime, we find that increases with z, and all of the plateau values are higher than the imposed strain rate .
On further examination, we also find that the average coordination number dramatically drops over strain, and it is sensitive with shear bands (Fig. 3(b)). It is also evident that at large strain intervals, displays two different regimes, i.e., one close to the walls, and the other at the bulk.
The above results suggest that the granular system evolves from unmixed to mixed states under shear through the formation of shear bands. Recently, Vasisht and Del Gado numerically showed a strong correlation between shear banding and macroscopic properties, for example pressure in soft systems such as emulsions [35]. The authors established that the evolution of pressure over strain, which is marked by a plastic yielding followed by a steady state response, is associated with the emergence, disappearance and characteristic shape changes of shear bands. We further investigate if there exists any correlation between the pressure and mixing dynamics.
We follow the standard definition of pressure [36]
| (15) |
where the first term on the right hand side is the kinetic term, is the total number of particles and is the kinetic energy from both the translation and rotation
| (16) |
where we remove the bias velocity from the x-velocity of each particle. is determined by averaging the x-velocities of particles within the same z-plane as particle .
The second term on the right hand side of (15) is the average contribution of the three normal stress components of the virial stress tensor , which follows the definition
| (17) |
where is the sum of the particles in the simulation box () and the image particles [37] within close proximity to the simulation box. is the -component of the pair vector either between two particles, or between a particle and an image particle, or between two image particles. Similarly, is the -component of the pair force between and . The stress due to the walls is included in the second term on the right hand side, and the suffix represents the two walls.
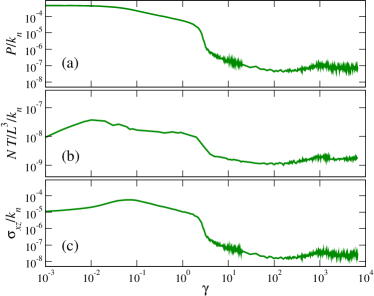
The results in Fig. 4 show that the initial value of is high. The -value decreases weakly until a sharp drop takes place, then displays a non-monotonic behavior, and finally, it reaches a steady state at around as shown in Fig. 4(a). We further confirm the steady state by conducting another simulation starting from a configuration where the particles are placed randomly. The random system also displays the same plateau value for pressure under shear. A similar sharp drop around the same can be seen in both kinetic pressure (panel (b)) and shear stress (panel (c)), and both the quantities reach plateaus also around the same as . The kinetic contribution on pressure is negligible as compared to the contribution from the contact forces, whilst the other two components of shear stress and , as expected, fluctuates around zero with vanishing magnitude.
The sharp drop in represents a static to dynamic transition of the whole system. The transition initiates granular flow, and thus, particles start to mix, which can be seen in Fig. 5. We study the average density fluctuation parameter , defined in section II.4, for several -planes. at the bottom and near the top walls show a jump occurring around the same when the value drops. These low values of indicate that the granular particles in these two planes reach the mixed phases stage. at the bulk takes longer shear deformation for mixing to occur. It is also evident that the strain value at which drops increases with the distance from the top wall. These results from our studies show similar mixing behaviors characteristic as observed in the periodic shear experiments [20] where the granular particles close to the two walls were also found to be mixed fast compared to the bulk particles. Here, we found that the fast mixing occurs due to the presence of the two shear bands which create slip events. Slipping randomizes particle motion along x, y and z directions.
III.2 Effects of finite-size
In this section, we conduct a finite-size analysis to understand how , shear banding and mixing scenario are affected by the finite-size. The finite-size analysis involves three granular systems, whereby the smallest system contains more than ten thousand particles and the largest system contains more than one million particles. For the volume fraction of 0.6, the respective dimension of the three simulation systems are 54.241, 114.94 and 247.26. We also studied another granular system with , i.e., 34 greater than the largest particle diameter, containing 1318 particles. However, the results of such a small system is distinctly different from the rest and as such it is discarded.
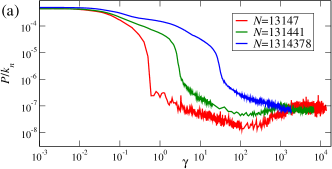
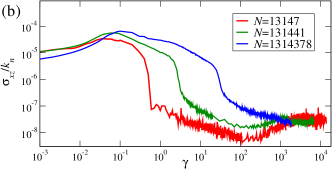
We find that the pressure of our initial unmixed system, resting at mechanical equilibrium, is the same for all of the systems (Fig. 6(a)). Here, we find qualitatively a similar response of the pressure against strain behavior irrespective of the system sizes. A significant pressure drop, which marks the mobility of the system, is prevalent in all of the three systems. The occurrence of pressure drop becomes significantly delayed with increasing system size. The system later gradually reaches steady states. We find that the steady state values of have negligible dependence on the system size. A similar significant drop and negligible dependence of the steady state values on the system size for are also shown in Fig. 6(b).
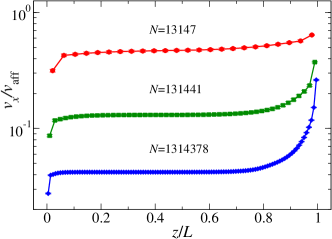
Two shear banding regimes with a flat middle regime in profile are also prevalent for all of the system sizes over all values of . with at steady states, is shown in Fig. 7. The steady state properties are averaged over the configurations saved in the last 300 strain intervals. Two marked system size effects are observed: (i) the top regime becomes broader and (ii) the magnitude of drops with increasing .
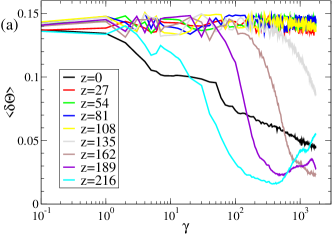
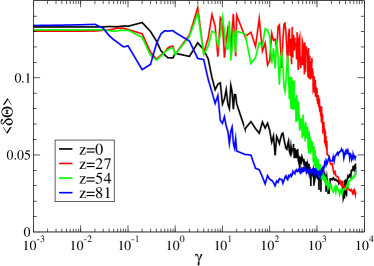
To understand the finite-size effect on mixing we plot for the whole range of z-planes of the largest system as shown in Fig. 8(a). at the top and the bottom regimes drop fast compared to the bulk. In the bulk, the occurrence of drops is systematically delayed with decreasing z. Note that the four regimes, just above , do not show any decay. In order to achieve the decay we need to run longer simulations which are extremely time consuming. Nevertheless, a qualitatively similar mixing behavior is recovered as found in smaller systems. Interestingly for our largest system, we observe a partial segregation. Granules of diameters accumulate more at the top wall compared to the other parts of the system (Fig. 8(b)).
III.3 Effects of strain rates
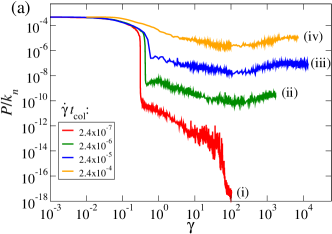
In this section, we study the effect of strain rate on mixing, especially, the correlation between and . A strong dependence of on is evident in Fig. 9(a). Note that is altered in this study by changing the value of . We find that the sharp drop in , also observable in the previous section, decreases with increasing . At the highest the drop becomes insignificant, which is in stark contrast at the lowest where the drop is prolonged. Interestingly, at these small values of the strain rate, the system reaches the zero pressure state over straining where no particles are in contact with the others including the walls.
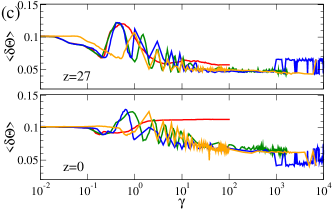
Zero pressure results in no flows in the system, and thus, a homogeneous mixed phase cannot be achieved. A nearly unmixed final configuration for the lowest is shown in Fig. 9(b). The granular particles reach the mixed phases for other high strain rates near the steady states. for two regimes and , where one regime lies on the bottom wall, whilst the other lies close to the top wall, are shown in Fig.9(c). Initially, remains constant, later it displays an oscillatory pattern. The oscillation is originated from shear deformation, implying a mass of particles periodically moving about in the same position in the box. The oscillation dies down with increasing as the initial mass of the particles further mix with each other, creating a strain-independent mixing phase. As expected, for the lowest strain rate, we do not observe such mixing dynamics. At the mixed phases, which also coincide with the steady states, we observe permanent shear bands for all of the strain rates (Fig. 10). Further upon increasing strain rate, collapses to a master curve pointing to the microscopic dynamics being identical at high strain rates.
III.4 Steady state properties
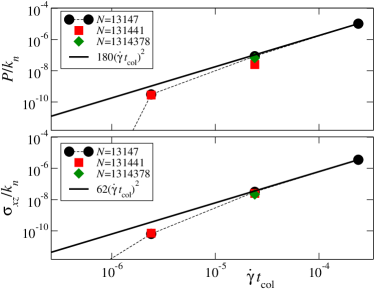
In this section, we investigate the effect of mixing on the steady state properties. The steady state values of and are shown in Fig. 11. Both the quantities asymptotically follow the scaling of and . The quadratic scaling for stresses was first observed by Bagnold in dense granular flows [38], which he rationalized using a kinetic theory where both, the frequency of binary collision and the momentum change per collision are assumed to be proportional to the strain rate. Later from his studies, Campbell concluded with the identification of three distinguished regimes in granular flows, namely, quasistatic, purely inertial and elastic inertial [39]. Cialvo et al [40] then showed that stresses below the critical volume fraction, i.e., the jamming point , belongs to a purely inertial regime where kinetic dynamics control the granular flow. In accordance with Cialvo et al, we also find that the current shear-induced mixing process results in a steady granular flow corresponding to a purely inertial regime. To further confirm the flow regime of the steady states, we estimate the relaxation time of the granular systems by letting one of our final configurations to relax in the absence of external shear. As a consequence, all the macroscopic variables decay to zero. Further, we fit pressure by , and find . Here, is served as a critical strain rate. When the strain rate is below the critical value, the flow is quasistatic, and it has no dependence on the strain rate values. However, when the strain rate is above the critical value the flow is purely inertial, which is consistent with the results in Fig. 11.
IV Summary
In summary, we found that the transition dynamics of mixing is sensitive to macroscopic dynamics. Starting from an unmixed phase, it was shown that the granular system attains a mixing phase typically at the similar strains at which the granular system reaches steady states.
From the finite-size analysis we discovered a minimum system size, typically twice the size of the largest particle, above which the response of pressure and shear stress over strain and strain rates are qualitatively similar. The steady state values display little dependence on the system size, whilst the strain value, which marks the static to dynamic transition associated with a contact stress drop, significantly increases with the system size.
Mixing behavior is also qualitatively similar for all of the system sizes. We observed that the mixing dynamics is sensitive to shear band formation. Granules move fast around the mobile wall and become slow around the static wall that creates the three flow regimes at the top, bottom and bulk. The amount of shear required to mix granules in the bulk regime is significantly large as compared to mixing the granules in the two regimes close to the walls, making the shear-induced mixing a slow process.
The steady state values of pressure and shear stress significantly depend on the strain rate, especially, we observed the Bagnold’s scaling as found in purely inertial granular flow. A critical strain rate was found which marks the transition from the quasistatic to the purely inertial regime. Thus, any strain rates below the critical value, the system will have zero pressure, and as a result, it never reaches a mixed phase.
Overall, our results suggest that elementary mechanisms underlying granular flows can be understood from a relatively small system, which might further lead one to construct a continuum model to quantify the mixing process at industrially relevant scales. Elementary mechanisms of mixing, especially the correlation between mixing and shear bands presented here should serve as a useful basis for future research. It would be interesting to study how non-Hertzian contact forces including cohesive forces and the particle shapes affect the mixing mechanisms as it is known in the literature that the formations of shear bands depend on the intensity of cohesive forces [41] as well as the particle shapes [42]. In addition, non-spherical particles, e.g., ellipsoids in rotating drums display different transverse mixing behaviors with the imposed rate in comparison with the spherical particles [43], which could also be a potential future research topic in the context of simple shear geometry.
Acknowledgment
Authors gratefully acknowledge the funding from RIE2020 AME IAF-PP grant with grant number A19C2a0019 and NSCC for allocating computation time and data storage. All the authors thank Lee Mun Wai, Tey Jayren, Thaddie Natalaray, Yap Fung Ling, Zhang Yong Wei, Liew Jun Xian for their valuable comments and discussion.
References
- [1] Charles S Campbell. Elastic granular flows of ellipsoidal particles. Physics of Fluids, 23(1):013306, 2011.
- [2] Nikolaos Vlachos and Isaac TH Chang. Investigation of flow properties of metal powders from narrow particle size distribution to polydisperse mixtures through an improved hall-flowmeter. Powder technology, 205(1-3):71–80, 2011.
- [3] J Mellmann, T Hoffmann, and C Fürll. Flow properties of crushed grains as a function of the particle shape. Powder technology, 249:269–273, 2013.
- [4] I Opaliński, M Chutkowski, and Ali Hassanpour. Rheology of moist food powders as affected by moisture content. Powder Technology, 294:315–322, 2016.
- [5] Vincenzino Vivacqua, Alejandro López, Robert Hammond, and Mojtaba Ghadiri. Dem analysis of the effect of particle shape, cohesion and strain rate on powder rheometry. Powder Technology, 342:653–663, 2019.
- [6] Mederic Argentina, MG Clerc, and R Soto. Van der waals–like transition in fluidized granular matter. Physical review letters, 89(4):044301, 2002.
- [7] Marcel G Clerc, Patricio Cordero, Jocelyn Dunstan, K Huff, Nicolás Mujica, Dino Risso, and Germán Varas. Liquid–solid-like transition in quasi-one-dimensional driven granular media. Nature Physics, 4(3):249–254, 2008.
- [8] Martin J Rhodes. Introduction to particle technology. John Wiley & Sons, 2008.
- [9] Paul W Cleary. Ball motion, axial segregation and power consumption in a full scale two chamber cement mill. Minerals Engineering, 22(9-10):809–820, 2009.
- [10] OS Sudah, PE Arratia, A Alexander, and FJ Muzzio. Simulation and experiments of mixing and segregation in a tote blender. AIChE Journal, 51(3):836–844, 2005.
- [11] Anshu Anand, Jennifer S Curtis, Carl R Wassgren, Bruno C Hancock, and William R Ketterhagen. Predicting discharge dynamics from a rectangular hopper using the discrete element method (dem). Chemical Engineering Science, 63(24):5821–5830, 2008.
- [12] Charles S Campbell. The stress tensor for simple shear flows of a granular material. Journal of Fluid Mechanics, 203:449–473, 1989.
- [13] Gregg Lois, Anaël Lemaître, and Jean M. Carlson. Numerical tests of constitutive laws for dense granular flows. Phys. Rev. E, 72:051303, Nov 2005.
- [14] Frédéric Da Cruz, Sacha Emam, Michaël Prochnow, Jean-Noël Roux, and François Chevoir. Rheophysics of dense granular materials: Discrete simulation of plane shear flows. Physical Review E, 72(2):021309, 2005.
- [15] Ning Xu and Corey S O’Hern. Measurements of the yield stress in frictionless granular systems. Physical Review E, 73(6):061303, 2006.
- [16] Y Guo, C Wassgren, B Hancock, W Ketterhagen, and J Curtis. Granular shear flows of flat disks and elongated rods without and with friction. Physics of Fluids, 25(6):063304, 2013.
- [17] Sandip Mandal and DV Khakhar. A study of the rheology and micro-structure of dumbbells in shear geometries. Physics of Fluids, 30(1):013303, 2018.
- [18] Li-Shin Lu and Shu-San Hsiau. Dem simulation of particle mixing in a sheared granular flow. Particuology, 6(6):445–454, 2008.
- [19] Lee R Aarons, S Balachandar, and Yasuyuki Horie. The mixing of cohesive granular materials featuring a large size range in the absence of gravity. Powder technology, 235:18–26, 2013.
- [20] Luis Obregón, Alvaro Realpe, Carlos Rinaldi, and Carlos Velázquez. Mixing of granular materials. part i: Effect of periodic shear. Powder Technology, 197(1-2):9–16, 2010.
- [21] Luis Obregón, Alvaro Realpe, and Carlos Velázquez. Mixing of granular materials, part ii: effect of particle size under periodic shear. Powder technology, 201(3):193–200, 2010.
- [22] N Khola and C Wassgren. Correlations for shear-induced percolation segregation in granular shear flows. Powder Technology, 288:441–452, 2016.
- [23] RP Kingsly Ambrose, Shumaila Jan, and Kaliramesh Siliveru. A review on flow characterization methods for cereal grain-based powders. Journal of the Science of Food and Agriculture, 96(2):359–364, 2016.
- [24] Steve Plimpton. Fast parallel algorithms for short-range molecular dynamics. Journal of computational physics, 117(1):1–19, 1995.
- [25] Yutaka Tsuji, Toshitsugu Tanaka, and T Ishida. Lagrangian numerical simulation of plug flow of cohesionless particles in a horizontal pipe. Powder technology, 71(3):239–250, 1992.
- [26] Raymond David Mindlin. Compliance of elastic bodies in contact. J. Appl. Mech., ASME, 16:259–268, 1949.
- [27] Lee Aarons and Sankaran Sundaresan. Shear flow of assemblies of cohesive and non-cohesive granular materials. Powder Technology, 169(1):10–21, 2006.
- [28] Hongming Li and JJ McCarthy. Cohesive particle mixing and segregation under shear. Powder Technology, 164(1):58–64, 2006.
- [29] Joyjit Chattoraj, Oleg Gendelman, Massimo Pica Ciamarra, and Itamar Procaccia. Oscillatory instabilities in frictional granular matter. Physical review letters, 123(9):098003, 2019.
- [30] Joyjit Chattoraj, Oleg Gendelman, Massimo Pica Ciamarra, and Itamar Procaccia. Noise amplification in frictional systems: Oscillatory instabilities. Physical Review E, 100(4):042901, 2019.
- [31] Maryam Asachi, Ehsan Nourafkan, and Ali Hassanpour. A review of current techniques for the evaluation of powder mixing. Advanced Powder Technology, 29(7):1525–1549, 2018.
- [32] Peter Schall and Martin van Hecke. Shear bands in matter with granularity. Annual Review of Fluid Mechanics, 42, 2010.
- [33] Thibaut Divoux, Marc A Fardin, Sebastien Manneville, and Sandra Lerouge. Shear banding of complex fluids. Annual Review of Fluid Mechanics, 48:81–103, 2016.
- [34] Zahra Shojaaee, Jean-Noël Roux, François Chevoir, and Dietrich E Wolf. Shear flow of dense granular materials near smooth walls. i. shear localization and constitutive laws in the boundary region. Physical Review E, 86(1):011301, 2012.
- [35] Vishwas V Vasisht and Emanuela Del Gado. Computational study of transient shear banding in soft jammed solids. Physical Review E, 102(1):012603, 2020.
- [36] Aidan P Thompson, Steven J Plimpton, and William Mattson. General formulation of pressure and stress tensor for arbitrary many-body interaction potentials under periodic boundary conditions. The Journal of chemical physics, 131(15):154107, 2009.
- [37] Michael P Allen and Dominic J Tildesley. Computer simulation of liquids. Oxford university press, 2017.
- [38] Ralph Alger Bagnold. Experiments on a gravity-free dispersion of large solid spheres in a newtonian fluid under shear. Proceedings of the Royal Society of London. Series A. Mathematical and Physical Sciences, 225(1160):49–63, 1954.
- [39] Charles S Campbell. Granular shear flows at the elastic limit. Journal of fluid mechanics, 465:261, 2002.
- [40] Sebastian Chialvo, Jin Sun, and Sankaran Sundaresan. Bridging the rheology of granular flows in three regimes. Physical review E, 85(2):021305, 2012.
- [41] Abhinendra Singh, Vanessa Magnanimo, Kuniyasu Saitoh, and Stefan Luding. Effect of cohesion on shear banding in quasistatic granular materials. Physical Review E, 90(2):022202, 2014.
- [42] Jianqiu Tian, Enlong Liu, and Chuan He. Shear band analysis of granular materials considering effects of particle shape. Acta Mechanica, 231(11):4445–4461, 2020.
- [43] Siyuan He, Jieqing Gan, David Pinson, and Zongyan Zhou. Transverse mixing of ellipsoidal particles in a rotating drum. In EPJ Web of Conferences, volume 140, page 06018. EDP Sciences, 2017.