Supporting Serendipitous Discovery and Balanced Analysis of Online Product Reviews with Interaction-Driven Metrics and Bias-Mitigating Suggestions
Abstract.
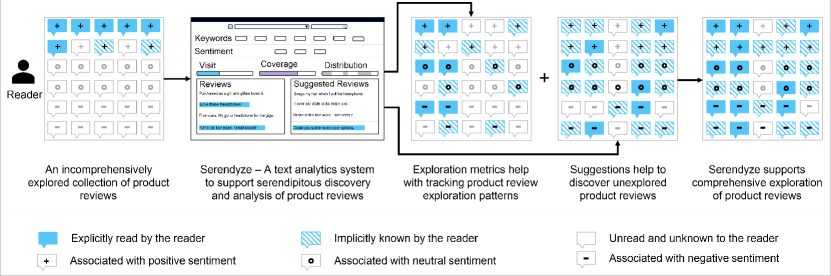
In this study, we investigate how supporting serendipitous discovery and analysis of online product reviews can encourage readers to explore reviews more comprehensively prior to making purchase decisions. We propose two interventions — Exploration Metrics that can help readers understand and track their exploration patterns through visual indicators and a Bias Mitigation Model that intends to maximize knowledge discovery by suggesting sentiment and semantically diverse reviews. We designed, developed, and evaluated a text analytics system called Serendyze, where we integrated these interventions. We asked 100 crowd workers to use Serendyze to make purchase decisions based on product reviews. Our evaluation suggests that exploration metrics enabled readers to efficiently cover more reviews in a balanced way, and suggestions from the bias mitigation model influenced readers to make confident data-driven decisions. We discuss the role of user agency and trust in text-level analysis systems and their applicability in domains beyond review exploration.
1. Introduction
Customers of online products often depend on product reviews to make data-driven purchase decisions (von Helversen et al., 2018; Hu et al., 2014). These product reviews — free-form text comments from previous customers that highlight their opinions and evaluations of online products — are often considered the most influential factor behind sales and attitudes towards a product (von Helversen et al., 2018; Floyd et al., 2014). While customers might have different strategies to navigate reviews to make their decisions (Chen et al., 2016), those who prefer to comprehensively explore and analyze product reviews often struggle to do so due to the abundance of reviews available (Jones et al., 2004; Kwon et al., 2015) and the limited amount of time to accrue insights from them (Park et al., 2006; Kwon et al., 2015). As such, these customers are often unable to evaluate all available alternatives in depth (Häubl and Trifts, 2000), which often results in incomplete exploration and understanding of the underlying product reviews (Hu et al., 2009; von Helversen et al., 2018; Kwon et al., 2015) prior to making purchase decisions.
Recent interest in data exploration and discovery (Kunaver and Požrl, 2017; Lu et al., 2015) along with beyond-accuracy metrics (Kaminskas and Bridge, 2016) has prompted research into identifying and presenting diverse and serendipitous information to increase people’s coverage and understanding of the data. Coupled with information visualization research geared towards providing navigational cues to investigate how readers interact with visual artifacts (Willett et al., 2007; Sarvghad et al., 2016; Wall et al., 2019), serendipitous information111The term Serendipity has been defined in various ways by previous researchers (Thudt et al., 2012; Kaminskas and Bridge, 2016). In this paper, we define serendipity as an unexpected yet beneficial discovery that adds to the knowledge of the readers about the data they are exploring. — information that is yet unexplored by the readers and may add to their knowledge of the underlying data — has shown promise in expanding the depth and breadth of data exploration (Sarvghad et al., 2016; Wall et al., 2019; North et al., 2011). However, these existing methods that encourage data exploration by increasing data coverage were not designed for product reviews — or texts in general — and their effectiveness on numerical or categorical data may not translate to predominantly text-based product reviews.
Prior works also suggest that users’ innate cognitive biases often influence how they interact with data using analytics systems (Wall et al., 2017). For instance, people who are oversensitive to consistency (Heuer, 1999; Wall et al., 2017) tend to interact with data that supports the broadest encompassing hypothesis, dismissing other data. When reading product reviews, this bias may influence a reader to read reviews that are predominantly positive or negative (Hu et al., 2009; Häubl and Trifts, 2000). Furthermore, the persistence of impressions based on discredited evidence (Heuer, 1999; Wall et al., 2017) often results in continuous interaction with data supporting a hypothesis that has been disproved. This bias may prompt readers to ignore reviews that highlight issues with their preferred products. These biases often manifest when users are overwhelmed with large amounts of data, resulting in them following their preconceptions, anchoring biases, and using biases as filters to explore underlying data (Wall et al., 2018). This manifestation of innate bias is inadvertently amplified by systems that respond to users’ interactions and preferences — facilitating incomplete, ineffective, and often biased data exploration prior to decision-making (Wall et al., 2017, 2019).
In this work, we investigate interventions that are intended to support serendipitous discovery and analysis to help readers comprehensively read and tease apart valuable insights from free-form texts in a balanced way. Here, we demonstrate how these interventions might work in the context of online product reviews. To that end, we investigate a two-pronged approach. First, we propose three interaction-driven exploration metrics Visit — a measure of reviews a reader has explicitly interacted with, Coverage — a measure of reviews covered by a reader implicitly, that are similar and redundant to the reviews they have already visited, and Distribution — a measure of the relation of reviews the reader has visited from different facets, such as sentiments, to the true distribution of that facet in the dataset. Second, we propose a bias mitigation model to improve knowledge discovery and balance overall review exploration. The model tracks how a reader has been visiting reviews and generates suggestions that are semantically and sentiment-wise different from what they have visited already.
The interaction-driven exploration metrics are designed to act as an awareness mechanism to help readers understand and track their review exploration progress and patterns through visual indicators. They highlight which reviews the readers have implicit and explicit knowledge about and the reviews that are left unexplored. The bias mitigation model is designed to support serendipitous discovery and offers a complementary view of reviews read. It is aimed at helping readers to balance their holistic understanding, increase data coverage, and mitigate bias towards specific review sentiments by providing them with suggestions that are different from what they have visited already.
We integrated the exploration metrics and the bias mitigation model with an interactive text analytics system, Serendyze. We use Serendyze to investigate the following questions:
-
(1)
RQ1: Does supporting serendipitous discovery and analysis help readers to perform in-depth exploration to cover more product reviews?
-
(2)
RQ2: How do readers’ review exploration behaviors change when they have access to their exploration patterns?
-
(3)
RQ3: How do suggestions from unexplored reviews impact readers’ online product purchase decisions?
In this study, we used Amazon product reviews as an example dataset. Furthermore, among myriad online products, we selected headphones as the candidate due to their ubiquitous usage (Statista, 2021). To study how serendipitous discovery and analysis may impact review exploration, knowledge gathering, and decision-making, we conducted a crowd-sourced between-subjects study in which 100 participants used Serendyze to select their most preferred headphones to recommend to someone.
The findings from our study demonstrate that exploration metrics and bias mitigating suggestions enable readers to make more informed and confident purchase decisions. We found that the majority of the participants who used both exploration metrics and suggestions were confident that they visited enough reviews to make an informed decision (16/25) as opposed to the participants who did not use these features (10/25). The majority of the participants who used the features were also confident that they had made the right decision (19/25) compared to those who did not (9/25).
From the collected usage logs, we found that participants who used exploration metrics and bias mitigating suggestions covered an average of reviews before making a purchase decision, with a 12.28 coverage to time-spent ratio. Participants who did not use these features covered an average of only reviews, with 8.64 coverage to time-spent ratio. By the term covered, we mean the number of reviews the participants have explicit or implicit knowledge about. We consider a participant has explicit knowledge about a review if they have visited the review by marking it as read and they have implicit knowledge about reviews that are semantically similar to the reviews they visited. The coverage numbers from our study suggest that participants who used exploration metrics and bias mitigating suggestions had a much broader coverage and knowledge of reviews.
The collected usage logs and responses to the post-study questionnaire also suggest that Serendyze helped the participants (18/25) to gather comprehensive knowledge from reviews by enabling them to visit reviews in a balanced way, without leaning towards specific sentiments (positive, negative, or neutral). We consider a readers’ review exploration as “balanced” when the sentiments visited by the reader reflect the true distribution of sentiments present in the dataset. Furthermore, the participants who used the suggestions discovered reviews of opposing viewpoints that they were unaware of before, which enriched their knowledge about the products and positively impacted their purchase decisions.
Based on the findings from our study, we highlight our contributions as follows:
-
(1)
A novel approach that intends to support serendipitous discovery and analysis using three interaction-driven exploration metrics and a bias mitigation model to help readers more comprehensively explore product reviews prior to making purchase decisions.
-
(2)
Empirical evidence that demonstrates the utility of an example text analytics system, Serendyze, integrated with functionalities to track review exploration and allow exploration of serendipitous information from product reviews. The system shows reflective metrics to readers about their review exploration patterns and suggests reviews that they might not have considered otherwise to help them accumulate comprehensive knowledge useful for informed decision-making.
-
(3)
Discussions on how systems designed to support serendipitous discovery and analysis can be useful in combating biased review exploration. We also discuss readers’ agency in mixed-initiative systems and the expansion of systems such as Serendyze for data-driven decision-making in domains beyond product reviews.
2. Related Work
Prior works have shown that product reviews are among the most important factors that influence sales and attitudes towards a product (von Helversen et al., 2018; Floyd et al., 2014) and the purchase decisions people make online (Hu et al., 2014). In 2020, Qualtrics revealed that 93% of customers mentioned that online product reviews impacted their purchase decisions (Qualtrics, 2020). This section describes existing tools and techniques for product review analysis and how serendipitous information discovery could support readers with review exploration and understanding.
2.1. Visual Analytics Approaches for Online Product Reviews
Researchers have explored various text analysis techniques such as opinion extraction, sentiment analysis, topic modeling, and trend analysis, and combined them with visualizations to enable exploration and analysis of product reviews (Khan et al., 2014; Alharbi and Laramee, 2019; Allahyari et al., 2017; Kucher and Kerren, 2015; Dave et al., 2003). For example, to explore and analyze online product reviews, OpinionBlocks provides an aspect-based summary of product reviews using a block visualization to present an overview of positive and negative reviews (Hu et al., 2013). Review Spotlight summarizes user reviews on restaurants using objective-noun pairs organized as tag clouds (Yatani et al., 2011).
To facilitate the comparison of opinions among different products derived from text mining across various features, Carenini et al. proposed a multimedia interface (Carenini and Rizoli, 2009) to aggregate opinions using bar chart visualizations. Opinion Observer is another such system that enables comparison of people’s opinions on product features based on opinion mining by summarizing the pros and cons of the product features (Liu et al., 2005). Chen et al. utilized term-variation patterns to identify underlying topics present in product reviews to facilitate understanding conflicting opinions towards online products using a host of visualizations (Chen et al., 2006).
Others have experimented with extracting and presenting affective content from product reviews. For example, Gregory et al. enabled user-directed affective content exploration in product reviews using variations of rose plots (Gregory et al., 2006). Furthermore, they experimented with thematic clustering based on keyword extraction to enable exploration of product reviews (Gregory et al., 2006). OpinionSeer enables multilevel exploration of opinion data from hotel reviews with explicit consideration towards uncertainty using augmented radial charts (Wu et al., 2010).
Prior works suggest that many of these methods often focus on providing aggregated statistics and summaries and put less emphasis on comprehensive exploration and knowledge discovery from the actual text (Kucher and Kerren, 2015; Alharbi and Laramee, 2019; Khan et al., 2014). While these methods are useful for making quick purchase decisions based on an overall impression of the product (Häubl and Trifts, 2000), it might be worthwhile to explore alternatives for potential customers who seek to comprehensively explore and analyze product reviews in-depth to identify nuggets of information that might help them to make more confident data-driven purchase decisions.
2.2. Tools and Techniques to Support Serendipitous Data Discovery and Analysis
Researchers in recommender systems — a subclass of information filtering systems — focused on identifying data items by predicting how a user might rate the item (Ricci et al., 2011) across various domains, including and beyond online products. Although research in this area has mostly focused on the accurate prediction of user preferences, there has been a recent interest in exploring methods beyond traditional accuracy-based metrics (Kaminskas and Bridge, 2016). For instance, researchers have explored metrics to diversify data recommendations (Shi et al., 2012), provide novel recommendations (Zhang et al., 2002), or support serendipitous discovery of data items (Onuma et al., 2009). Among various beyond-accuracy metrics explored in prior works (Kaminskas and Bridge, 2016; Herlocker et al., 2004), serendipity has received significant attention in the last decade.
The term serendipity is often referred to as the process of finding valuable or surprising things that are not looked for (Andel, 1994; Herlocker et al., 2004). Others have defined serendipity as a combination of surprise and relevance (Herlocker et al., 2004). However, existing methods adhering to such definitions have mainly focused on suggesting relevant data items and rejecting irrelevant ones (Kotkov et al., 2016; Marchionini, 2006), which may lead to neglecting unpopular or marginalized opinions. For instance, consider a reader reading product reviews of headphones using a system that suggests reviews to the reader based on relevance. If the reader reads reviews that focus on the price, they might receive more, albeit different, suggested reviews about the price. They might not be suggested reviews regarding other aspects such as color or sound quality because the system may consider these aspects irrelevant based on what the reader has been reading. As a result, the reader might make a purchase decision without learning about other aspects of the headphone that might be important to them. In contrast, we consider serendipity to be an unexpected yet beneficial discovery of information that adds to the readers’ knowledge. Our goal is to support the serendipitous discovery of unexpected information that could help readers broaden and improve their knowledge acquisition instead of reinforcing their existing preconceptions with relevant data items.
Previous research in data visualization has explored ways to support serendipitous discovery and analysis of data (Alexander et al., 2014; Dörk et al., 2012; Isaacs et al., 2014). For instance, Bohemian Bookshelf provides visualizations for exploring book collections that enable people to discover trends and relations within the collection in a playful manner (Thudt et al., 2012). Another work, Serendip, provides a topic modeling tool with multiple views. It focuses on intermixing different scales of data inquiry and information types by visualizing the relationships between the data items (Alexander et al., 2014). Another visualization tool that promotes serendipitous discovery is PivotPaths (Dörk et al., 2012). It enables playful and casual exploration of interlinked metadata using visual paths in enticing arrangements to motivate people to explore the information. Footprints is another analytics tool that uses multiple interconnected visualizations to help users navigate through news articles (Isaacs et al., 2014). Footprints also enables people to tag the data as Read, To Read, and Useful to track exploration progress and data coverage.
While these tools provide functionalities to support the serendipitous exploration of documents, their effectiveness for exploring relatively large text documents, including academic papers, books, and news articles, may not translate to product reviews, which are relatively shorter and often free-form in nature. Furthermore, these tools often enable the exploration and analysis of large text corpora at the summary level. For instance, PivotPaths enables serendipitous discovery of relationships between facets such as author name, venue, and keywords, but not the actual text content of academic publications. Similarly, Footprints enable serendipitous discovery of topics and other metadata such as dates and sources, but not the text content of documents. In this work, we investigate how providing serendipitous information at the text level might impact the data exploration and analysis process. To do so, we explore how methods that intend to support serendipitous information discovery and analysis in the context of online provide reviews might impact customers’ purchase decisions.
2.3. Approaches to Increase Data Coverage and Avoid Biased Exploration
Prior work suggests that users of analytics tools are often prone to biases when exploring data (Wall et al., 2017; Ellis, 2018). While interacting with the data and system artifacts, a user’s internal biases and presumptions towards the data can impact the exploration and analysis process (Wall et al., 2017, 2019; Hu et al., 2009). Such biases include oversensitivity to consistency (Heuer, 1999; Wall et al., 2017), where an analyst tends to interact with data that supports the broadest encompassing hypothesis, and they dismiss other data. In the product review domain, this bias may manifest and influence a reader to read reviews that are predominantly positive or predominantly negative based on the aggregation of reviews (Hu et al., 2009; Chen et al., 2016). Furthermore, biases such as persistence of impressions based on discredited evidence (Heuer, 1999; Wall et al., 2017) influence analysts to continue interacting with data that supports a hypothesis but has been disproved already. This bias can influence readers to make biased decisions based on their brand or product preference, even when reviews highlight issues with their preferred products. One approach to mitigating such biases could involve exposing the differences between the data a user has explored and the overall characteristics of the complete underlying data, making users aware of their innate biases that might be injected during their data exploration (Wall et al., 2017; Collins et al., 2018; Hu et al., 2009).
Existing systems designed towards combating such biases often provide visual and navigational cues on how the user has been exploring the data and interacting with the system to inform users of potentially biased interactions and exploration (Sarvghad et al., 2016; Isaacs et al., 2014; Wall et al., 2019). For instance, Sarvghad et al. proposed a visual analytics tool to provide analysis history to highlight the dimension coverage of data dimensions explored by the user (Sarvghad et al., 2016). These data dimensions are comprised of different attributes present in tabular data. The tool employed a variation of scented widgets to assist analysts in forming questions based on their past data exploration patterns. Wall et al. (Wall et al., 2019) also experimented and modeled users’ potential biased behavior while using scatterplots based on the history of their data exploration patterns.
While these tools, methods, and experiments shed light on the potential of providing navigation cues to avoid biased exploration and increase data coverage, they are primarily focused on ordinal, categorical, or numerical data. Furthermore, these tools were not designed to investigate how providing such information may impact readers’ knowledge acquisition before making purchase decisions based on product reviews. As such, the effects of supporting serendipitous discovery and analysis of reviews to help readers explore, cover more information, and gather knowledge prior to decision-making remain largely unexplored.
3. Serendyze
Serendyze is designed and developed as an interactive text analytics system that intends to propel readers to explore and analyze product reviews more comprehensively before making purchase decisions. Here, we describe different components and functionalities integrated with Serendyze along with the exploration metrics and bias mitigating model, which are intended to support serendipitous discovery and analysis of product reviews.
3.1. Exploration Metrics
In this work, we propose three interaction-driven exploration metrics — Visit, Coverage, and Distribution. The exploration metrics are designed to enable readers to track their data exploration progress and patterns (see Fig. 2).
3.1.1. Visit
Visit is a measure of reviews a reader has explicitly interacted with. To measure the Visit metric, Serendyze maintains a list of reviews that the reader has marked as read as the visited list, . Visit is simply the percentage of reviews marked as read by the reader from the total number of reviews for the product () using equation 3.1.
| (3.1) |
3.1.2. Coverage
We define Coverage as a measure of reviews the reader has knowledge of either explicitly or implicitly. We assume that a reader has explicit knowledge about a review if they have visited (read) the review and implicit knowledge about a review () if they have already visited (read) another review () that is semantically similar to the review () (Corley and Mihalcea, 2005). For instance, consider two reviews on the same product:
Good Headphones, Great for the price. The headphones work quite well. They don’t feel like great headphones but they have held up pretty well and produce good sound.
and
Great sound, affordable. Great sound for the price and seem like they will last for a while. A good value for the price as well.
These reviews are sufficiently semantically similar that they can be considered redundant. As such, if a reader visits one of these reviews by marking it as read, we conclude that they have covered the other review. The Coverage metric thus tracks the percentage of reviews the reader has either explicit (visit) or implicit (semantically similar) awareness of.

To measure Coverage, we first convert each review to a vector representation which embeds semantic information using Doc2Vec (Le and Mikolov, 2014). While Doc2Vec is a generalization of the popular Word2Vec (Mikolov et al., 2013) embedding, Doc2Vec’s advantage over Word2Vec is its applicability on variable-length documents, making Doc2Vec suitable for embedding product reviews that usually vary in length. We decided to use Doc2Vec over other bi-directional language models, such as BERT (Devlin et al., 2018) and Elmo (Peters et al., 2018) as it is more interpretable and less computationally expensive (Lau and Baldwin, 2016) for measuring the semantic similarity among reviews in zero-shot environments. However, due to the modular design of Serendyze, Doc2Vec can be replaced with more contemporary transformer-based models for appropriate tasks.
Serendyze maintains three live lists of Doc2Vec vectors of reviews: visited (), unvisited (), and covered (). When a review is visited, pairwise cosine similarity (Gomaa et al., 2013) between and is measured. Based on experiments and pilot studies, we use a normalized similarity score of as the threshold to determine if a review is similar enough to be considered redundant and placed in the covered list (). Any review from the unvisited list with a similarity score of at least to any review from the visited list is added to the covered list (). Finally, the Coverage value is measured as the percentage of covered reviews — reviews that a reader has implicit or explicit knowledge about — from the total number of reviews () for the product using equation 3.2. Note that the visited list () is a subset of the covered list () as the latter contains all visited reviews with additional redundant reviews.
| (3.2) |
3.1.3. Distribution
We define Distribution as a measure of the relation of reviews the reader has visited from different facets, such as sentiments, to the true distribution in the dataset. For this study, we considered sentiments (positive, neutral, and negative) as the facet to measure Distribution. However, these facets can be customized to include star ratings, sentiments, topics, other metadata, or text mining results. In our study, Distribution is a measure of consistency and equilibrium of a reader’s review exploration of various sentiments. For instance, if a reader focuses heavily on positive reviews while ignoring negative or neutral ones, we consider such exploration patterns not well-distributed. To measure Distribution, Serendyze counts the total number of positive, neutral, and negative reviews for a product. During use, Serendyze maintains separate lists of positive, neutral, and negative reviews that a reader has visited. As the reader continues to visit reviews, the proportions of visited sentiments are calculated using equation 3.3, where is the visited list of sentiment and is the unvisited list of sentiment . can be positive, neutral, or negative.
The Distribution metric is designed to help readers understand how well their visit history reflects the true distribution of sentiments. For example, if a dataset contains vastly more positive reviews than other categories, an unbiased sample of the data would also contain more positive reviews. Because it measures proportions and not the number of reviews, by aiming for the Distribution measure for each sentiment to be equal, the reader could ensure their understanding is reflective of the dataset’s true distribution of the sentiments. In this way, the Distribution metric intends to help readers identify if their review exploration is skewed towards a particular category of sentiment and negligent of others.
| (3.3) |
While reading reviews, if a reader’s Distribution metric for a sentiment exceeds the Distribution metrics of other sentiments by more than 7%, it is flagged as a tendency to lean towards that sentiment. Note that Distribution detects imbalance based on the proportions of reviews visited for each sentiment, not the absolute number. For example, if a reader is focusing on positive reviews to the point where the proportion of positive reviews visited exceeds the proportion of negative and neutral by 7% or more, we consider the reader’s exploration is skewed towards positive reviews. In this way, the measure helps readers stay aware of how their visited reviews reflect the true distribution.
The threshold of 7% was determined in pilot testing. We found that a threshold lower than 7% too aggressively penalized exploration of a certain sentiment. In contrast, a higher value allows readers to neglect other sentiments for a longer period. The strictness of this threshold is fully customizable based on the facets and dataset used.
3.2. Bias Mitigation Model
In this work, we propose a heuristic bias mitigation model to extract and present suggestions to readers based on their interactions with reviews. The model is designed to focus on supporting serendipitous discovery and balanced analysis of reviews by providing suggestions that are intended to encourage readers to visit more reviews and improve their knowledge acquisition about the products. To that end, the model suggests unvisited reviews that are semantically and sentiment-wise dissimilar to the reviews the reader has visited already. The suggestions are intended to mitigate biased exploration and guide readers to an understanding of the data, which is reflective of the true distributions of the semantic and sentiment diversity in the reviews. The complete algorithm to generate the model is presented in Algorithm 1.
There are two major components of the model: (1) The dissimilarity measure that calculates how dissimilar the suggestion is from the reviews that the reader has already visited and (2) The sentiment measure that calculates if the reader is focusing too much on a specific sentiment and neglecting others. The algorithm is called to generate bias mitigating suggestions for every review visited and marked as read by the reader using Serendyze. Serendyze maintains several lists, including lists of Doc2Vec vectors of visited () and unvisited () reviews, and a list of suggestions the reader has visited (). The list of visited suggestions also contains flags about the primary reason a suggestion was made (to maximize dissimilarity or unbias sentiment).
For each prospective suggestion , the projected distribution of sentiments is calculated (lines 7–10). Serendyze calculates the coefficient of variation (, line 11), a measure of relative variability measured by the ratio of standard deviation to the mean of the visited review proportions of different sentiments. A coefficient of variation of less than 1 indicates that the reader is exploring reviews of different sentiments in a distributed fashion. Higher values indicate a greater degree of variability and unbalanced exploration. Then, Serendyze calculates pairwise cosine similarity measurement from () to every review in the visited list () to generate a maximum dissimilarity score.
When suggesting would not result in a high , the sentiment score for is assigned as (lines 13–14). This results in a relatively high score of , which is appropriate as suggestions that do not introduce sentiment distribution biases are preferred. When suggesting would unbalance the sentiment distribution , the sentiment score is inversely related to the proportion of ’s sentiment already visited. As a result, unvisited reviews with sentiments that have not been visited (lower proportion value) will now be scored higher.
For example, if a reader has been exploring too many positive reviews, they will gradually start to receive negative and neutral reviews as suggestions. This will increase the chances of an unvisited review with a potentially neglected sentiment to be ranked higher by the model, increasing the reader’s chance of receiving diverse suggestions. The final score is a weighted combination of and . The default weighting is equal (line 18), and the adjustment of weighting factors is discussed below. The top 5 scoring suggestions are returned.
To balance between the two major components of the model, so that one component does not dominate the other while ranking unvisited reviews as suggestion candidates, Serendyze calculates two score modifiers (), where is the dissimilarity modifier and is the sentiment modifier. When a reader visits suggestions, the modifiers track the proportion of suggestions that were primarily made for each component (, where ) (line 2). The primary component guiding a suggestion is set on lines 22–25.
Thus, once some suggestions have been visited, the default scoring formula is replaced with modifier values (line 20). With these modifiers, the unvisited reviews are scored in a way that ensures that one component will not dominate the scores. For example, if a reader is visiting suggestions whose scores are dominated by dissimilarity, the sentiment modifier () will gradually increase in value and start to dominate the score. As a result, the reader will receive suggestions geared towards different sentiments from what they have been visiting instead of the semantic dissimilarity of visited reviews. This extension is critical for the readers to receive diverse suggestions that support serendipitous review discovery and develop an unbiased understanding of reviews.
3.3. User Scenario
We present an example scenario to motivate the design and integration of exploration metrics and bias mitigation model with Serendyze. Consider Naomi, who is planning to purchase headphones for her brother as a present. She wants to find the best option within her limited budget. So, she prefers to explore headphones online with many available options and product reviews to evaluate their values. However, from her previous experiences of purchasing products online, she lacks confidence in gathering enough knowledge about different headphones to make the right decision.
Naomi decides to use Serendyze to explore headphone reviews. She starts by selecting a headphone. Then she reads several reviews and marks them as read. While looking through the suggestions, she finds one that talks about the value of the headphone given the price point. She hovers over the Coverage bar and finds out from the scented widgets embedded within the keywords that she has not visited any reviews regarding the headphone price. She uses the appropriate keyword to filter reviews that mention price. At some point during the exploration, she realizes by looking at the Distribution bar that she has been mostly visiting positive reviews. She filters the reviews by Negative and finds reviews that show the deficiencies of the headphone, balancing out her overall impression of the headphone. Since Serendyze keeps a record of her review exploration, she keeps switching between different headphones and learns more about them without the risk of losing her exploration progress. She gradually narrows down to a headphone best suited for her needs. She hovers over the metrics bars and sees that she has covered aspects important to her, and she has also visited a balanced distribution of positive, neutral, and negative reviews. She proceeds to purchase the headphones with confidence that she is informed enough about different headphones to make the best decision.
3.4. System Description
Serendyze is an interactive text analytics system designed and developed to help readers explore, analyze, and gather knowledge from product reviews. Serendyze is designed to support customers who approach reviews in an exploratory manner, as opposed to those who make decisions based on strong personal preferences, such as brand affinities. It is intended to help readers who have not decided to purchase a product and want to comprehensively explore options before doing so.
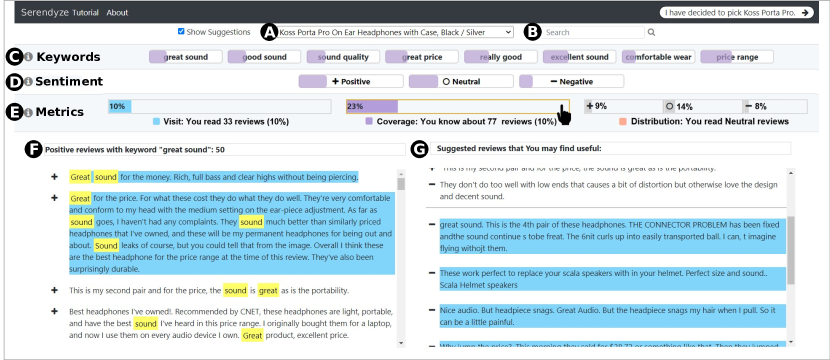
We compartmentalized the Serendyze interface into several components, including a dropdown option for selecting a product (Fig. 3(A)), a search bar to search for any word present in reviews (Fig. 3(B)), a set of filters corresponding to the most frequently occurring keyword pairs (Fig. 3(C)), filters for positive, neutral, and negative reviews (Fig. 3(D)), the exploration metrics including Visit, Coverage, and Distribution (Fig. 3(E)), and finally, two sets of reviews — all product reviews (Fig. 3(F)), and suggestions generated by the bias mitigation model (Fig. 3(G)). In this section, we describe the functionalities of these components.
3.4.1. Keywords and Search
Serendyze extracts keywords from reviews by identifying all word pairs that co-occur at the document level, where a document is one complete review. For visual clarity, we used the top-8 most frequent word pairs as representative keywords for each product. These keywords can be used as filters to explore relevant reviews (Fig. 3(C)). Serendyze extracts relevant reviews by performing an approximate string search (Baeza-Yates and Navarro, 1996) to identify reviews that contain one or both words from the keyword pairs (Chang et al., 2009). After filtering the reviews, it highlights all occurrences of the words present in the selected keyword pair (Fig. 3(F)).
The Search functionality is implemented as an extension of the keyword filters. The readers can use the search bar (Fig. 3(B)) to search for any word that might be present in the reviews for the selected product. Upon a successful hit, Serendyze filters the reviews based on the search query and highlights the search word in the reviews.
Serendyze is designed to be modular and customizable with the option to be outfitted with contemporary topic modeling and keyword extraction methods (Jelodar et al., 2019). However, due to their probabilistic nature, potential uncertainties in such systems might pose a threat as a confounding factor. As such, we decided to follow a deterministic and explainable method to extract keywords.
3.4.2. Sentiments
In Serendyze, each review is considered as an individual document, and the reviews were categorized using the associated star rating at the document level. We categorized reviews that gave the product 1-star or 2-star rating as negative (), 3-star rating as neutral (), and 4-star and 5-star rating as positive (). Prior works suggest a close interplay between star ratings and product reviews (Tsang and Prendergast, 2009) and show that they are highly correlated (Ganu et al., 2009). While Serendyze could be outfitted with an off-the-shelf, state-of-the-art, or novel sentiment analysis method (Yadav and Vishwakarma, 2020), to avoid algorithmic misclassification and maintain transparency, we refrained from using automated sentiment analysis and used star-ratings as user-defined deterministic indicators of valence towards the products. However, we did not use the star rating directly as facets, nor incorporated them into the interface directly, because previous studies have also shown that when presented visually, star ratings have an undue cognitive impact compared to sentiments (Schreck and Chin, 2019). For instance, a review with two visible stars might be perceived more negatively than a positive review with four visible stars (Schreck and Chin, 2019). We do not claim that star ratings are wrong or unreliable. However, they are not appropriate to be presented visually in our study, as we intended to avoid adding visualizations that might impose additional cognitive impact and distract users from exploration metrics visualization. In addition to keywords, these positive, negative, and neutral sentiments associated with reviews can also be used as filters (Fig. 3(D)).
3.4.3. Exploration Metrics
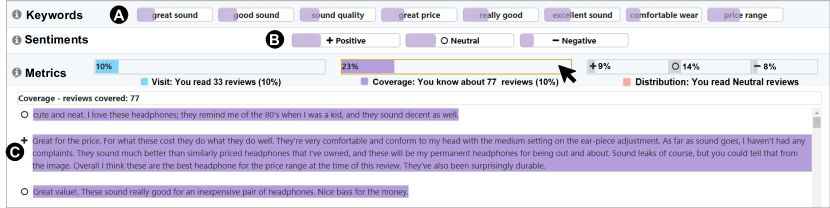
In Serendyze, we present three interaction-driven exploration metrics — Visit, Coverage, and Distribution — using a set of bar charts. Readers can use these bar charts to access their data exploration patterns. We used horizontal bar charts to visualize Visit and Coverage metrics as they represent percentage values for data visits and data coverage. We represent Distribution using a set of bar charts that depict the proportion of available positive, neutral, and negative reviews visited by the reader (Fig. 3(E)). Each exploration metrics bar is annotated with an explanation of the reader’s exploration patterns. For example, in Fig. 4, the text below the Visit bar suggests that the reader has explored 33 reviews which is 10% of the total reviews for this particular product and the text below Distribution suggests that while reading 33 reviews, the reader has been focusing mostly on Neutral reviews.
The Visit and Coverage bars can be interacted with in two ways. First, hovering over these bars transforms the keywords and sentiment filters into scented widgets (Willett et al., 2007), providing visual cues of exploration metrics for each keyword pair and sentiment category. For example, in Fig. 4 when the reader hovered over the Coverage bar, the keyword pairs (A) and sentiments (B) filled up corresponding to the reader’s exploration progress at that time. Serendyze follows the visual information seeking mantra (Shneiderman, 1996) to trigger the scented widgets on demand to reduce interface clutter and avoid cognitive overload when delivering visual information. The second interaction allows readers to drill down and read relevant reviews in detail by clicking on the metrics bars. For example, clicking on the Coverage bar allows readers to filter and see the reviews covered (Fig. 4(C)).
3.4.4. Product reviews.
Serendyze provides two sets of reviews — all reviews from the selected product (Fig. 3(F)), and a set of 5 suggestions (Fig. 3(G)) generated by the bias mitigation model. The model is intended to promote serendipitous discovery and analysis of product reviews by providing readers with suggestions that introduce them to features, attributes, or other knowledge related to the selected product that they have not considered or experienced at a rate representative of the true data.
In this work, we used a heuristic bias mitigation model as proposed in 3.2 to suit our study objectives. However, we developed Serendyze as a modular and customizable platform where the bias mitigation model could be replaced with another model that could be used to generate suggestions suitable for other study tasks and domains. For example, the heuristic bias mitigation model used in this study that focuses on semantic and sentiment-wise dissimilarity could be replaced with a neural model to suggest similar, popular, or relevant reviews.
The exploration metrics and bias mitigation model rely on the reader to mark the reviews they have visited already. We enabled two ways to mark a review as read. The readers can click on any review or hover over a review to mark it as read. Previous research on user interaction with interface artifacts suggests that mouse movement is correlated with eye-tracking (Rodden and Fu, 2007; Demšar and Çöltekin, 2017; Sedlar et al., 2007). They also suggest that readers are often prone to hovering instead of clicking with interface artifacts (Ha et al., 2020), probing us to include such an alternative. The amount of time needed to hover over a review to mark it as read is dynamic and depends on the length of the review. In this work, we used a dynamic range from 1 sec to 5 sec to register the hover time to mark a review as read based on the average reading speed of adults (Rayner et al., 2010) and the length of each review. When a reader marks a review as read, the bias mitigation model is called, and Serendyze renders an updated set of suggestions. Based on the feedback from the pilot study, we retained the suggested reviews that are marked as read below the new suggestions in a chronologically descending order to enable users to keep track of their work (Fig. 3(G)). Serendyze saves a readers’ review exploration by session. As a result, switching between products does not remove the reviews marked as read.
3.5. Implementation Details
We developed Serendyze as a web application with an HTML, CSS, and JavaScript front-end and a Python backend. The Doc2Vec embedding, cosine similarity, and other natural language processing functionalities, including identifying representative keyword pairs, are calculated using the gensim library (Řehůřek and Sojka, 2010). The Python scripts were hosted in a freely available server (pyt, 2021). Upon interaction with the reviews, the front-end fires a request with the list of visited and unvisited reviews, and the server returns the coverage, distribution, and suggestions.
The system’s scalability is dependent on the number of reviews per product. We stress-tested the system with over 10000 reviews across 10 products, each containing over 1000 reviews. Measured over 100 attempts, it takes Serendyze an average of seconds to return suggestions for a product with 1000 product reviews. We performed the tests on a laptop with an Intel Core i5 7th generation processor (7300HQ) and 8 gigabytes of RAM, running on localhost. The source code is publicly available for viewing222https://osf.io/jmqx2/?view_only=144115224a204dea8e2104cb829b9606.
3.6. Pilot Study
Before deploying Serendyze in the real world to study how people use the system to explore online product reviews, we performed a pilot study simulating the same experience with 12 participants (Pi-1 to Pi-12). We recruited participants (8 males and 4 females, years of age on average) using word of mouth and email across different countries. The goal of the two-week-long pilot study was to simulate and assess the system workflow, identify potential interface issues, and whether participants could use the functions provided in Serendyze to explore the data comprehensively.
This pilot study helped us to better realize and solidify operational procedures to perform real-world deployment of Serendyze. Based on the feedback from the pilot study, we modified the system interface and tuned the threshold values for similarity and distribution. We modified the interface by revising the Distribution visualization and used three distinct bars to represent the true distribution of positive, neutral, and negative reviews instead of one aggregate value. We also added functionalities to display the already visited suggestions in chronologically descending order below the newly generated suggestions. Finally, we fixed several interaction issues, including adding a loading symbol to provide visual feedback that the bias mitigation model is generating new suggestions. We also adjusted the hover time needed to mark a review as read and made other small improvements.
4. Evaluation
To evaluate the viability of supporting serendipitous discovery and analysis of product reviews using exploration metrics and bias mitigating suggestions, we performed a user study with 100 crowd workers. The study was approved by the institutional review board. In this section, we explain the study conditions, participants, procedure, and findings.
4.1. Conditions
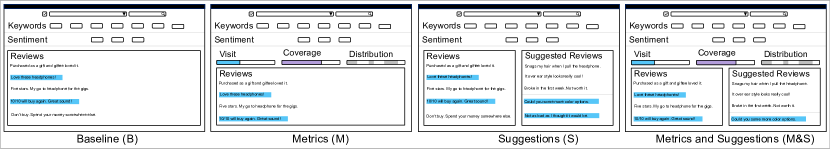
The study was between subjects with four conditions, as presented in Fig. 5. Condition B is the baseline, condition M is the Serendyze version with exploration metrics only, condition S is the Serendyze version with the suggestions only, and condition M&S is the Serendyze version with both metrics and suggestions. Each of these conditions has a set of basic components in common — the option to select products, the representative keywords, the positive, neutral, and negative sentiment categories, and the reviews. All conditions enabled users to filter reviews based on keywords and/or sentiments and mark reviews as read by clicking or hovering on them.
We designed conditions M and S to remove confounding factors by evaluating features independently. Condition M&S is the culmination of the Serendyze system with all functionalities.
4.2. Participants
We recruited crowd-worker participants through Amazon Mechanical Turk (Crump et al., 2013), a popular crowdsourcing platform used to conduct studies requiring human intelligence. All of our participants were from North America and were Amazon Master Workers who received the qualification for consistent demonstration of a high degree of success in performing a wide range of tasks across many requests. 25 Master Workers were assigned to each condition. Each participant was compensated with USD $15.
We asked participants to fill out a pre-study questionnaire to help us understand their online shopping practices and preferences. The response to the questionnaire suggested diverse shopping practices across our participants. The overwhelming majority of our participants were familiar with purchasing products online, as 99/100 participants mentioned they purchased at least 1 online product weekly. Out of 100 participants, only one had never purchased a product online, 37 participants purchased 1–5 products per week, while 31 participants purchased 6–10 products, and another 31 participants purchased more than 10 products. Furthermore, 22 participants spent less than 10 minutes, 29 participants spent 10–20 minutes, 22 participants spent 20–30 minutes, and a final 27 participants spent more than 30 minutes reading product reviews before making purchase decisions. 8 participants were a little dependent on product reviews, while 43 were moderately dependent and 42 were significantly dependent. Another 7 participants were completely dependent on product reviews.
4.3. Dataset
In this study, we used a subset of publicly released Amazon product reviews (He and McAuley, 2016) as an example corpus to evaluate Serendyze. Among numerous products, we selected headphones as the candidate due to their ubiquitous usage (Statista, 2021). Among thousands of headphones in the dataset, we selected three random headphones with over 5000 reviews each, with an average star rating between and . We chose these conditions to select popular headphones that are not obviously superior or inferior to each other. These three headphones were Koss Porta Pro, Sony MDRV6 Studio, and Sennheiser HD280PRO. We removed all reviews that contained HTML content or languages other than English. As mentioned in Section 3.4.2, we assigned these reviews to positive, negative, and neutral sentiments based on the associated star ratings. To keep the number of reviews reasonable for the study participants to read and make decisions, we randomly sampled 120 reviews each for positive, neutral, and negative sentiments for each headphone, aiming for approximately 1000 reviews in total. Based on previous work (Woolf, 2014) and Amazon’s product review guidelines (Amazon, 2021), we then removed reviews that are less than 10 words long and more than 100 words long to maintain the length of the reviews at a reasonable level — suitable for the participants to read and make timely decisions. Finally, we ended up with 880 reviews with 338 reviews for Koss Porta, 277 reviews for Sony, and 265 reviews for Sennheiser. There were 340 positive, 277 neutral, and 263 negative reviews in total across all three headphones. Our sampling did not follow the actual distribution of sentiments present based on star ratings since the headphones chosen were rated mostly positively, and that would result in a dataset with too few neutral and negative reviews. This would make it difficult to reasonably study participants’ review exploration across different sentiments. Rather, the dataset was constructed to match the study design so that participants could not immediately distinguish among three headphones based on sentiment distribution, and they had to rely on reading reviews to make their decision. We used the same dataset with all four conditions.
4.4. Procedure
We asked participants to explore reviews of each of the three headphones using assigned versions of Serendyze and make a decision to refer one of the headphones to someone they know. We asked them to recommend one of the headphones to others instead of buying for themselves in an attempt to motivate participants to learn about these headphones beyond personal preferences. We randomized the procedure of assigning conditions to participants by providing a single link to all crowd workers who participated in the study. This link would then redirect the participant randomly to one of the four conditions. We also kept a record of studies performed with each condition, and when a condition reached 25 studies, we randomized the remaining redirections to the conditions still not exhausted.
Each study procedure began with participants’ agreement to sign the consent form. After signing the consent form, participants were asked to answer a pre-study questionnaire that asked questions about their prior online product review exploration and purchase experiences, including the time spent, the number of reviews read, and products purchased. We also asked their favorite headphone brands or feature preferences to see if they influenced their decisions.
After the pre-study questionnaire, we directed the participants to the tutorial section, featuring a recorded video tutorial explaining the procedures and functionalities of the Serendyze condition assigned to them. These videos lasted up to 3 minutes, depending on the condition. Participants could rewind the video but could not skip forward. At the end of the video tutorial, the participants proceeded to the study task. An extended tutorial with annotated figures was also provided to participants and was accessible anytime from the navigation bar. In both tutorials, we only presented the features and functionalities for the condition’s components. We did not disclose the goal of our study or demonstrate any pre-defined exploration patterns to avoid biasing participants’ review exploration.
We instructed the participants to thoroughly read the reviews for all three headphones during the study and decide on a product to refer to others. They were also instructed to spend at least two minutes on each headphone. During these instructions, we did not inform the participants about the goal or hypotheses of the study and did not provide them with any pre-defined exploration patterns or hints. In contrast, the participants were instructed to explore the reviews in any way they wanted, using the features provided in their study condition to make recommendation decisions. After deciding, we asked them to finalize their decisions and proceed to the post-study questionnaire.
In the post-study, we asked participants open-ended questions to learn about their experiences using Serendyze to explore reviews before decision-making. In the post-study questionnaire, we added attention checks to identify whether the participants’ answers matched their activity during the study. We also asked them questions about their usage of exploration metrics and suggestions, their ease of use, how useful they found exploration metrics and suggestions, and how they utilized them while exploring reviews. Furthermore, we asked them what they liked and disliked and what issues they faced while working with Serendyze. For both the pre-and post-study questionnaires, we asked the participants to answer all questions and ensured that they passed the attention checks before compensating them for their participation. The attention checks included questions to verify if the participants could recall information about the headphones. All participants passed the attention checks and were compensated.
4.5. Data Collection and Analysis
We collected usage logs containing the participants’ timestamped interactions with all components of Serendyze and stored them for later analysis. We collected the participants’ responses to the pre-and post-study questionnaires, the time they spent answering the questions, and the time they spent on the study. We embedded the questionnaires with the study platform so that the participants did not have to traverse multiple websites to participate in the study.
We analyzed the collected data both quantitatively and qualitatively. We used parametric and non-parametric inferential statistics to analyze the quantitative data. We analyzed the qualitative data collected from the responses to pre-and post-study questionnaires using an open-coding method (Burnard, 1991). Two coders separately and independently coded the questionnaire data collected from condition M&S as it contains all interventions and potentially most variable data. To do so, the coders used spreadsheet applications (Google Sheets and Microsoft Excel) to perform iterative coding in a structured manner. They treated each pre-and post-study questionnaire and their responses individually and performed multiple passes on each response and assigned codes reflective of these responses. Once all responses were coded by both coders separately, they discussed and reached an agreement to consolidate their codes into a representative set of codes. The inter-coder reliability measured using Krippendorff’s alpha (Krippendorff, 2011) was . Based on these codes, one coder coded the remaining data collected from conditions B, M, and S, and the other coder verified the codes. The data collected from pre-and post-study and the codes for qualitative analysis are provided as supplementary materials.
4.6. Findings
Our research questions investigate whether supporting serendipitous discovery can help readers explore reviews more comprehensively, how their exploration behaviors change with access to their exploration patterns, and how suggestions of unexplored reviews might impact their decision-making. We formulated the following hypotheses to answer these questions:
-
(1)
H1 - Comprehensive: Participants who had access to the exploration metrics will cover more reviews.
-
(2)
H2 - Unbiased: Participants who had access to the exploration metrics will read a more balanced distribution of reviews.
-
(3)
H3 - Confident: Participants who had access to both the exploration and suggestions will have greater confidence in their decision.
To evaluate our hypotheses, we analyzed the collected quantitative and qualitative data from 100 crowd workers across four different conditions (B, M, S, M&S). We present the findings from our analysis in this section.
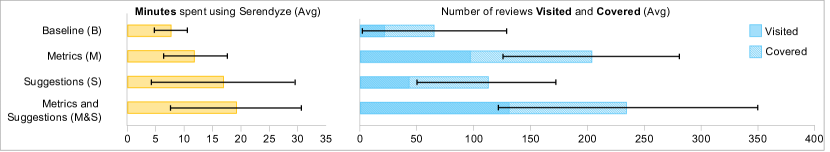
H1: Participants who had access to the exploration metrics covered more reviews. We collected the number of reviews across different products that the participants had covered explicitly or implicitly. We posited that the participants had explicit knowledge about any review that they visited and implicit knowledge about all reviews that were semantically similar and redundant to the reviews they had explicit knowledge about. Fig. 6 presents the number of reviews covered on average across all conditions and suggests that the participants who used conditions (M and M&S) with exploration metrics covered more reviews on average ( and ) compared to the conditions (B and S) without exploration metrics ( and ). The average coverage to the time-spent ratio for conditions B, M, S, and M&S are , , , and , respectively. These ratios show that the participants who used conditions M and M&S had a higher average coverage to time-spent ratio than those who used conditions B and S. A higher coverage to time-spent ratio suggests that the participants spent less time covering more reviews. As such, our results suggest that the participants who had access to exploration metrics covered more reviews efficiently by spending less time to gain more knowledge about the products.
| Factors | Degree of Freedom | Mean Sum of Squares | F-value | Pr(¿F) |
|---|---|---|---|---|
| Conditions | ||||
| Products | ||||
| Conditions : Products | ||||
| Condition Pairs | Difference | Lower-bound | Upper-bound | P-adjusted |
| Metrics (M) - Baseline (B) | ||||
| Suggestions (S) - Baseline (B) | ||||
| Metrics and Suggestions (M&S) - Baseline (B) | ||||
| Suggestions (S) - Metrics (M) | ||||
| Metrics and Suggestions (M&S) - Metrics (M) | ||||
| Metrics and Suggestions (M&S) - Suggestions (S) |
To evaluate H1, since the coverage value for all conditions passed the Shapiro-Wilks test, we performed a two-way ANOVA test with two factors — conditions and products. Table 1 presents the results of the test. The results suggest a statistically significant difference in average reviews covered by participants across conditions. Furthermore, there are no statistically significant differences among different products and the interactions between the conditions and the products. A Tukey posthoc test revealed statistically significant pairwise differences between the conditions that provide exploration metrics (M and M&S) and the conditions that do not (B and S). We posit that the pair Metrics and Suggestions (M&S) - Metrics (M) are not statistically significant because they both provide exploration metrics. Based on the results, we conclude that people with access to exploration metrics covered more reviews, and consider H1 to be supported. The participants’ responses also corroborate these results. Participants in condition M explained how they used the exploration metrics: P31 mentioned,
I used exploration metrics to review enough to make a satisfying estimate of the value of each product. [Coverage] showed me which reviews I hadn’t covered yet, so I could read [those reviews] to get a better opinion.
Another participant (P45) said,
I wanted to read a good amount of all kinds of reviews – positive, neutral, and negative. The Distribution helped me see if I was doing that. […] I also used Coverage to save time so I didn’t read too many redundant reviews.
The participants who used condition M&S highlighted how having access to exploration metrics helped them read reviews more comprehensively before making decisions. P90 said,
The exploration metrics helped me to see what percentage of reviews I had really read to see if I was getting a full picture or not. […] It helped me to make sure that I know about enough reviews before making a decision.
Another participant (P85) mentioned
I used exploration metrics to make sure I was looking at the various types of reviews, including neutral and negative. I wanted to make sure I had read enough of each of these types to make a final decision.
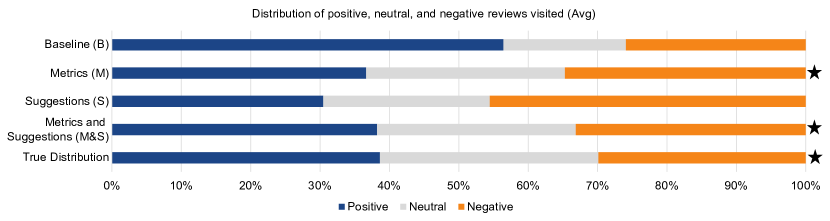
H2: Participants who used exploration metrics read positive, neutral, and negative reviews in a balanced way. For each participant, we collected the number of positive, neutral, and negative reviews they visited. The distribution of the percentage of positive, neutral, and negative reviews visited by participants is presented in Fig. 7. The figure indicates a notable difference between conditions. The participants who used conditions M and M&S with exploration metrics visited reviews from all sentiments in a balanced manner, reflecting the true distribution of sentiments present in the dataset used. Among 2411 reviews visited by participants in condition M, on average, each participant visited 35 24 positive, 27 15 neutral, and 33 19 negative reviews. The participants in condition M&S visited 3268 reviews where on average, each participant visited 49 44 positive, 37 24 neutral, and 43 23 negative reviews. In contrast, the participants in condition B visited 521 reviews. On average, 12 13 were positive, 4 8 were neutral, and 5 7 were negative reviews. Finally, among 1067 reviews visited by participants of condition S, on average, each participant visited 11 11 positive, 9 7 neutral, and 17 14 negative reviews. Fig. 7 shows that without access to exploration metrics, participants visited more positive (B) or more negative (S) reviews. Despite not mentioning the term “balanced” during the tutorial, task assignment, and questionnaires, the qualitative responses for participants suggest that the exploration metrics helped participants explore reviews in a more balanced way — as termed by the participants. 15/25 participants who used condition M and 18/25 participants who used condition M&S mentioned that they used exploration metrics to balance out how they were reading different kinds of reviews so that they did not lean towards one specific sentiment. P28 (condition M) mentioned
I did not want to look at only negative reviews. I used the exploration metrics to make sure I was reading enough reviews of each type.
P49 remarked,
I made sure that I have read a fairly even distribution of all kinds of sentiments, not just positive or negative.
P100, who used condition M&S mentioned how the exploration metrics enabled them to notice an imbalance in their work and seek out other reviews:
I noticed that I had read a lot of positive reviews, so I then read some neutral and negative reviews to balance it out so I got a fuller picture.
P77 said,
It was good to be aware that I was viewing a range of review types, and not solely focusing on only positive or only negative reviews.
These findings suggest that our intervention enabled participants to overcome oversensitivity to consistency (Heuer, 1999; Wall et al., 2017) and allowed them to explore all sentiments. However, 4/25 participants who used condition M and 3/25 participants who used condition M&S decided not to use exploration metrics. While two of them (P32, P84) mentioned that they
did not feel the need to,
4 other participants mentioned (P36, P44, P50, P88) that they,
explored the data on their own, using their own strategy.
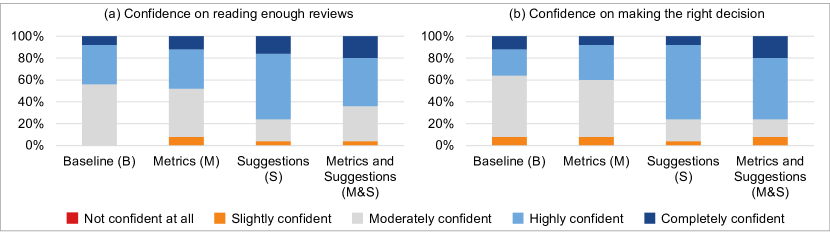
H3: Participants who used both exploration metrics and suggestions were confident in their decisions. To understand how exploration metrics and bias mitigating suggestions impact participants’ decision-making process, we asked each participant how confident they were about reading enough reviews and making the right decision in the post-study questionnaire (See Figure 8). 76% of the participants (19/25) in condition M&S were highly or completely confident that they had read enough reviews. Furthermore, 64% of the participants (16/25) in condition M&S and 76% of the participants (19/25) in condition S were also highly or completely confident that they had made the right decision. However, we did not find similar high confidence among participants who used conditions B or M. This result suggests that bias mitigating suggestions might have played a role in invigorating participants’ confidence in reading enough reviews and making the right decision.
| Condition Pairs | z-score | p-value |
|---|---|---|
| Metrics and Suggestions (M&S) - Baseline (B) | ||
| Metrics and Suggestions (M&S) - Metrics (M) | ||
| Metrics and Suggestions (M&S) - Suggestions (S) |
To evaluate H3, we performed a Kruskal-Wallis rank-sum test, which is a non-parametric test on the distribution of confidence level among participants, since confidence level distribution for all conditions failed the Shapiro-Wilk normality test. The results suggest a statistically significant confidence difference among the participants who used different conditions (B, M, S, and MS). For four conditions, the degree of freedom was 3, the critical Chi-Squared value was , and the p-value was . Hence, we rejected the null hypothesis and followed up by performing a pairwise Mann-Whitney U test with condition M&S against other conditions (B, M, and S). The result of this test is presented in Table 2. The statistically significant pairs are highlighted in boldface with a gray background. The results indicate a statistically significant difference in the confidence of participants on making the right decisions between those who used condition M&S compared to the participants who used condition B () or M (). However, there is no significant difference among the confidence of participants who used condition M&S compared to participants who used condition S (). This lack of statistical significance further supports the observation that the suggestions based on the bias mitigation model might influence participants’ confidence when making decisions. Based on these results, we consider H3 to be partially supported. Although we did not account for it in the study, the pre-study questionnaire suggests that 8/25 participants had either Sony (3 participants) or Sennheiser (3 participants) brand preference. However, the post-study questionnaires suggest only one participant from each group decided to select the headphone of their preferred brand, further suggesting that participants could overcome persistence of impressions based on discredited evidence (Heuer, 1999; Wall et al., 2017) and make more confident decisions that do not mirror their preconceived preferences.
Participants’ feedback also suggests that using exploration metrics and suggestions improved their confidence in their decisions. P87 (condition M&S) mentioned,
…[Serendyze] allowed me to process a lot of information quickly. I could search for a specific feature for each headphone product and feel confident about it because of the large amount of positive and negative reviews.
P83 contrasted their experience of using Serendyze with their regular product review patterns, saying,
I appreciated the Distribution a lot. I am very guilty of reading reviews that back up my existing opinion - justifying a purchase rather than really learning about the product… [Exploration metrics] helped me avoid that.
P93 mentioned how suggestions helped them understand reviewers’ perspectives, saying,
It was a quick way for me to see how others felt about the products, and they gave me more information based on the other reviews that I have already read.
P81 also mentioned how suggestions enabled them to make the right decision by helping them compare between products:
The suggested reviews let me pro and con better as I made my decision.
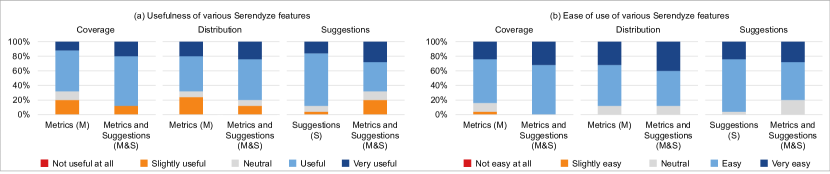
Participants found suggestions to be useful but had mixed feelings about unexpected suggestions. During analysis of the post-study questionnaire, we found that the participants found suggested reviews useful for making decisions. Fig. 9(a) presents how participants perceived the usefulness of different features provided in Serendyze. The figure suggests that 80% of participants (20/25) who used condition S and 68% of participants (17/25) who used condition M&S found the suggestions to be useful or very useful. Responses from the post-study questionnaire suggest suggestions also impacted participants’ decision-making (15/25 for condition S and 13/25 for condition M&S).
We used qualitative responses collected from participants to understand why and how the suggestions helped participants before decision-making. A considerable number of participants in conditions S (13/25) and S&M (12/25) believed suggestions helped them to gain deeper knowledge from reviews. For example, P65 mentioned
I decided to choose the headphones that I chose because they had high marks in regards to audio quality based off of the suggested reviews that I was shown.
Furthermore, 9/25 participants who used condition S and 6/25 participants who used condition S&M highlighted that suggestions helped them find unexpected information that they may not have thought about yet. P90 (condition M&S) mentioned
I liked that it was different from what I was reading. They [suggestions] helped me back up my opinion of the product.
P60 said,
I was suggested reviews I didn’t see in the regular one, especially the ones around comfort and styles. I didn’t think about those at the beginning.
Other participants (5/25 from S and 9/25 from M&S) mentioned that they found the suggested reviews useful for gaining perspectives on opposite opinions and combat biased exploration. P77 mentioned how they leveraged suggestions to get opposite viewpoints, saying,
I would look to the suggestions when I was done reading a particular review and I wanted to read the opposite view. It helped to make sure I didn’t get biased towards a product.
However, not all participants preferred the unexpectedness of the suggestions generated by the bias mitigation model. It should be mentioned that during the introduction, tutorial, task assignment, and pre-study questions, we did not mention to participants how the suggestions were generated. In the conditions (S and M&S) where participants had access to suggested reviews, the interface provided reviews as only the suggested reviews they may like (see Fig. 3). Diving deep into the responses of participants who were taken aback by the unexpected suggestions, we found that they often considered the suggestions unhelpful or not detailed enough. P76 mentioned,
It [suggestions] gave me unhelpful reviews that made me not to trust the system.
P61 explained,
suggested reviews were mostly comprised of short reviews [] that could have been easily generated by bots, so I didn’t trust them.
Some other participants did not find the suggestion useful because they thought that
it did not do a good job
(P76), or they
could not figure out why they [suggestions] are being suggested
(P80). These responses suggest that some participants may have had different expectations from the suggested reviews feature when using Serendyze. These expectations could have been an artifact of a priming effect as people often expect recommendations or suggestions to be similar to what they are exploring rather than offering diversity (Kaminskas and
Bridge, 2016).
We further discuss this observation and its ramifications in Section 5.
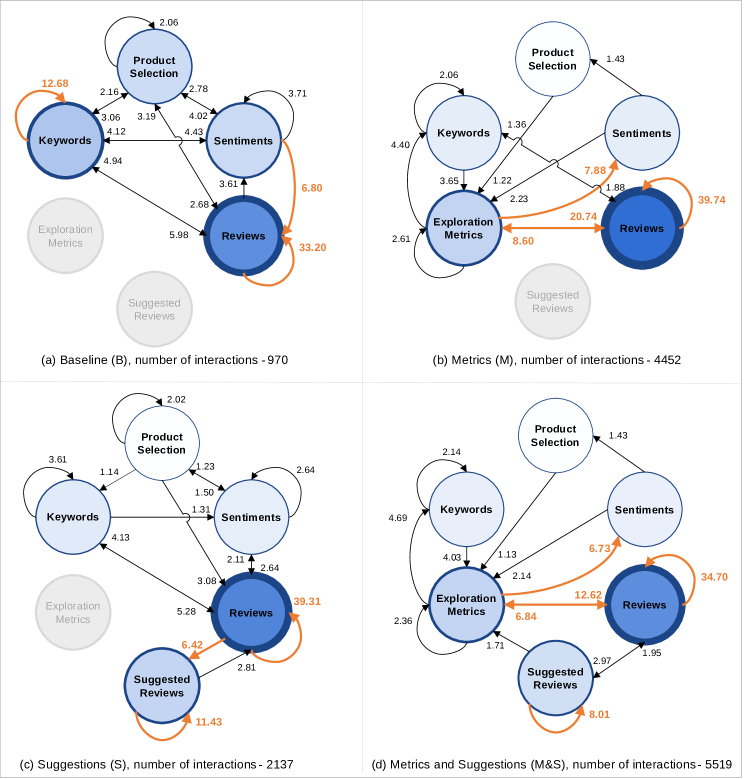
Participants heavily Used Serendyze interventions to perform text-level analysis of reviews. Figure 9 suggests that the majority of participants who had access to exploration metrics and suggestions found them to be useful and easy to use. However, we wanted to explore deeper and learn how the participants leveraged these features to learn more from the data prior to decision-making. We used time-stamped interaction logs to analyze participants’ use of Serendyze features to model their exploratory and decision-making strategies (see Fig. 3). We should emphasize that while designing the tutorial, task description, and pre-study questions, we paid careful attention to not bias participants towards using any particular feature. The product review task, identical across all conditions, asked participants to explore the reviews and decide which headphones they would refer to someone.
Four node-link graphs in Figure 10 show the participants’ usage of and transitions between the six primary components of Serendyze — product selection, keywords, sentiments, exploration metrics, reviews, and suggestions —for conditions B, M, S, and M&S). The total number of interactions were 970 for the baseline condition (B), 4452 for the condition with exploration metrics only (M), 2137 interactions for the condition with suggestions only (S), and 5519 for condition M&S, which contains both exploration metrics and suggestions. It is worth mentioning that the operational granularity of these interactions is not symmetric. For instance, from an interaction perspective, interacting with a keyword might impact a set of reviews but interacting with a review impacts only that particular review.
Fig. 10(a) suggests that the participants who used condition B often used keywords and sentiments to filter reviews. The majority of the participants (13/25) preferred the cascaded filters to filter reviews by a keyword and a sentiment in conjunction. One participant (P12) mentioned
I loved the keyword filter to focus on what was important to me and I could then see exactly how many positive and how many negative for that particular keyword. That was amazing!
The participants (10/25) also preferred the option to search custom keywords and the highlighting of the searched keyword on the reviews. P19 said,
I really liked the way that you could easily search for sentiments. For example, I cared most about reasonable pricing and sound quality. It was easy for search and have those things highlighted in individual reviews.
Fig. 10(b) suggests a prominent interaction trend where the participants transitioned between exploration metrics and reviews. There are also traces of interactions from exploration metrics to sentiments. In essence, the exploration of reviews by participants who used condition M seems to have revolved around exploration metrics as 15/25 participants mentioned they used exploration metrics to balance the types of sentiments they were exploring from the reviews. We found similar trends in condition S (Fig. 10(c), where participants explored both the suggested and regular reviews and went back and forth between them. This observation is also supported by the participants’ post-study feedback soliciting how they used the suggested reviews. 13/25 participants mentioned that they started reading regular reviews; after a while, they started to read suggestions and kept alternating between the two. Finally, in Fig. 10(d), we see that the trends from conditions M and S repeat with the participants having access to all features of Serendyze. These diagrams suggest that the participants heavily used the proposed interventions to perform their tasks whenever available.
The qualitative responses we collected from the participants also reflect their desire to use exploration metrics and suggestions. For instance, P93 mentioned,
Serendyze provides a nice collection of useful information and features in order to compare products. It is something I would use while looking for products online.
P61 highlighted how suggested reviews helped them to keep track of reviews that were important,
The feature that I liked the most was the tracking of the ”Suggested reviews that you have visited already.” It was really convenient for me to keep track of the reviews that had made an impression on me. It was really easy to add reviews there, and this was important because I’ve found that it is easy to lose track of specific reviews with a really important detail that was not in other reviews, and this feature is a great solution to prevent losing track of important or personally useful reviews.
P30 mentioned how exploration metrics helped them to learn how much data they have explored,
I used these features [exploration metrics] now and then to get an idea of what information I had already covered. I found them to be very interesting and something I’d like to see on all review pages!
The responses for the aesthetics of the Serendyze interface were mixed. While some participants (P44, P49) preferred the
color coded interface,
others (P43, P29) though the interface was
plain and needed more color and designs.
5. Discussion
The findings from the evaluation of Serendyze suggest that exploration metrics helped participants to explore reviews more comprehensively and cover more reviews. It also allowed them to balance their review exploration across all sentiments and perspectives present in reviews. We also found that the bias mitigation model provided participants with useful suggestions, enabling them to gain deeper knowledge about the products and raising their confidence in making informed decisions. Participants also found unexpected suggestions that often impacted their decision by providing evidence. However, some participants did not find suggestions useful due to expectation mismatch. Overall, the evaluation highlights the usefulness of text-level exploration functionalities to complement summary-level exploration of product reviews to support data-driven decision-making for purchasing online products. In this section, we further unfold the findings from the evaluation, discuss implications of such findings, and speculate how knowledge gained from this work can be propagated to domains beyond product reviews.
5.1. The Impact of Preconception and Expectation Mismatch on Accepting Suggestions
The findings from our evaluation of Serendyze demonstrate that the participants in conditions S and M&S found suggestions to be useful (see Fig. 9(a)) and a catalyst for increasing confidence in making decisions (see Fig. 8(b)). However, some participants (4/25 each for S and M&S) did not feel that the suggestions were useful as they expected suggestions to be similar to the reviews they visited. These participants who were seeking similar reviews from the suggestions were disillusioned and felt disconnected, leading towards their eventual disinterest and discontinuation of reading suggested reviews. In contrast, others who embraced the unexpectedness found the suggestions to be serendipitous, compelling, and conducive to gaining insights from the reviews.
In this work, we experimented with a heuristic bias mitigation model to generate suggestions that are most dissimilar to what participants visited — both in terms of semantic similarity and the sentiments associated with the reviews. Such approaches that focus beyond accuracy metrics to measure the utility and performance of generating suggestions are relatively new (Kaminskas and Bridge, 2016; Shi et al., 2012). Similar to Serendyze, the inner workings of the majority of the available suggestion-generation systems, such as Amazon product recommendations, Facebook and YouTube content recommendations, and Netflix and Spotify entertainment recommendation, are kept hidden from the users. Such systems often rely on similarity or relevance among user (Shapira et al., 2013) or product attributes (Linden et al., 2003) based on a users’ exploration patterns to suggest new data (Kaminskas and Bridge, 2016). These available systems might play a role in priming and shaping user perceptions and heavily impact how and what the users expect from the suggestions generated by an automated system (Kamehkhosh and Jannach, 2017; Ekstrand et al., 2014; Kapoor and Piramuthu, 2009). The participants who actively sought similar reviews might not have perceived that the suggestions were reaffirming their gained knowledge and this expectation mismatch likely resulted in their disconnection from using the dissimilar suggestions.
To address such issues, systems such as Serendyze could be designed to have the functionality to alternate between providing suggestions that are homogeneous to what the readers have been reading and suggestions that are dissimilar to what they have been reading. The first approach could help them reaffirm their decisions based on what they read, and the second approach could help them gather serendipitous, broader, and diverse knowledge. Such duality might even provide flexibility for users to explore the data as they prefer. Furthermore, more clarifications can be added to explain how suggestions are generated. To that end, visual indications of scores and ranks associated with suggestions (Pereira and Paulovich, 2020) might improve the readers’ perceptions towards suggestions, provide transparency, and combat confusion (Rosenfeld and Richardson, 2019).
5.2. Perception of Detailed Reviews and their Impact on Trust in System
Our evaluation demonstrated how suggestions enabled the participants to gather knowledge from opposing perspectives, access reviews that they had not thought about beforehand, and make confident decisions. While suggestions were heavily used by participants (Fig. 10(c) and (d)), some participants were not pleased with suggestions as they did not find them to be helpful. For some of these participants, the unhelpful suggestions were sufficient to induce mistrust in the system, and they stopped using suggestions. Digging deeper, we made two observations: (1) some participants perceived that the suggestions were too brief and did not have enough information to gather deeper knowledge; (2) some considered the lack of details in suggestions to be artifacts of random text generating agents or “bots” (P61).
People often have a complex relationship with how they interact with and use a system, what data they get out of the system, how they interpret such data, and how they establish trust in the system (Chuang et al., 2012). While mistrust of a system can often derive from unexpectedness and uncertainty, the quality of the data provided, and the manner in which they are provided may also have a role to play in how users perceive the data presented to them (Dörk et al., 2013). Serendyze generates suggestions based on the dissimilarities in semantics and the sentiments associated with each review. While generating suggestions that intend to support serendipitous discovery and analysis of interesting reviews to diversify knowledge gained from product reviews, the bias mitigation model is not designed to assess the quality of the reviews being suggested. Adding quality assessment functionalities to measure the quality of generated reviews could help mitigate the mistrust induced by suggested reviews in systems like Serendyze.
One approach to assess whether the suggestions contain details that might be desirable to the readers could be to modify the bias mitigation model to identify and leverage the latent aspects present in the reviews (Rana et al., 2020; Ding et al., 2017). For instance, during the scoring of candidate suggestions (see Algorithm 1), the model could assess whether certain aspects for a headphone, such as the price, longevity, value, sound quality, or other aspects desirable to the reader, are present in the candidate suggestion. Furthermore, the presence and absence of the desired aspects could be provided to readers using visual cues (Isaacs et al., 2014; Sarvghad et al., 2016) to help readers decide whether they want to read the suggestion. Providing cues to missing aspects could also benefit readers by helping them assess whether the suggestions are useful to suit their needs (Sarwar et al., 2021).
5.3. User Agency and Trust in Mixed-Initiative Systems
For evaluating Serendyze, we asked participants to perform an open-ended task of reading reviews and making a purchase decision. The participants were free to approach the task any way they wanted, and they used Serendyze organically to complete their tasks without provocation to use specific features. However, some participants who used condition M&S (4/25) chose to depend solely on exploration metrics. They justified their choice by highlighting their preference to not be influenced by machine-generated and algorithmically-curated suggestions and wanted to
analyze the data on their own
(P98). They also felt that the visualization of the exploration metrics was the result of their tangible interactions with the system, and the metrics mapped and presented their behavioral patterns without manipulation. Such observations open up bigger questions around user agency in mixed-initiative systems such as Serendyze, where users and automated systems work in tandem to achieve a goal (Horvitz, 1999).
User agency is a critical concept in mixed-initiative systems, and in human-computer interaction, in general (Yu and Blackwell, 2017). It often dictates whether the users will adapt to the functionalities provided by the system (Makonin et al., 2016). A user is considered to have user agency when they perceive that they are responsible for their interactions with the system and they own the consequences of their actions on the system (Yu and Blackwell, 2017; Coyle et al., 2012). Our evaluation suggests that the exploration metrics with the visual cues based on scented widgets (Willett et al., 2007) enabled participants to feel in control of their exploration process by allowing them to follow their own review exploration strategy. This observation aligns with previous works where data visualization has been shown to be effective in conveying information regarding exploratory analysis and open-ended tasks (Hullman and Diakopoulos, 2011) to instill a sense of transparency and trust in users (Dörk et al., 2013). In contrast, algorithmic curation of online text — including and beyond product reviews — is often associated with a lack of transparency and is conducive to generating mistrust in users due to their closed nature as black-box solutions (Davis, 2017; Eslami et al., 2017).
Due to this research area being under-explored, it is challenging to definitively design solutions that balance user agency in mixed-initiative systems. However, the debate remains on how to address the volatility of user agency in mixed-initiative systems with inevitable black-box components and algorithmically curated system responses. One might argue that the system should enable users to have agency and have the capability to support users’ choices of rejecting features that they do not feel comfortable adapting to. Others might advocate providing additional features and guidance to make automated systems more transparent (Ceneda et al., 2021). These questions and viewpoints demand the attention of researchers from multiple disciplines including human-computer interaction, machine learning, and visual analytics. We extend the call to future researchers to investigate these questions and devise solutions to how the dichotomy between user agency and trust in mixed-initiative systems can be balanced.
5.4. Approaches such as Serendyze can Facilitate Deeper Fine-Grained Knowledge Acquisition
From our evaluation, we found that the participants were keen to use review-level analysis features available to them to read and analyze reviews in detail. Apart from the exploration metrics and suggestions, three features that were prominently mentioned by participants across all conditions are: (1) the ability to search for any keyword they wanted and to see them highlighted in the filtered reviews, (2) the ability to filter reviews by different sentiments (positive, neutral, and negative), and (3) the provenance tracking where they could mark the reviews they read. The free-form keyword searches and highlighting provided users with the freedom to explore the reviews by focusing on what is important for them. The sentiments gave readers a nuanced sense of reviewers’ disposition towards a product, which is different from visually presenting star ratings, as star ratings may not best reflect the affinity represented in reviews (Schreck and Chin, 2019). Finally, the provenance tracking enabled them to track their review exploration without the need for mental notes, reducing cognitive effort for decision-making. Participants across different conditions expressed their desire to see functionalities provided in Serendyze on “Amazon” (P12, P49) or similar “online sites” (P18, P97).
Two overarching insights can be extracted from this observation. First, our participants’ interactions with reviews suggest a lack of available functionalities and options to analyze reviews. Major online commerce websites (Amazon, Etsy, eBay, etc.) host numerous products with thousands of reviews per product, but often do not provide powerful features to analyze reviews directly as texts. While there are filters such as price range, warranty, color, etc., these are product-level filters enabling analysis among products based on metadata attributes. They are often not connected with reviews for the product, and the readers seeking to purchase a product based on others’ reviews have to painstakingly read through the reviews, often make mental notes, and make decisions based on incomplete knowledge (Qualtrics, 2020).
While Amazon and eBay provide keywords extracted from reviews, the exploration capability they provide is often limited for readers who might have the desire to explore reviews more comprehensively. This leads us to the second insight: the desire for fine-grained analysis at the review level. Participants’ appreciation towards these seemingly rudimentary features suggests the utility of review-level analytics where the analysis can be performed on the review contents and highlights the usefulness of integrating such features on available platforms.
However, such options lead us to questions around identifying the appropriate granularity (Shneiderman, 1996) of information to present to readers for exploring and analyzing reviews. Some of these questions involve how to enable readers to analyze review content more efficiently while negating redundancy and how to combine visualization and computational approaches to disseminate information at multiple levels of granularity. In the future, researchers from HCI, visualization, natural language processing, and information retrieval could collectively explore paradigms of information seeking when review-level analytics is integrated with summary-level overviews. These paradigms could also explore domains beyond product reviews where text analysis can support decision-making.
5.5. Application of Serendyze in Other Domains beyond Product Reviews
Our study revealed an opportunity for review-level analysis of product reviews to help readers learn more from the data prior to making data-driven purchase decisions. This approach could be expanded in domains where comprehensive exploration and text-level analysis of text data could be important to support decision-making. One such domain is civics, where decision-makers depend on large-scale public input to gain an understanding of public perception before making critical policy decisions (Jasim et al., 2021a; Mahyar et al., 2019). They often use analytics tools that enable an analysis of public-generated data — predominantly text data as comments, ideas, and opinions — to measure the temperature of public perception (Mahyar et al., 2019). While tools designed for analyzing redundant and often ambiguous public input help decision-makers get high-level overviews of public opinions, marginalized and unpopular opinions are often neglected due to the scale of public input and lack of analysis tools to identify such opinions (Mahyar et al., 2020), especially at text-level (Jasim et al., 2021a). Since these decisions directly impact peoples’ lives, effective analysis to ensure the perspectives of all citizens are addressed is critical in this domain (Mahyar et al., 2019). Interventions such as the exploration metrics can help decision-makers to identify and extract insights from redundant information and track whether their public input exploration is skewed towards certain agendas, topics, or sentiments. Furthermore, the bias mitigation model can suggest opinions and feedback that might have remained hidden under more popular opinions. As such, these interventions could provide decision-makers in the civic domain an alternative approach to not only gain a holistic understanding of public input but also enhance their accountability and transparency (Jasim et al., 2021b), when making policy decisions.
Another domain where text-level analysis systems such as Serendyze can be expanded is social media content analysis. While there exists a plethora of tools and techniques to analyze social media texts (Marcus et al., 2011; Hu et al., 2016), the issues regarding aggregation and summarization of opinions may also manifest in this domain (Wu et al., 2016). Such issues are especially pertinent due to the concerns around algorithmic filtration and curation of social media content based on users’ digital footprints (Bhargava et al., 2019; Papakyriakopoulos et al., 2020). These curating algorithms often decide what social media content the readers should be exposed to (Lambrecht and Tucker, 2019; Bozdag, 2013), which might result in inadvertently creating filter bubbles (Pariser, 2011). For many people who use social media as a source of news and current affairs, such curation and presentation of catered data might promote homophily (Bisgin et al., 2012) and render the readers oblivious to the bigger picture of current affairs in virtual social spaces (Messing and Westwood, 2014; Flaxman et al., 2016). Text-level analytics systems such as Serendyze can help to combat the formation of echo chambers via serendipitous suggestions of social media content that are dissimilar from the posts that a reader usually explores and are exposed to in social media. For instance, if a reader is mostly exploring content from sources aligned with liberal ideas, they could be suggested content from sources that are inclined towards conservative thoughts. While social media users will maintain the agency to decide which ideas they align with and own their actions, such text-level intervention can enable them to be introduced to opposing ideas that might help them reach a better understanding of arguments from all sides prior to establishing social alignments.
6. Limitations and Future Work
Limitations. One of the limitations of Serendyze is the latency associated with performing the pairwise comparison of visited and unvisited reviews to measure the similarity scores and generate suggestions. While the system performed well in a local system and during the pilot study, during the study with crowd workers, with up to 72 participants working simultaneously, the freely available server (pyt, 2021) used to perform the calculations was overwhelmed with traffic. As a result, some of the participants (6/100) felt that the system worked slower than they expected. We emphasize that the latency is an outcome of logistical challenges and could have been mitigated with a more powerful back-end server or batch-wise distribution of tasks among crowd workers. In the future, we will optimize Serendyze to perform more efficiently in low-resource environments.
The other limitation involves the interface and the associated complexity. Some participants, especially the ones who used condition M&S (4/25), found some components of Serendyze to be confusing and to contribute interface clutter. To mitigate this issue, the Serendyze interface could be improved by enabling participants to hide not just the suggestions but any component that they might not want to see. Although the inner workings of generating suggestions were not explained to participants due to study purposes, in the future, the participants can be informed by adding an explanation to remove confusion and increase transparency.
Serendyze is designed as a customizable and modular web application. For this study, instead of probabilistic machine learning approaches, we used deterministic approaches to analyze reviews that included using keywords extractions based on co-occurrence and using star-rating as the foundation for sentiments. We emphasize that Serendyze can be outfitted with advanced computational methods to generalize it for tasks and domains where probabilistic classifications are acceptable and desired for scalability. However, in this study, we focused more on the interaction design and less on the computational approaches. As such, we adopted deterministic approaches to identifying keywords, sentiments, and similarities among reviews.
In our study, we only recruited participants who resided in North America via Amazon Mechanical Turk and did not account for participants’ demographic information. We focused on people’s purchase practices and experiences irrespective of their backgrounds. Furthermore, the study was limited to a single session which could have impacted some participants in accelerating the decision-making process. In the future, we plan to deploy Serendyze as a longitudinal study to track participants’ purchase behaviors over a month across multiple sessions on multiple online products and among participants from diverse demographics. Such experiments will enable us to further study the long-term impact of exploration metrics and bias mitigating suggestions on people’s review exploration, holistic understanding, and data-driven decision-making based on their purchase habits and experiences that may vary across different regions.
Future Work. There are several avenues to explore in the future to improve Serendyze. We will study the utility of Serendyze in real-world scenarios by deploying it as a companion web application or browser extension that can enable readers to utilize Serendyze features to explore reviews on online commerce sites. In these real-world deployments, Serendyze will be outfitted with product reviews that mirror the real distribution of facets across product reviews. Before deploying Serendyze in a real-world setting, we will augment it with several functionalities based on this study and the knowledge we gained from the participant responses. For instance, we will add clarifying information to explain all components and optimize Serendyze to improve the scalability. One way to improve the scalability is to use non-tabular databases and pre-calculations to accelerate the query process to measure the dissimilarity scores. We will also integrate and enable the readers to hot-switch between different suggestion-generating models to account for their exploration preferences during review exploration. Serenedyze’s modular and customizable design (see Section 3) will allow us to experiment with various text analytics methods to enable exploration of various facets present in the data, including subjectivity (Chaturvedi et al., 2018), stance (Küçük and Can, 2020), and latent aspects (Rana et al., 2020; Ding et al., 2017).
Some argue that product review distributions in online commerce websites are often inherently biased based on self-selection biases such as purchasing bias and under-reporting bias (Hu et al., 2009). Such biases often result in the review distribution being bi-modal or non-normal, leaning more towards positive or negative reviews (Hu et al., 2009; Dave et al., 2003). While we did not engage with such possibilities in this study, in the future, one avenue to explore is to study the effect of presenting suggestions that negate word of mouth on decision-making (Hu et al., 2006). The modular and customizable design of Serendyze will enable us to replace the bias mitigation model with other statistical models appropriate for such studies. We also plan to study people’s exploration patterns if they were limited to reading a fixed number of reviews, a fixed amount of time (Wang et al., 2021), or a fixed organization of suggestions.
In the future, Serendyze could also be outfitted with features to disseminate and allow exploration and analysis of various product and review attributes, including product specifications, pictures, price, warranty information, peer rating, etc. Peer rating could also be used to weigh the suggestions to provide recommendations based on how others valued a product. In addition, Serendyze could be improved by adding features to compare between two or more products in juxtaposition. Further improvements can be made by adding note-taking functionalities for the readers to further reduce mental load prior to decision-making. The Serendyze interface could also be updated with improved aesthetics and accessibility features to make it more presentable.
Another avenue to explore in the future is broadening the investigation and assessing the applicability of systems like Serendyze in other domains. For instance, in the digital civics domain, exploration metrics and bias mitigating suggestions could help decision-makers identify marginalized or unpopular perspectives among often redundant public-generated data. Furthermore, Serendyze could be used to analyze social media posts of contentious or divergent topics to help combat echo chambers (Cinelli et al., 2021). In the future, we will collaborate with government and non-government organizations (NGO) — who collect, analyze, and make decisions based on public-generated data — to deploy and study how Serendyze could provide them with an alternative to their existing data analysis process by helping them gain deeper insights and a holistic understanding of public-generated texts.
The exploration metrics and bias mitigating suggestions in Serendyze could also be expanded beyond reviews and text, in general, to other media types, including photos or videos. For instance, in applications such as Yelp, the bias exploration metrics and bias mitigating suggestions might help viewers identify distinct popular dishes, attractions, or places of interest among often redundant photos posted by people who have already experienced these items.
7. Conclusion
In this study, we investigated interventions that are intended to support serendipitous discovery and analysis of product reviews to help readers to explore reviews more comprehensively in a balanced way, prior to making purchase decisions. First, we proposed three exploration metrics — Visit, Coverage, and Distribution. These exploration metrics were designed to help readers to keep track of what reviews they have explicitly read, which reviews they have implicit knowledge about, and how they have been exploring different facets of reviews such as sentiments compared to the true distributions of these facets present in the data. Second, we proposed a bias mitigation model that generated suggestions based on what the readers had been exploring by identifying and suggesting reviews that were semantically and sentiment-wise dissimilar to the reviews the readers had read already. This model was designed to generate suggestions that could help readers mitigate biased exploration, guide readers to gain a more comprehensive understanding of the reviews, which was reflective of the true distributions of the semantic and sentiment diversity in the reviews, and enhance their knowledge discovery. We integrated these interventions with a text analytics system, Serendyze. Our evaluation with 100 crowd workers suggests that the exploration metrics could enable readers to cover more reviews in a balanced way. We also found that the suggestions generated by the bias mitigation model could be influential in enabling readers to make confident decisions. While we do not claim that serendipitous discovery and analysis is the only way to approach purchase decision-making based on online products, the findings from our study suggest that readers seeking to gain a more comprehensive understanding of the underlying reviews might be benefited if they have access to such alternative interventions. We discuss the impact of readers’ perceptions on accepting suggestions from a system and how user agency in mixed-initiative systems might play a significant role in how users trust interventions that generate guidance for them on what they can or should do while using such a system. We also discuss how systems like Serendyze might be useful when expanded to other domains beyond product reviews to support the deeper exploration of text data prior to making data-driven decisions.
References
- (1)
- pyt (2021) 2021. Python Anywhere. Retrieved August 20, 2021 from https://www.pythonanywhere.com/
- Alexander et al. (2014) Eric Alexander, Joe Kohlmann, Robin Valenza, Michael Witmore, and Michael Gleicher. 2014. Serendip: Topic model-driven visual exploration of text corpora. In Proc. IEEE Conf. on Visual Analytics Science and Technology (VAST). IEEE, 173–182.
- Alharbi and Laramee (2019) Mohammad Alharbi and Robert S Laramee. 2019. Sos textvis: An extended survey of surveys on text visualization. Computers 8, 1 (2019), 17.
- Allahyari et al. (2017) Mehdi Allahyari, Seyedamin Pouriyeh, Mehdi Assefi, Saeid Safaei, Elizabeth D Trippe, Juan B Gutierrez, and Krys Kochut. 2017. Text summarization techniques: a brief survey. arXiv preprint arXiv:1707.02268 (2017).
- Amazon (2021) Amazon. 2021. Community Guidelines. Retrieved September 1, 2021 from https://www.amazon.com/gp/help/customer/display.html?nodeId=GLHXEX85MENUE4XF
- Andel (1994) Pek van Andel. 1994. Anatomy of the unsought finding. serendipity: Orgin, history, domains, traditions, appearances, patterns and programmability. The British Journal for the Philosophy of Science 45, 2 (1994), 631–648.
- Baeza-Yates and Navarro (1996) Ricardo Baeza-Yates and Gonzalo Navarro. 1996. A faster algorithm for approximate string matching. In Annual Symposium on Combinatorial Pattern Matching. Springer, 1–23.
- Bhargava et al. (2019) Rahul Bhargava, Anna Chung, Neil S Gaikwad, Alexis Hope, Dennis Jen, Jasmin Rubinovitz, Belén Saldías-Fuentes, and Ethan Zuckerman. 2019. Gobo: A system for exploring user control of invisible algorithms in social media. In Conference Companion Publication of the 2019 on Computer Supported Cooperative Work and Social Computing. 151–155.
- Bisgin et al. (2012) Halil Bisgin, Nitin Agarwal, and Xiaowei Xu. 2012. A study of homophily on social media. World Wide Web 15, 2 (2012), 213–232.
- Bozdag (2013) Engin Bozdag. 2013. Bias in algorithmic filtering and personalization. Ethics and information technology 15, 3 (2013), 209–227.
- Burnard (1991) Philip Burnard. 1991. A method of analysing interview transcripts in qualitative research. Nurse Education Today 11, 6 (1991), 461–466.
- Carenini and Rizoli (2009) Giuseppe Carenini and Lucas Rizoli. 2009. A multimedia interface for facilitating comparisons of opinions. In Proceedings of the 14th international conference on Intelligent user interfaces. 325–334.
- Ceneda et al. (2021) Davide Ceneda, Alessio Arleo, Theresia Gschwandtner, and Silvia Miksch. 2021. Show Me Your Face: Towards an Automated Method to Provide Timely Guidance in Visual Analytics. IEEE Trans. on Visualization and Computer Graphics (2021).
- Chang et al. (2009) Jonathan Chang, Jordan Boyd-Graber, Chong Wang, Sean Gerrish, and David M Blei. 2009. Reading tea leaves: How humans interpret topic models. In Neural Information Processing Systems, Vol. 22. Citeseer, 288–296.
- Chaturvedi et al. (2018) Iti Chaturvedi, Edoardo Ragusa, Paolo Gastaldo, Rodolfo Zunino, and Erik Cambria. 2018. Bayesian network based extreme learning machine for subjectivity detection. Journal of The Franklin Institute 355, 4 (2018), 1780–1797.
- Chen et al. (2006) Chaomei Chen, Fidelia Ibekwe-SanJuan, Eric SanJuan, and Chris Weaver. 2006. Visual analysis of conflicting opinions. In 2006 IEEE Symposium On Visual Analytics Science And Technology. IEEE, 59–66.
- Chen et al. (2016) Xu Chen, Jie Sheng, Xiaojun Wang, and Jiangshan Deng. 2016. Exploring determinants of attraction and helpfulness of online product review: A consumer behaviour perspective. Discrete Dynamics in Nature and Society 2016 (2016).
- Chuang et al. (2012) Jason Chuang, Daniel Ramage, Christopher Manning, and Jeffrey Heer. 2012. Interpretation and trust: Designing model-driven visualizations for text analysis. In Proc. SIGCHI Conf. on Human Factors in Computing Systems. 443–452.
- Cinelli et al. (2021) Matteo Cinelli, Gianmarco De Francisci Morales, Alessandro Galeazzi, Walter Quattrociocchi, and Michele Starnini. 2021. The echo chamber effect on social media. Proceedings of the National Academy of Sciences 118, 9 (2021).
- Collins et al. (2018) Christopher Collins, Natalia Andrienko, Tobias Schreck, Jing Yang, Jaegul Choo, Ulrich Engelke, Amit Jena, and Tim Dwyer. 2018. Guidance in the human–machine analytics process. Visual Informatics 2, 3 (2018), 166–180.
- Corley and Mihalcea (2005) Courtney D Corley and Rada Mihalcea. 2005. Measuring the semantic similarity of texts. In Proc. ACL Workshop on Empirical Modeling of Semantic Equivalence and Entailment. 13–18.
- Coyle et al. (2012) David Coyle, James Moore, Per Ola Kristensson, Paul Fletcher, and Alan Blackwell. 2012. I did that! Measuring users’ experience of agency in their own actions. In Proc. SIGCHI Conf. on Human Factors in Computing Systems. 2025–2034.
- Crump et al. (2013) Matthew JC Crump, John V McDonnell, and Todd M Gureckis. 2013. Evaluating Amazon’s Mechanical Turk as a tool for experimental behavioral research. PloS One 8, 3 (2013), e57410.
- Dave et al. (2003) Kushal Dave, Steve Lawrence, and David M Pennock. 2003. Mining the peanut gallery: Opinion extraction and semantic classification of product reviews. In Proceedings of the 12th international conference on World Wide Web. 519–528.
- Davis (2017) Jenny L Davis. 2017. Curation: A theoretical treatment. Information, Communication & Society 20, 5 (2017), 770–783.
- Demšar and Çöltekin (2017) Urška Demšar and Arzu Çöltekin. 2017. Quantifying gaze and mouse interactions on spatial visual interfaces with a new movement analytics methodology. PloS One 12, 8 (2017), e0181818.
- Devlin et al. (2018) Jacob Devlin, Ming-Wei Chang, Kenton Lee, and Kristina Toutanova. 2018. Bert: Pre-training of deep bidirectional transformers for language understanding. arXiv preprint arXiv:1810.04805 (2018).
- Ding et al. (2017) Ying Ding, Changlong Yu, and Jing Jiang. 2017. A neural network model for semi-supervised review aspect identification. In Pacific-Asia Conf. on Knowledge Discovery and Data Mining. Springer, 668–680.
- Dörk et al. (2013) Marian Dörk, Patrick Feng, Christopher Collins, and Sheelagh Carpendale. 2013. Critical InfoVis: exploring the politics of visualization. In CHI’13 Extended Abstracts on Human Factors in Computing Systems. 2189–2198.
- Dörk et al. (2012) Marian Dörk, Nathalie Henry Riche, Gonzalo Ramos, and Susan Dumais. 2012. Pivotpaths: Strolling through faceted information spaces. IEEE Trans. on Visualization and Computer Graphics 18, 12 (2012), 2709–2718.
- Ekstrand et al. (2014) Michael D Ekstrand, F Maxwell Harper, Martijn C Willemsen, and Joseph A Konstan. 2014. User perception of differences in recommender algorithms. In Proc. ACM Conf. on Recommender Systems. 161–168.
- Ellis (2018) Geoffrey Ellis. 2018. Cognitive Biases in Visualizations. Springer.
- Eslami et al. (2017) Motahhare Eslami, Kristen Vaccaro, Karrie Karahalios, and Kevin Hamilton. 2017. “Be careful; things can be worse than they appear”: Understanding Biased Algorithms and Users’ Behavior around Them in Rating Platforms. In Proceedings of the international AAAI conference on web and social media, Vol. 11. 62–71.
- Flaxman et al. (2016) Seth Flaxman, Sharad Goel, and Justin M Rao. 2016. Filter bubbles, echo chambers, and online news consumption. Public opinion quarterly 80, S1 (2016), 298–320.
- Floyd et al. (2014) Kristopher Floyd, Ryan Freling, Saad Alhoqail, Hyun Young Cho, and Traci Freling. 2014. How online product reviews affect retail sales: A meta-analysis. Journal of Retailing 90, 2 (2014), 217–232.
- Ganu et al. (2009) Gayatree Ganu, Noemie Elhadad, and Amélie Marian. 2009. Beyond the stars: improving rating predictions using review text content.. In WebDB, Vol. 9. Citeseer, 1–6.
- Gomaa et al. (2013) Wael H Gomaa, Aly A Fahmy, et al. 2013. A survey of text similarity approaches. Int. J. Computer Applications 68, 13 (2013), 13–18.
- Gregory et al. (2006) Michelle Gregory, Nancy Chinchor, Paul Whitney, Richard Carter, Elizabeth Hetzler, and Alan Turner. 2006. User-directed sentiment analysis: Visualizing the affective content of documents. In Proceedings of the Workshop on Sentiment and Subjectivity in Text. 23–30.
- Ha et al. (2020) Sunwoo Ha, Adam Kern, Melanie Bancilhon, and Alvitta Ottley. 2020. Expectation Versus Reality: The Failed Evaluation of a Mixed-Initiative Visualization System. In Proc. IEEE Workshop Celebrating the Scientific Value of Failure (FailFest). IEEE, 1–5.
- Häubl and Trifts (2000) Gerald Häubl and Valerie Trifts. 2000. Consumer decision making in online shopping environments: The effects of interactive decision aids. Marketing science 19, 1 (2000), 4–21.
- He and McAuley (2016) Ruining He and Julian McAuley. 2016. Ups and downs: Modeling the visual evolution of fashion trends with one-class collaborative filtering. In Proc. Int. Conf. on World Wide Web. 507–517.
- Herlocker et al. (2004) Jonathan L Herlocker, Joseph A Konstan, Loren G Terveen, and John T Riedl. 2004. Evaluating collaborative filtering recommender systems. ACM Trans. on Information Systems (TOIS) 22, 1 (2004), 5–53.
- Heuer (1999) Richards J Heuer. 1999. Psychology of intelligence analysis. Center for the Study of Intelligence.
- Horvitz (1999) Eric Horvitz. 1999. Principles of mixed-initiative user interfaces. In Proc. SIGCHI Conf. on Human Factors in Computing Systems. 159–166.
- Hu et al. (2016) Mengdie Hu, Krist Wongsuphasawat, and John Stasko. 2016. Visualizing social media content with sententree. IEEE Trans. on Visualization and Computer Graphics 23, 1 (2016), 621–630.
- Hu et al. (2013) Mengdie Hu, Huahai Yang, Michelle X Zhou, Liang Gou, Yunyao Li, and Eben Haber. 2013. OpinionBlocks: a crowd-powered, self-improving interactive visual analytic system for understanding opinion text. In IFIP Conf. on Human-Computer Interaction. Springer, 116–134.
- Hu et al. (2014) Nan Hu, Noi Sian Koh, and Srinivas K Reddy. 2014. Ratings lead you to the product, reviews help you clinch it? The mediating role of online review sentiments on product sales. Decision Support Systems 57 (2014), 42–53.
- Hu et al. (2006) Nan Hu, Paul A Pavlou, and Jennifer Zhang. 2006. Can online reviews reveal a product’s true quality? Empirical findings and analytical modeling of online word-of-mouth communication. In Proceedings of the 7th ACM conference on Electronic commerce. 324–330.
- Hu et al. (2009) Nan Hu, Jie Zhang, and Paul A Pavlou. 2009. Overcoming the J-shaped distribution of product reviews. Commun. ACM 52, 10 (2009), 144–147.
- Hullman and Diakopoulos (2011) Jessica Hullman and Nick Diakopoulos. 2011. Visualization rhetoric: Framing effects in narrative visualization. IEEE Trans. on Visualization and Computer Graphics 17, 12 (2011), 2231–2240.
- Isaacs et al. (2014) Ellen Isaacs, Kelly Damico, Shane Ahern, Eugene Bart, and Mudita Singhal. 2014. Footprints: A visual search tool that supports discovery and coverage tracking. IEEE Trans. on Visualization and Computer Graphics 20, 12 (2014), 1793–1802.
- Jasim et al. (2021a) Mahmood Jasim, Enamul Hoque, Ali Sarvghad, and Narges Mahyar. 2021a. CommunityPulse: Facilitating Community Input Analysis by Surfacing Hidden Insights, Reflections, and Priorities. In Proc. ACM Conf. on Designing Interactive Systems. 846–863.
- Jasim et al. (2021b) Mahmood Jasim, Pooya Khaloo, Somin Wadhwa, Amy X Zhang, Ali Sarvghad, and Narges Mahyar. 2021b. CommunityClick: Capturing and reporting community feedback from town halls to improve inclusivity. Proceedings of the ACM on Human-Computer Interaction 4, CSCW3 (2021), 1–32.
- Jelodar et al. (2019) Hamed Jelodar, Yongli Wang, Chi Yuan, Xia Feng, Xiahui Jiang, Yanchao Li, and Liang Zhao. 2019. Latent Dirichlet allocation (LDA) and topic modeling: models, applications, a survey. Multimedia Tools and Applications 78, 11 (2019), 15169–15211.
- Jones et al. (2004) Quentin Jones, Gilad Ravid, and Sheizaf Rafaeli. 2004. Information overload and the message dynamics of online interaction spaces: A theoretical model and empirical exploration. Information Systems Research 15, 2 (2004), 194–210.
- Kamehkhosh and Jannach (2017) Iman Kamehkhosh and Dietmar Jannach. 2017. User perception of next-track music recommendations. In Proc. Conf. on User Modeling, Adaptation and Personalization. 113–121.
- Kaminskas and Bridge (2016) Marius Kaminskas and Derek Bridge. 2016. Diversity, serendipity, novelty, and coverage: a survey and empirical analysis of beyond-accuracy objectives in recommender systems. ACM Trans. on Interactive Intelligent Systems (TiiS) 7, 1 (2016), 1–42.
- Kapoor and Piramuthu (2009) Gaurav Kapoor and Selwyn Piramuthu. 2009. Sequential bias in online product reviews. Journal of Organizational Computing and Electronic Commerce 19, 2 (2009), 85–95.
- Khan et al. (2014) Khairullah Khan, Baharum Baharudin, Aurnagzeb Khan, and Ashraf Ullah. 2014. Mining opinion components from unstructured reviews: A review. Journal of King Saud University-Computer and Information Sciences 26, 3 (2014), 258–275.
- Kotkov et al. (2016) Denis Kotkov, Shuaiqiang Wang, and Jari Veijalainen. 2016. A survey of serendipity in recommender systems. Knowledge-Based Systems 111 (2016), 180–192.
- Krippendorff (2011) Klaus Krippendorff. 2011. Computing Krippendorff’s alpha-reliability. (2011).
- Kucher and Kerren (2015) Kostiantyn Kucher and Andreas Kerren. 2015. Text visualization techniques: Taxonomy, visual survey, and community insights. In Proc. IEEE Pacific Visualization Symposium. IEEE, 117–121.
- Küçük and Can (2020) Dilek Küçük and Fazli Can. 2020. Stance detection: A survey. ACM Computing Surveys (CSUR) 53, 1 (2020), 1–37.
- Kunaver and Požrl (2017) Matevž Kunaver and Tomaž Požrl. 2017. Diversity in recommender systems–A survey. Knowledge-based Systems 123 (2017), 154–162.
- Kwon et al. (2015) Bum Chul Kwon, Sung-Hee Kim, Timothy Duket, Adrián Catalán, and Ji Soo Yi. 2015. Do people really experience information overload while reading online reviews? Int. J. Human-Computer Interaction 31, 12 (2015), 959–973.
- Lambrecht and Tucker (2019) Anja Lambrecht and Catherine Tucker. 2019. Algorithmic bias? an empirical study of apparent gender-based discrimination in the display of stem career ads. Management Science 65, 7 (2019), 2966–2981.
- Lau and Baldwin (2016) Jey Han Lau and Timothy Baldwin. 2016. An empirical evaluation of doc2vec with practical insights into document embedding generation. arXiv preprint arXiv:1607.05368 (2016).
- Le and Mikolov (2014) Quoc Le and Tomas Mikolov. 2014. Distributed representations of sentences and documents. In Int. Conf. on Machine Learning. PMLR, 1188–1196.
- Linden et al. (2003) Greg Linden, Brent Smith, and Jeremy York. 2003. Amazon. com recommendations: Item-to-item collaborative filtering. IEEE Internet Computing 7, 1 (2003), 76–80.
- Liu et al. (2005) Bing Liu, Minqing Hu, and Junsheng Cheng. 2005. Opinion observer: analyzing and comparing opinions on the web. In Proceedings of the 14th international conference on World Wide Web. 342–351.
- Lu et al. (2015) Jie Lu, Dianshuang Wu, Mingsong Mao, Wei Wang, and Guangquan Zhang. 2015. Recommender system application developments: a survey. Decision Support Systems 74 (2015), 12–32.
- Mahyar et al. (2020) Narges Mahyar, Mahmood Jasim, and Ali Sarvghad. 2020. Designing Technology for Sociotechnical Problems: Challenges and Considerations. IEEE Computer Graphics and Applications 40, 6 (2020), 76–87.
- Mahyar et al. (2019) Narges Mahyar, Diana V Nguyen, Maggie Chan, Jiayi Zheng, and Steven P Dow. 2019. The Civic Data Deluge: Understanding the Challenges of Analyzing Large-Scale Community Input. In Proc. ACM Conf. on Designing Interactive Systems. 1171–1181.
- Makonin et al. (2016) Stephen Makonin, Daniel McVeigh, Wolfgang Stuerzlinger, Khoa Tran, and Fred Popowich. 2016. Mixed-initiative for big data: The intersection of human+ visual analytics+ prediction. In Proc. Hawaii Int. Conf. on System Sciences (HICSS). IEEE, 1427–1436.
- Marchionini (2006) Gary Marchionini. 2006. Exploratory search: from finding to understanding. Commun. ACM 49, 4 (2006), 41–46.
- Marcus et al. (2011) Adam Marcus, Michael S Bernstein, Osama Badar, David R Karger, Samuel Madden, and Robert C Miller. 2011. Twitinfo: aggregating and visualizing microblogs for event exploration. In Proc. SIGCHI Conf. on Human Factors in Computing Systems. 227–236.
- Messing and Westwood (2014) Solomon Messing and Sean J Westwood. 2014. Selective exposure in the age of social media: Endorsements trump partisan source affiliation when selecting news online. Communication research 41, 8 (2014), 1042–1063.
- Mikolov et al. (2013) Tomas Mikolov, Kai Chen, Greg Corrado, and Jeffrey Dean. 2013. Efficient estimation of word representations in vector space. arXiv preprint arXiv:1301.3781 (2013).
- North et al. (2011) Chris North, Remco Chang, Alex Endert, Wenwen Dou, Richard May, Bill Pike, and Glenn Fink. 2011. Analytic provenance: process+ interaction+ insight. In CHI’11 Extended Abstracts on Human Factors in Computing Systems. 33–36.
- Onuma et al. (2009) Kensuke Onuma, Hanghang Tong, and Christos Faloutsos. 2009. Tangent: a novel,’surprise me’, recommendation algorithm. In Proc. ACM SIGKDD Int. Conf. on Knowledge Discovery and Data Mining. 657–666.
- Papakyriakopoulos et al. (2020) Orestis Papakyriakopoulos, Juan Carlos Medina Serrano, and Simon Hegelich. 2020. Political communication on social media: A tale of hyperactive users and bias in recommender systems. Online Social Networks and Media 15 (2020), 100058.
- Pariser (2011) Eli Pariser. 2011. The filter bubble: What the Internet is hiding from you. Penguin UK.
- Park et al. (2006) Do-Hyung Park, Jumin Lee, and Ingoo Han. 2006. Information overload and its consequences in the context of online consumer reviews. Proc. PACIS (2006), 28.
- Pereira and Paulovich (2020) Mateus M Pereira and Fernando V Paulovich. 2020. RankViz: A visualization framework to assist interpretation of Learning to Rank algorithms. Computers & Graphics 93 (2020), 25–38.
- Peters et al. (2018) Matthew E. Peters, Mark Neumann, Mohit Iyyer, Matt Gardner, Christopher Clark, Kenton Lee, and Luke Zettlemoyer. 2018. Deep contextualized word representations. arXiv:1802.05365 [cs.CL]
- Qualtrics (2020) Qualtrics. 2020. Online reviews statistics to know in 2021. Retrieved July 7, 2021 from https://www.qualtrics.com/blog/online-review-stats/
- Rana et al. (2020) Toqir A Rana, Yu-N Cheah, and Tauseef Rana. 2020. Multi-level knowledge-based approach for implicit aspect identification. Applied Intelligence 50, 12 (2020), 4616–4630.
- Rayner et al. (2010) Keith Rayner, Timothy J Slattery, and Nathalie N Bélanger. 2010. Eye movements, the perceptual span, and reading speed. Psychonomic Bulletin & Review 17, 6 (2010), 834–839.
- Řehůřek and Sojka (2010) Radim Řehůřek and Petr Sojka. 2010. Software Framework for Topic Modelling with Large Corpora. In Proc. LREC Workshop on New Challenges for NLP Frameworks. ELRA, Valletta, Malta, 45–50.
- Ricci et al. (2011) Francesco Ricci, Lior Rokach, and Bracha Shapira. 2011. Introduction to recommender systems handbook. In Recommender Systems Handbook. Springer, 1–35.
- Rodden and Fu (2007) Kerry Rodden and Xin Fu. 2007. Exploring how mouse movements relate to eye movements on web search results pages. (2007).
- Rosenfeld and Richardson (2019) Avi Rosenfeld and Ariella Richardson. 2019. Explainability in human–agent systems. Autonomous Agents and Multi-Agent Systems 33, 6 (2019), 673–705.
- Sarvghad et al. (2016) Ali Sarvghad, Melanie Tory, and Narges Mahyar. 2016. Visualizing dimension coverage to support exploratory analysis. IEEE Trans. on Visualization and Computer Graphics 23, 1 (2016), 21–30.
- Sarwar et al. (2021) Sheikh Muhammad Sarwar, Felipe Moraes, Jiepu Jiang, and James Allan. 2021. Utility of Missing Concepts in Query-biased Summarization. In Proc. 44th International ACM SIGIR Conf. on Research and Development in Information Retrieval. 2056–2060.
- Schreck and Chin (2019) Jacquelyn L Schreck and Matthew G Chin. 2019. Online Product Reviews: Effects of Star Ratings and Valence on Review Perception among Those High and Low in Need for Cognition. In Proc. Human Factors and Ergonomics Society Annual Meeting, Vol. 63. SAGE Publications Sage CA: Los Angeles, CA, 401–405.
- Sedlar et al. (2007) Urban Sedlar, Janez Bešter, and Andrej Kos. 2007. Tracking mouse movements for monitoring users’ interaction with websites: Implementation and applications. Elektrotehniški vestnik 1, 74 (2007), 31–36.
- Shapira et al. (2013) Bracha Shapira, Lior Rokach, and Shirley Freilikhman. 2013. Facebook single and cross domain data for recommendation systems. User Modeling and User-Adapted Interaction 23, 2-3 (2013), 211–247.
- Shi et al. (2012) Yue Shi, Xiaoxue Zhao, Jun Wang, Martha Larson, and Alan Hanjalic. 2012. Adaptive diversification of recommendation results via latent factor portfolio. In Proc. ACM SIGIR Conf. on Research and Development in Information Retrieval. 175–184.
- Shneiderman (1996) Ben Shneiderman. 1996. The eyes have it: A task by data type taxonomy for information visualizations. In Proc. IEEE Symp. on Visual Languages. 336–343.
- Statista (2021) Statista. 2021. Unit shipments of headphones worldwide from 2013 to 2020. Retrieved December, 2021 from https://www.statista.com/statistics/236075/revenue-of-headphone-shipments-in-the-united-states/
- Thudt et al. (2012) Alice Thudt, Uta Hinrichs, and Sheelagh Carpendale. 2012. The bohemian bookshelf: supporting serendipitous book discoveries through information visualization. In Proc. SIGCHI Conf. on Human Factors in Computing Systems. 1461–1470.
- Tsang and Prendergast (2009) Alex SL Tsang and Gerard Prendergast. 2009. Is a “star” worth a thousand words? The interplay between product-review texts and rating valences. European Journal of Marketing (2009).
- von Helversen et al. (2018) Bettina von Helversen, Katarzyna Abramczuk, Wiesław Kopeć, and Radoslaw Nielek. 2018. Influence of consumer reviews on online purchasing decisions in older and younger adults. Decision Support Systems 113 (2018), 1–10.
- Wall et al. (2019) Emily Wall, Arup Arcalgud, Kuhu Gupta, and Andrew Jo. 2019. A markov model of users’ interactive behavior in scatterplots. In Proc. IEEE Visualization Conference (Short Papers). IEEE, 81–85.
- Wall et al. (2017) Emily Wall, Leslie M Blaha, Lyndsey Franklin, and Alex Endert. 2017. Warning, bias may occur: A proposed approach to detecting cognitive bias in interactive visual analytics. In Proc. IEEE Conf. on Visual Analytics Science and Technology (VAST). IEEE, 104–115.
- Wall et al. (2018) Emily Wall, Leslie M Blaha, Celeste Lyn Paul, Kristin Cook, and Alex Endert. 2018. Four perspectives on human bias in visual analytics. In Cognitive Biases in Visualizations. Springer, 29–42.
- Wang et al. (2021) Ruolin Wang, Zixuan Chen, Mingrui Ray Zhang, Zhaoheng Li, Zhixiu Liu, Zihan Dang, Chun Yu, and Xiang’Anthony’ Chen. 2021. Revamp: Enhancing Accessible Information Seeking Experience of Online Shopping for Blind or Low Vision Users. In Proceedings of the 2021 CHI Conference on Human Factors in Computing Systems. 1–14.
- Willett et al. (2007) Wesley Willett, Jeffrey Heer, and Maneesh Agrawala. 2007. Scented widgets: Improving navigation cues with embedded visualizations. IEEE Trans. on Visualization and Computer Graphics 13, 6 (2007), 1129–1136.
- Woolf (2014) Max Woolf. 2014. A statistical analysis of 1.2 million amazon reviews. Max Woolf’s Blog (2014).
- Wu et al. (2016) Yingcai Wu, Nan Cao, David Gotz, Yap-Peng Tan, and Daniel A Keim. 2016. A survey on visual analytics of social media data. IEEE Transactions on Multimedia 18, 11 (2016), 2135–2148.
- Wu et al. (2010) Yingcai Wu, Furu Wei, Shixia Liu, Norman Au, Weiwei Cui, Hong Zhou, and Huamin Qu. 2010. OpinionSeer: interactive visualization of hotel customer feedback. IEEE Trans. on visualization and computer graphics 16, 6 (2010), 1109–1118.
- Yadav and Vishwakarma (2020) Ashima Yadav and Dinesh Kumar Vishwakarma. 2020. Sentiment analysis using deep learning architectures: a review. Artificial Intelligence Review 53, 6 (2020), 4335–4385.
- Yatani et al. (2011) Koji Yatani, Michael Novati, Andrew Trusty, and Khai N Truong. 2011. Review spotlight: a user interface for summarizing user-generated reviews using adjective-noun word pairs. In Proc. SIGCHI Conf. on Human Factors in Computing Systems. 1541–1550.
- Yu and Blackwell (2017) Guo Yu and Alan Blackwell. 2017. Effects of timing on users’ agency during mixed-initiative interaction. BCS.
- Zhang et al. (2002) Yi Zhang, Jamie Callan, and Thomas Minka. 2002. Novelty and redundancy detection in adaptive filtering. In Proc. ACM SIGIR Conf. on Research and Development in Information Retrieval. 81–88.