Outstanding thermoelectric performance predicted for out-of-plane p-doped GeSe
Abstract
The record-breaking thermoelectric performance of tin selenide (SnSe) has motivated the investigation of analogue compounds with the same structure. A promising candidate that emerged recently is germanium selenide (GeSe). Here, using extensive first-principles calculations of the hole-phonon and hole-impurity scattering, we investigate the thermoelectric transport properties of the orthorhombic phase of p-doped GeSe. We predict outstanding thermoelectric performance for GeSe over a broad range of temperatures due to its high Seebeck coefficients, extremely low Lorenz numbers, ultralow total thermal conductivity, and relatively large band gap. In particular, the out-of-plane direction in GeSe presents equivalent or even higher performance than SnSe for temperatures above 500 K. By extending the analysis to 900 K, we obtained an ultrahigh value for the thermoelectric figure of merit ( 3.2) at the optimal hole density of 4 cm-3. Our work provides strong motivation for continued experimental work focusing on improving the GeSe doping efficiency in order to achieve this optimal hole density.
I Introduction
High-efficiency thermoelectric (TE) materials have been systematically and comprehensively investigated during the past several decades, mainly due to their capability of functioning as all-solid-state modules for distributed spot-size refrigerationMao et al. (2020, 2019) or electric power generation from waste heat.DiSalvo (1999); He and Tritt (2017) The key quantity to evaluate the efficiency of TE energy conversion is the dimensionless figure of merit, , where , , stand for the electrical conductivity, the Seebeck coefficient, and the absolute temperature and is the total thermal conductivity, comprised of lattice and electronic carrier contributions, respectively. Numerous TE materials have been discovered, and a few of them even have values between 2 and 3Lv et al. (2013); Venkatasubramanian et al. (2001); Zhang et al. (2016a); Zhong et al. (2014); Famili et al. (2018); Xue et al. (2016); Ohta et al. (2007); Fu et al. (2016); Zhao et al. (2014, 2016); Chang et al. (2018). However, even those high- materials do not have sufficient efficiency to be largely employed by industryDiSalvo (1999); Vining (2009); He and Tritt (2017). Indeed, it has been argued that materials with would represent a highly attractive prospect for applications, allowing TE refrigerators to compete with traditional compressor-based refrigeratorsMao et al. (2020); Sales et al. (1996). Such ultrahigh values have not been measured in bulk materials until very recently.Zhou et al. (2021) Thus, TE materials have so far only found niche applications where reliability is of higher priority than efficiency.
The figure of merit, , can be enhanced either by increasing the power factor () or reducing the thermal conductivity, . Ultimately, the main goal is to find TE materials that satisfy both of these conditions simultaneously, which is a challenge since the properties involved are interdependent. The maximization of relies on band-structure engineeringPei et al. (2011, 2012); Dehkordi et al. (2015) such as increasing band degeneracy through convergence of bands Zhao et al. (2013); Liu et al. (2012a) or taking advantage of band structure anisotropyParker et al. (2015) and non-parabolicity Chen et al. (2013). On the other hand, the main strategies to minimize include identifying materials with intrinsically low González-Romero et al. (2018), minimizing the electronic carrier contribution, , through the minimization of the Lorenz functionMcKinney et al. (2017); Chaves et al. (2021a), or by alloying or nanostructuring proceduresHochbaum et al. (2008); Boukai et al. (2008); Kanatzidis (2009); Zhao et al. (2013); Vineis et al. (2010). Despite the challenges, impressive achievements have been obtained on the basis of such strategies He and Tritt (2017); Biswas et al. (2012); Liu et al. (2012b); Fu et al. (2016); Olvera et al. (2017); Cheng et al. (2017); Ma et al. (2020); Roychowdhury et al. (2021).
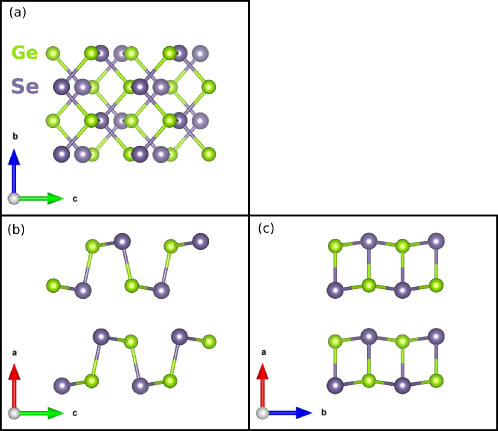
The record-breaking TE performance of SnSeZhao et al. (2014, 2016); Chang et al. (2018) has motivated the investigation of analogue IV-VI compounds with the same puckered layer structure, in order to ascertain whether such systems also possess inherently low and high . A promising candidate is germanium selenide (GeSe), which, like SnSe, crystalizes in the orthorhombic GeS-type structure shown in Fig. 1, with a space group of (Pnma)Taniguchi et al. (1990); Okazaki (1958).
Additional advantages that make GeSe very attractive for large applications in thermoelectrics and photovoltaics include chemical stability, earth-abundance, environmental compatibility and low toxicity (no lead).Antunez et al. (2011); Liu et al. (2017); Huang et al. (2017); Sarkar et al. (2020, 2021) Recently, theoretical work by Ding et al.Ding et al. (2015) put forward the possibility of achieving large and values by proper p- or n-type doping of GeSe. Due to low thermal conductivity and multiband effects, Hao et al.Hao et al. (2016) predicted an ultrahigh peak value of 2.5 along the in-plane (b-axis) direction of the orthorhombic phase of GeSe with a hole density of 6.5 cm-3 at 800 K. If this could be realized, it would outperform p-doped SnSe. Though highly suggestive, that prediction used the same values for relaxation times and carrier densities as those reported for p-doped SnSe. Despite the great potential of the orthorhombic phase of GeSe for TE applications, there are still relatively few published experimental resultsZhang et al. (2016b).
In the present work we examine the thermoelectric performance of p-doped GeSe and SnSe within the Boltzmann Transport equation (BTE) formalism, by explicitly calculating relaxation times due to hole-phonon (h-p) and hole-impurity couplings using a comprehensive first-principles approach. In particular, the hole-phonon coupling was calculated by using the dual interpolation schemeChaves et al. (2020) of the density functional theory (DFT) band structureHohenberg and Kohn (1964); Kohn and Sham (1965). The phonon dispersion and h-p matrix elements were determined by density functional perturbation theory (DFPT)Baroni et al. (2001). The carrier density for the different axes was derived from the record-breaking transport data measured in p-doped SnSeZhao et al. (2016). The calculated temperature and energy dependent relaxation times allow for a deeper understanding of the microscopic processes underlying the temperature-dependent transport phenomena in p-doped GeSe and SnSe.
Our results predict a very high figure of merit for both out-of-plane (a-axis) and in-plane (c-axis) GeSe in a broad range of temperatures. This can be attributed to several factors that synergistically influence the performance: high Seebeck coefficients, extremely low Lorenz numbers, low hole thermal conductivities, very low lattice thermal conductivity, and a relatively large band gap. In fact, for temperatures above 500 K, out-of-plane GeSe is predicted to potentially have a higher than the record-breaking SnSe. By extending the analysis to 900 K, we obtain the outstanding values of 3.2 and 2.8 for the out-of-plane and in-plane directions with optimal carrier densities of 4 cm-3 and 5 cm-3, respectively. We find that the total relaxation time for the out-of-plane direction in GeSe is much higher than the corresponding relaxation time in SnSe, demonstrating the importance of directly calculating the relaxation times for GeSe.
II Theoretical Approach
The hole-phonon (h-p) coupling and the scattering of holes by ionized impurities are the microscopic processes that determine the temperature-dependent p-type transport phenomena in TE materials, such as GeSe and SnSe. We calculate these TE transport properties from first-principles using the many-body perturbation theory of the h-p interaction following the Fan-Migdal approach and the Boltzmann transport formalism. The comprehensive theoretical framework for the calculation of the band () and momentum () resolved relaxation time (RT), , is described in detail in our previous work Chaves et al. (2021a) and summarized in the Supplemental Material (SM)SM for easy reference. In brief, we calculate three contributions to the total relaxation time. The nonpolar RT () comes from the short-range portion of the hole coupling to acoustic and optical phonons, which can be calculated using dual interpolation. The long-range portion of the hole coupling with optical phonons gives rise to the polar RT (), which we determine using the analytic Vogl formula Pellegrini et al. (2016); Bostedt et al. (2016); Vogl (1976) with the addition of Ehrenreich screening Ehrenreich (1959). Finally, extrinsic scattering by ionized impurities () is calculated using the theory developed by Brooks and Herring (B-H) Brooks (1955); Chattopadhyay and Queisser (1981), which has been extended to go beyond the parabolic band approximation.Chaves et al. (2021b)
Assuming these scattering mechanisms can be treated independently, the total RT is determined by Mathiessen’s rule, where the dependence of scattering times on independent variables, including temperature () and chemical potential (), is shown explicitly:
| (1) | ||||
From we calculate the TE transport coefficients using the semiclassical BTE with the (non-constant) relaxation time approximation (RTA).Madsen and Singh (2006); Chaves et al. (2021b) The key quantity is the momentum- and band-resolved transport distribution kernel,
| (2) |
where is the total relaxation time and is the average group velocity. The energy projected transport function can then be defined as
| (3) |
and is used to calculated the transport tensors in terms of the different energy moments
| (4) |
With the experimental conditions of zero temperature gradient () and zero electric current, the transport tensors yield the electrical conductivity,
| (5) |
the Seebeck coefficient,
| (6) |
and the charge carrier contribution to the thermal conductivity,
| (7) | ||||
III Computational details
Below are the details for calculations involving GeSe; the details for SnSe can be found in Ref. 28. The relaxed geometry and electronic structure of GeSe was calculated using DFT, while the phonon dispersions and h-p matrix elements were calculated using DFPT, both implemented in the Quantum Espresso packageGiannozzi et al. (2009). We employed fully-relativistic optimized norm-conserving Vanderbilt pseudopotentialsHamann (2013); Van Setten et al. (2018) within the generalized gradient approximation (GGA) for the exchange-correlation functional according to the formulation of Perdew-Burke-Ernzerhof (PBE)Perdew et al. (1996). Monkhorst-Pack grids of 61814 for -point sampling and a kinetic energy cutoff of 80 Ry were employed to ensure the convergence of the total energy in DFT calculations. The energy convergence threshold for the total energy difference between two successive self-consistency steps was 10-11 Ry under the Davidson-type diagonalization method. Because DFT-GGA calculations underestimate the GeSe band gap, a scissor operator was used to rigidly shift the conduction bands upwards in order to attain the experimental band gap of 1.1 eV Elkorashy (1989); Vaughn et al. (2010).
At room temperature both GeSe and SnSe crystallize in a layered orthorhombic structure with the Pnma space group and 8 atoms in the unit cell, shown in Fig. 1. The melting point of GeSe occurs at 9482 K,Ross and Bourgon (1969); Ipser et al. (1982); Bletskan (2005) but according to Wiedemeier et al.Wiedemeier and Siemers (1975), at 924K a structural transition takes place from the orthorhombic phase to the ideal structure of NaCl type. This is controversial since according to Sist et al.Sist et al. (2017) this structural phase transition occurs at the lower temperature of 907 K. For SnSe, a second-order phase transition to the higher symmetry Cmcm phase occurs at T810 KLi et al. (2015). In the present work we consider only Pnma orthorhombic structures for both materials and thus report their transport properties for temperatures up to 807 and 900 K for SnSe and GeSe, respectively.
Both materials form covalently bonded layers with zig-zag chains along the b-axis and significant corrugation along the c-axis. Those layers are held together by much weaker van der Waals interactions along the out-of-plane a-axis. In order to capture such weak bonds between layers, we employed van der Waals corrections to DFT according to the D3 approach of Grimme et al. Grimme et al. (2010). For GeSe, we started from the Pnma orthorhombic configuration from the Materials ProjectJain et al. (2013) (mp-700) and relaxed the lattice parameters and atomic positions until all atomic force components were smaller in magnitude than 1 meV/Å. The relaxed lattice constants are Å, Å and Å, which are in reasonable agreement with the corresponding experimental valuesWiedemeier and Siemers (1975); Wiedemeier and von Schnering (1978). Importantly, our DFT-D3 calculations accurately reproduce the out-of-plane lattice constant (a-axis), differing from the experimental result at 919 K by only 0.1%.Wiedemeier and Siemers (1975)
We used our Turbo-EPW implementationChaves et al. (2020) to calculate the RTs limited by h-p coupling, including both contributions of nonpolar and screened polar scatterings. Turbo-EPW takes advantage of the dual interpolation technique based on a first Wannier-Fourier interpolationGiustino et al. (2007); Poncé et al. (2016), followed by a second interpolation using symmetry-adapted star functions, which allows for efficient interpolation of h-p scattering matrix elements onto dense meshes of electron () and phonon () wave vectors. In the present case, the first interpolation, using maximally localized Wannier functions determined by Wannier90Mostofi et al. (2008), leads to a phonon grid of 104020 points. The calculated electron self energy only changes by for a ninefold denser grid, indicating that our momentum sampling gives a well converged balance between accuracy and computational cost. Subsequently, star functions per point were used for the second interpolation, resulting in a denser grid of 278164 points. In total this results in over 1 billion pairs.
The calculation of requires the static and high-frequency dielectric constants, and . We have used the experimental valuesMadelung (2004); Chandrasekhar et al. (1977) 21.9, 30.4, 25.8 (45, 62, 42) and 18.7, 21.9, 14.4 (13, 17, 16) for the a-, b- and c-axis of GeSe (SnSe), respectively. We used the same value of star functions in the calculation of in order to obtain the same mesh for integration as in h-p calculations. Mathiessen’s rule, Eq. (1), yields the temperature and energy dependent that is used in our modified BoltzTraP codeMadsen and Singh (2006); Chaves et al. (2021b) to carry out transport calculations and determine all the TE properties.
IV Results and discussion
IV.1 Carrier density and ionized impurities concentration
The thermoelectric (TE) transport properties of GeSe depend on the carrier density, , and the concentration of ionized impurities, , both of which depend on the nonequilibrium growth process and can vary between samples. In order to make meaningful predictions we need to determine experimentally relevant values for and , including realistic temperature evolution. Due to the structural and chemical similarities between GeSe and SnSe, and the dearth of experimental data on GeSe, we use the carrier and impurity concentrations derived from SnSe experiments as a reasonable estimate for the values in GeSe samples. This has the added benefit of allowing direct comparison of TE properties of two materials that differ only in chemical composition.
Following the same procedure used in Ref. 60, we determine and by self-consistently adjusting their values in order to reproduce, within our computational framework, the experimentally measured values of and in p-doped SnSe reported by Zhao et al.Zhao et al. (2016). Even though the carrier density of SnSe presents only weak anisotropy, as inferred by Hall measurements on SnSeZhao et al. (2014), we considered different for the in-plane and the out-of-plane axes. We used the same temperature dependent and derived for p-doped SnSe to calculate TE transport properties of p-doped GeSe. For reasons of clarity, in the main text we report the results for a- and b-axis p-doped GeSe (referred to in the following as a-GeSe and b-GeSe, respectively) using and derived from a-axis p-doped SnSe. Results for c-axis GeSe (c-GeSe), as well as the properties calculated with and derived from b- or c-axis SnSe, are shown in Figures S1-S3. For reasons of expedience, we approximated and of GeSe at 800 K by the values obtained at 807 K for SnSe.
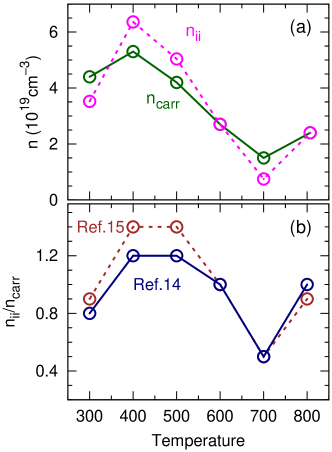
Figure 2(a) shows the carrier and impurity concentrations derived for a-axis p-doped SnSe as a function of . The results derived for b- and c-axis p-doped SnSe are shown in the SMSM (Figure S4). At 300 K is approximately 4.4 cm-3, increases to 5.3 cm-3 at 400 K, and then decreases almost linearly down to 1.5 cm-3 at 700 K, all consistent with Hall measurements Zhao et al. (2016). Above 700 K our results indicate that increases due to vacancy formation Chaves et al. (2021a) reaching 2.4 cm-3 at 807 K. Figure 2(b) shows the temperature dependence of the ratio compared to a previous calculation of the same quantityChaves et al. (2021a) that was based on the experimental data reported by Chang et al.Chang et al. (2018) for a different a-axis SnSe sample with the same dopant. The similarity between the ratios determined in this work and those reported in our previous work demonstrates that these values of carrier and impurity concentrations are experimentally relevant and approximately sample independent.
IV.2 Thermoelectric transport properties
The calculated TE properties for p-doped out-of-plane (a-axis) and in-plane (b-axis) GeSe and SnSe are shown in Fig. 3, along with available experimental dataZhao et al. (2016). All four systems show similar behavior of their Seebeck coefficients as a function of temperature, with increasing with up to 700 K, reaching 332 (326 ) for a-GeSe (b-GeSe). Above that temperature the increase in causes to decrease to 319 (311) at 800 K. For temperatures above 600 K the calculated GeSe Seebeck coefficients are slightly higher than those of SnSe, in close agreement with previous theoretical findings. Ding et al. (2015); Hao et al. (2016) As pointed out by Hao et al.Hao et al. (2016), p-doping in both materials induces a multiband effect that leads to an enhancement of .
The electrical conductivity, , of all four systems shows the expected exponential decrease with temperature to 700 K, remaining nearly constant up to 800 K. Both axes of GeSe present values that are intermediate to those of a- and b-SnSe. As has been found previously, the in-plane electrical conductivity of GeSe is much lower than that of SnSe.Hao et al. (2016) However, the out-of-plane of GeSe is greater than its in-plane and much higher than the out-of-plane conductivity in SnSe. This is a direct consequence of the low scattering rate by ionized impurities for holes close to the valence band maximum (VBM) of a-GeSe, as will be discussed further below.
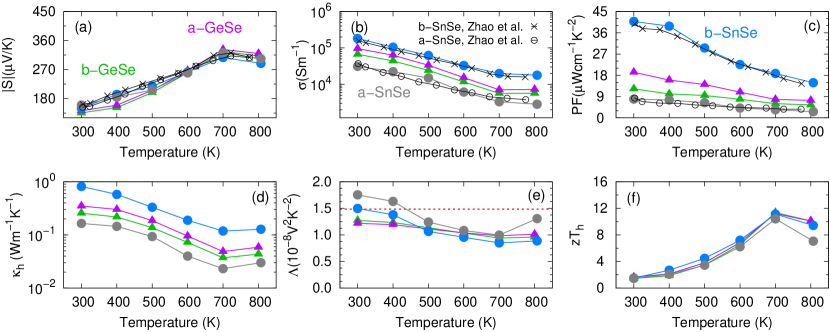
Similarly, the thermal conductivity due to hole transport, , also decreases with temperature up to 700 K and increases again for both materials between 700 and 800 K. The Lorenz function, defined as , is shown in Fig. 3(e), along with a red dashed line at the non-degenerate limit for semiconductors, V2K-2. It has been shown previously that can be much smaller than when a rigorous first-principles approach is used instead of simplified band structures and scattering processes Wang et al. (2018); Putatunda and Singh (2019). Both axes of GeSe have very small values of that remain below throughout the temperature range. The Lorenz function for in-plane SnSe shows higher (lower) values than both axes of GeSe for temperatures below (above) 500 K. Even though a-SnSe also presents very low values of , it is the highest of the four systems studied. Furthermore, it shows an abrupt enhancement above 700 K that is caused by a slight decrease in accompanied by a considerable increase in . Finally, the hole thermoelectric figure of merit, , is shown in Fig. 3(f). values are quite similar for both materials throughout the entire temperature range, except for a-SnSe that exhibits a sharp decrease at K mirroring the increase in .
IV.3 Dominant Scattering mechanisms and Relaxation times
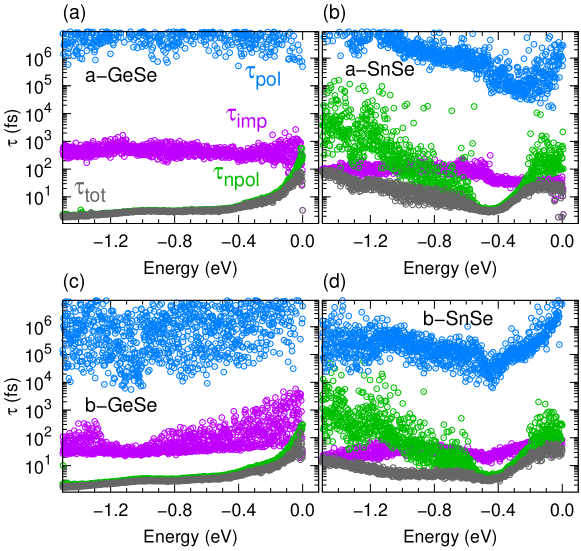
In order to understand the temperature-dependent transport phenomena in GeSe and SnSe, we extensively analyzed their carrier scattering mechanisms. Figure 4 shows the relaxation times (RT) at 300 K due to nonpolar () and screened Fröhlich polar () scattering arising from the hole-phonon coupling, as well as scattering by ionized impurities () and the total RT () based on Mathiessen’s rule, Eq. 1. These RTs are calculated as a function of the hole band and momentum, but plotted as a function of the hole energy using the following conversion:
| (8) |
In the SMSM we provide additional details about the temperature dependence of the RTs as well as comparisons between the RTs for different systems and axes.
Due to the effectiveness of screening in these doped systems, is by far the largest RT, demonstrating that the Fröhlich coupling does not contribute significantly to the transport properties along either axis of p-doped GeSe. For both axes of GeSe we observe that is competitive with near the VBM at . For energies well below the VBM is quickly overtaken by . Comparing the results for the two axes in GeSe, we observe the total RTs are quite similar in magnitude and present similar energetic behavior, as can also be clearly seen in Figure S5.
For SnSe the scenario is more complex because exhibits non-monotonic dependence on the hole energy with a minimum around eV. In this case, dominates the carrier scattering near the VBM for a-SnSe, while for b-SnSe and compete with each other. becomes dominant in the range of to eV, and the two mechanisms are comparable for lower energies. This complicated energy dependence of the RTs strongly affects the TE transport properties. In particular, it is responsible for the increase of at 807 K for a-SnSe, since the enhancement of and greater importance of scattering at higher energies increases the integral that appears in the calculation of Chaves et al. (2021a). A detailed comparison between the RTs for both axes in p-doped SnSe is presented in the SMSM (Figs. S6, S7, S8 and S9), demonstrating that near the VBM is largely determined by . Thus, it is the higher that causes b-SnSe to have a larger than a-SnSe throughout the full range of temperatures studied.
By carefully comparing the total RTs of both materials, we observe that GeSe presents higher RT close to the VBM, which can be attributed mainly to the weaker scattering of holes by ionized impurities (see Figs. S6 and S10). Since all other contributions to are comparable in size, it must be the screening function that appears in the denominator of Eq. (S8) which leads to the larger RT. Hence, it is the greater effectiveness of the screening that raises the RT for GeSe. On the basis of Figures S10-S13 the use of SnSe RTs to estimate the thermoelectric figure of merit for GeSe cannot be justified, since we see that the SnSe RTs are generally smaller near the VBM. Fig. S11 clearly shows that such an approximation would significantly underestimate the RT for a-GeSe. In addition, the clear variations in RT with hole energy is a strong argument against the use of the constant relaxation time approximation.
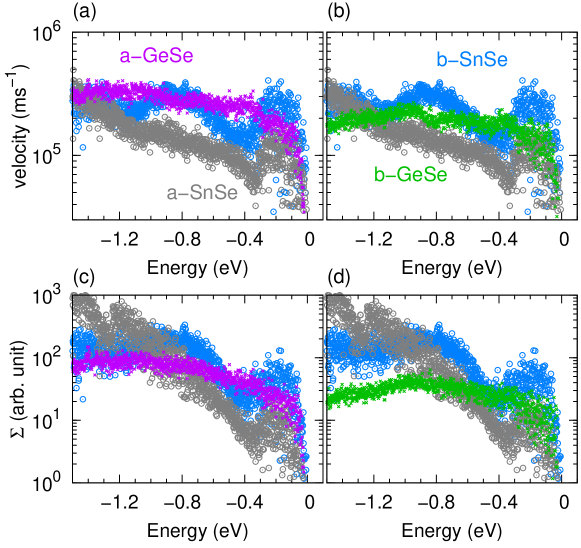
IV.4 Average hole group velocities and Transport distribution function
The average hole group velocities as a function of energy can be derived from the calculated band structure:
| (9) |
The group velocities, together with the energy dependent transport distribution function, , are shown in Fig. 5 for in-plane and out-of-plane GeSe and SnSe. Clearly, b-SnSe has the highest velocities around the VBM resulting in high electrical conductivity. Along the same line, the lowest velocities in a-SnSe are responsible for its inferior overall TE properties. Close to the VBM, GeSe presents intermediate values for and , higher than a-SnSe and lower than b-SnSe. Since the Seebeck coefficients of a-GeSe and b-GeSe are similar, it is the higher hole velocity, which leads to higher electrical conductivity, that results in the larger for a-GeSe. For GeSe, the velocities smoothly increase as hole energy increases away from the VBM, except for highly energetic holes in b-GeSe. On the other hand, for b-SnSe the velocities are high at the VBM, but they decreases with hole energy, becoming smaller than those of GeSe for holes between eV to eV. For GeSe, higher velocities at high hole energies contribute to the increase of between 700 and 800 K. In general, the behavior of follows that of the velocities.
IV.5 Outstanding thermoelectric performance of GeSe
In order to calculate the TE figure of merit, , we need an estimate of the total thermal conductivity, . For SnSe we use the experimental values measured by Zhao et al.Zhao et al. (2016). Since the necessary measurements have not yet been made for GeSe, we rely on theoretical results based on the Debye-Callaway theory for lattice thermal conductivity Hao et al. (2016), to which we add our calculated hole thermal conductivities. The resulting total thermal conductivity for both SnSe and GeSe is plotted in Fig. S14. The thermal conductivity is nearly the same for a-axis GeSe and SnSe, though at the highest temperatures it is slightly lower for a-GeSe. In-plane b-GeSe exhibits higher total thermal conductivity than out-of-plane GeSe throughout the temperature range, but it is comparatively lower than b-SnSe.
Both contributions to the total thermal conductivity are extremely low in GeSe. First, due to the relatively low electrical conductivity in GeSe and extremely low Lorenz numbers, carrier thermal conductivity is also very small. Second, GeSe displays strong anharmonicity as quantified by its large Grüneisen parameters that are comparable to or even larger than the Grüneisen parameters for SnSe Hao et al. (2016). Such anomalously high Grüneisen parameters of GeSe are a consequence of its hinge-like structure, distorted GeSe polyhedral, and van der Waals gaps in the out-of-plane direction that efficiently scatter phonons. Since the measured for SnSe is extremely low, we expect the lattice contribution, , to be extremely low for GeSe also.
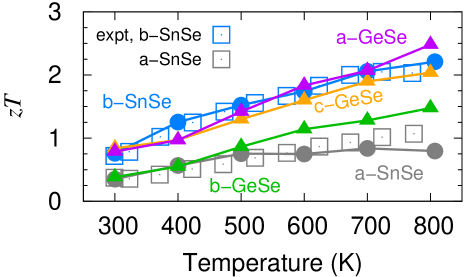
In view of its relatively high Seebeck coefficients and extremely low Lorenz numbers, coupled with an ultralow , we predict outstanding TE performance for out-of-plane GeSe, as can be seen in Fig. 6. In particular, a-GeSe has values that equal or even exceed the record-breaking performance of b-SnSe at temperatures above 500 K. This result would be missed if we assumed that the RTs for GeSe were the same as SnSe along the corresponding crystallographic axis. Along with a-GeSe, high TE performance has also been obtained for c-GeSe throughout the whole temperature range, while b-GeSe has comparatively lower TE performance. It is important to emphasize that GeSe, just like SnSe, presents high over a wide temperature range, which is a consequence of its relatively large band gap.Xiao and Zhao (2020) Furthermore, we continue to find a high figure of merit for out-of-plane GeSe when using and derived from b- and c-SnSe data (see Figures S15 and S16).
The figure of merit is increased for high power factors and low thermal conductivities. It is instructive to compare these contributions to for each of the systems studied here. For SnSe, the out-of-plane direction has a low power factor and a low thermal conductivity, and the former dominates, leading to a (relatively) low value. In contrast, the in-plane direction has a high power factor and a high thermal conductivity, and once again it is the power factor that dominates, this time yielding a high value. Compared to its SnSe counterpart, b-GeSe has much lower power factor as well as a somewhat lower thermal conductivity, producing a comparably low value. The surprise, at least with reference to SnSe, is that a-GeSe maintains a very low without the dramatic decrease in shown by a-SnSe.
It is important to note that the calculation of is very challenging. For SnSe there is a long debate about in the experimental literatureWei et al. (2016); Wu et al. (2017); Li et al. (2017); Chen et al. (2016) as well as questions regarding the comparison with first-principles calculationsWu et al. (2017). Similarly, the intrinsic thermal conductivity of GeSe is likely to be the subject of intense debate. Therefore, we re-calculated the value of for GeSe using values for determined by Yuan et al.Yuan et al. (2019) based on third-order force constants. Their values of are noticeably higher, leading to a lower prediction for as shown in the SMSM (Figure S17). Even with the larger , a-GeSe presents reasonable TE performance, reaching at K for and derived from a-SnSe. Though the approach of Yuan et al.Yuan et al. (2019) is more realistic than Debye-Callaway theory, the example of chalcogenides has shown that including additional factors such as thermal expansion, anharmonic phonon renormalization, four-phonon scattering, and impurity scatterings all generally serve to reduce the calculated values of Wu et al. (2017); Xia (2018), bringing them closer to the simpler Debye-Callaway approximation. Since doped GeSe is a strongly anharmonic material, it is not unreasonable that the Debye-Callaway method might yield reasonable results, as it has for other low-conductivity thermoelectric compounds.Zhang et al. (2012)
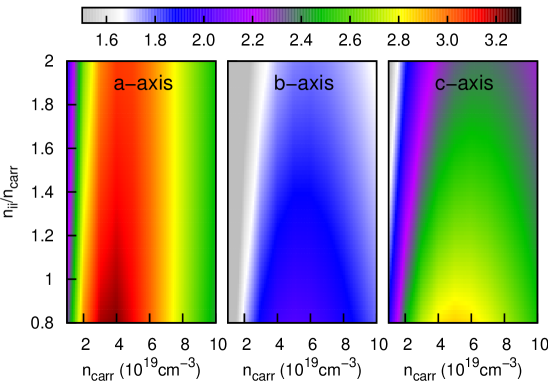
Since GeSe should maintain its structure at higher temperatures than SnSe, we extend our analysis to 900 K. At that high temperature we estimate using a extrapolation Grimvall (1999) of the theoretical calculations done by Hao et al. Hao et al. (2016) To that result we add calculated within our current framework. However, due to its phase transition, there is no SnSe transport data at 900 K that we can use to determine and . Instead, we scan over a range of and the ratio and carry out transport calculations by solving the BTE for each pair of values. The density is varied between 1 cm-3 and 10 cm-3 in 10 equally spaced steps, while for each value of , was varied between 0.8 to in steps of 0.2.
The calculated values along all three crystallographic axes of GeSe at 900 K are shown as a function of and in Fig. 7. The out-of-plane direction presents the highest performance in comparison to the other axes, reaching the ultrahigh value of at optimal = 4 cm-3. It is important to note that remains very high even if the ratio increases. For example, when , indicating a high performance with larger than 3 even if is doubled. Horizontal line cuts at fixed ratios are shown in Fig. S18, clearly demonstrating that a tenfold increase in the ratio can still lead to great performance provided is correspondingly increased. For example, with , an optimal value of 6 cm-3 yields . Fig. S18 also shows the robustness of the high values as is varied. For instance, 3 for between 3 cm-3 and 6 cm-3 when . Though not as impressive as the out-of-plane direction, the two in-plane directions still exhibit relatively high values at 900 K, namely, 2.0 (2.8) for the optimal ratio 5 cm-3 for the b-axis (c-axis).
V Conclusions
In summary, we applied extensive first-principles calculations within the BTE framework to throughly investigate the temperature dependence of the TE transport properties of the orthorhombic Pnma phase of p-doped GeSe and SnSe. These calculations were done for values of the carrier density that yielded the record-breaking TE performance of p-doped SnSe.Zhao et al. (2016) We explicitly calculated the RTs due to nonpolar and screened Fröhlich polar h-p scattering, as well as the RT associated with the scattering by ionized impurities. The obtained temperature and hole-energy dependent RTs provide insight into the microscopic origin of the transport properties in p-doped GeSe and SnSe.
Our results indicate that the calculated GeSe Seebeck coefficients, , are slightly higher than those of SnSe at temperatures above 600 K, while both axes of GeSe present electrical conductivity values that are intermediate between those of a- and b-SnSe. Importantly, both axes of GeSe exhibit Lorenz numbers below the non-degenerate limit of semiconductors. In-plane SnSe also has very low values for the Lorenz function , and at temperatures above 500 K they are the same or even smaller than those of in-plane GeSe. On the other hand, a-SnSe possesses the highest among all studied systems. Those results for are directly correlated with TE performance, in which a low plays a beneficial role in obtaining a high .
All axes of GeSe have quite low thermal conductivity , which is a consequence of relatively low that yields low hole thermal conductivity, and high anharmonicity Hao et al. (2016) that leads to predictions of low . Combined with the high Seebeck coefficients, extremely low Lorenz numbers, and a relatively large band gap, our calculations predict an outstanding TE performance for both out-of-plane (a-axis) and in-plane (b- and c-axis) GeSe throughout a wide range of temperatures. Above 500 K the out-of-plane direction has values equal to or greater than the record-breaking performance of b-SnSe. By extending the analysis of the TE performance of GeSe to 900 K, we find that the out-of-plane direction still presents the highest performance compared to other axes, reaching an ultrahigh at the optimal carrier density of 4 cm-3. In addition, the two in-plane axes also have impressive figures of merit, with 2.0 (2.8) for the b-axis (c-axis) with optimal carrier density of 5 cm-3. It is important to point out that the total RTs of out-of-plane GeSe are much higher than those of a-SnSe. Thus our results for the out-of-plane direction could not be anticipated by calculations using the same RTs as those for SnSe. Hao et al. (2016)
Finally, it is also important to point out that intrinsic GeSe possesses low carrier density. To date Ge substitution by Ag is the most effective method of doping, enabling a hole density up to cm-3 and at 700 K for polycrystalline GeSe. Zhang et al. (2016b) This experimental result is far below our highest theoretically predicted value of at 900 K, which can be attributed to the low carrier density that is far below our predicted optimal carrier density of cm-3. Our results indicate that there is enormous room for further improvement in the TE performance of GeSe by increasing the doping to optimal carrier density.
Supplemental Material
Extra data and analyses are provided in the Supplemental Material.
Conflicts of interest
There are no conflicts to declare.
Acknowledgements
ASC and AA gratefully acknowledge support from the Brazilian agencies CNPq and FAPESP under Grants #2010/16970-0, #2013/08293-7, #2015/26434-2, #2016/23891-6, #2017/26105-4, and #2019/26088-8. DTL acknowledges funding from the STC Center for Integrated Quantum Materials, NSF Grant No. DMR-1231319; NSF DMREF Award No. 1922172; and the Army Research Office under Cooperative Agreement Number W911NF-21-2-0147. The calculations were performed at CCJDR-IFGW-UNICAMP in Brazil.
Computer Code Availability
All computer implementations of the methodology developed in this project were written in Fortran 90 and are available upon request.
References
- Mao et al. (2020) J. Mao, G. Chen, and Z. Ren, Nature Materials , 1 (2020).
- Mao et al. (2019) J. Mao, H. Zhu, Z. Ding, Z. Liu, G. A. Gamage, G. Chen, and Z. Ren, Science 365, 495 (2019).
- DiSalvo (1999) F. J. DiSalvo, Science 285, 703 (1999).
- He and Tritt (2017) J. He and T. M. Tritt, Science 357, eaak9997 (2017).
- Lv et al. (2013) H. Lv, H. Liu, J. Shi, X. Tang, and C. Uher, Journal of Materials Chemistry A 1, 6831 (2013).
- Venkatasubramanian et al. (2001) R. Venkatasubramanian, E. Siivola, T. Colpitts, and B. O’quinn, Nature 413, 597 (2001).
- Zhang et al. (2016a) Y. Zhang, S. Hao, L.-D. Zhao, C. Wolverton, and Z. Zeng, Journal of Materials Chemistry A 4, 12073 (2016a).
- Zhong et al. (2014) B. Zhong, Y. Zhang, W. Li, Z. Chen, J. Cui, W. Li, Y. Xie, Q. Hao, and Q. He, Applied Physics Letters 105, 123902 (2014).
- Famili et al. (2018) M. Famili, I. M. Grace, Q. Al-Galiby, H. Sadeghi, and C. J. Lambert, Advanced Functional Materials 28, 1703135 (2018).
- Xue et al. (2016) Q. Xue, H. Liu, D. Fan, L. Cheng, B. Zhao, and J. Shi, Physical Chemistry Chemical Physics 18, 17912 (2016).
- Ohta et al. (2007) H. Ohta, S. Kim, Y. Mune, T. Mizoguchi, K. Nomura, S. Ohta, T. Nomura, Y. Nakanishi, Y. Ikuhara, M. Hirano, H. Hosono, and K. Koumoto, Nature Materials 6, 129 (2007).
- Fu et al. (2016) T. Fu, X. Yue, H. Wu, C. Fu, T. Zhu, X. Liu, L. Hu, P. Ying, J. He, and X. Zhao, Journal of Materiomics 2, 141 (2016).
- Zhao et al. (2014) L.-D. Zhao, S.-H. Lo, Y. Zhang, H. Sun, G. Tan, C. Uher, C. Wolverton, V. P. Dravid, and M. G. Kanatzidis, Nature 508, 373 (2014).
- Zhao et al. (2016) L.-D. Zhao, G. Tan, S. Hao, J. He, Y. Pei, H. Chi, H. Wang, S. Gong, H. Xu, V. P. Dravid, C. Uher, G. J. Snyder, C. Wolverton, and M. G. Kanatzidis, Science 351, 141 (2016).
- Chang et al. (2018) C. Chang, M. Wu, D. He, Y. Pei, C.-F. Wu, X. Wu, H. Yu, F. Zhu, K. Wang, Y. Chen, L. Huang, J.-F. Li, J. He, and L.-D. Zhao, Science 360, 778 (2018).
- Vining (2009) C. B. Vining, Nature Materials 8, 83 (2009).
- Sales et al. (1996) B. Sales, D. Mandrus, and R. K. Williams, Science 272, 1325 (1996).
- Zhou et al. (2021) C. Zhou, Y. K. Lee, Y. Yu, S. Byun, Z.-Z. Luo, H. Lee, B. Ge, Y.-L. Lee, X. Chen, J. Y. Lee, C.-M. Oana, H. Chang, J. Im, S.-P. Cho, M. Wuttig, V. P. Dravid, M. G. Kanatzidis, and I. Chung, Nature materials , 1 (2021).
- Pei et al. (2011) Y. Pei, X. Shi, A. LaLonde, H. Wang, L. Chen, and G. J. Snyder, Nature 473, 66 (2011).
- Pei et al. (2012) Y. Pei, H. Wang, and G. J. Snyder, Advanced Materials 24, 6125 (2012).
- Dehkordi et al. (2015) A. M. Dehkordi, M. Zebarjadi, J. He, and T. M. Tritt, Materials Science and Engineering: R: Reports 97, 1 (2015).
- Zhao et al. (2013) L.-D. Zhao, S. Hao, S.-H. Lo, C.-I. Wu, X. Zhou, Y. Lee, H. Li, K. Biswas, T. P. Hogan, C. Uher, C. Wolverton, V. P. Dravid, and K. M. G, Journal of the American Chemical Society 135, 7364 (2013).
- Liu et al. (2012a) W. Liu, X. Tan, K. Yin, H. Liu, X. Tang, J. Shi, Q. Zhang, and C. Uher, Physical Review Letters 108, 166601 (2012a).
- Parker et al. (2015) D. S. Parker, A. F. May, and D. J. Singh, Physical Review Applied 3, 064003 (2015).
- Chen et al. (2013) X. Chen, D. Parker, and D. J. Singh, Scientific Reports 3, 3168 (2013).
- González-Romero et al. (2018) R. L. González-Romero, A. Antonelli, A. S. Chaves, and J. J. Meléndez, Physical Chemistry Chemical Physics 20, 1809 (2018).
- McKinney et al. (2017) R. W. McKinney, P. Gorai, V. Stevanović, and E. S. Toberer, Journal of Materials Chemistry A 5, 17302 (2017).
- Chaves et al. (2021a) A. S. Chaves, D. T. Larson, E. Kaxiras, and A. Antonelli, Physical Review B 104, 115204 (2021a).
- Hochbaum et al. (2008) A. I. Hochbaum, R. Chen, R. D. Delgado, W. Liang, E. C. Garnett, M. Najarian, A. Majumdar, and P. Yang, Nature 451, 163 (2008).
- Boukai et al. (2008) A. I. Boukai, Y. Bunimovich, J. Tahir-Kheli, J.-K. Yu, W. A. Goddard III, and J. R. Heath, Nature 451, 168 (2008).
- Kanatzidis (2009) M. G. Kanatzidis, Chemistry of Materials 22, 648 (2009).
- Vineis et al. (2010) C. J. Vineis, A. Shakouri, A. Majumdar, and M. G. Kanatzidis, Advanced Materials 22, 3970 (2010).
- Biswas et al. (2012) K. Biswas, J. He, I. D. Blum, C.-I. Wu, T. P. Hogan, D. N. Seidman, V. P. Dravid, and M. G. Kanatzidis, Nature 489, 414 (2012).
- Liu et al. (2012b) H. Liu, X. Shi, F. Xu, L. Zhang, W. Zhang, L. Chen, Q. Li, C. Uher, T. Day, and G. J. Snyder, Nature Materials 11, 422 (2012b).
- Olvera et al. (2017) A. Olvera, N. Moroz, P. Sahoo, P. Ren, T. Bailey, A. Page, C. Uher, and P. Poudeu, Energy & Environmental Science 10, 1668 (2017).
- Cheng et al. (2017) Y. Cheng, J. Yang, Q. Jiang, D. He, J. He, Y. Luo, D. Zhang, Z. Zhou, Y. Ren, and J. Xin, Journal of Materials Chemistry A 5, 5163 (2017).
- Ma et al. (2020) N. Ma, Y.-Y. Li, L. Chen, and L.-M. Wu, Journal of the American Chemical Society 142, 5293 (2020).
- Roychowdhury et al. (2021) S. Roychowdhury, T. Ghosh, R. Arora, M. Samanta, L. Xie, N. K. Singh, A. Soni, J. He, U. V. Waghmare, and K. Biswas, Science 371, 722 (2021).
- Taniguchi et al. (1990) M. Taniguchi, R. Johnson, J. Ghijsen, and M. Cardona, Physical Review B 42, 3634 (1990).
- Okazaki (1958) A. Okazaki, Journal of the Physical Society of Japan 13, 1151 (1958).
- Antunez et al. (2011) P. D. Antunez, J. J. Buckley, and R. L. Brutchey, Nanoscale 3, 2399 (2011).
- Liu et al. (2017) S.-C. Liu, Y. Mi, D.-J. Xue, Y.-X. Chen, C. He, X. Liu, J.-S. Hu, and L.-J. Wan, Advanced Electronic Materials 3, 1700141 (2017).
- Huang et al. (2017) Z. Huang, S. A. Miller, B. Ge, M. Yan, S. Anand, T. Wu, P. Nan, Y. Zhu, W. Zhuang, G. J. Snyder, P. Jiang, and X. Bao, Angewandte Chemie International Edition 56, 14113 (2017).
- Sarkar et al. (2020) D. Sarkar, T. Ghosh, S. Roychowdhury, R. Arora, S. Sajan, G. Sheet, U. V. Waghmare, and K. Biswas, Journal of the American Chemical Society 142, 12237 (2020).
- Sarkar et al. (2021) D. Sarkar, S. Roychowdhury, R. Arora, T. Ghosh, A. Vasdev, B. Joseph, G. Sheet, U. V. Waghmare, and K. Biswas, Angewandte Chemie (2021).
- Ding et al. (2015) G. Ding, G. Gao, and K. Yao, Scientific reports 5, 1 (2015).
- Hao et al. (2016) S. Hao, F. Shi, V. P. Dravid, M. G. Kanatzidis, and C. Wolverton, Chemistry of Materials 28, 3218 (2016).
- Zhang et al. (2016b) X. Zhang, J. Shen, S. Lin, J. Li, Z. Chen, W. Li, and Y. Pei, Journal of Materiomics 2, 331 (2016b).
- Chaves et al. (2020) A. S. Chaves, A. Antonelli, D. T. Larson, and E. Kaxiras, Physical Review B 102, 125116 (2020).
- Hohenberg and Kohn (1964) P. Hohenberg and W. Kohn, Physical Review 136, B864 (1964).
- Kohn and Sham (1965) W. Kohn and L. J. Sham, Physical Review 140, A1133 (1965).
- Baroni et al. (2001) S. Baroni, S. De Gironcoli, A. Dal Corso, and P. Giannozzi, Reviews of Modern Physics 73, 515 (2001).
- (53) See Supplemental Material (SM) at for a more comprehensive theoretical framework, additional details about the temperature dependence of the relaxation times (RTs), comparisons between the RTs for different systems and axes, additional analysis of the carrier densities, concentration of ionized impurities and thermoelectric figure of merit for different axes and conditions. SM contains additional references [93-101].
- Pellegrini et al. (2016) C. Pellegrini, A. Marinelli, and S. Reiche, Reviews of Modern Physics 88, 015006 (2016).
- Bostedt et al. (2016) C. Bostedt, S. Boutet, D. M. Fritz, Z. Huang, H. J. Lee, H. T. Lemke, A. Robert, W. F. Schlotter, J. J. Turner, and G. J. Williams, Reviews of Modern Physics 88, 015007 (2016).
- Vogl (1976) P. Vogl, Physical Review B 13, 694 (1976).
- Ehrenreich (1959) H. Ehrenreich, Journal of Physics and Chemistry of Solids 8, 130 (1959).
- Brooks (1955) H. Brooks, in Advances in electronics and electron physics, Vol. 7 (Elsevier, 1955) pp. 85–182.
- Chattopadhyay and Queisser (1981) D. Chattopadhyay and H. Queisser, Reviews of Modern Physics 53, 745 (1981).
- Chaves et al. (2021b) A. S. Chaves, R. L. González-Romero, J. J. Meléndez, and A. Antonelli, Physical Chemistry Chemical Physics 23, 900 (2021b).
- Madsen and Singh (2006) G. K. Madsen and D. J. Singh, Computer Physics Communications 175, 67 (2006).
- Giannozzi et al. (2009) P. Giannozzi, S. Baroni, N. Bonini, M. Calandra, R. Car, C. Cavazzoni, D. Ceresoli, G. L. Chiarotti, M. Cococcioni, I. Dabo, A. Dal Corso, S. de Gironcoli, S. Fabris, G. Fratesi, R. Gebauer, U. Gerstmann, C. Gougoussis, A. Kokalj, M. Lazzeri, L. Martin-Samos, N. Marzari, F. Mauri, R. Mazzarello, S. Paolini, A. Pasquarello, L. Paulatto, C. Sbraccia, S. Scandolo, G. Sclauzero, A. P. Seitsonen, A. Smogunov, P. Umari, and R. M. Wentzcovitch, Journal of Physics: Condensed Matter 21, 395502 (2009).
- Hamann (2013) D. Hamann, Physical Review B 88, 085117 (2013).
- Van Setten et al. (2018) M. Van Setten, M. Giantomassi, E. Bousquet, M. J. Verstraete, D. R. Hamann, X. Gonze, and G.-M. Rignanese, Computer Physics Communications 226, 39 (2018).
- Perdew et al. (1996) J. P. Perdew, K. Burke, and M. Ernzerhof, Physical Review Letters 77, 3865 (1996).
- Elkorashy (1989) A. Elkorashy, physica status solidi (b) 152, 249 (1989).
- Vaughn et al. (2010) D. D. Vaughn, R. J. Patel, M. A. Hickner, and R. E. Schaak, Journal of the American Chemical Society 132, 15170 (2010).
- Ross and Bourgon (1969) L. Ross and M. Bourgon, Canadian Journal of Chemistry 47, 2555 (1969).
- Ipser et al. (1982) H. Ipser, M. Gambino, and W. Schuster, Monatshefte für Chemie/Chemical Monthly 113, 389 (1982).
- Bletskan (2005) D. Bletskan, Journal of Ovonic Research 1, 53 (2005).
- Wiedemeier and Siemers (1975) H. Wiedemeier and P. Siemers, Zeitschrift für anorganische und allgemeine Chemie 411, 90 (1975).
- Sist et al. (2017) M. Sist, C. Gatti, P. Nørby, S. Cenedese, H. Kasai, K. Kato, and B. B. Iversen, Chemistry–A European Journal 23, 6888 (2017).
- Li et al. (2015) C. W. Li, J. Hong, A. F. May, D. Bansal, S. Chi, T. Hong, G. Ehlers, and O. Delaire, Nature Physics 11, 1063 (2015).
- Grimme et al. (2010) S. Grimme, J. Antony, S. Ehrlich, and H. Krieg, The Journal of Chemical Physics 132, 154104 (2010).
- Jain et al. (2013) A. Jain, S. P. Ong, G. Hautier, W. Chen, W. D. Richards, S. Dacek, S. Cholia, D. Gunter, D. Skinner, G. Ceder, and K. A. Persson, APL materials 1, 011002 (2013).
- Wiedemeier and von Schnering (1978) H. Wiedemeier and H. G. von Schnering, Z. Kristallogr 148, 3 (1978).
- Giustino et al. (2007) F. Giustino, M. L. Cohen, and S. G. Louie, Physical Review B 76, 165108 (2007).
- Poncé et al. (2016) S. Poncé, E. R. Margine, C. Verdi, and F. Giustino, Computer Physics Communications 209, 116 (2016).
- Mostofi et al. (2008) A. A. Mostofi, J. R. Yates, Y.-S. Lee, I. Souza, D. Vanderbilt, and N. Marzari, Computer Physics Communications 178, 685 (2008).
- Madelung (2004) O. Madelung, Semiconductors: data handbook (Springer Science & Business Media, 2004).
- Chandrasekhar et al. (1977) H. Chandrasekhar, R. Humphreys, U. Zwick, and M. Cardona, Physical Review B 15, 2177 (1977).
- Wang et al. (2018) X. Wang, V. Askarpour, J. Maassen, and M. Lundstrom, Journal of Applied Physics 123, 055104 (2018).
- Putatunda and Singh (2019) A. Putatunda and D. J. Singh, Materials Today Physics 8, 49 (2019).
- Xiao and Zhao (2020) Y. Xiao and L.-D. Zhao, Science 367, 1196 (2020).
- Wei et al. (2016) P.-C. Wei, S. Bhattacharya, J. He, S. Neeleshwar, R. Podila, Y. Chen, and A. Rao, Nature 539, E1 (2016).
- Wu et al. (2017) D. Wu, L. Wu, D. He, L.-D. Zhao, W. Li, M. Wu, M. Jin, J. Xu, J. Jiang, L. Huang, Y. Zhu, M. G. Kanatzidis, and J. He, Nano Energy 35, 321 (2017).
- Li et al. (2017) G. Li, U. Aydemir, M. Wood, W. A. Goddard III, P. Zhai, Q. Zhang, and G. J. Snyder, Chemistry of Materials 29, 2382 (2017).
- Chen et al. (2016) Y.-X. Chen, Z.-H. Ge, M. Yin, D. Feng, X.-Q. Huang, W. Zhao, and J. He, Advanced Functional Materials 26, 6836 (2016).
- Yuan et al. (2019) K. Yuan, Z. Sun, X. Zhang, and D. Tang, Scientific reports 9, 1 (2019).
- Xia (2018) Y. Xia, Applied Physics Letters 113, 073901 (2018).
- Zhang et al. (2012) Y. Zhang, E. Skoug, J. Cain, V. Ozoliņš, D. Morelli, and C. Wolverton, Physical Review B 85, 054306 (2012).
- Grimvall (1999) G. Grimvall, Thermophysical Properties of Materials (Elsevier, 1999).
- Giustino (2017) F. Giustino, Reviews of Modern Physics 89, 015003 (2017).
- Poncé et al. (2018) S. Poncé, E. R. Margine, and F. Giustino, Physical Review B 97, 121201 (2018).
- Poncé et al. (2020) S. Poncé, W. Li, S. Reichardt, and F. Giustino, Reports on Progress in Physics 83, 036501 (2020).
- Fröhlich (1937) H. Fröhlich, Proc. Roy. Soc.(London) 160, 230 (1937).
- Verdi and Giustino (2015) C. Verdi and F. Giustino, Physical Review Letters 115, 176401 (2015).
- Marzari and Vanderbilt (1997) N. Marzari and D. Vanderbilt, Physical review B 56, 12847 (1997).
- Askerov and Figarova (2009) B. M. Askerov and S. Figarova, Thermodynamics, Gibbs Method and Statistical Physics of Electron Gases, Vol. 57 (Springer Science & Business Media, 2009).
- Shankland (1971) D. G. Shankland, in Computational Methods in Band Theory (Springer, 1971) pp. 362–367.
- Koelling and Wood (1986) D. Koelling and J. Wood, Journal of Computational Physics 67, 253 (1986).