Channel Modelling and Error Performance Investigation for Reading Lights Based In-flight LiFi
Abstract
The new generation of communication technologies are constantly being pushed to meet a diverse range of user requirements such as high data rate, low power consumption, very low latency, very high reliability and broad availability. To address all these demands, fifth generation (5G) radio access technologies have been extended into a wide range of new services. However, there are still only a limited number of applications for radio frequency (RF) based wireless communications inside aircraft cabins that comply with the 5G vision. Potential interference and safety issues in on-board wireless communications pose significant deployment challenges. By transforming each reading light into an optical wireless access point (AP), light-fidelity (LiFi), could provide seamless on-board connectivity in dense cabin environments without RF interference. Furthermore, the utilization of available reading lights allows for a relatively simple, cost-effective deployment with the high energy and spectral efficiency. To successfully implement the aeronautical cabin LiFi applications, comprehensive optical channel characterization is required. In this paper, we propose a novel Monte Carlo ray-tracing (MCRT) channel modelling technique to capture the details of in-flight LiFi links. Accordingly, a realistic channel simulator, which takes the cabin models, interior elements and measurement based optical source, receiver, surface material characteristics into account is developed. The effect of the operation wavelength, cabin model accuracy and user terminal mobility on the optical channel conditions is also investigated. As a final step, the on-board direct-current biased optical orthogonal frequency division multiplexing (DCO-OFDM) performance is evaluated by using obtained in-flight LiFi channels. Numerical results show that the location of a mobile terminal and accurate aircraft cabin modelling yield as much as and dB performance difference, respectively.
Index Terms:
In-flight communications (IFC), LiFi, Monte-Carlo Ray Tracing (MCRT), channel modelling, DC-biased optical OFDM (DCO-OFDM), bit-error-ratio (BER)I Introduction
The rapid paradigm shift from the voice oriented circuit-switched domain to the data centric packet-switched network has emerged as a major driver of innovation in wireless communication technologies. The user demand for high speed video streaming and online gaming services, augmented reality (AR)/virtual reality (VR) applications, wearable devices and internet-of-things (IoT) create a data greedy ecosystem. Recent forecasts by Cisco showed that monthly data traffic will reach more than exabytes by 2022, with of this emerging due to smart phones and tablets [1]. However, industrial automation, autonomous cars, remote controlling and tactile internet require strict reliability and low latency features instead of high data rates. Furthermore, machine type communications (MTC), which is based on sensor networks, requires low data rate, power consumption and high user density to build smart entities. In order to cope with these diverse and ever increasing demands, services in fifth generation (5G) new radio (NR) networks are categorized into three main categories; enhanced mobile broadband (eMBB), ultra-reliable and low-latency communications (uRLLC) and massive MTC (mMTC).
As a natural extension of the digital revolution and 5G NR targets, aircraft infotainment and broadband internet access became one of the most important revenue sources for the airline industry. Accordingly, the market potential forecasts show that the revenue for in-flight broadband enabled passenger services for the years 2028 and 2035 are expected to be more than 36 and 63 billion US dollars, respectively [2]. Although the majority of airline companies are already providing various on-board connectivity solutions, passengers are still obligated to keep their cellular connections off during flight. Nonetheless, the responses taken from passenger surveys show that of passengers are interested in using their own devices for on-board infotainment [3]. Extreme user density, approximately for a narrow-body aircraft, and potential interference issues in small confined areas such as aircraft cabins, pose significant challenges. Specifically, safety concerns and related regulations in the aviation industry prevents the wide adoption of on-board radio frequency (RF) cellular networks.
One of the key enablers of 5G NR to meet the user demand is the utilization of the higher frequency portion (e.g. Sub-6 and millimetre wave) of the spectrum along with the existing bands to provide additional capacity. To comply with 5G NR innovations, light-fidelity (LiFi), which is a bi-directional and seamless optical wireless broadband networking solution, could overcome the challenges mentioned above. The non-interfering nature of the light with RF and the unregulated spectrum, which is 2600 times larger than the entire RF band [4, 5], are the main advantages of LiFi to realize small cells and high frequency reuse. Moreover, the deployment, energy, cost efficiency and enhanced security aspects of LiFi could also be harvested via the utilization of the pre-existing in-built reading lights in the cabin as broadband in-flight wireless access points (APs). To achieve mentioned goals, accurate channel modelling plays an important role in designing highly efficient LiFi networks. Unlike RF channels with slow, fast fading and shadowing effects, indoor LiFi applications have relatively more deterministic channel characteristics due to the intrinsic nature of intensity-modulation and direct-detection (IM/DD) transmission [6]. However, due to the high geometric and spectral dependency of the on-board optical channels, each specific application requires it’s own modelling procedure. Furthermore, both the analytical line-of-sight (LoS) and recursive channel modelling approaches in the literature do not always yield accurate results, as some of the optical characteristics are omitted for calculation simplicity. To capture details of the in-flight optical wireless communications (IFOWC) channels and provide deeper time and frequency-domain analyses, a comprehensive in-flight channel modelling approach is proposed in this paper. Accordingly, both infra-red (IR) and visible light (VL) spectrum channels are characterized by using realistic source, receiver, cabin, seating and coating material models within a Monte Carlo ray-tracing (MCRT) simulation environment.
The contributions of this work can be summarised as follows:
-
•
A novel optical channel modelling toolkit for broadband in-flight LiFi is proposed. Accordingly, realistic geometry of the aircraft cabin and the auxiliary parts; seats and overhead luggage compartment are designed first. Then, geometrical, spatial, angular and spectral profiles of the front-end optics and surface materials are modelled and inputted into the toolkit. The MCRT based simulations are conducted both in the IR and VL bands for the realistic and simplified aircraft cabin structures and for various user equipment (UE) locations.
-
•
The time dispersive in-flight LiFi channels are characterized by calculating the channel impulse response (CIR), channel frequency response (CFR), direct-current (DC) gain, mean delay, root-mean-squared (RMS) delay spread and flatness factor parameters. Moreover, the bandwidth properties of the channels are also devised by frequency domain analyses of the MCRT based channel data.
-
•
Lastly, a practical on-board LiFi system performance under both the multipath optical channel and non-linear transmit light emitting diode (LED) clipping effects are presented. The analytical bit error ratio (BER) expression for DC biased optical orthogonal frequency division multiplexing (DCO-OFDM) under the mentioned channel impairments are obtained and compared with the computer simulation results. The importance of the accuracy of the aircraft cabin modelling, transmission wavelength and the location of the UE on a practical system performance are also investigated.
The reminder of the paper is organized as follows. In Section II, a comprehensive IFOWC channel modelling literature review is provided. In Section III, the details of the proposed MCRT based LiFi channel modelling environment is presented. In Section IV, the mathematical background of the channel simulations and characterization along with the time and frequency domain analyses are provided and discussed. In Section V, the analytical expression and computer simulations based BER performance curves of DCO-OFDM obtained under the frequency selectivity and non-linear LED clipping noise are also presented. Finally, the conclusions are drawn in Section VI.
Notation: Throughout the paper, vectors are in bold lowercase letters. The , and axes elements of the vector are given by , and , respectively. The Dirac delta, inverse tangent and limit functions are expressed by , and , respectively. The magnitude of a complex number , logarithm of a number to base , statistical expectation, circular convolution, element-wise multiplication and ceiling operations are also denoted by , , , , and , respectively. The real-valued normal distribution with mean, , and variance, , is given by . The Q-function is defined by .
II Multi-bounce IFOWC Channel Modelling Literature
In this section, a literature review for multi-bounce IFOWC channel modelling techniques, which includes LoS and non-LoS (NLoS) components, will be presented. The path loss (PL) and RMS delay spread characteristics of the multi-bounce optical channel for ceiling (wash) light-based IR links is investigated in [7]. Accordingly, the MCRT analysis inside a simplified Boeing 777 cabin model is presented. Similarly, in [8], an IFOWC system with IR-laser diode (LD) based ceiling lights is considered where the data is envisaged to be delivered to seat backs within a cellular deployment, which covers 5 seats. Moreover, multipath CIR is obtained by MCRT for a simplified cabin model and results are validated by mock-up cabin measurements. Another ceiling light based channel characterization for the IR band IFOWC is proposed in [9] and [10]. Accordingly, the multi-bounce MCRT channel model for a simplified cabin model is utilized to estimate the parameters of PL and shadowing. Moreover, the cell edge and centre signal-to-interference-ratio (SIR) maps are also obtained. Note that the omni-directional transmitter (TX)-receiver (RX) pair is designed in [9, 10] to show that the RF PL model (Friis’ formula) with shadowing (slow fading) effects can also be modelled in incoherent optical wireless communications (OWC). Furthermore, the effect of frequency reuse (FR) schemes on the SIR distribution is also investigated in [10]. The ceiling mounted passive retro-reflector based communication between passenger service units (PSUs) via IR directed links is proposed in [11]. However, only a single bounce, , CIR with a simplified cabin model is calculated by using the method in [12]. Note that the parameter will be used to refer the light rays after the order reflections, where . The parameter is the maximum number of reflections considered within the system. Furthermore, bounce corresponds to the LoS component of the channel. In [13], an MCRT based IFOWC channel modelling technique, which is able to encounter up to -bounces, is used to obtain SIR and signal-to-noise-ratio (SNR) maps. Accordingly, VL and IR band sources in uplink (UL) and downlink (DL) directions, respectively, are employed. However, a very primitive cabin and aircraft interior model is presented in [13], where the details of the optical channels are also neglected. In the same work, a hardware implementation of the IFOWC network and user side adapter prototypes are also presented. Another ray tracing based VL band IFOWC CIR modelling method for a realistic Boeing 737-900 cabin and seating scenario is given by [14]. In the paper, both the BER spatial distributions and respective outage probability values are also obtained. The signal-to-interference-plus-noise-ratio (SINR) maps for a simplified Boeing 737 cabin and seat models is presented for both phosphorescence and red-green-blue based white LEDs in [15]. The modified MCRT method is used in order to trace a million rays up to -bounce while Lambertian and Phong radiation patterns are assumed for the LEDs. Similarly, in [16], -bounce, , ray tracing simulations for a simplified Boeing 727 cabin model and seating is obtained to simulate UL IR band IFOWC. The effect of passenger movements on the channel and system performance is also investigated, where it has been reported that Mbit/s can be supported by UL IFOWC. A modified MCRT method to obtain VL band reading light based DL IFOWC CIR is presented with a realistic Boeing 737 cabin model and seating in [17]. Specifically, various sources with different beam angles and solar radiation coming from the windows are taken into consideration in the SINR calculations. The same approach to obtain the CIR is also adopted for a simplified Airbus A320-200 cabin and seat models in [18]. The investigation of an IR band IFOWC inside the cockpit, which aims to provide bidirectional connectivity between the ceiling unit and the pilot headset, is given by [19]. Moreover, a Lambertian bidirectional reflectance distribution function, source semi-angles, realistic pilot body models and the effect of users head movement are investigated in [19]. The same approach is enhanced in [20] to capture the effect that both body and head movements have on the IR band CIR.
III In-flight LiFi Channel Modelling Methodology
The signal propagation in the IR and VL spectrum is highly dependent on geometry and the surface structure of the considered environment/scenario due to the weak penetration characteristics of electromagnetic (EM) waves. Thus, it is very important to ensure that geometry and optical characteristics of both the interior and exterior elements of an aeronautical cabin environment are captured accurately as possible for comprehensive channel modelling. However, it is emphasized by the previous section that the existing channel modelling approaches are unable to provide realistic TX, RX, cabin geometry/interior, coating material and reflection/refraction characteristics as a whole. Furthermore, deeper analyses on important channel parameters; frequency response, coherence time/bandwidth, flatness and mobility effects are also omitted. Therefore, in this section, we propose a non-sequential ray tracing (NSRT) based in-flight LiFi channel modelling approach, which is able to encompass a complete set of TX, RX and environment parameters. Accordingly, the shortcomings of the MCRT based CIR modelling technique, which is given in [21, 22, 23, 24], are resolved by the proposed method. Hence, a complete optical channel modelling capability in realistic aircraft environments are supported in the proposed technique by including the RX spectral, angular and spatial characterization.
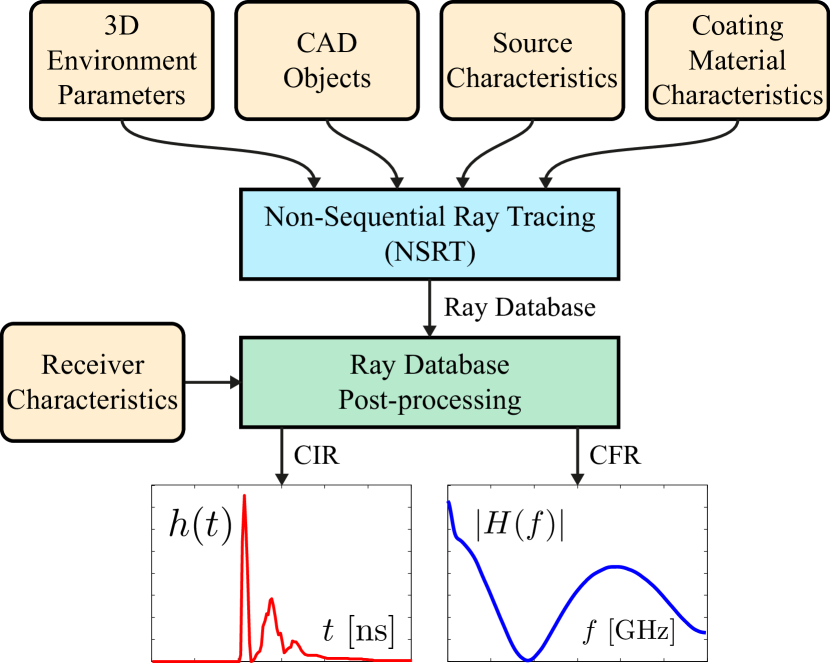
The proposed MCRT simulations are performed with the aid of optical design software tool, Zemax OpticStudio version 20.2 [25]. The benefit of using a commercial solution is the generation of reproducible, replicable and repeatable results, as the packages and libraries are standard and independent of application. The adopted software is able to perform both sequential ray tracing (SRT) or NSRT depending on the application. In NSRT, the generated rays hit the surfaces merely based on the physical positions and the optical properties of the objects by considering the direction of the rays. Whereas, in SRT, the rays are obliged to propagate in a predefined sequence of surfaces or objects, which is very important in imaging optics. Since the primary purpose of LiFi systems is not only communication, but also illumination (mostly diffuse) via reading and wash lighting, the NSRT method is adopted in this research. For our simulations, the realistic aircraft cabin environment is created by the generation of computer-aided-design (CAD) models. Then, the measurement based source and material characteristics are imported into the simulation environment. To obtain the CIRs, a ray database (RDB) file needs to be generated via NSRT, which contains the extensive optical and geometrical information for every single ray traced. Lastly, powerful data processing tools are employed to extract and analyse properties of the optical channel. The block diagram of the proposed MCRT based channel modelling methodology is depicted in Fig. 1.
III-A Generation of the Aircraft Cabin Environment

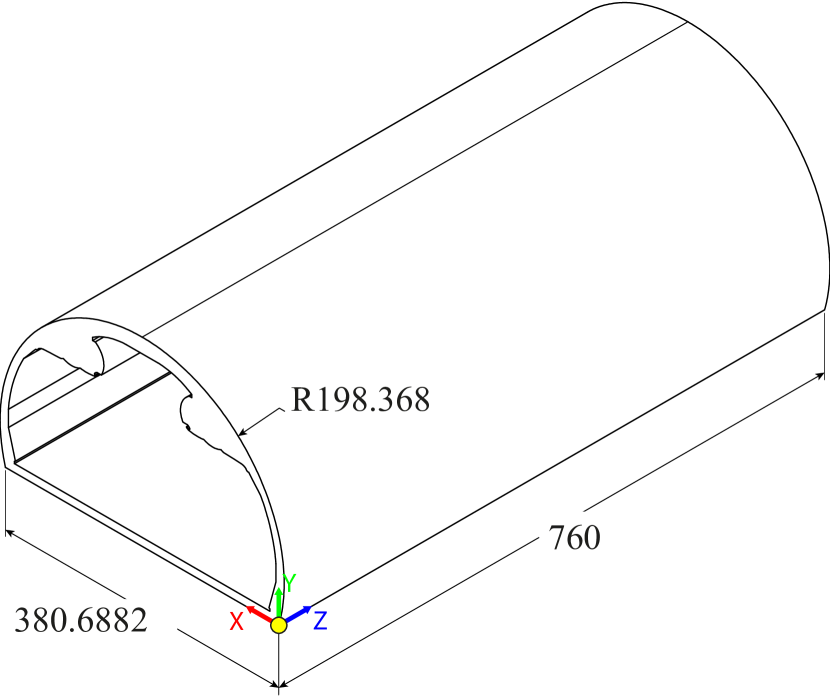
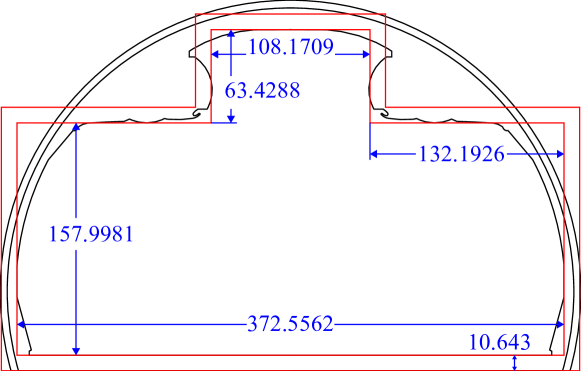
To model the aeronautical cabin environment accurately, the global positions and orientations for the cabin and interior objects must be defined first. For the sake of clarity, the geometric parameters of the objects will be given in vector notation, which is defined with respect to (w.r.t.) the global coordinate system. The origin of the global coordinate system is defined as the vector . The position orientation of each object within the simulation environment is defined by location and orientation vectors and , where the , and axes coordinates and rotation with respect to the , and axes are given by , , and , , , respectively. As can be inferred from previous section, the majority of works in the literature assumed a simplified aircraft cabin, where the curvatures and fine details of the geometry are approximated as flat surfaces. In our work, two types of cabin structures, namely realistic and simplified models, will be considered to investigate the effect of geometrical simplification on the accuracy of the channel parameters. Accordingly, a narrow-body type Airbus A320 is adopted as the main cabin structure for our realistic ray-tracing simulations. Technical details of the narrow-body A320 fuselage were obtained from [26] and the three dimensional model is regenerated using CAD software. Then, the complex faces of the CAD object are replaced with flat surfaces to obtain a simplified cabin model similar to [9] and [10]. The technical drawings and dimensions of both cabin models are depicted for isometric and cross-sectional views in Figs. 2 and 3, respectively. As shown in Fig. 2, the cabin structure is symmetric along the -axis, where only a section of the whole cabin is sufficient to generalize the obtained results. Thus, a portion of the cabin fuselage with the length of m will be employed in this research. Furthermore, only the reading lights based power contributions are considered in our optical channels, where the window shades are designed to be closed in our three dimensional cabin models. However, the variable ambient noise effect will be considered as an electrical domain shot noise at the RX in our practical error performance simulations.
III-A1 The Cabin Interior
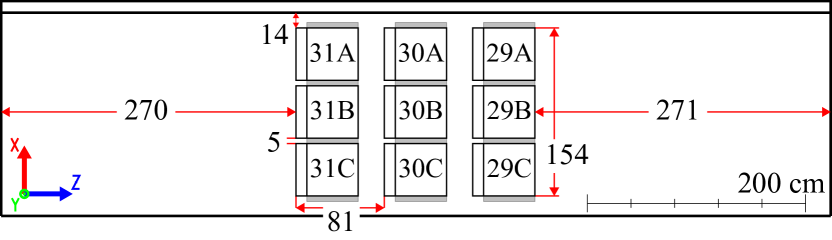
The majority of commercial airliners utilize narrow-beam reading lights on-board [27]. Thus, the coverage of a reading light would not be wider than a single row of seats, where both the seats and passengers will serve as a natural barrier between the seat rows. Due to the symmetric structure of the cabin environment, the left hand-side, direction, of a 6-abreast, 3-3 formation, seating will be considered to create the generalized model. Moreover, the reflection contributions from the neighbouring rows are also evaluated by taking both front and back triple seats into account. For the sake of simplicity, the rows and seats will be labelled as 29, 30, 31 and A, B, C, respectively. Details of the seating structure and dimensions are given in Fig. 4.
The seat pitch is another important parameter for cabin design, which is defined as the distance between any arbitrary point on one seat and the exact same point in the seats directly in front or behind it. To maximize the number of passengers on-board, aircraft companies tend to minimize the seat pitch, which can be as low as inches. However, it has been reported in [28] that passenger well-being and comfort is strongly correlated to how far back the seat can recline. Furthermore, any seat pitch enlargements after inches are also reported not to have a significant affect on the passenger comfort, where the practical values lie between and inches for the economy class. Hence, the seat pitch is chosen to be cm ( inches) in our simulation environment, which falls within the standard economy class range.
III-A2 Passenger Seating
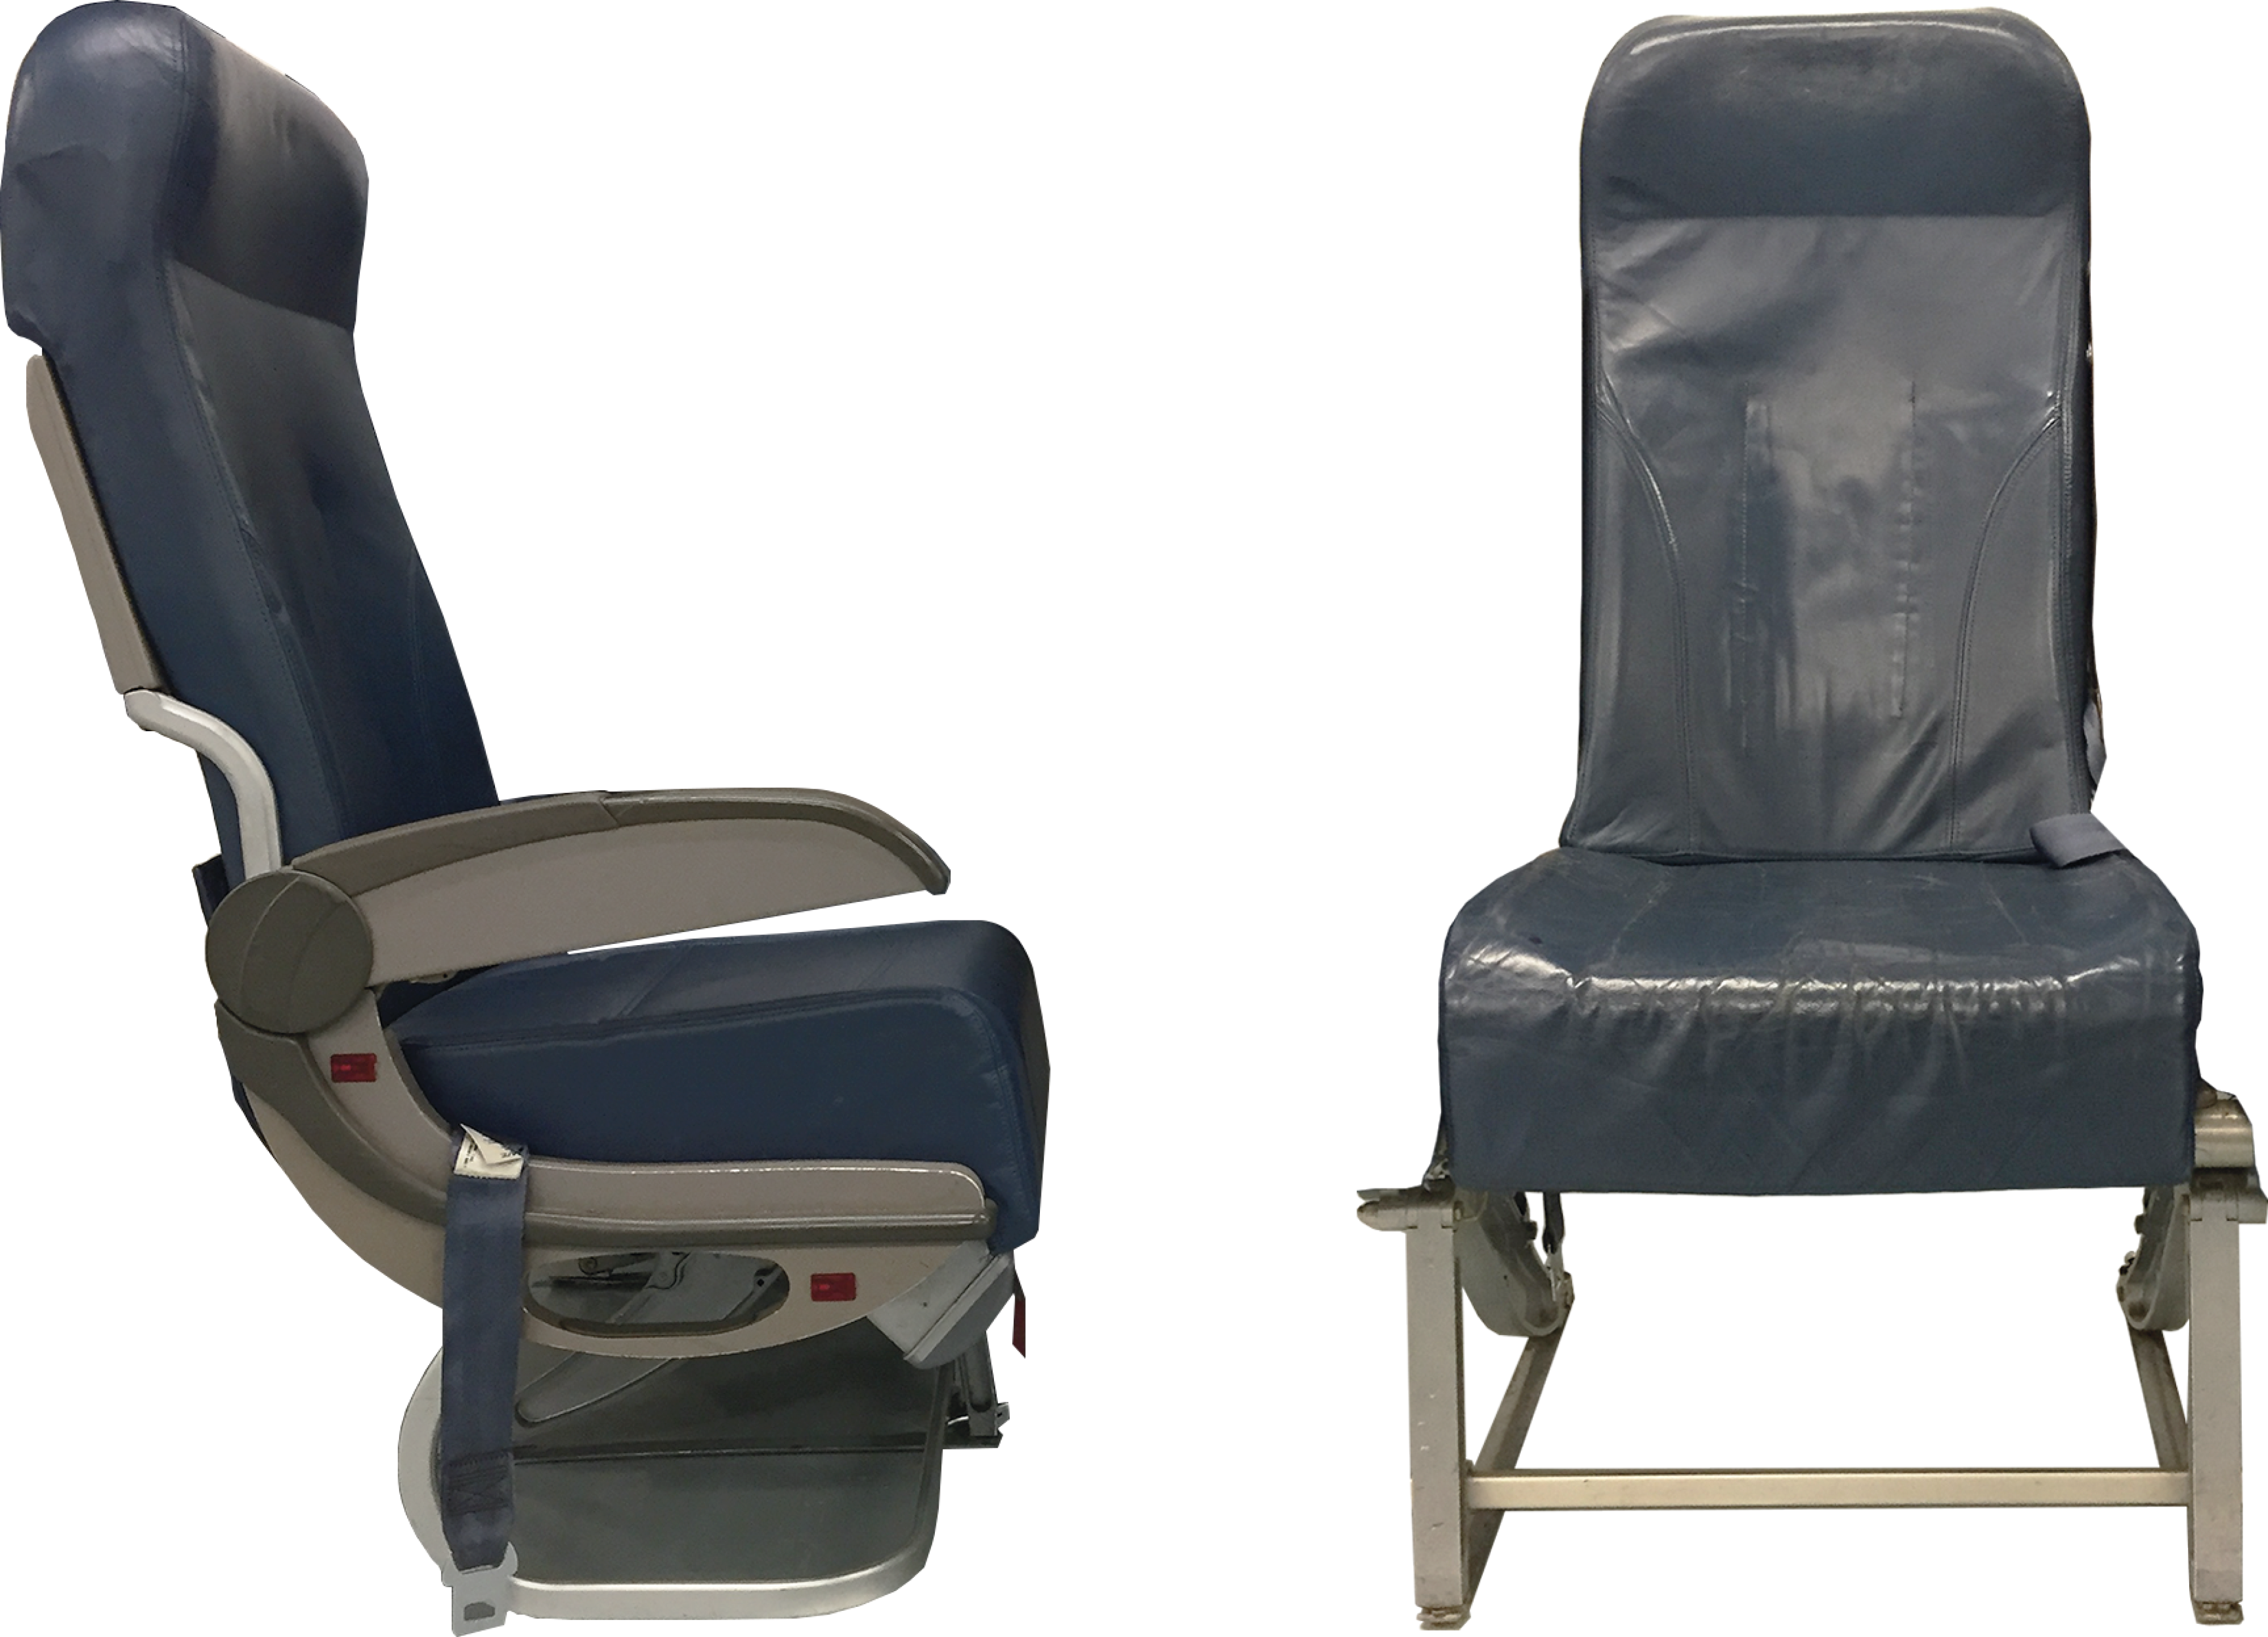
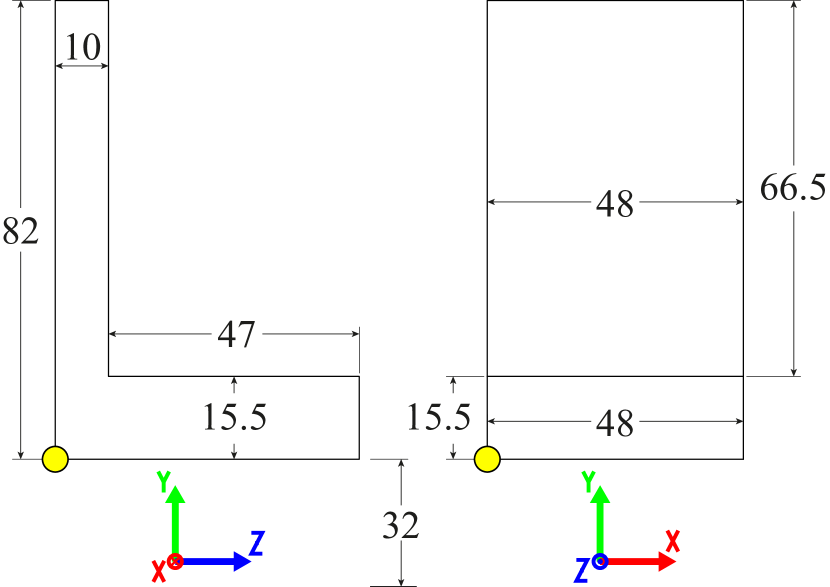
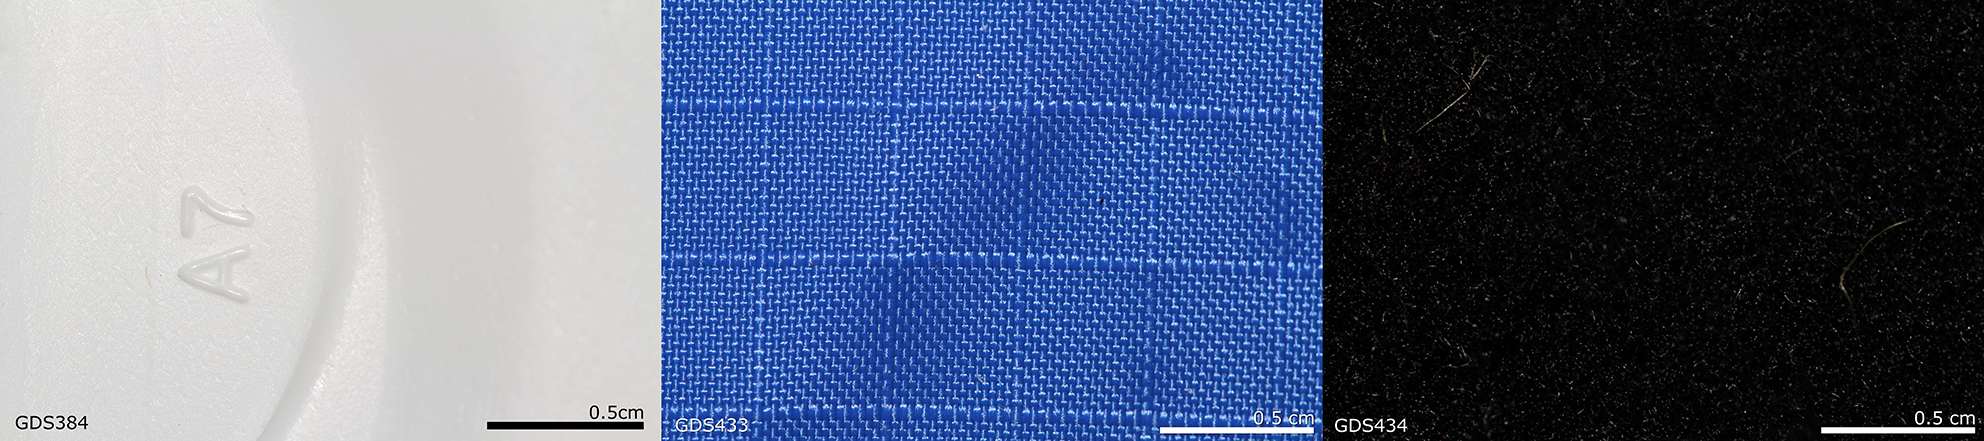
The design of the seats is another important issue for passenger comfort, especially in medium and long-haul flights. The passenger seat dimensions, and further details on the seating layout, are obtained via measurements on Weber Aircraft LLC, more recently known as Safran Passenger Innovations, aircraft seating. Then, the geometrically simplified CAD models are generated and implemented in the simulation environment. The photos of the actual seating and the technical drawings of the CAD software generated seat models are depicted in Figs. 5(a) and 5(b), respectively. Note that the local origin of the obtained seat model is depicted by the yellow point in Fig. 5(b).
III-B Sources, Receivers and Coating Materials
The implementation of in-flight connectivity (IFC) and/or in-flight entertainment (IFE) systems, which require the airframe or cabin interior to be redesigned, could introduce significant costs to the current global airline industry. On the contrary, in-flight LiFi offers the great advantage of using the existing cabin lighting structure, while only requiring very minor modifications. Accordingly, the practical implementation of on-board LiFi mainly includes the utilization of two types of sources; reading and wash lights. The reading lights could be utilized to provide broadband data to the seats via either the PSUs or directly to the passenger’s portable electronic devices (PEDs). Similarly, the wash lights could serve for low/mid data rate applications such as sensory, IoT, device-to-device (D2D) communications infrastructure etc. as well as on-board payment systems. Note that cabin illumination must be dimmed in the critical phases of flight, namely take-off and landing, for safety purposes. For overnight flights, dimming, or even turning the cabin lights off completely, should be considered for passenger comfort. More importantly, the nm band is reported to be the most suitable PHY layer common mode signal region for the LiFi applications by “IEEE 802.11bb Standardization Task Group on Light Communications”. In addition, the VL band spectra is remained as an optional PHY mode in IEEE 802.11bb standardization process [29]. Therefore, in this research, both the VL and IR bands will be used interchangeably in the DL direction to comply with the Federal Aviation Administration (FAA) dimming regulations as well as IEEE 802.11bb Light Communications standards. It is also important to note that the IR band is almost always preferential for the uplink transmission for the purpose of maintaining passenger eye safety and comfort. In the following, a realistic reading light design and associated surface material characterization will be detailed to address the raised safety and communication regulations.
III-B1 Reading Lights
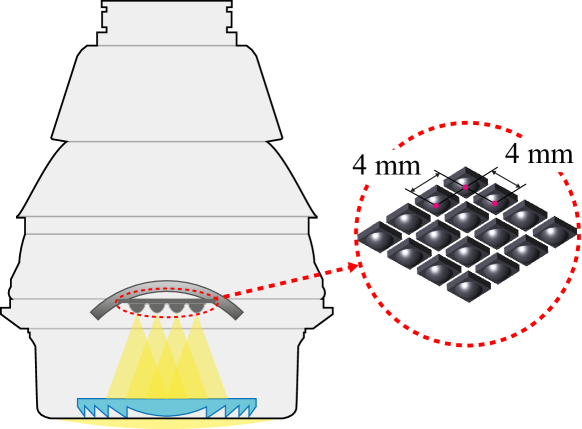
In the aircraft interior lighting market, there are two main reading light structures based on their beam profile; highly directional and dispersed [27]. Generally, to provide the best conditions for reading, highly directional lights, consisting of an LED array as a base, a concave mirror and a lens, which could be Fresnel or bi/double-convex, are preferred. Hence, effectively a collimated beam is created as depicted in Fig. 6, which is directed towards the vicinity of the tray table. On the other hand, dispersed light sources contain only the LED array base to achieve a wider spread for illumination purposes [30]. As mentioned in the previous chapter, the contribution of the NLoS paths are strictly required to design a robust communication system. Therefore, in this research, the optoelectronic characteristics of the dispersed reading lights will be investigated as potential sources for in-flight LiFi applications.
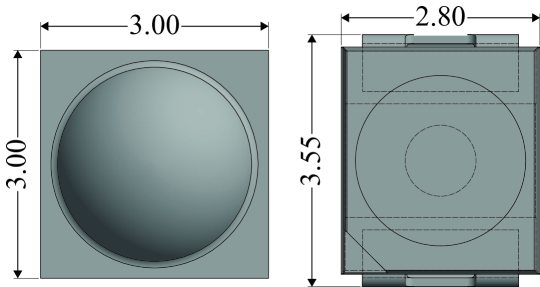
The non-imaging optical transmit front-end structure is adopted in our study to model the reading lights, each of which will serve as a LiFi AP in the given system design. Accordingly, a LED chip array is designed to form the base of the reading lights in the simulation environment which is given in Fig. 6. The origin point of the reading light element is chosen as the centre point of the LED. For simplicity in the optical calculations, each LED chip unit is assumed to be outputting W optical power that yields W power per reading light. In the designed array, off-the-shelf OSRAM GW QSSPA1.EM High Power White LED [31] and OSRAM SFH 4253 High Power IR LED [32] chip specifications are used to model the realistic VL and IR band emitters, respectively. The separation between each LED chip within the array is chosen as mm, refer to Fig. 6, for both sources based on their surface-mounted device (SMD) packagings. The technical drawings and the detailed dimensions of the SMD epoxy packaging for both sources are depicted in Fig. 7.
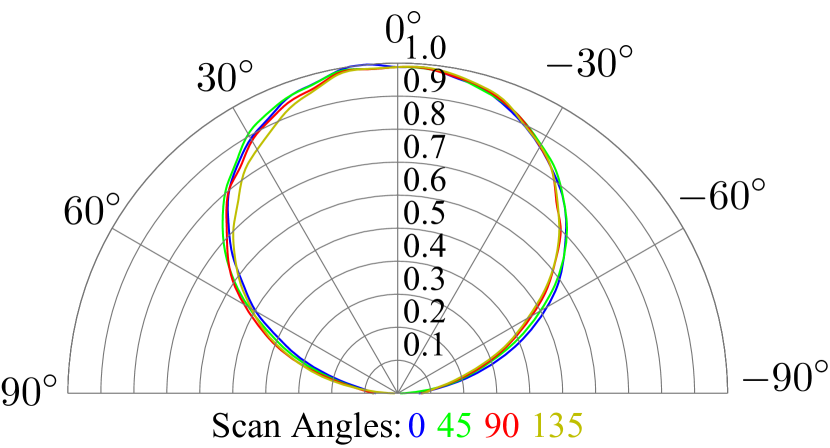
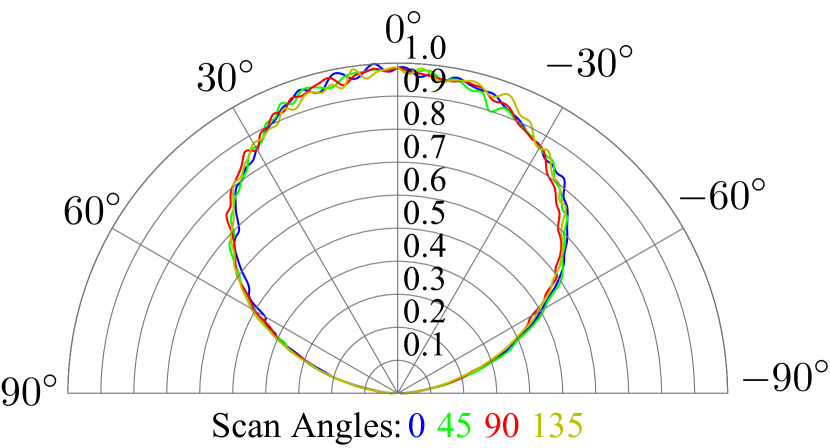
To create an accurate model of the non-imaging light structure; (i) spatial, (ii) angular and (iii) spectral characterization and respective parameters are needed. The realistic spatio-angular characteristics of the sources are ensured by the manufacturer provided ray files which have been inputted into the simulation environment. The ray files contain a large number of emitted ray recordings, up to 5 million, to project source characteristics without requiring complex internal parameters. The emission patterns of the chosen sources are given by the source directivity plots provided in Fig. 8. Accordingly, the angle axis shows the polar angle for a source located in the direction and the colours represent different azimuthal angle scans, , , and , for the spherical coordinate system. As can be seen from the figure, both sources have a Lambertian-like emission pattern with strong axial symmetry, which corresponds to full width at half maximum (FWHM) of , in other words, half power semi angle of . However, note that the ideal diffuse (Lambertian) emitter model assumes a point source, whereas our realistic modelling contains spatial information about the source emitting profiles.
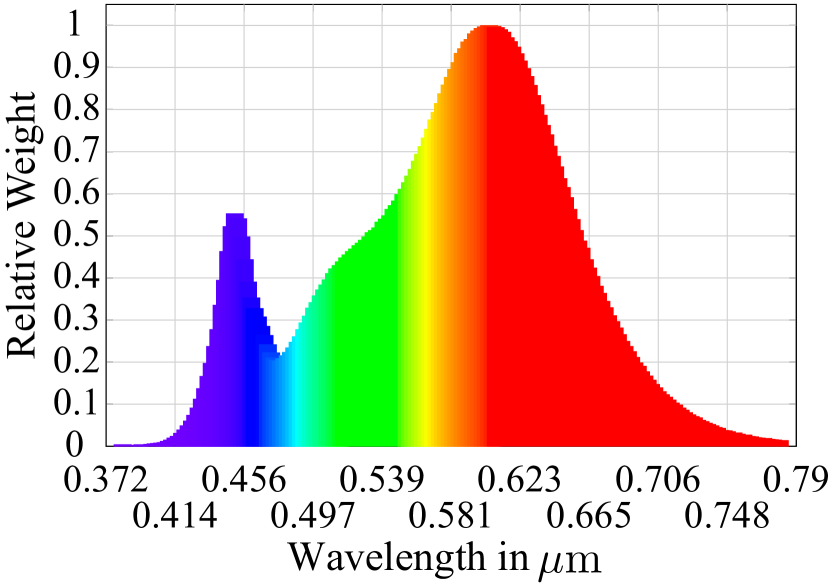
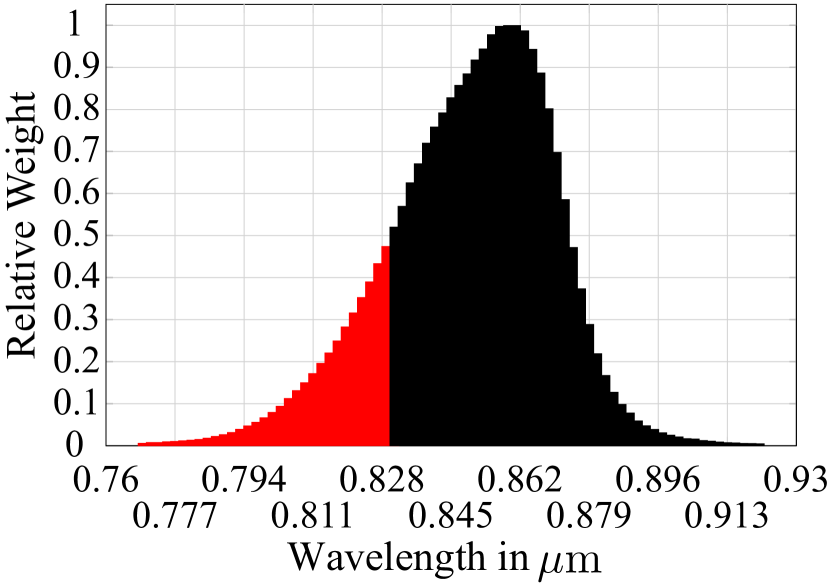
As our channel modelling technique operates in the granularity level of a “light ray”, non-monochromatic sources must be broken into discrete wavelengths to encounter refraction, reflection, diffraction and absorption effects. The radiometric spectral characteristics of the sources could be defined in the simulation environment by spectrum (SPCD) files. Accordingly, the SPCD file format in OpticStudio contains the relative spectral distribution coefficients with their corresponding wavelengths. The values in the spectral file will be used to determine the relative frequency of the rays with the associated spectra. Hence, a higher relative weight will increase the likelihood that the emergence of a ray with a given wavelength in MCRT. Since each ray carries a fraction of the total power of the source in MCRT, the higher weight would result in a larger optical power in the given wavelength, which is also the case in real life measurements. The relative radiometric colour spectrum plots for the adopted sources are provided in Fig. 9. As can be seen from figure, the relative spectral distribution function of the adopted white (visible band) LED, , against wavelength , consists of two local maximums; at the nm and nm, due to the blue base and yellow phosphor coating. The spectral characterization of the white source is defined by and measurement based data points for blue and yellow spectra, respectively. Furthermore, in our realistic model, the correlated colour temperature (CCT) of the white LEDs is chosen to be 3000 K. Similarly, the relative radiometric spectral distribution for the adopted IR source is given by Fig. 9(b). The relative spectral distribution function of the IR LED, , has a global maxima at the nm. The spectral characterization of the IR source is also ensured by the spectral data points, where the further resolution is obtained by spline interpolation if needed.
III-B2 Receivers
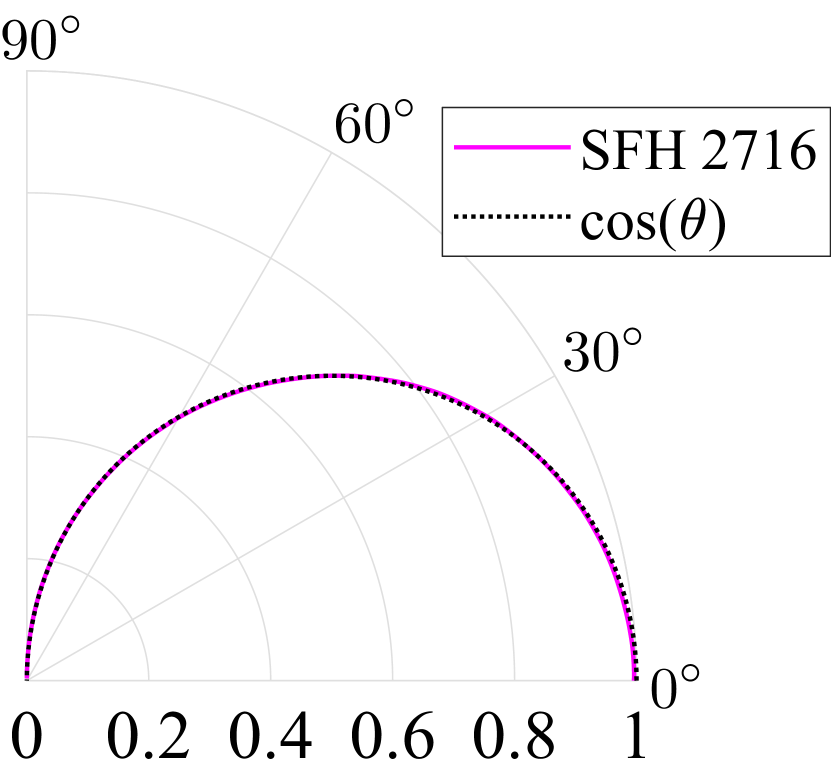
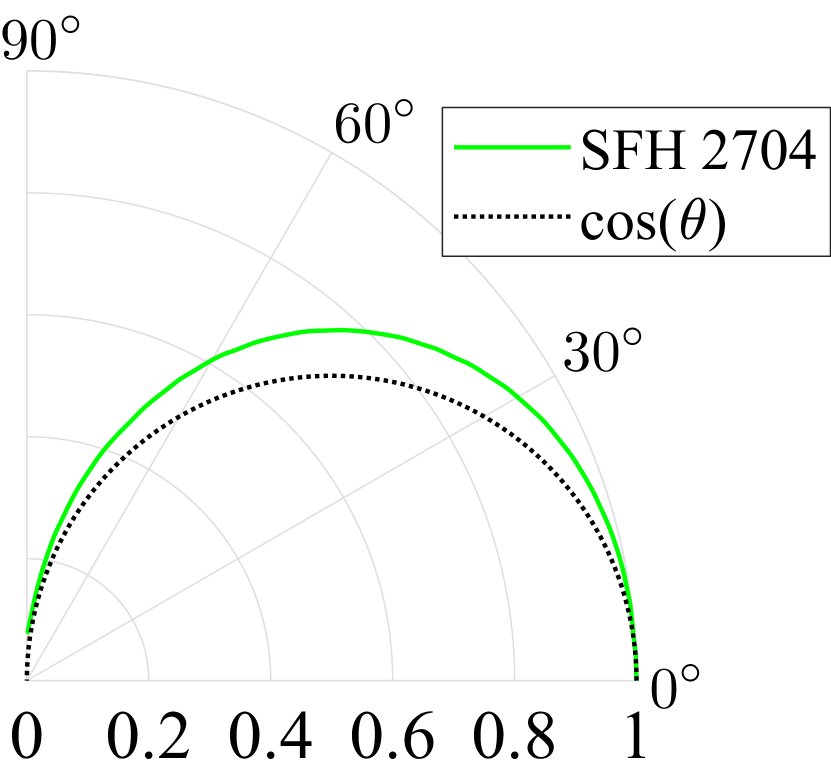
Our MCRT approach is capable of generating a complete optical channel analysis by taking the realistic receiver characteristics into consideration. Similar to the source modelling, spatial, angular and spectral specifications are also required for realistic detector design. As discussed in the previous subsection, the VL and IR band emission characteristics are adopted at the TX. Thus, the utilization of two detectors is also required in order to match the spectral responsivity characteristics between the photo-diodes (PDs) and their intended sources. In our simulations, two silicone PIN PDs; OSRAM SFH 2716 with the peak sensitivity at nm and OSRAM SFH 2704 with the peak sensitivity at nm are adopted as the VL and IR band detectors, respectively. Accordingly, rectangular shaped bare (without an optical filter) PDs with a active area are created in the simulation environment. The relative angular responsivity curves of the OSRAM SFH 2716 and OSRAM SFH 2704 are depicted in Figs. 10(a) and 10(b), respectively. In figures, the ideal cosine responsivity curve for a bare detector, in [6], is also given as the benchmark. It can be inferred from Figs. 10(a) and 10(b) that the angular responsivity of our adopted IR band detectors follow a slightly modified cosine profile. Note that the angular characteristics of both receive PDs are defined by measurement based samples. Without loss of generality, the spectral and angular detection profile of the PDs are assumed to be homogeneous w.r.t. the spatial domain. Finally, the obtained profiles are inputted to our simulation environment to model the spatio-angular characteristics of the detector elements.
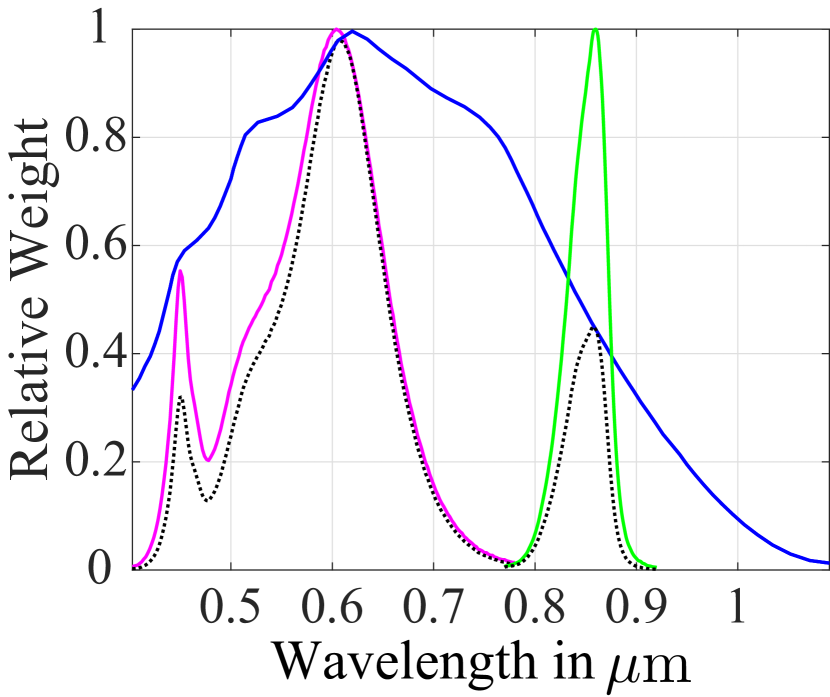
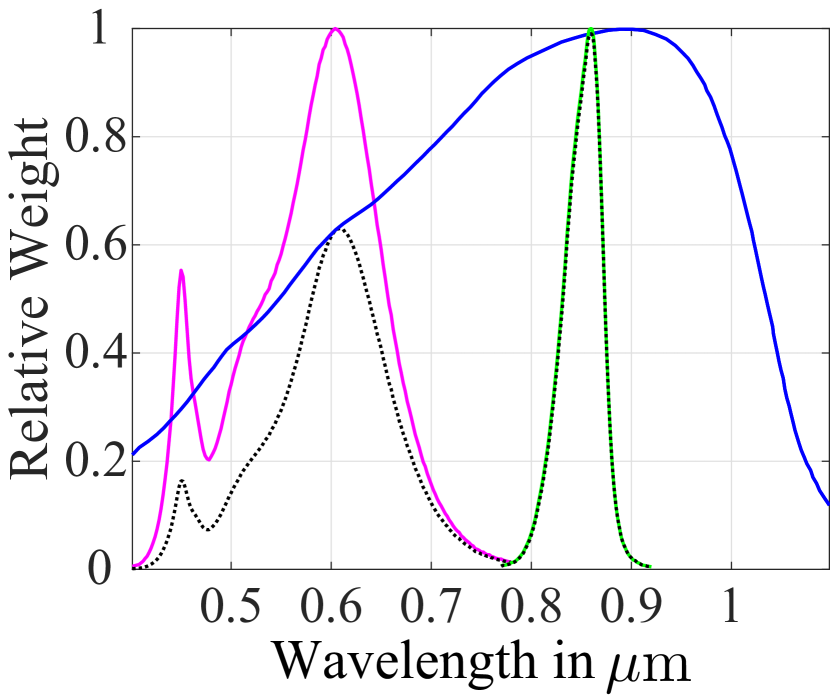
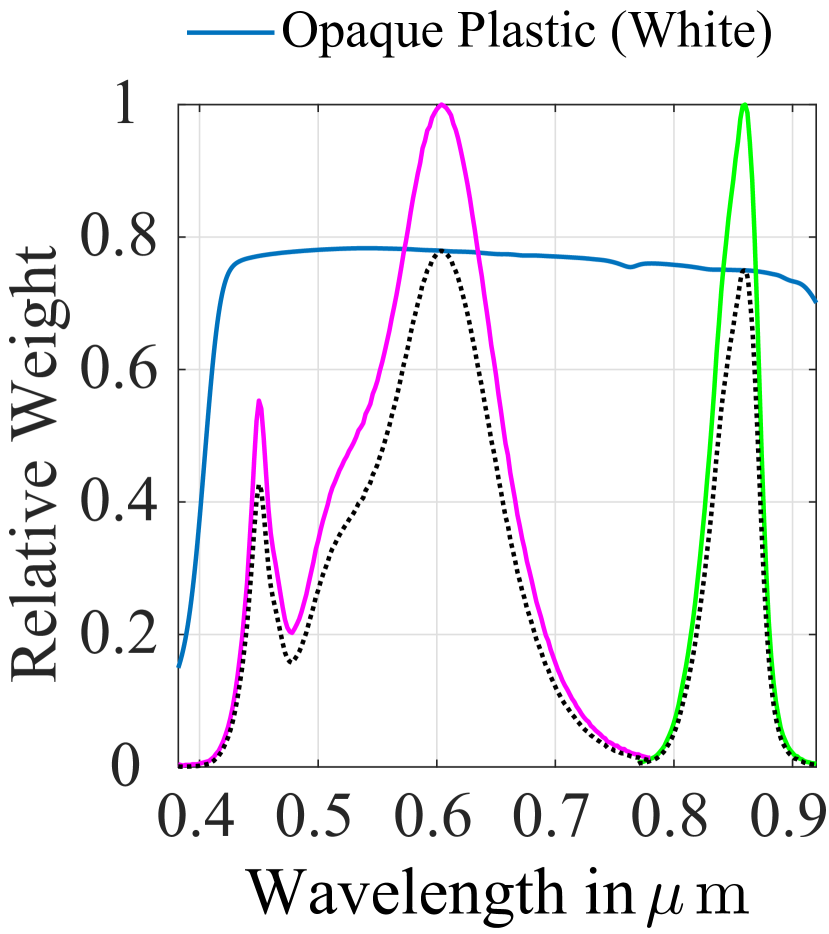
Similar to source spectra, the detector spectral characteristics are also fed into the simulation environment for the chosen detection devices. The relative spectral responsivity functions for OSRAM SFH 2716, , and OSRAM SFH 2704, , detectors, which are represented by and measured data points, are plotted in Figs. 11(a) and 11(b), respectively. The solid blue lines in Figs. 11(a) and 11(b) depict the respective detector characteristics. Moreover, magenta and green lines represent the OSRAM GW QSSPA1.EM and OSRAM SFH 4253 relative spectral distribution functions which are denoted by and , respectively. The overall spectral response of the VL and IR band detectors w.r.t. the VL and IR band sources are calculated by , and , , respectively and also plotted by the dotted black lines under the magenta and green curves. As can be seen from Figs. 11(a) and 11(b), each source requires its matching/tuned detector at the RX to harvest the highest collected power. Consequently, in our simulations VL, nm and nm, and IR, nm, band sources are matched with their corresponding detectors with the peak wavelengths of nm and nm, respectively.
III-B3 Coating Materials
The NLoS path contributions within dense and complex environments play an important role in the overall channel conditions. In the IFOWC literature, the majority of the research has been dedicated to the IR spectrum sources and their relative reflection characteristics. However, the spectral profiles between the VL and IR band source-detector pair differ significantly in practice, which is depicted in Fig. 11. Specifically, the reflectivity of the coating materials within the IR band become almost flat due to the inherent narrow-band characteristics of the IR sources, where the optical power is concentrated in the vicinity of a single wavelength. However, the optical power of the VL sources are spread across multiple wavelengths, generally blue and yellow or red, green and blue, which makes them wide-band sources. Hence, the effective optical properties of the interior surfaces w.r.t. the VL and IR bands must be modelled accurately.
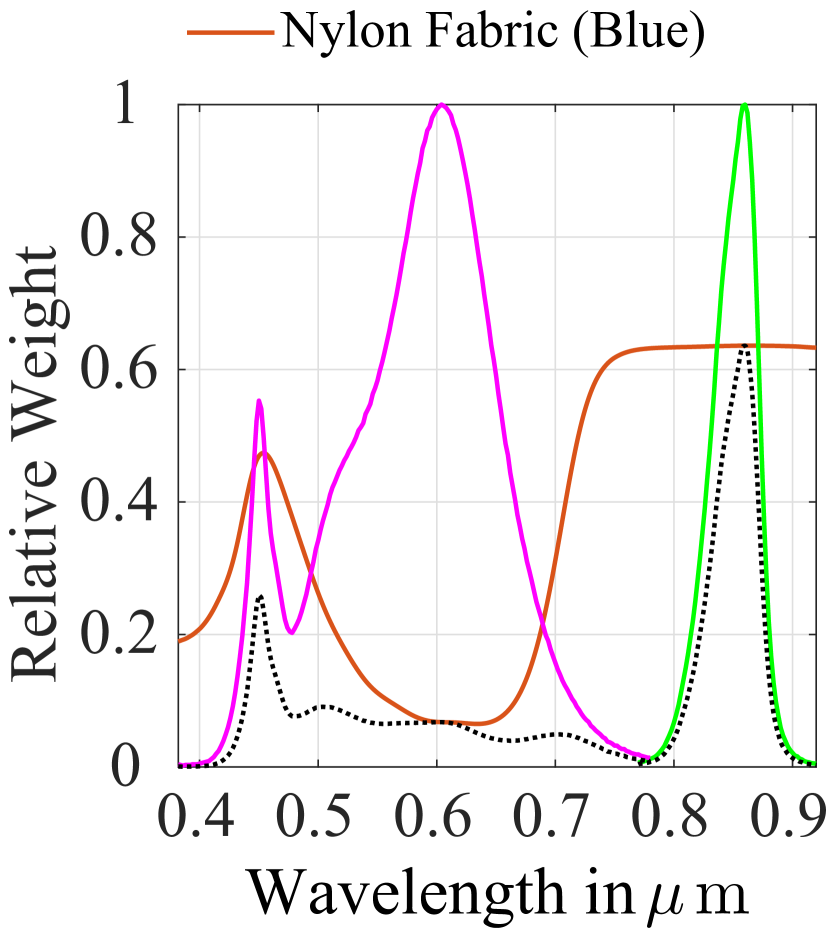
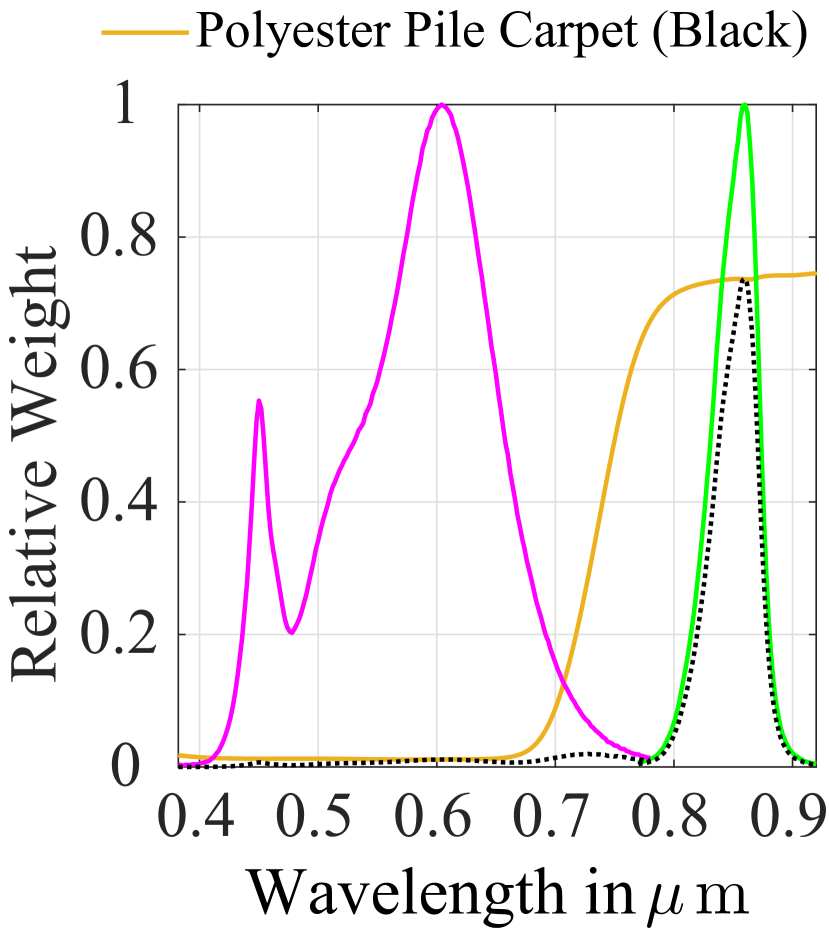
To capture the characteristics of realistic cabin interior coatings, the spectral reflectance measurement data is used in our simulations. Accordingly, the reflection and absorption characteristics of the aeronautical cabin interior coating profiles are obtained from the United States Geological Survey (USGS) High Resolution Spectral Library Version 7 [33]. The main surface coating for the cabin interior, including the side walls, ceiling and head luggage compartments, is typically chosen to be fiber reinforced plastic (FRP) in real world applications to meet the flammability requirements. In our simulations, the light coloured plastic, depicted in Fig. 12, is adopted to accurately imitate the characteristics of the main interior surfaces of the cabin. Thus, the white opaque plastic material and its optical properties are imported into the simulation environment. Note that the interior faces of both the realistic and simplified cabin models are assumed to be coated with the same material. Secondly, a blue coloured nylon ripstop fabric coating has been imported to model the real passenger seat dress covering, which is shown in Fig. 5(a). Lastly, the cabin flooring is chosen to be made out of black polyester pile carpet, to accurately model a real world commercial airline interior. The visual representations of the adopted coating materials and their spectral reflectivity characteristics are given in Figs. 12 and 13, respectively. In Fig. 13, the portion of the reflectivity spectrum that corresponds to the adopted source spectral distributions, and , are given for the chosen materials separately. Similar to the source spectral plots, the result of a multiplication between the source characterization and the coating material reflectivity functions is plotted by dotted black lines under the respective source curve. It can easily be inferred from Fig. 13 that the reflectivity characteristics of the white opaque plastic is almost flat for both VL and IR wavelength regions. Conversely, the reflectivity profiles of the blue ripstop nylon fabric and black polyester pile carpet are highly absorbent in the VL band as opposed to the IR band. Moreover, the effect of the coating materials on the overall response is also different from each other, as anticipated, since the source profiles are significantly contrasting. Note that the representation of coating characteristics by an average reflectance value, as vastly practised in the literature, would introduce a recursive error in the channel modelling. Explicitly, the error will be amplified in each reflection of a light ray during CIR calculations. In our simulations, the coating materials are represented by data points, for the m region to match the spectra of adopted VL and IR band sources.
IV MCRT Simulations for In-flight LiFi Channels
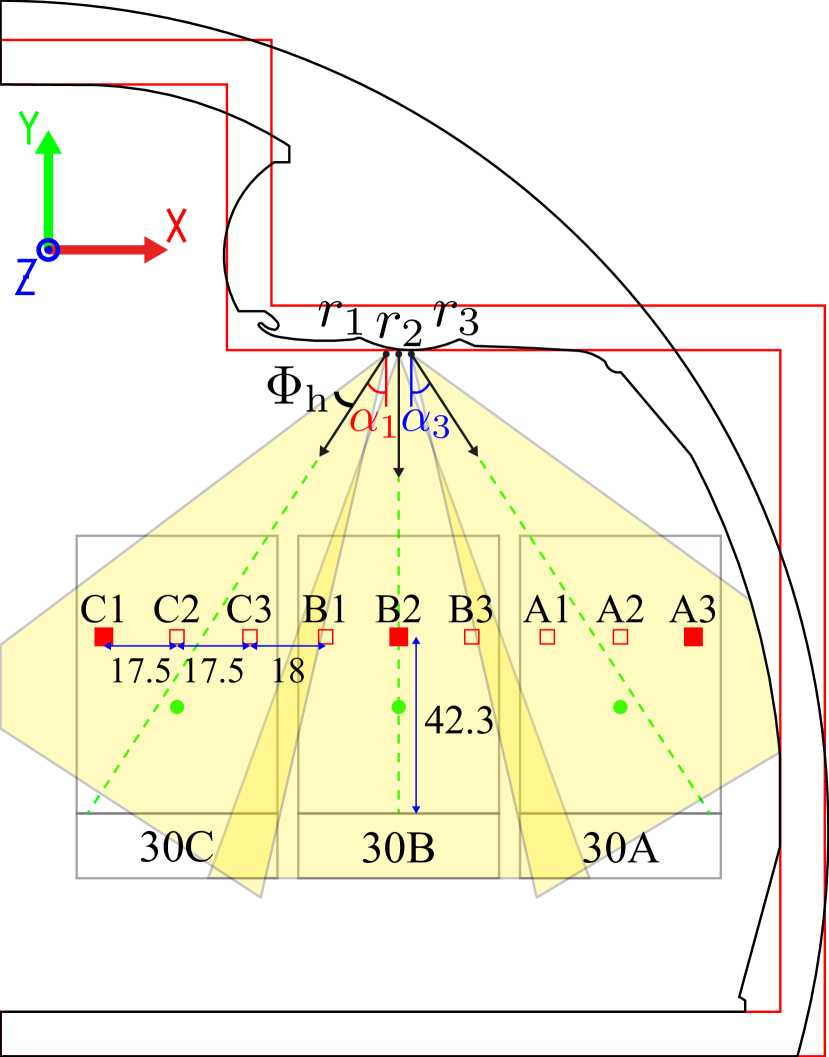
In this section, details of the MCRT based channel simulation methodology will be provided. Then, a comprehensive time and frequency domain analyses on the obtained optical channels and the inferred results will be presented for different wavelengths, cabin models and UE locations. The MCRT simulations will be conducted for a practical in-flight LiFi communications scenario, where the data bearing optical power is transferred from the reading lights to the PED. Accordingly, a three dimensional simulation environment with aircraft cabin, auxiliary interior elements, sources, receivers and coating material models, as detailed in the previous section, are utilized in MCRT simulations. The detailed illustration of the simulation environment and arrangement of the components is given in Fig. 14. As can be seen from Figs. 2 and 14, both cabin models are centred along the and -axes in simulations such that the simplified cabin represents the rough approximation of the complex geometric curvatures in the realistic model. Three reading lights, , and , are assumed to be mounted on the PSU with a cm between them in the -axis. To maximize the delivered optical power to their intended seats, the reading lamps are directed towards the centre of mass for the upper section of the seat, where the centre point is depicted as a green circle in Figs. 14(a) and 14(b). Depending on the manufacturer and cabin model type, the reading light adjustment could be an option. However, due to space limitations, only the fixed adjustment is simulated in this work without loss of generality. To deliver the maximum optical power within each individual seating area for the fixed case, the selection of initial -axis rotation values , and , which are introduced to the , and , respectively, can be given by
| (1) |
As can be seen from the expression above, the main objective of the reading lights is to provide sufficient illumination in the vicinity of the passenger tray table. To achieve that goal, we aim to deliver the maximum optical power to the centre point of an imaginary line which intersects the seats from top to bottom (refer to green circles in Fig. 14). For the sake of implementation simplicity, initial rotation angles of , and are adopted in our MCRT simulations by choosing the least integer angle greater than or equal to the given limits. The elevation of the receiver elements, depicted as red squares in Figs. 14(a) and 14(b), is chosen with the aid of human models to represent the average height of the hand-held PEDs. A total of three mobile terminal locations, C1, B2 and A3, are chosen to investigate the LoS and/or NLoS channel effects as well as cell centre and edge performances. Unlike the imaging ray tracing applications, where the generated rays hit each surface only once in a premeditated sequence, non-imaging NSRT is the main technique used in our simulations. The reason behind this is the illumination purposes of the reading lamps and unordered reflections from complex surface geometries with various reflectivity profiles. Also, the interior surfaces are designed to introduce spectrally dependent reflectivity and scattering if a ray strikes a surface. In every bounce of the light ray, the specular components of the reflections receive zero energy, which means the total energy is set to be equally divided among scattered rays. Thus, the number of total rays must be traced after order reflection becomes, . In the last iteration, the maximum number of rays that are traced by the simulator is calculated by, . In our simulations, is chosen to accurately represent purely diffuse reflections in a computationally efficient manner. Another important MCRT parameter is the “minimum relative ray intensity”, which decides when to terminate the iteration of tracing a particular ray. Thus, it terminates a trace when the ray intensity is below or equal to a fraction of the initial intensity. In our simulations, the “minimum relative ray intensity” is chosen as and for IR and VL spectra simulations, respectively. Note that the overall reflectivity of the coating materials in the VL band is significantly lower compared to the IR, thus, a lower minimum relative ray intensity value must be chosen to capture the details of the VL channel. Therefore, the maximum number of reflections captured by our MCRT simulations, , becomes and for IR and VL bands, respectively. Lastly, the number of rays generated per LED chip is chosen to be million in our simulations, which yields to a total of million rays per reading light in IR band simulations. Since the generation of white light requires yellow and blue components, where each of which are chosen to be represented by million rays. Hence, the total of million rays are generated per white LED based reading light.
IV-A Optical Channel Characterization
The multiple-bounce (multipath) CIR between the source and the receiver could be expressed by our MCRT simulation results as follows:
| (2) |
where , and denote the received incoherent irradiance, total number of rays that hit the receiver and the elapsed time for ray to reach the receiver, respectively. It is important to note that all the incoming rays that strike the detector surface with different irradiance values and time delays. In order to reduce the individual rays related observation errors and to obtain meaningful information from the ray scatter, data binning/clustering on is applied, which yields the discrete-time optical (physical) CIR as follows:
| (3) |
Accordingly, the number of bins is given by
| (4) |
where the time of arrival for the first and last rays are denoted by and , respectively. In addition, is width of the bins. Hence, the bin edge for the bin could also be given by . Moreover, the cumulated irradiance value within the given bin interval is calculated by , where , if and , otherwise. After obtaining the discrete-time CIR, the important parameters for channel characterization could be devised. The optical CFR is described in terms of the CIR obtained in (3) as follows:
| (5) |
where the sampling frequency could be calculated as . Hence, the frequency axis of the discrete Fourier transform (DFT), becomes . The number of subcarriers in the DFT operation could also be found by . It is also important to note from the above expressions that the temporal domain accuracy is directly related to the bin width, , where the resulting discrete-time CIR closely approximates the actual channel when the bin width approaches zero, . Another important parameter, the DC channel gain or total optical power of the impulse response can also be calculated by using (5),
| (6) |
By using the above expression, the average transmitted and received optical powers could be linked by using the DC channel gain as follows: , which yields the path loss of
| (7) |
The RMS delay spread and mean delay are two important measures to define the multipath richness of the channel, which also shows the impact of inter-symbol interference (ISI) on the system performance. Hence, the RMS delay spread could be calculated by using the second and zeroth moments of as follows:
| (8) |
where the mean delay is given in terms of the zeroth and first raw moments of by
| (9) |
Lastly, the dominance of the LoS link is also an important factor to evaluate the contribution of LoS and NLoS paths, which indicates how flat the channel is. Accordingly, the “flatness factor” is calculated as the ratio between LoS and NLoS channel powers as follows:
| (10) |
| Cabin Models |
|
|||||||||
|---|---|---|---|---|---|---|---|---|---|---|
| Cabin Model Positions (cm) |
|
|||||||||
| Seat Model Positions (cm) |
|
|||||||||
| Reading Light Positions (cm) |
|
|||||||||
| Reading Light -axis Orientations |
|
|||||||||
| Number of Chips per Reading Light | () | |||||||||
|
|
|||||||||
| Power per Reading Light () | W | |||||||||
| Model of the LED Chips |
|
|||||||||
| FWHM of the LED Chips | ||||||||||
| PD Positions (cm) |
|
|||||||||
| Model of the PDs |
|
|||||||||
| Effective Area of the PDs | ||||||||||
| FWHM of the PDs |
|
|||||||||
| Coating Materials |
|
|||||||||
| Time Resolution/ Bin Width () | ns |
IV-B MCRT Simulation Results
In this subsection, the proposed MCRT simulation results will be presented for both IR and VL spectra. The complete set of parameters used in these simulations are provided in Table I.
IV-B1 IR Band Results
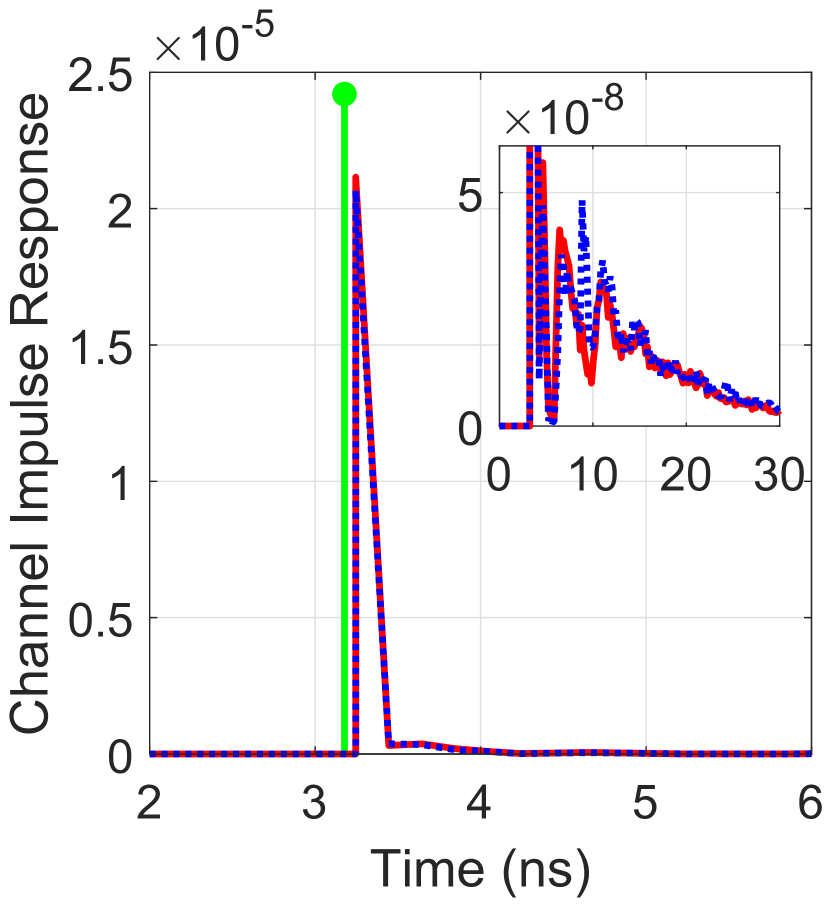
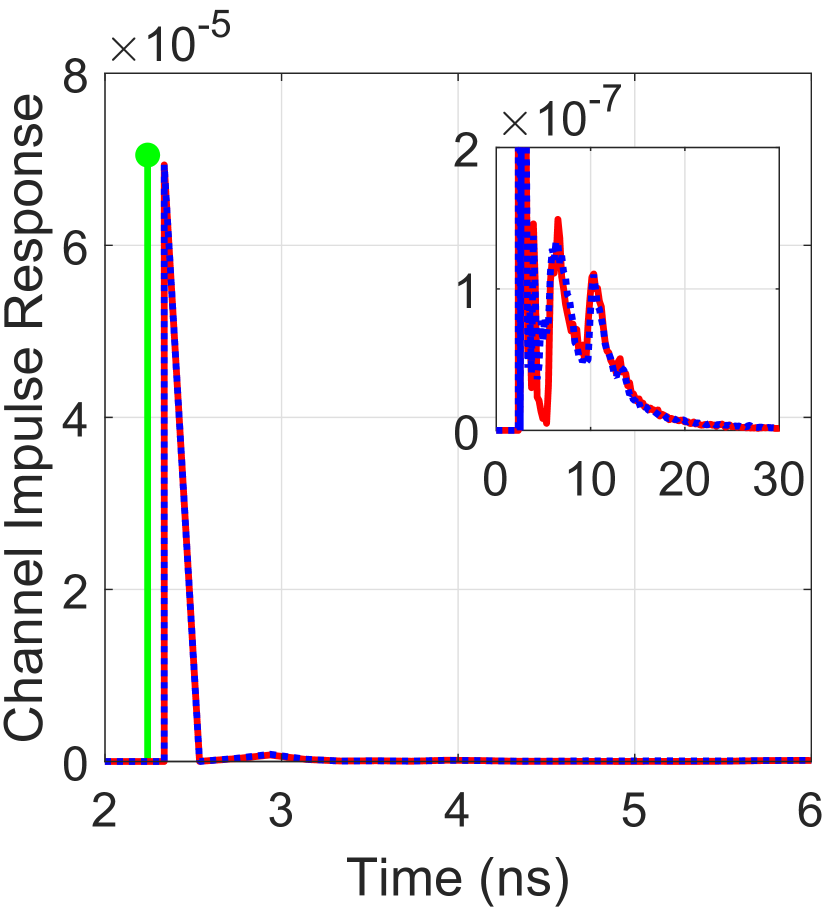
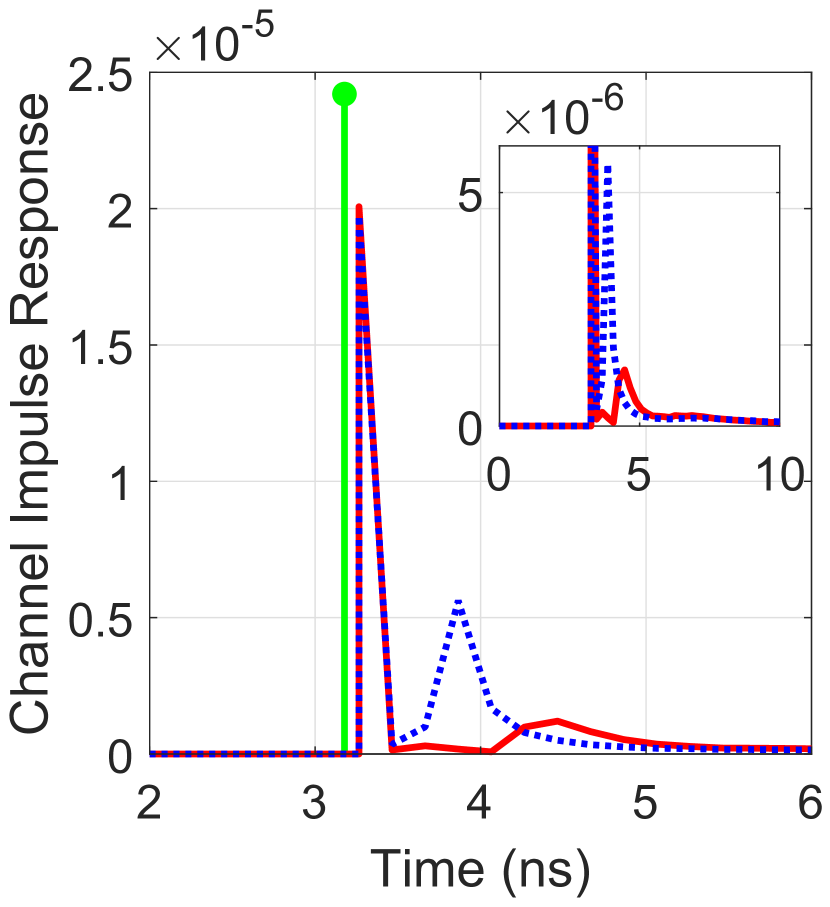
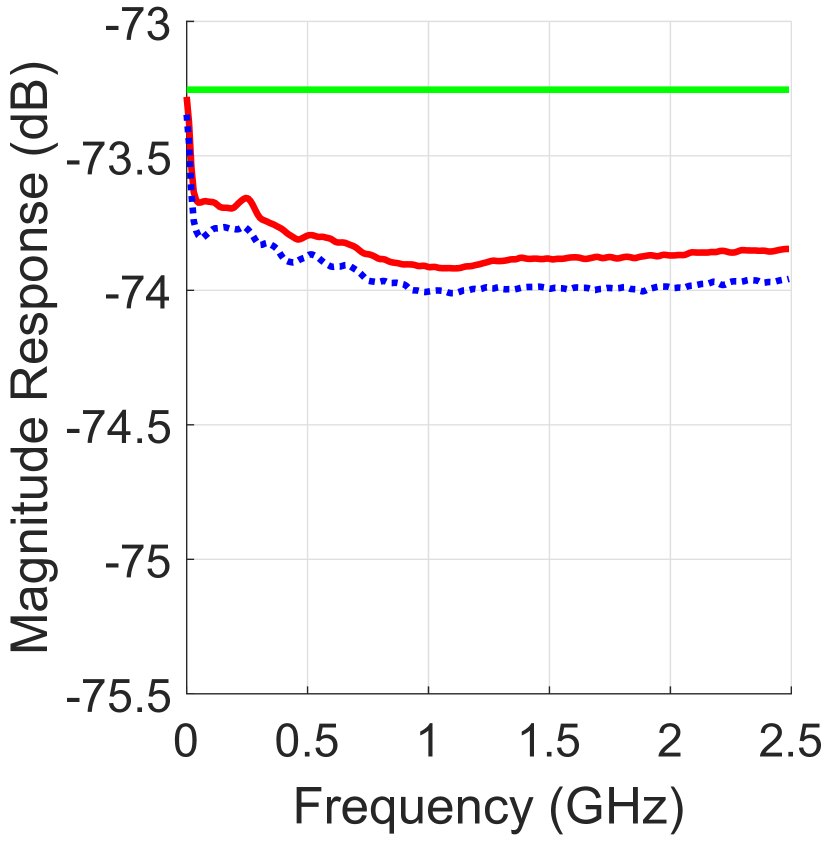
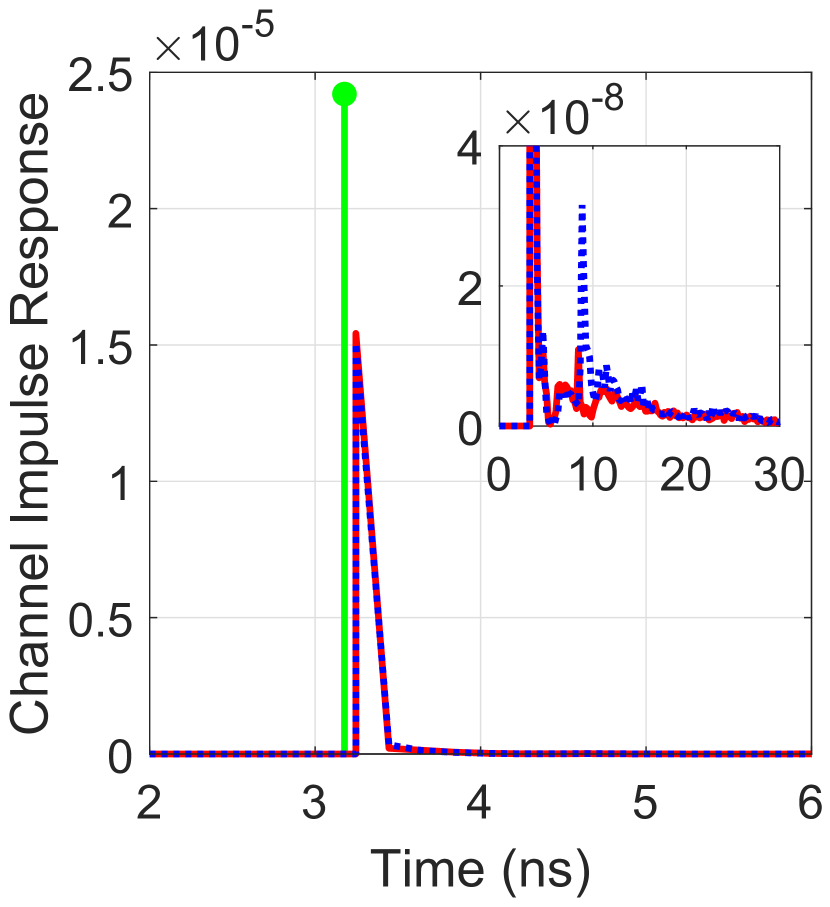
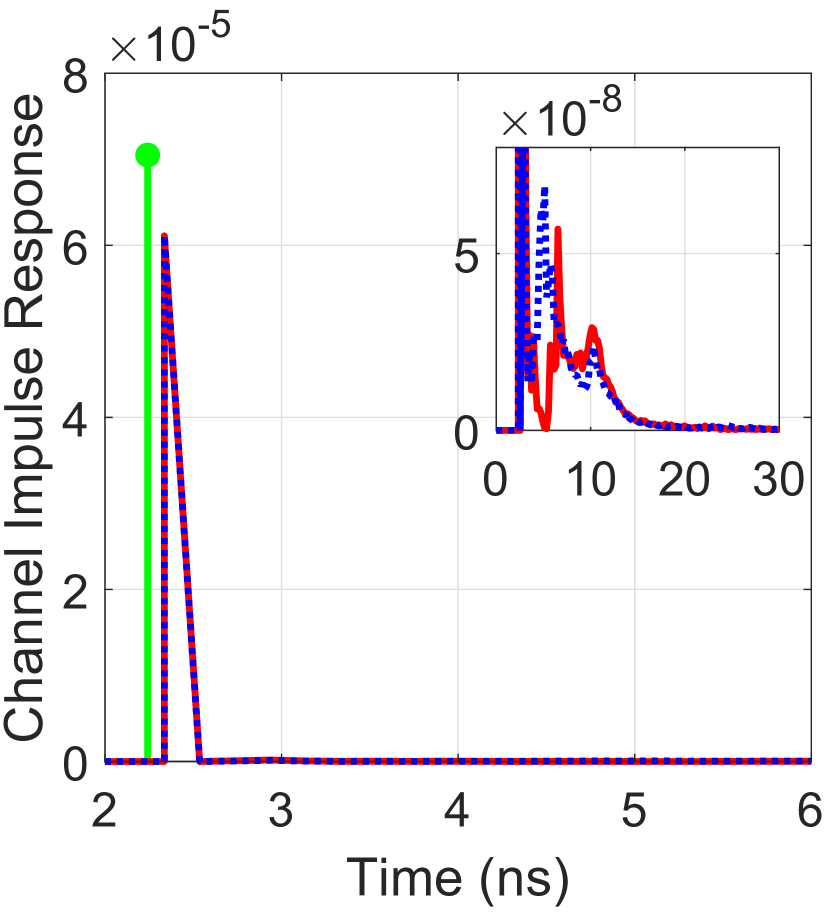
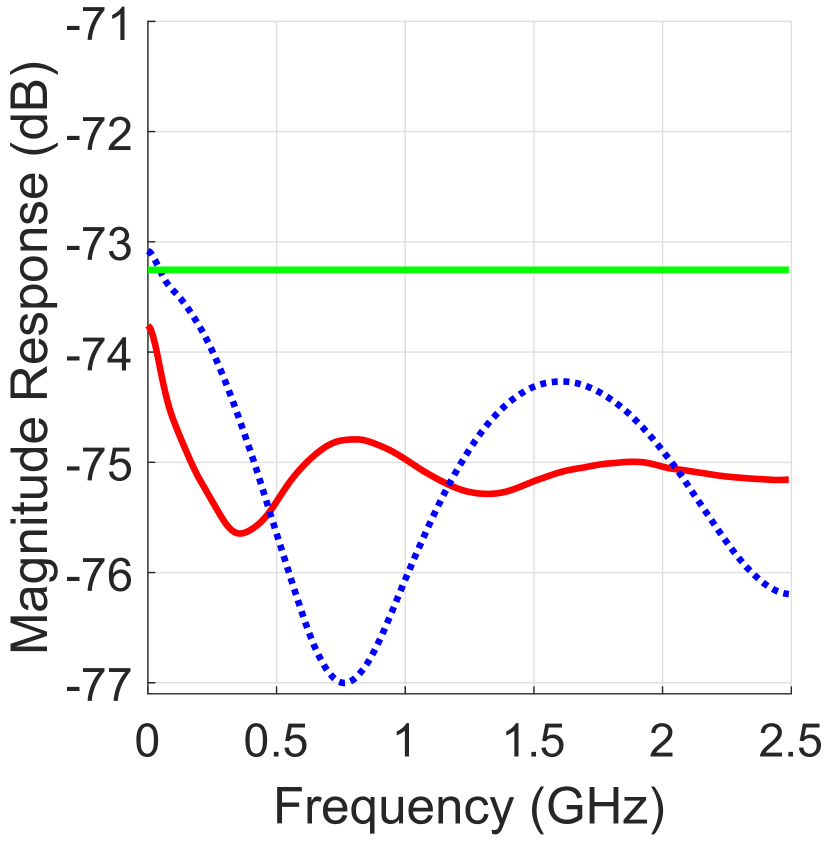
The IR band CIR and CFR plots for both realistic and simplified cabin models including the passenger seating are given in Fig. 15. The rows in subplot matrix represent the domain of the plot e.g., time or frequency, where the columns are the three measurement points for seats A, B and C. Moreover, the channel characterization parameters are also obtained and presented in Table II in conjunction with the figures, where the number of rays that hit each PDs is given by . The time and frequency domain simulation results for the adopted cabin models are presented and compared with LoS analytical model in Figs. 15(a)-(f). Accordingly, up to -bounce, , CIR simulation results, , and , are presented for adopted UE locations C1, B2 and A3, respectively. Moreover, the frequency response plots are obtained for fast Fourier transform (FFT) size of for the channel bandwidth of GHz. Note that the Figs. 15(d)-(f) are only presented for the frequency range of , since the frequency response of the LiFi data signals are conjugate symmetric due to the IM/DD technique.
 ) and seated realistic cabin model (
 ). The analytical LoS channel (
 ) is presented as a benchmark.
| Simplified Cabin (IR Band) | Realistic Cabin (IR Band) | |||||||
|---|---|---|---|---|---|---|---|---|
| (ns) | (W) | (ns) | ||||||
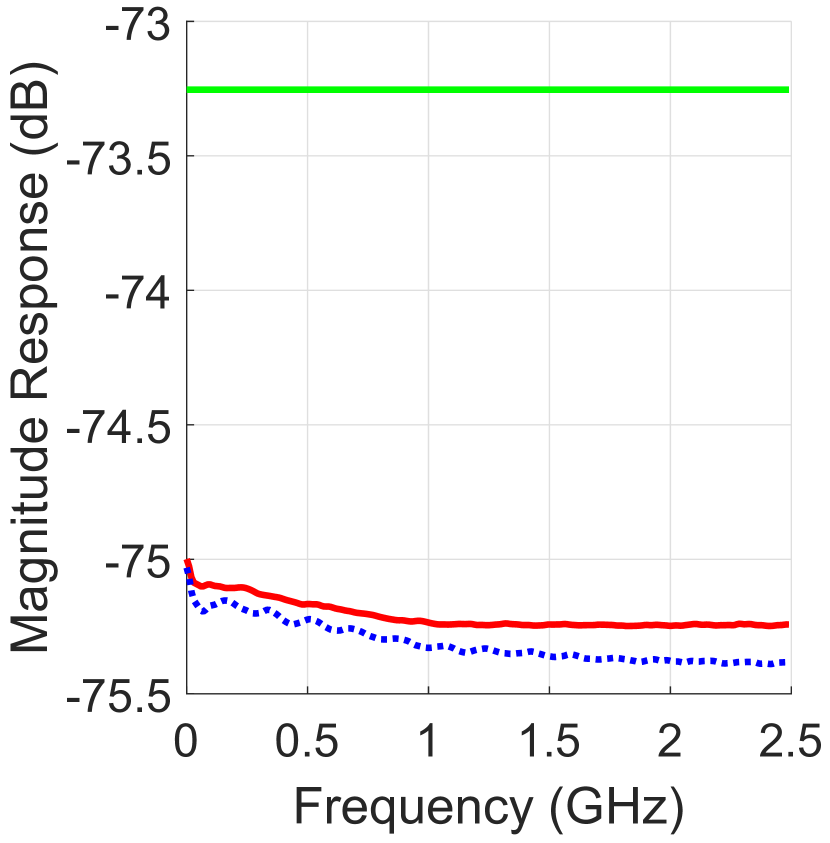
In Figs. 15(a) and (d), the MCRT based CIR and CFR results are given for both cabin models along with the LoS analytical model as a benchmark. For the UE location C1, the magnitude of only the LoS component obtained by the MCRT simulations for simplified and realistic cabins become approximately and , respectively. In comparison with the LoS analytical channel model, simplified and realistic cabin models based simulation results yield and less LoS magnitude, respectively. The reason for this is the angular and spectral characteristics of both the optical front-end and interior coating in simulations, which are omitted in the analytical model. Specifically, the angle of emergence and incidence values are significantly larger for points C1 and A3 compared to B2. Note that a small time difference, around ns, between the analytical LoS model and the simulations occurs due to the simulated real world imperfections in the MCRT. Furthermore, the effect of higher order reflections, , to the channel characteristics could also be assessed by using the flatness factor. Hence, the for simplified and realistic cabins based simulation results becomes and , which is and less compared to the LoS analytical model, respectively. Therefore, it can be inferred that both the analytical model and simplified cabin are able to capture the details of the channel when the NLoS components are not as significant. This is also confirmed by the frequency response plot in Fig. 15(d), where the mean magnitude response difference of and dB is observed between the simplified and realistic cabin simulations with the LoS analytical model, respectively. Also, the peak-to-peak magnitude response difference for simplified and realistic cabin simulations is given by and dB, respectively. It can be inferred both from both the time and frequency domain results that the effect of higher order reflections are quite minor in seat C due to the large physical distance from the reflector surfaces e.g., side wall, which yields a LoS dominated link characteristics.
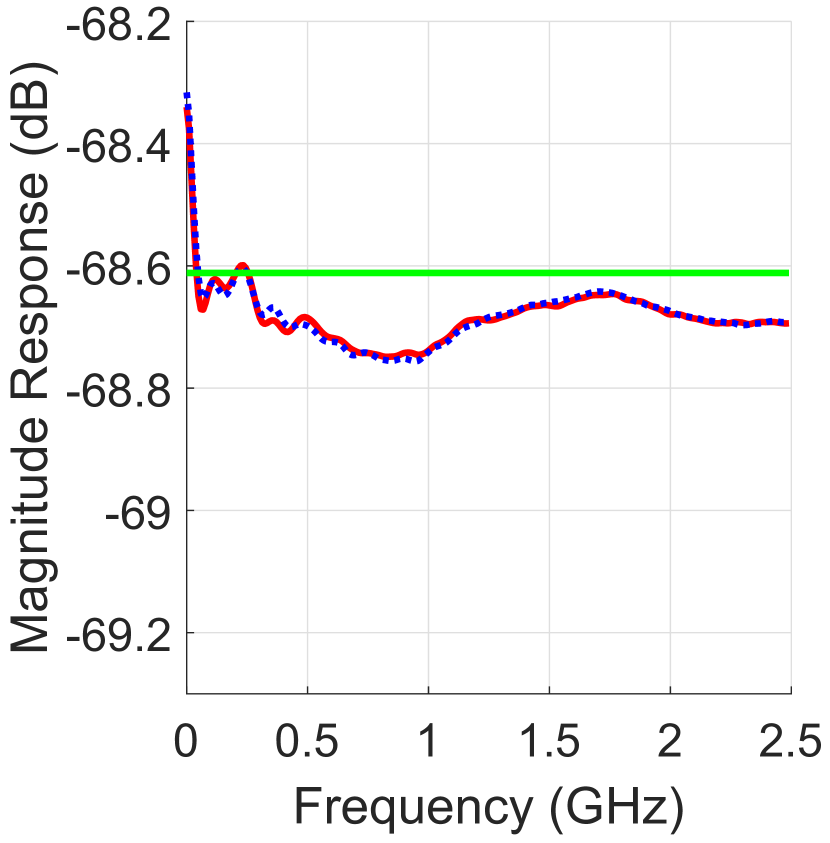
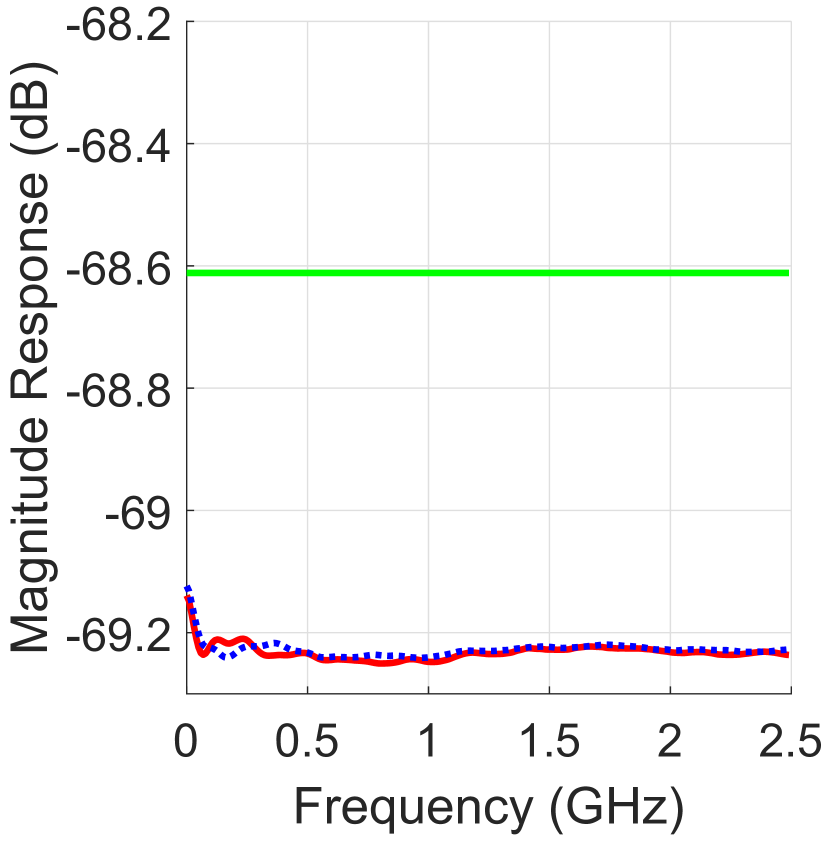
In Figs. 15(b) and (e), the MCRT based CIR and CFR results are obtained for the UE location B2, respectively. Accordingly, LoS components of the simulation results becomes approximately for both cabin models. This means that the LoS component for the simulation results are less for both cabin models compared to the LoS analytical model. However, the DC channel gain of simplified and realistic cabin models increased by and , respectively, compared to the UE location C1. The main reason behind this significant increase is the decreased source-receiver distance, where it becomes the minimum for the TX-RX pair of among all UE locations. Another important set of factors to note is the spectral dependencies of the optical front-end and coating as well as the angles of emergence and incidence. However, compared to C1, where the effect of an imperfect angular response is significant, both the emergence and incidence angles are almost zero in B2. Thus, we can conclude that the magnitude difference between the LoS component of the simulation results and the analytical model is mainly caused by the spectral dependencies. Moreover, the increase in the flatness factor from C1 to B2 is also significant. Accordingly, the flatness factor increases by and for simplified and realistic cabin models, respectively. Although the optical power that comes from the side-wall reflections is increased in B2 compared to C1, the dominant LoS component makes the NLoS contributions negligible. Also, we can observe that the mean magnitude response of the simplified and realistic cabin simulations become approximately dB less than the analytical LoS channel model. The peak-to-peak magnitude response difference for simplified and realistic cabin simulations is given by and dB, respectively. Therefore, we can conclude that the received optical power for the simulation point B2 is going to be the highest among all the other points due to the minimum source-receiver separation, which effectively means a higher communications capacity. In addition, the frequency flat/LoS channel assumption for seat B is also accurate due to the weak NLoS contribution.
 ) and seated realistic cabin model (
 ). The analytical LoS channel (
 ) is presented as a benchmark.
| Simplified Cabin (VL Band) | Realistic Cabin (VL Band) | |||||||
|---|---|---|---|---|---|---|---|---|
| (ns) | (W) | (ns) | ||||||
In Figs. 15(c) and (f), the simulation results are obtained by using both the simplified and realistic cabin models and compared with the benchmark for point A3. Similar to C1 results, the LoS component magnitudes for the simplified and realistic cabin simulations become and , respectively. This means that the simplified and realistic LoS simulation components are and lower compared to the analytical model. This biggest difference among all points also stems from the combination of imperfect angular and spectral profiles of the elements. Furthermore, it can clearly be seen that the secondary reflection for both simplified and realistic CIR emerged after ns. Note that compared to point B2, the RMS delay spread has increased by and for simplified and realistic cabin simulations, respectively. Similarly, the flatness factor in point A3 becomes approximately and for simplified and realistic cabin simulation results, respectively. From Fig. 15(f), the mean magnitude response for both the simplified and realistic cabin simulations becomes and dB less than the LoS analytical model, respectively. Furthermore, the peak-to-peak magnitude response difference for simplified and realistic cabin simulation results become and dB, respectively. More importantly, the dB cut-off frequency for the IR band LiFi optical channel in realistic cabin becomes MHz. Consequently, it can be said that the location of the UE impacts two of the most important parameters of the communication channel; (i) received signal power and, (ii) the effective bandwidth in such complex environments.
IV-B2 VL Band Results
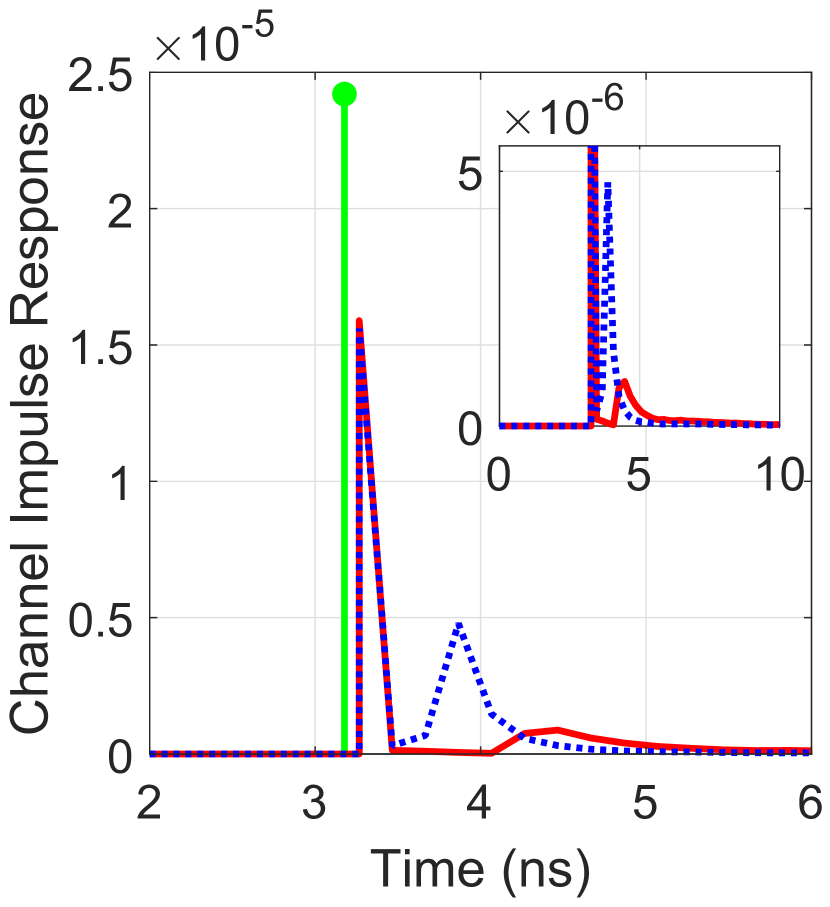
The time and frequency domain analysis of the in-flight LiFi channel for the VL band source and receiver pair are given for the adopted cabin models and UE locations in Figs. 16(a)-(f). Unlike the IR band results, the VL band LiFi channels are simulated up to -bounces, , and the detailed parameters are presented in Table III. The higher order reflections compared to the IR band simulations were required as the absorption rate of the coating materials are higher in the VL spectra. It is also important to note that the LoS analytical channel expression, given in [6], is independent of the operation wavelength, which will be granting a convenient direct comparison between IR and VL band results.
The CIR and CFR comparisons for the UE location C1 are depicted in Figs. 16(a) and (d), respectively. As can be seen from figures, the LoS channel components of and are obtained by simplified and realistic cabin simulations, respectively. Thus, these numbers yield and smaller LoS component for simplified and realistic cabin simulations compared to analytical model, respectively. The underlying reason for this difference is also realistic spectral and angular characteristics which are taken into consideration in our simulations. Even though point C1 is furthest from the side wall, the NLoS components still comprises approximately and of the total received optical power for simplified and realistic cabin simulations, respectively. In the frequency domain, the mean value of the magnitude responses for both the simplified and realistic cabin simulations become and dB smaller compared to analytical benchmark, respectively. Moreover, the peak-to-peak magnitude response difference of and dB are obtained by simplified and realistic simulation results, respectively. Therefore, we can infer from the obtained results that, due to the higher optical imperfections presented in VL band simulations, the received signal power differs from the analytical expectation more than that of the IR band results.
In Figs. 16(b) and (e), both the impulse and frequency response results and comparisons are given for both cabin models along with the LoS analytical expression for the UE location of B2. Accordingly, the simplified and realistic simulation results yield a LoS component of and , respectively. Hence, the presented values yield a and smaller LoS component in comparison with the benchmark, respectively. As can be seen from Table III, the NLoS contribution to total received optical power is and for simplified and realistic cabin simulation results, respectively. The mean magnitude response difference between simulations against the benchmark becomes dB for both cabin models. Furthermore, the peak-to-peak magnitude response difference for simplified and realistic cabin simulations is given by and dB, respectively. Again, the UE location in seat B yields the highest achievable received optical signal power compared to other two seats.
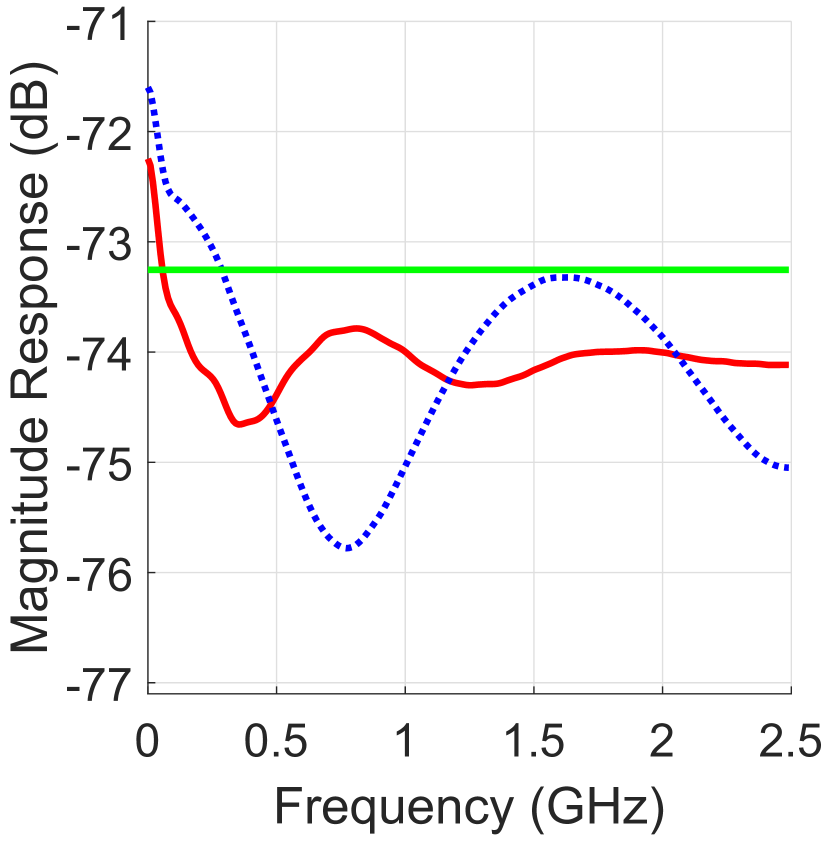
Lastly, in Figs. 16(c) and (f), both the time and frequency domain results and comparisons are given for both cabin models when the UE is located in point A3. The LoS components obtained by simplified and realistic cabin simulations is given by and , respectively. Thus, the simplified and realistic cabin simulation results yield and lower LoS component compared to the benchmark, respectively. It is important to note that the contribution of the spectral characteristics of the source, receiver and coating is higher in the VL band as the detector introduces an almost ideal cosine profile. It has been shown by narrow-band IR results that the realistic source and receivers do not match closely with the flat spectral profile. Therefore, the VL band sources, whose power is spread over a wider spectral range, present a greater mismatch. In terms of RMS delay spread, the simplified and realistic simulations yield and increase for the simulation point A3 compared to B2, respectively. Also, the portion of the NLoS channel contribution became almost and in the simplified and realistic cabin applications, respectively. In the frequency domain, the difference of the mean magnitude response between the simplified and realistic simulations with the benchmark becomes and dB, respectively. Also, the peak-to-peak magnitude response values for simplified and realistic simulation results also given by and dB, respectively. Note that the dB cut-off frequency for the VL band LiFi optical channel in realistic cabin becomes MHz.
V Performance of DCO-OFDM Under The Channel Impairments
In this section, the performance of the practical in-flight LiFi systems are evaluated by employing a widely adopted multi-carrier optical transmission technique, DCO-OFDM [34]. Accordingly, the BER performance of DCO-OFDM is investigated under both optical domain multipath propagation and LED non-linearity based clipping.
As a first step in DCO-OFDM, the binary user data vector, which contains the information to be transmitted, is parsed into elements. The parameter denotes the order of the quadrature amplitude modulation (QAM) modulation. Then, each element is one-to-one mapped into a complex valued -QAM symbol, , where . Please note that in order to obtain a real valued signal after the inverse FFT (IFFT) operation, Hermitian symmetry must be imposed on the frequency domain symbols, , where . Hence, only subcarriers carry useful information in DCO-OFDM. For , the time domain signal after the IFFT, will follow independent identically distributed (i.i.d.) Gaussian distribution, according to the central limit theorem. Since, we have adopted the standard definitions of the IFFT/FFT pair at the TX and RX, respectively, .
The main transmission technique in LiFi systems is referred to as IM/DD, where the information is carried via the instantaneous light intensity. Thus, a DC bias, , must be introduced prior to transmission as the light intensity cannot take a negative value. Furthermore, double-sided clipping is also needed to make the transmit signal compliant with the dynamic range of the LEDs. Hence, the resultant truncated Gaussian distributed time-domain signal could be expressed by
| (14) |
where and . The parameter denotes the bias proportionality factor, which adjusts the amount of bias in terms of the standard deviation of the unbiased and unclipped . After the DC bias addition, the time domain shifted signal follows the distribution . In literature, the DC bias in decibels is also defined by . To simulate the realistic transmit LED front-end electrical properties of the adopted VL (OSRAM GW QSSPA1.EM) and IR (OSRAM SFH 4253) band sources, the forward current value is constrained to be within the mA range [31, 32]. Moreover, in order to locate the time domain signal at the middle of the dynamic range and minimize the non-linear clipping effect of the LEDs, mA ( dB) is adopted in our simulations.
It is important to note that the non-linear and memoryless LED clipping effect could be represented as a linear process with a deterministic attenuation factor, , and a random time domain additive clipping noise, , by Bussgang’s theorem as follows [35, 36]:
| (15) |
where . The optical power of the biased and double sided clipped signal could be calculated by
| (16) |
If we subtract from both sides of (15),
| (17) |
where , and are all zero-mean random variables. Thus, the value of could be deduced from the above expressions by
| (18) |
As can be seen from the above expression, the attenuation factor could simply be represented as the area under the unclipped portion of the biased time domain signal . It is important to note that any DC bias introduced at the TX and/or RX won’t effect the frequency domain symbols since it will fall on to the unused subcarrier. Therefore, the electrical power of the time-domain clipping noise could be represented by
| (19) |
where the electrical power of the biased and double-sided clipped signal could be expressed as follows:
| (20) |
At the receiver, the multipath optical wireless channel distorted signal is received by a PD. Furthermore, the additive white Gaussian noise (AWGN) also plays a role in the electrical domain signal, , obtained after the cyclic prefix (CP) removal. Note that the effective noise term at the RX, , consists of the addition of shot and thermal noises, where the shot noise emerges as a result of ambient light sources and information bearing signal itself. In the case where high ambient light power at the PD is significantly larger than the transmit signal power, the shot noise becomes signal independent. Therefore, the high intensity shot noise at the RX could be modelled as a summation of independent low power Poisson processes, which could be approximated as a zero mean Gaussian distribution. Consequently, the effective noise could be modelled as AWGN, , where . Independent from the shot noise, the thermal noise emerges due to the random motions of the electrons in the front-end circuitry.
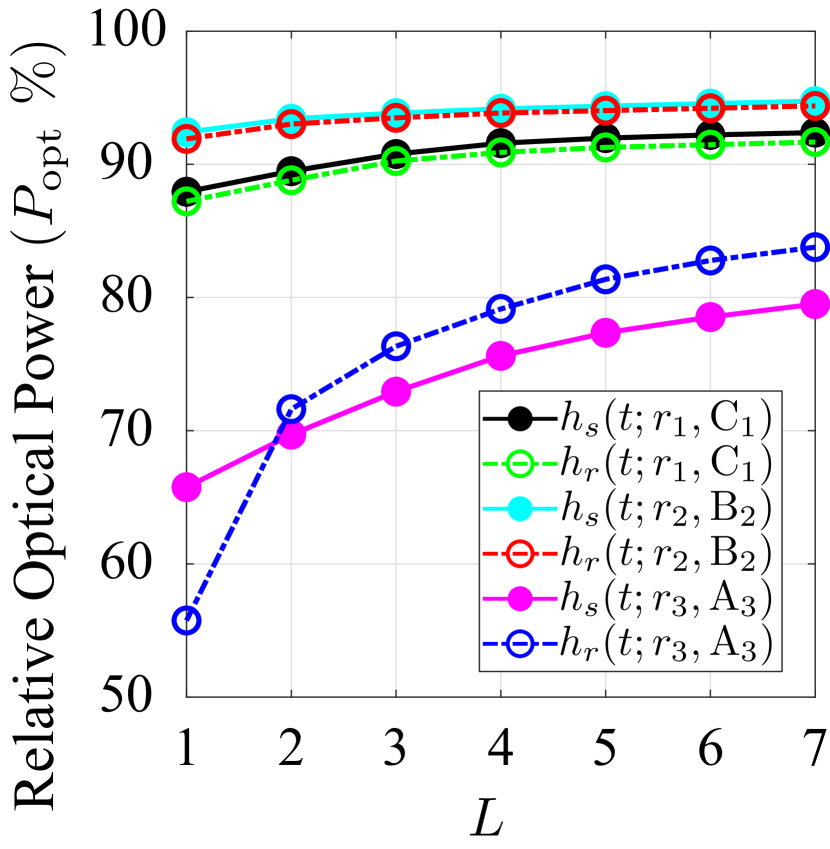
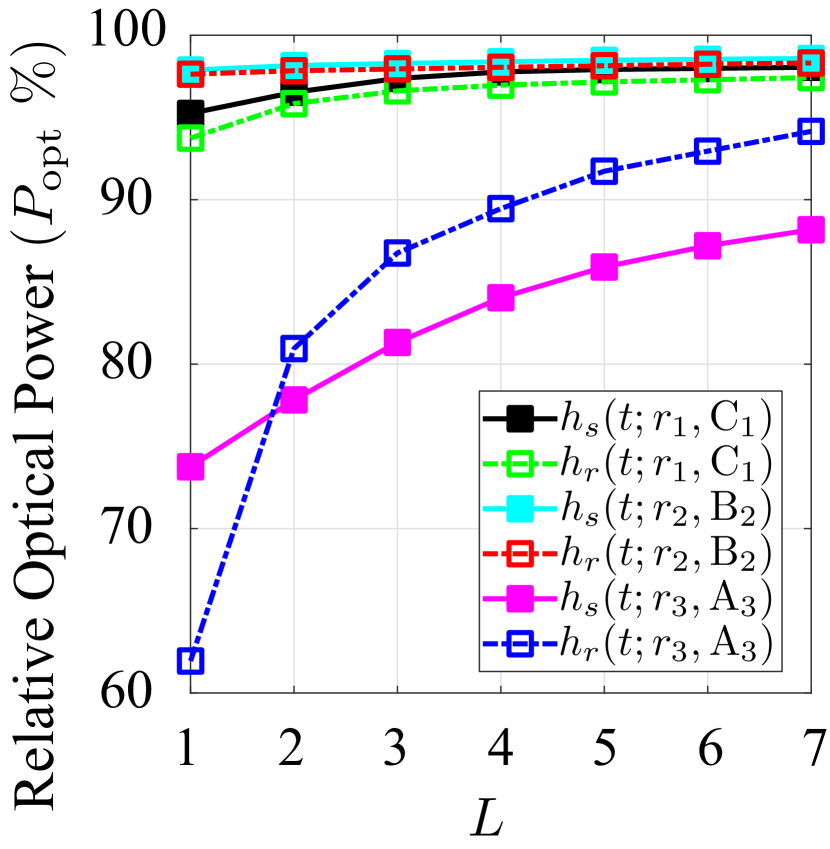
In practical wireless communication systems, the number of channel taps are limited in the time domain since they follow an exponential decay profile. To find the effective number of channel taps () for our simulations, the fractional optical power analysis depicted in Fig. 17 is used. As illustrated in Fig. 17, the relative optical power, , represents the portion of optical power when first largest taps are picked from the CIR as the effective channel. From the figure, it can be inferred that taps yield at least of the optical power of the initial CIRs for all the UE locations and both spectral regions. Consequently, the highest taps based CIRs are obtained from MCRT simulation results, are utilized in our BER versus effective-SNR-per-bit plots. The CP length in the DCO-OFDM system must be , to avoid ISI as a rule of thumb. Hence, the CP length of is adopted in our simulations. By using (15), we can obtain the frequency-domain signal at the RX after the CP addition and removal at the TX and RX, respectively as well as FFT operation by
| (21) |
where the FFT of , , and noise term are denoted by , , and , respectively for the subcarrier. It is important to note that the electrical domain frequency response characteristics of the front-end opto-electronic elements, , could also be lumped into the channel model if necessary. Hence, the effective channel becomes, . In this work, the electrical domain channel impairments, the analogue/digital and electrical/optical domain conversions are assumed to be ideal without loss of generality. Thus, the analytical average BER expression for DCO-OFDM under double-sided clipping and frequency selective channel effects could be calculated by using [37],
| (22) |
where denotes for subcarrier. The electrical domain effective-SNR-per-bit for the subcarrier after the zero-forcing (ZF) channel equalization could also be calculated by
| (23) |
where the orthogonal frequency division multiplexing (OFDM) signal bandwidth is given by . Also, the bit rate for the subcarrier could be calculated by
| (24) |
By using the above equation, the spectral efficiency of the subcarrier of DCO-OFDM could also be calculated by bits/sec/Hz.
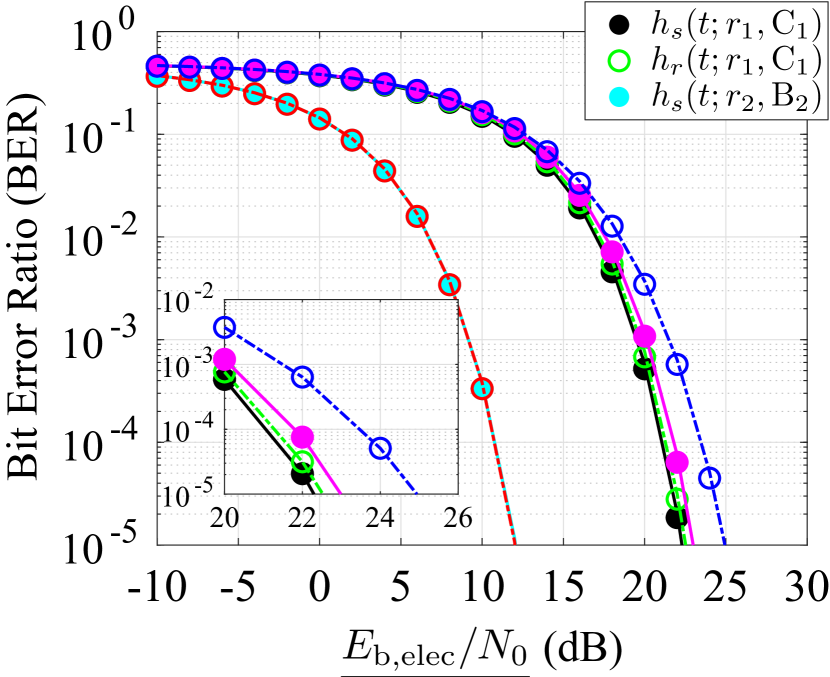
In our BER simulations, all the subcarriers are modulated by using the same normalized QAM modulation which yields, and . Since the magnitude of the channel taps, , are in the order of , in MCRT results, the electrical PL at the RX becomes dB. Therefore, the BER plots are presented w.r.t. the received electrical-SNR-per-bit value, which could be calculated by [38]. The rest of DCO-OFDM system parameters and their descriptions, which are used in the error performance simulations are given in Table IV.
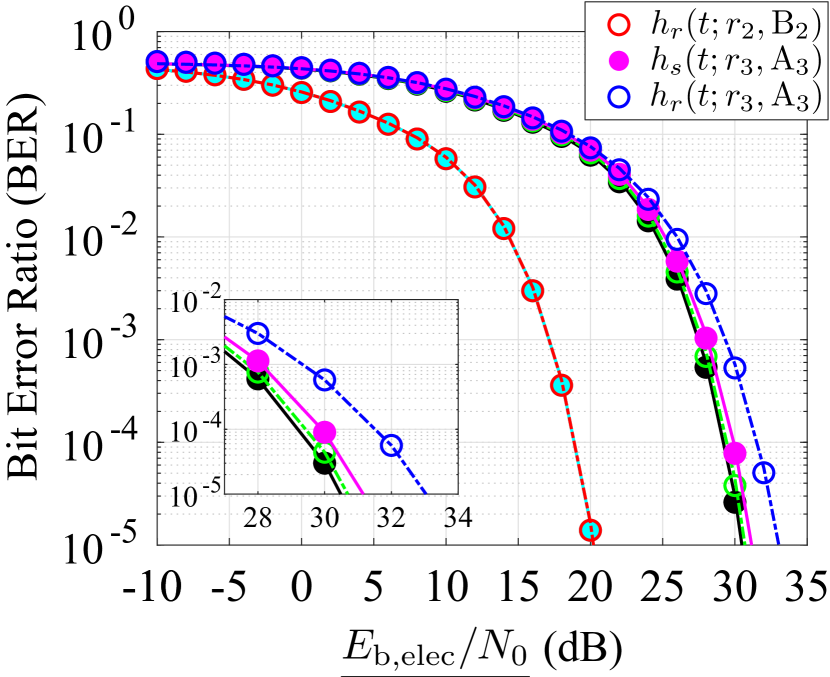
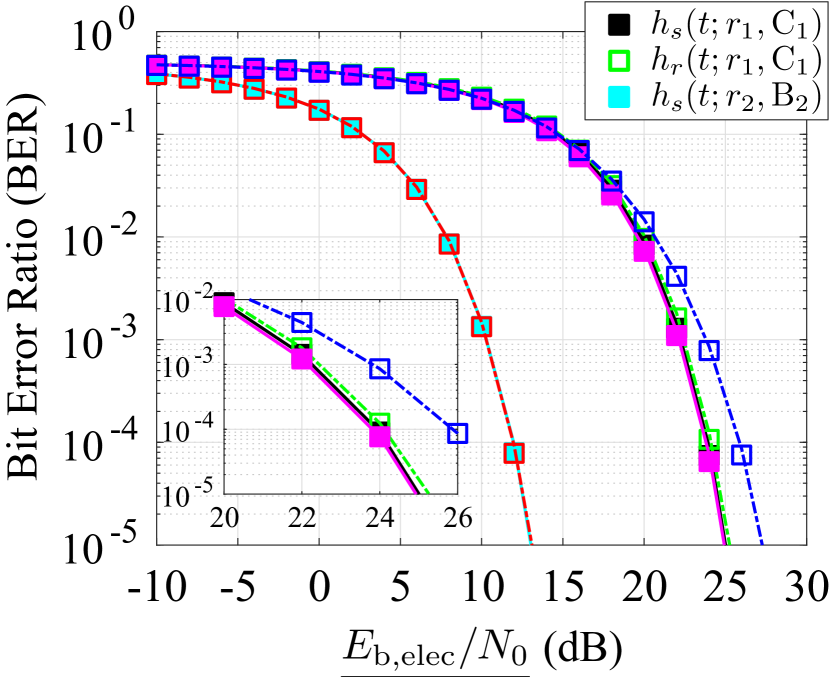
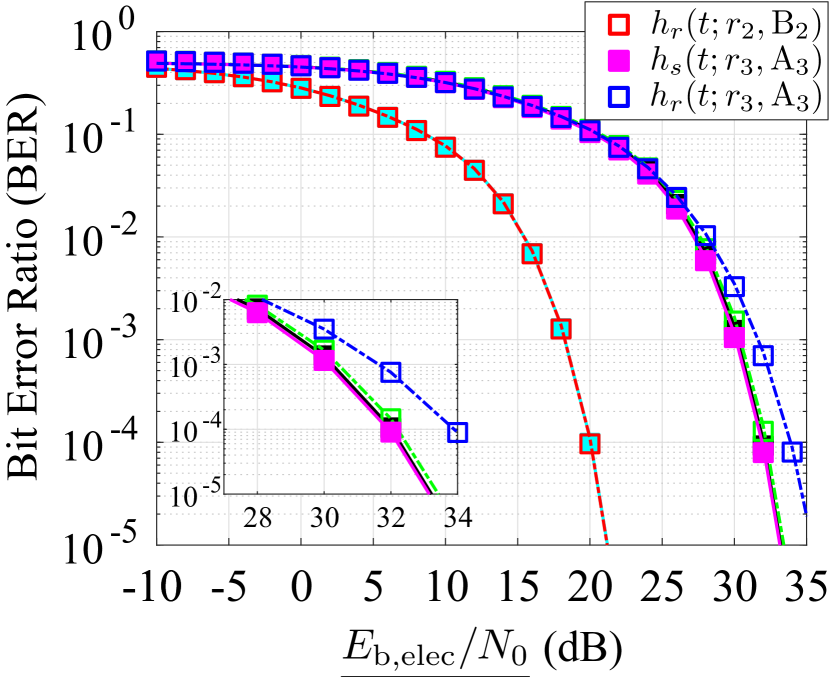
The BER vs. plots of DCO-OFDM for average spectral efficiency of and bits/sec/Hz are given in Figs. 18 and 19, respectively. The circle and square markers represent the computer simulation results for IR and VL bands, respectively, where the lines are the theoretical results obtained by using (22). Furthermore the different colours among each plot depicts the various locations of the UE as explained at the beginning of the section. As illustrated in Fig. 18, the error performance of seat B in the IR band outperforms seats C and A result at least dB in both low and mid/high spectral efficiency regions. A similar trend can also be seen in VL band, as depicted in Fig. 19, where the error performance difference between seat B with seats C and A becomes at least dB for both spectral efficiency values. The main reason behind this error performance in point B2 is the very high received SNR as well as a lack of multipath dispersion compared to other measurement points. For the UE location A3, DCO-OFDM error performance under both the IR and VL band channels with simplified cabin model outperformed the realistic cabin as much as dB in both spectral efficiency regions. This difference is also important as it shows the importance of cabin geometry on the practical system performance.
VI Conclusion
In this paper, a reading lights based broadband in-flight LiFi system is investigated. Accordingly, an MCRT based realistic DL on-board LiFi channel modelling technique for both IR and VL bands is presented. Accordingly, two narrow-body aircraft cabin models, one with accurate dimensions, surface geometry and curvatures, and another with planar surfaces are generated. Moreover, economy class cabin interior seating is also considered in our simulations. To model the source, receiver and surface coating optical characteristics, measurement based spatio-angular and spectral properties are used. Results show that the location of the UE and cabin simplification have a significant impact on the channel parameters. The analytical expression and computer simulations based BER curves obtained for DCO-OFDM also confirmed the MCRT results for a practical system performance. Consequently, favourable propagation characteristics and high link budget properties makes in-flight LiFi a highly suitable candidate for on-board broadband 5G NR applications.
References
- [1] “Cisco Visual Networking Index: Global Mobile Data Traffic Forecast Update, 2017–2022, [Online],” https://s3.amazonaws.com/media.mediapost.com/uploads/CiscoForecast.pdf, accessed: 18-11-2021.
- [2] “Sky High Economics - Chapter One: Quantifying the commercial opportunities of passenger connectivity for the global airline industry, [Online],” https://www.lse.ac.uk/business-and-consultancy/consulting/assets/documents/sky-high-economics-chapter-one.pdf, Sep. 2017, accessed: 18-11-2021.
- [3] “Inmarsat Inflight Connectivity Survey, [Online],” https://www.inmarsat.com/content/dam/inmarsat/corporate/documents/aviation/insights/2018/Inmarsat%20Aviation%202018%20Inflight%20Connectivity%20Survey%20ENG.pdf, 2018, accessed: 18-11-2021.
- [4] J. Wang, C. Jiang, H. Zhang, X. Zhang, V. C. M. Leung, and L. Hanzo, “Learning-aided network association for hybrid indoor LiFi-WiFi systems,” IEEE Trans. Veh. Technol., vol. 67, no. 4, pp. 3561–3574, 2018.
- [5] H. Haas, L. Yin, C. Chen, S. Videv, D. Parol, E. Poves, H. Alshaer, and M. S. Islim, “Introduction to indoor networking concepts and challenges in LiFi,” IEEE/OSA J. Opt. Commun. Netw., vol. 12, no. 2, pp. A190–A203, 2020.
- [6] J. M. Kahn and J. R. Barry, “Wireless infrared communications,” Proc. IEEE, vol. 85, no. 2, pp. 265–298, Feb. 1997.
- [7] D. W. K. Wong and G. Chen, “Optical design and multipath analysis for broadband optical wireless in an aircraft passenger cabin application,” IEEE Trans. Veh. Technol., vol. 57, no. 6, pp. 3598–3606, 2008.
- [8] D. C. O’Brien, G. E. Faulkner, S. Zikic, and N. P. Schmitt, “High data-rate optical wireless communications in passenger aircraft: Measurements and simulations,” in Proc. IEEE Int. Symp. Commun. Syst. Netw. Digit. Signal Process. (CSNDSP), Graz, Austria, Jul. 2008, pp. 68–71.
- [9] S. Dimitrov, R. Mesleh, H. Haas, M. Cappitelli, M. Olbert, and E. Bassow, “Path loss simulation of an infrared optical wireless system for aircrafts,” in Proc. IEEE Global Telecommun. Conf., Honolulu, HI, USA, Dec. 2009, pp. 1–6.
- [10] ——, “On the SIR of a cellular infrared optical wireless system for an aircraft,” IEEE J. Sel. Areas Commun., vol. 27, no. 9, pp. 1623–1638, 2009.
- [11] M. E. Yousefi, S. M. Idrus, C. H. Lee, M. Arsat, A. S. M. Supa’at, and N. M. Safri, “Indoor free space optical communications for aircraft passenger cabin,” in Proc. Int. Conf. Modeling, Sim. Appl. Optimization, Kuala Lumpur, Malaysia, Apr. 2011, pp. 1–5.
- [12] J. M. Kahn, W. J. Krause, and J. B. Carruthers, “Experimental characterization of non-directed indoor infrared channels,” IEEE Trans. Commun., vol. 43, no. 2/3/4, pp. 1613–1623, 1995.
- [13] C. Quintana, V. Guerra, J. Rufo, J. Rabadan, and R. Perez-Jimenez, “Reading lamp-based visible light communication system for in-flight entertainment,” IEEE Trans. Consum. Electron., vol. 59, no. 1, pp. 31–37, Feb. 2013.
- [14] M. Kavehrad, M. I. S. Chowdhury, and Z. Zhou, Wireless Solutions for Aircrafts Based on Optical Wireless Communications and Power Line Communications. John Wiley & Sons, Ltd, 2015, ch. 8, pp. 193–206.
- [15] D. Tagliaferri and C. Capsoni, “SNIR predictions for on-aircraft VLC systems,” in Proc. IEEE Int. Conf. Broadband Commun. Next Gen. Netw. Multimedia Appl. (CoBCom), Graz, Austria, Sept. 2016, pp. 1–7.
- [16] ——, “High-speed wireless infrared uplink scheme for airplane passengers’ communications,” Electron. Lett., vol. 53, no. 13, pp. 887–888, 2017.
- [17] D. Tagliaferri, A. Matera, C. Capsoni, and U. Spagnolini, “Nonlinear visible light communications broadcast channel precoding: A new solution for in-flight systems,” IEEE Photon. J., vol. 10, no. 4, pp. 1–14, 2018.
- [18] D. Tagliaferri and C. Capsoni, “Enabling on-aircraft visible-light communications in low-light conditions,” Electron. Lett., vol. 55, no. 5, pp. 274–276, 2019.
- [19] S. Joumessi-Demeffo, S. Sahuguede, D. Sauveron, A. Julien-Vergonjanne, P. Combeau, B. Mercier, L. Aveneau, and H. Boeglen, “A link reliability study of optical wireless headset inside aircraft cockpit,” in Proc. Global LIFI Congress (GLC), Paris, France, Jun. 2019, pp. 1–6.
- [20] S. Dimitrov, S. Sinanovic, and H. Haas, “Signal shaping and modulation for optical wireless communication,” J. Lightw. Technol., vol. 30, no. 9, pp. 1319–1328, May 2012.
- [21] F. Miramirkhani and M. Uysal, “Channel modeling and characterization for visible light communications,” IEEE Photon. J., vol. 7, no. 6, pp. 1–16, Dec. 2015.
- [22] F. Miramirkhani, M. Uysal, and E. Panayirci, “Novel channel models for visible light communications,” in Broadband Access Communication Technologies IX, vol. 9387, International Society for Optics and Photonics. SPIE, 2015, pp. 150 – 162.
- [23] F. Miramirkhani and M. Uysal, “Channel modelling for indoor visible light communications,” Phil. Trans. R. Soc. A., vol. 378, 2020.
- [24] “IEEE 802.11bb reference channel models for indoor environments, [Online],” https://mentor.ieee.org/802.11/dcn/18/11-18-1236-01-00bb-ieee-802-.%2011bb-reference-channel-models-for-indoor-environments.pdf, accessed: 18-11-2021.
- [25] “ZEMAX-OpticStudio,” https://www.zemax.com/products/opticstudio, accessed: 18-11-2021.
- [26] “Airbus A320 - Aircraft Characteristics Airport and Maintenance Planning, [Online],” https://skybrary.aero/sites/default/files/bookshelf/2369.pdf, accessed: 18-11-2021.
- [27] “Collins Aerospace Systems - LED Reading Lights, [Online],” https://utcaerospacesystems.com/wp-content/uploads/2018/04/03_0030-LED-Reading-Lights.pdf, accessed: 18-11-2021.
- [28] F. Kremser, F. Guenzkofer, C. Sedlmeier, O. Sabbah, and K. Bengler, “Aircraft seating comfort: the influence of seat pitch on passengers’ well-being,” Work, vol. 41, pp. 4936–4942, Supplement 1, 2012.
- [29] “IEEE 802.11 light communication TG - proposal for common-mode mandatory PHY, [Online],” https://mentor.ieee.org/802.11/dcn/19/11-19-1625-04-00bb-proposed-common-mode-mandatory-phy.pptx, accessed: 18-11-2021.
- [30] “Collins Aerospace Systems - LED Reading & Dome Lights, [Online],” https://www.collinsaerospace.com/what-we-do/Commercial-Aviation/Cabin/Lighting/Reading-And-Dome-Lights/Reading-Lights, accessed: 18-11-2021.
- [31] “OSRAM OSCONIQ P 3030, GW QSPPA1.EM High Power LED Datasheet, [Online],” https://dammedia.osram.info/media/resource/hires/osram-dam-8405096/GW%20QSSPA1.EM_EN.pdf, accessed: 18-11-2021.
- [32] “OSRAM TOPLED, SFH4253 High Power Infrared Emitter Datasheet, [Online],” https://dammedia.osram.info/media/resource/hires/osram-dam-6035009/SFH%204253_EN.pdf, accessed: 18-11-2021.
- [33] R. Kokaly et al., “USGS spectral library version 7: U.S. Geological Survey Data Series 1035,” https://crustal.usgs.gov/speclab/QueryAll07a.php, p. 61, 2017, accessed: 18-11-2021.
- [34] S. D. Dissanayake and J. Armstrong, “Comparison of ACO-OFDM, DCO-OFDM and ADO-OFDM in IM/DD systems,” J. Lightw. Technol., vol. 31, no. 7, pp. 1063–1072, 2013.
- [35] S. Dimitrov, S. Sinanovic, and H. Haas, “Clipping noise in OFDM-based optical wireless communication systems,” IEEE Trans. Commun., vol. 60, no. 4, pp. 1072–1081, 2012.
- [36] L. Chen, B. Krongold, and J. Evans, “Theoretical characterization of nonlinear clipping effects in IM/DD optical OFDM systems,” IEEE Trans. Commun., vol. 60, no. 8, pp. 2304–2312, 2012.
- [37] K. Cho and D. Yoon, “On the general BER expression of one- and two-dimensional amplitude modulations,” IEEE Trans. Commun., vol. 50, no. 7, pp. 1074–1080, 2002.
- [38] T. C. M. Fath, “Evaluation of spectrally efficient indoor optical wireless transmission techniques,” Ph.D. dissertation, The University of Edinburgh, Oct. 2013.
![[Uncaptioned image]](/html/2202.05911/assets/bio/yesilkaya_bw.png) |
Anil Yesilkaya (Member, IEEE) received the B.Sc. (Hons.) and M.Sc. degrees in electronics engineering from Kadir Has University, Istanbul, Turkey, in 2014 and 2016, respectively. He received the PhD. degree in digital communications from the University of Edinburgh, Edinburgh, U.K., in 2021. He is currently working as a postdoctoral research associate in Horizon 2020 project 5G-CLARITY at the LiFi Research and Development Centre, University of Strathclyde. He was a recipient of the Best Paper Award from the IEEE International Conference on Communications (ICC) Optical Networks and Systems (ONS) Symposium in 2018. |
![[Uncaptioned image]](/html/2202.05911/assets/bio/haas_bw.jpg) |
Harald Haas (Fellow, IEEE) received the Ph.D. degree from The University of Edinburgh in 2001. He is a Distinguished Professor of Mobile Communications at The University of Strathclyde/Glasgow, Visiting Professor at the University of Edinburgh and the Director of the LiFi Research and Development Centre. Prof Haas set up and co-founded pureLiFi. He currently is the Chief Scientific Officer. He has co-authored more than 600 conference and journal papers. He has been among the Clarivate/Web of Science highly cited researchers between 2017-2021. Haas’ main research interests are in optical wireless communications and spatial modulation which he first introduced in 2006. In 2016, he received the Outstanding Achievement Award from the International Solid State Lighting Alliance. He was the recipient of IEEE Vehicular Society James Evans Avant Garde Award in 2019. In 2017 he received a Royal Society Wolfson Research Merit Award. He was the recipient of the Enginuity The Connect Places Innovation Award in 2021. He is a Fellow of the IEEE, the Royal Academy of Engineering (RAEng), the Royal Society of Edinburgh (RSE) as well as the Institution of Engineering and Technology (IET). |