AA \jyearYYYY
Photodissociation and X-Ray Dominated Regions
Abstract
The radiation from stars and active galactic nuclei (AGN) creates photodissociation regions (PDRs) and X-ray dominated regions (XDRs), where the chemistry or heating are dominated by far-ultraviolet (FUV) radiation or X-ray radiation, respectively. PDRs include a wide range of environments from the diffuse interstellar medium to dense star-forming regions. XDRs are found in the center of galaxies hosting AGN, in protostellar disks, and in the vicinity of X-ray binaries. In this review, we describe the dominant thermal, chemical, and radiation transfer processes in PDRs and XDRs, as well as a brief description of models and their use to analyze observations. We then present recent results from Milky Way, nearby extragalactic, and high-redshift observations.
Several important results are:
-
•
Velocity resolved PDR lines reveal the kinematics of the neutral
atomic gas and provide constraints on the stellar feedback process.
Their interpretation is, however, in dispute as observations suggest a
prominent role for stellar winds while they are much less important
in theoretical models. -
•
A significant fraction of molecular mass resides in CO-dark gas
especially in low-metallicity/highly irradiated environments. -
•
The CO ladder and [C I]/[C II] ratios can determine if FUV or X-rays
dominate the ISM heating of extragalactic sources. -
•
With ALMA, PDR and XDR tracers are now routinely detected
on galactic scales over cosmic time. This makes it possible to link
the star formation history of the Universe to the evolution of the
physical and chemical properties of the gas.
doi:
10.1146/((please add article doi))keywords:
photodissociation regions, x-ray dominated regions, interstellar medium, active galactic nuclei, infrared emission, star forming regions1 INTRODUCTION
Massive stars produce a prodigious amount of radiative energy that interacts with the interstellar medium (ISM). The radiation drives chemical processing and heats the gas and dust which cool in bright line and continuum emission. Regions where the heating or chemistry are dominated by far-ultraviolet (FUV; ) radiation are called photodissociation regions (or PDRs; Tielens & Hollenbach, 1985a, hereafter TH85).111 Sometime referred to as Photon-Dominated Regions (also PDRs). This term was first coined by Alex Dalgarno and Amiel Sternberg to contrast PDRs with optically thick gas in which the chemistry is driven by cosmic-ray ionization, rather than by FUV photons that stimulate molecule production via ionization and heating in addition to destroying molecules via photodissociation (A. Sternberg, private communication). In this review we will adopt the original and more widely used term Photodissociation Regions. PDRs can have a range of incident FUV flux, densities, and column densities, depending on the distance of the stars that produce the FUV radiation and the gas environment where the FUV is absorbed. The “classic” PDR discussed in TH85 is one in which FUV radiation is emitted by an O or early B star and passes through an H II region to be absorbed in an adjoining molecular cloud. In general, these are high density and high FUV field PDRs (e.g., Tielens & Hollenbach, 1985b, Meixner et al., 1992, Tielens et al., 1993) and is where feedback from radiative and mechanical energy of massive stars acts on the neutral gas. The FUV radiation from the OB association may also illuminate more distant parts of the molecular cloud and produce PDRs with low radiation fields but greater area than the high intensity PDRs (Stacey et al., 1993). In addition, the OB stars contribute FUV radiation to the interstellar radiation field that illuminates molecular clouds but also illuminates the diffuse ISM where the field strength, density and column densities are lower than the classic PDRs (Wolfire et al., 1995a, 2003). PDRs can also be found in reflection nebula (Chokshi et al., 1988, Steiman-Cameron et al., 1997), in planetary nebula (Graham et al., 1993, Latter et al., 2000), on the surfaces of pillars and globules (Mookerjea et al., 2019, Goicoechea et al., 2020, Schneider et al., 2021), in embedded protostars (van Kempen et al., 2010, Visser et al., 2012), and protostellar and protoplanetary disks (Aikawa et al., 2002, Gorti & Hollenbach, 2004, Woitke et al., 2010, Kamp et al., 2010, Öberg & Bergin, 2021).
PDRs include all regions of the neutral ISM where FUV radiation plays a role in the physics and/or chemistry. This includes the atomic gas, but also the deeper molecular layers where FUV radiation plays a role in the organic inventory. Most of the molecular gas in giant molecular clouds resides in PDRs and thus almost all of the atomic gas and molecular gas in the Galaxy is in PDRs. This conclusion holds for other galaxies as well so that most of the non-stellar baryons within galaxies are in PDRs.
Much of the infrared line and continuum radiation from galaxies arises in PDRs (Crawford et al., 1985, Stacey et al., 2010). The FUV radiation is mainly absorbed by grains and is radiated away as infrared continuum, but a fraction of the FUV radiation heats the gas via the photoelectric effect on small grains and large molecules. The PDR line emission is the dominant coolant in the neutral gas and can be as bright as % of the infrared continuum. The line and continuum emission can be used to determine the gas physical conditions in the PDR gas, and thus in most of the mass of the ISM.
The observation and modeling of PDRs is also important for star formation. The line emission reveals the local environment that gives rise to star formation and the feedback processes that might inhibit it. PDRs measure the star formation rate by probing the radiative energy produced by embedded massive stars. In addition, PDRs play an important role in the global processing of material between thermal phases, which results in cold dense gas from which molecules and stars can form (Ostriker et al., 2010). The ionization produced by FUV radiation in molecular clouds provides coupling to magnetic fields, helping to regulate star formation (McKee, 1989).
In addition to FUV radiation, X-ray radiation can dominate the heating, ionization and chemical composition in X-ray dominated regions (XDRs; Maloney et al., 1996)222The term X-ray Dissociation Regions - in analogy to the Photodissociation Regions - was first coined by Maloney et al. (1996) to refer to the portion of a gas cloud illuminated by an X-ray source where the molecule dissociation, but also the ionization, heating, and chemical composition are driven by the X-rays. For this reason the term XDR is now widely used with the more general meaning of X-ray Dominated Region. In this review we will adopt this definition.. The X-rays can be produced by a variety of sources and processes such as young stellar objects, gas accretion onto a super massive black hole, and X-ray binaries. Early seminal works by Krolik & Kallman (1983) and Lepp & Shull (1983) concentrated on the effects of X-rays from embedded stellar sources within molecular clouds, and on the impact of X-rays on the molecular gas within the obscuring torus of Active Galactic Nuclei (AGN; e.g., Krolik & Lepp, 1989). The first comprehensive analysis of the chemistry, ionization, and thermal balance of XDRs was that of Maloney et al. (1996). Since then, the physics and chemistry of XDRs has been examined from several different perspectives concentrating on protoplanetary disks (Glassgold et al., 1997, Igea & Glassgold, 1999, Stäuber et al., 2005, Ercolano et al., 2008, Owen et al., 2011, Meijerink et al., 2012, Aresu et al., 2012), galactic centers of AGN host sources (e.g., Meijerink et al., 2007, 2011, van der Werf et al., 2010, García-Burillo et al., 2010, Harada et al., 2013, Mingozzi et al., 2018), and X-ray binaries (Moser et al., 2017, Lebouteiller et al., 2017).
Several previous reviews have been published on both PDRs and XDRs (e.g., Hollenbach & Tielens, 1997, 1999, Sternberg, 2005, Snow & McCall, 2006, Bolatto et al., 2013). In this review we provide the basic micro-physics required to understand the dominant thermal, chemical, and radiative processes in PDRs and XDRs while striving to summarize results from theoretical, observational, and laboratory work since the previous reviews. In order to limit the scope of such a vast field of research we will only lightly touch upon topics that are covered in recent reviews such as the emission from Polycyclic Aromatic Hydrocarbons (PAHs; Tielens, 2008), chemistry in diffuse gas (Gerin et al., 2016), and protoplanetary disks (e.g., Bergin et al., 2007).
2 Fundamental Processes in PDRs and XDRs
All PDR and XDR models must self-consistently solve for the gas temperature, the radiation field, and the abundances of atomic and molecular species, as a function of depth into the cloud. These components are coupled and thus require an iterative scheme to solve (see Figure 1). Some simplification can be made by assuming a plane-parallel geometry, thermal balance in which the heating rate equals the cooling rate, chemical balance in which the formation rate of each species is balanced by the destruction rate, and parameterized fits to the depth dependence of photo processes. In this section we briefly discuss the three main components of a model under these assumptions and discuss models that lift them in later sections. Note that while we will mostly refer to a prototypical PDR model, the same considerations apply to XDR models, modulo their peculiar heating mechanisms that are addressed in Section 4.2.
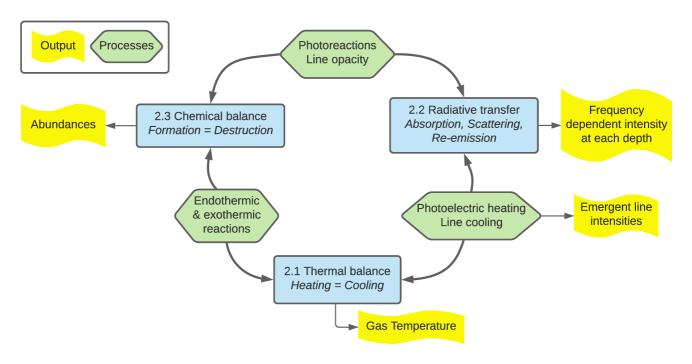
A common iterative scheme is to start at the outer edge of a cloud, with an initial guess of temperature, abundances, and radiation field and solve for abundances in chemical balance. Using these abundances, the temperature is adjusted lower (higher) if the cooling rate is higher (lower) than the heating rate and the chemistry is recalculated. Both the chemistry and temperature are iterated until both chemical balance and thermal equilibrium are achieved. This cycle is repeated at the next step into the cloud where fitted functions are used for the dependence of radiative processes with depth.
2.1 Thermal Balance
The heating rates are generally of the form erg where is the hydrogen nucleus density and is the heating rate per hydrogen in units erg . For example, an important heating process in PDRs is the photoelectric effect on small grains and PAHs which is given by
| (1) |
where is the hydrogen nucleus density, is a measure of the integrated FUV radiation field, and is the photoelectric heating efficiency. TH85 defined to be the incident field strength in units of the Habing (1968) interstellar radiation field, while is the local (attenuated) field strength within the cloud. The Habing field has an integrated FUV flux of . Since depends on , the gas temperature , and the electron abundance , the photoelectric heating rate is not fixed until , , and are converged.
The cooling rate is generally of the form erg where is the cooling rate coefficient in erg . To illustrate the cooling process, we consider collisional excitation followed by radiative de-excitation of a two-level system of species , with a density , and collisions with atomic hydrogen of density . In the absence of background radiation the cooling rate is
| (2) |
where is the fractional abundance of species , and are the statistical weights of the upper and lower states, is the energy of the transition, is the Boltzmann constant, is the gas temperature, is the Einstein A coefficient, is the escape probability, is the optical depth in the line, and is the rate coefficient for collisional de-excitation. is often fit with a form . The derivation of equation 2 can be found, for example, in Tielens (2005).
The probability that a photon escapes the cloud given a line optical depth to the surface.
A useful characterization of a line transition is given by the critical density, , which is the density at which the rate of collisional de-excitations is equal to the rate of spontaneous radiative de-excitations, 333For a multi-level system, includes the sum of all radiative and collisional rates out of level u to lower levels.. Through , has a weak dependence on temperature. For densities, the cooling rate per volume is
| (3) |
which is proportional to and each collisional excitation results in a photon. For densities the levels are thermalized (they depend only on gas temperature and are populated according to the Boltzmann distribution) and the cooling rate is proportional to (see equation 2). Note that even though the rate of collisional de-excitation exceeds the rate of radiative de-excitation, the upper level is still radiatively de-excited at the Einstein rate.
[] \entryCritical density at which the rate of collisional de-excitations is equal to the rate of spontaneous radiative de-excitations..
The emergent line intensity is given by the integral of the cooling rate from the cloud surface into the cloud,
| (4) |
where the factor is appropriate for a semi-infinite slab where photons escape through only the front surface, and is given by equation 2 and accounts for optical depth effects in the line. The line optical depth, , and hence depends on the densities of the species in the upper and lower levels and the Doppler line width, , which includes both thermal and turbulent broadening444The Doppler width is related to the full width at half maximum width by . (see Section 3.4). The effects of background radiation, multiple collision partners, and multilevel systems can be included in the excitation, cooling, and line emission following Tielens (2005) and Draine (2011). Thermal balance is achieved when . Heating rates for PDRs are proportional to or for high charge parameter (see equation 8) ( for XDRs; see Section 4.2) and cooling rates are proportional to , and thus the thermal structure is a function of (or for XDRs, see Section 4). The () 158 m line is an example of a two-level, fine-structure transition, with K, , and at K, critical densities of 9, 3000, and 6100 for collisions with , H, and respectively. The statistical weights are given by so that and . Goldsmith et al. (2012) give analytic solutions for the excitation of and the line intensity in various limits of the critical density, optical depth, and background radiation fields. A similar analysis for the lines is given in Goldsmith (2019).
2.2 Radiation Transfer
The equation of transfer for the FUV continuum radiation field (or X-ray continuum, see Section 5.2), including non-isotropic grain scattering, has been solved using a number of methods including spherical harmonics (Flannery et al., 1980, Le Petit et al., 2006, Goicoechea & Le Bourlot, 2007), and ray tracing (Röllig et al., 2013, Yorke, 1980). Photo rates at each depth into the cloud are given by where is the cross section of the process, and is the local mean intensity defined as the angle average over the specific intensity , , where is the differential element of solid angle. Instead of explicitly solving for , a simplification can be made by using pre-calculated fits to the photo rates which take into account the depth dependence of the radiation field. These are calculated for a specific angle of incidence and spectral energy distribution, grain type, and geometry (e.g., Heays et al., 2017). For a radiation field that is normally incident on a plane parallel layer, the photo rates generally take the form
| (5) |
where is the unattenuated rate in the local interstellar radiation field, is the incident field and and gives the (exponential) depth dependence of the dust opacity relative to the visual extinction, , into the cloud. The effects of scattering are usually included in for a specific grain model. The hydrogen nucleus column density, , is related to by for the local Galaxy. Several different radiation fields are in use besides the Habing field, including the Draine (1978) field, , and the Mathis et al. (1983) field, 555The symbol is also commonly used for the ionization parameter in H II regions.. The integrated field strengths are related to by and .666Note that calculated for a Draine field will be approximately 1.7 times higher than that for a Habing field, but this scaling does not account for differences in the spectral energy distribution. See also Section 5.2 for conversion between different radiation fields.
In addition to the dust opacity, gas opacity can significantly modify the radiation field, mainly due to absorption by H, , C, and CO, and in protostellar disks OH and . The gas opacity decreases the photorates faster with depth than by dust opacity alone (van Dishoeck & Black, 1988, Visser et al., 2009).
2.3 Chemical Balance
In chemical balance a kinetic approach is used to find the abundances. For each species the destruction and formation rates are calculated and the abundances found for which the formation rates and destruction rates are equal.
Two-body reaction rates between species and are given by where and are the volume densities of and , and is the reaction rate coefficient in . The densities of PDRs considered in this review are sufficiently low so that three-body reactions are not important but they can be important at higher densities or lower grain abundances found, for example, in protostellar disks.
Fits to are often given as
| (6) |
where is the activation energy for the reaction to proceed in temperature units. For example, the reaction has a rate coefficient (with ). The photodestruction rates and cosmic-ray destruction rates of a species are proportional to and respectively where is the cosmic-ray ionization rate. For two-body formation rates balanced by photo- or cosmic-ray destruction (, ) the chemical structure is a function of and .
The previous subsections serve as illustrations for the basic processes in PDRs and the interdependence of chemistry, thermal processes, and radiation transfer. The same apply to XDRs, whose peculiar physics and chemistry are discussed in Section 4. In the next two sections we discuss PDRs and XDRs in more detail.
3 The Physics of PDRs
3.1 1-D Structure
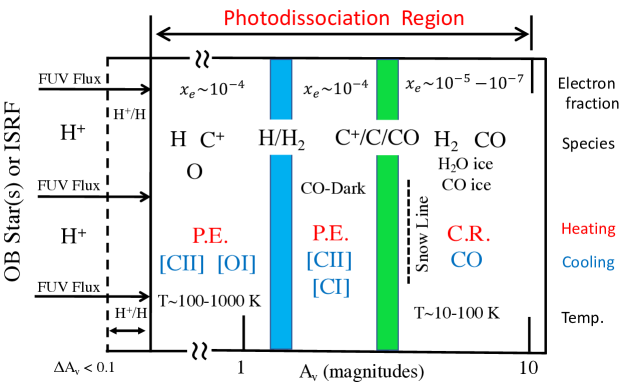
We first discuss the basic structure of PDRs in terms of a one-dimensional (1-D) layer. Figure 2 shows the 1-D structure of a classic PDR adjacent to an H II region as a function of into the cloud (the exact value of depends on ). The stellar extreme-ultraviolet (EUV; eV) photons, emitted by the OB stars, ionize the surrounding gas and produce an H II region. The FUV radiation field that emerges from the H II region illuminates the (hydrogen) neutral gas beyond and produces the PDR. Molecules are photodissociated and metals with ionization potentials less than 13.6 eV are singly ionized (e.g., , , ). Atomic hydrogen, helium, and oxygen are neutral since these have ionization potentials greater than 13.6 eV. Here, the gas is heated mainly by ejection of electrons from small grains and PAHs and cooled by fine-structure line emission and attains a temperature typically K. The gas temperature exceeds the grain temperature since the gas cools by line radiation while grains cool by continuum radiation. The absorption of FUV radiation excites emission from PAHs (e.g., Allamandola et al. 1989, Peeters et al. 2002, 2017, see also reviews by Puget & Leger 1989, Tielens 2008, 2021) while the FUV and optical radiation heats larger grains that emit an IR continuum. Deeper into the cloud the FUV radiation diminishes due to dust opacity and at , H is converted to . Deeper into the cloud (), recombines with electrons to produce atomic C, and CO can form through a series of ion-neutral reactions (van Dishoeck & Black, 1988, Sternberg & Dalgarno, 1995). The region between formation and CO formation is known as the CO-poor (Lada & Blitz, 1988, van Dishoeck, 1990) or CO-dark molecular gas (Grenier et al., 2005, Wolfire et al., 2010) and is H2 molecular gas that is not associated with CO millimeter line emission. The H2 and CO photodissociate via line absorption and can therefore self-shield and thus appear closer to the surface than or , or other molecules which dissociate via FUV continuum. In the deepest layers the gas attains temperatures K and is heated mainly by cosmic-ray ionization and, in dense regions, from gas collisions with grains heated by the IR radiation from the surface. The gas is cooled by rotational transitions of CO. Depending on the physical conditions, atoms and molecules may freeze out on grain surfaces at , greatly affecting the gas-phase abundances and altering the gas cooling and chemistry. Although we have presented the PDR as a static layer sandwiched between the H II region and the molecular cloud, a complete picture involves the evolution of the H II region, the PDR internal dynamics, and disruption of the cloud. We will touch upon these topics in Section 6. The PDR structure changes depending on the type and evolution of the illuminating source. For example, while O and early B stars produce H II regions, later B stars produce reflection nebulae with FUV radiation but little EUV radiation and hence no H II region. Lower , or illumination by cooler stars, moves the transitions between H/H2 and /C/CO to lower .
3.2 Chemistry
The basic chemical pathways (e.g., van Dishoeck & Black, 1986, Sternberg & Dalgarno, 1995) have not changed significantly since the last reviews although many of the rates have been updated through laboratory and theoretical work and several processes are now found to be more significant. For example, the dissociative recombination of measured by McCall et al. (2004) was determined to be higher than previous estimates and led to an order of magnitude increase in the cosmic-ray ionization rate required to match observations of molecular ions (Indriolo et al., 2007, Hollenbach et al., 2012, Neufeld & Wolfire, 2017). Freeze-out of O and CO onto grains, and reactions occurring on grain surfaces were not accounted for but are now found to dramatically change gas phase abundances, mainly for (e.g., Hollenbach et al., 2009), and are essential for the production of complex molecules.
3.2.1 Photoreactions
The photo rates have been reviewed extensively by Heays et al. (2017) for ionization and dissociation of a number of atomic and molecular species. Rates are provided in free space for a Draine (1978) interstellar radiation field. The depth dependence of the dust opacity, including scattering, for an isotropically illuminated layer is fit both as , and as where is the 2nd exponential integral function and results from the formal solution to the transfer equation. Isotropic radiation falls off faster than normally incident radiation at the cloud edge. The dependence for a normally incident field can be taken from Heays et al. to be . Only the normally incident rays penetrate to large depth and the depth dependence of both isotropic and normally incident fields become the same. A source of FUV radiation can be produced in cloud interiors when cosmic rays excite H2 to electronic levels that are then radiatively de-excited (Prasad & Tarafdar, 1983). The rates for these photon interactions are also found in Heays et al. (2017).
3.2.2 Photodissociation of H2
The photodissociation of H2 proceeds by line absorption of photons at Å within the Lyman and Werner bands (Black & van Dishoeck, 1987, Sternberg & Dalgarno, 1989, Abgrall et al., 1992, Sternberg et al., 2014). The molecule is pumped from the ground electronic state to an excited or electronic state. For % of the pumps a radiative de-excitation (emitting a UV photon) lands in a bound vibrational state of the electronic ground state , where a cascade through vibration and rotation levels ensues producing an IR line spectrum (see e.g., Shaw et al., 2005, Roueff et al., 2019, Zhang et al., 2021, for calculations of FUV pumped and collisional H2 line spectra). However, at high gas density, the FUV pumped levels are collisionally de-excited and the energy goes into heat rather than a radiative cascade. The remaining % of the pumps land in the vibrational continuum thereby dissociating the H2. When the FUV absorption lines become optically thick, the FUV pumping and dissociation rates rapidly drop with increasing H2 column. This optical depth effect is known as H2 self-shielding and is an essential part of H2 chemistry. Fits for H2 self-shielding as a function of the H2 column density are given in Draine & Bertoldi (1996), yielding a photodissociation rate per H2 of (see Sternberg et al., 2014, for a comprehensive analysis of H2 photodissociation)777Here we have written the photo rate using , the Draine (1978) field, since it has been calculated explicitly for that energy distribution.. Similar to H2, CO also photodissociates in lines but the lines are nearly 100% predissociated, i.e., absorption leads directly to dissociation. The absorption from H2 can also shield CO from photodissociation deeper into the cloud. Shielding functions for CO including H2 and CO self-shielding are given in Visser et al. (2009). Atomic C is photoionized by continuum radiation at Å and can also shield molecules at larger depth (Rollins & Rawlings, 2012).
[] \entryAdsorptionAdsorption is when an atom or molecule attaches to a grain surface upon collision.
[] \entryPhysisorb/chemisorb Physisorb is attachment by weak long-range van der Waals forces. Chemisorb is attachment by strong chemical bonds.
[] \entryDesorptionDesorption is when an atom or molecule becomes detached from a grain surface.
3.2.3 Formation of H2
The formation of H2 in the ISM occurs on grain surfaces (e.g., Cazaux & Tielens 2004, 2010, see also review by Wakelam et al. 2017). In diffuse gas, H2 is formed by the Langmuir-Hinshelwood (LH) mechanism where H atoms are physisorbed to the surface by weak long-range van der Waals forces. The H atoms migrate around the surface until they meet and react to form H2. A rate coefficient of was fit to observations of H2 columns in diffuse gas and has been known as the “standard” or diffuse gas value (Jura, 1974). The rate per volume is given by where is the hydrogen nucleus density and is the density of atomic hydrogen. Theoretical modeling (Hollenbach & McKee, 1979) using observationally constrained parameters reproduce this rate and provide a functional form for the rate coefficient
| (7) |
where is the sticking coefficient for H atoms striking grains of temperature , is the fraction of atoms that react to form H2 before being thermally desorbed, and is a scale factor for the dust abundance with the local Galactic abundance. Usually in PDRs, . On grains with regular surfaces and only physisorbed sites, H will thermally desorb before it can react with another H to form H2 at a critical grain temperature of K. Surface defects or an amorphous surface could increase the adsorption energies, and is then the grain temperature for which a H is desorbed before finding a defect site. Hollenbach & Salpeter (1971) find K for a binding energy of K which allows for a sufficiently high grain temperature for H2 formation in diffuse gas.888We note, however, that a more stringent constraint comes from comparing thermal desorption times with the time for another H to be adsorbed. For K a binding energy of 1500 K is required. Whether such sites exist on an amorphous silicate surface is unclear. For cold gas and grains, and are and equation 7 with these values are often used in both diffuse and dense PDRs.
However, for the higher and found in PDRs, both and decrease since H will bounce rather than stick and adsorbed atoms will be rapidly desorbed, thus driving down the formation rate by the LH mechanism. But the analysis of the H2 rotational and vibrational line emission in both moderate and low PDRs indicate the required rate coefficient is 1-5 times higher than that in diffuse gas (Habart et al., 2004). The higher formation rates draw the transition closer to the warm surface where collisional excitation enhances the rotational line emission. What could maintain or even increase H2 formation? The effects of higher velocity collisions and reduced sticking coefficient at higher may approximately cancel (Kaufman et al., 1999) leaving a constant rate, but this does not account for the thermal desorption that would occur for higher grain temperatures. Another mechanism that might be at work is the Eley-Rideal (ER) process (see e.g., Cuppen & Hornekær, 2008, Cuppen et al., 2010, Le Bourlot et al., 2012, Wakelam et al., 2017). For ER the H atoms are chemisorbed to the surface by strong chemical bonds that hold the H atom in place. A hot atom from the gas phase may strike the bound atom and react to form H2. The resulting formation rate is a function of the energy barrier required to attach the H atom to the surface, surface coverage of chemisorbed H so that a second H will strike it, the total surface area of grains per hydrogen nucleus, and the gas temperature. For a graphitic grain the barrier is measured to be K (Sha & Jackson, 2002) for attachment to the surface (basal plane) and high gas temperatures are required to overcome the barrier. After the first attached H, the barrier becomes minor for additional H in neighboring sites and high coverage in clusters can be achieved (Hornekær et al., 2006). On silicates there is no barrier for a H atom adsorption. Le Bourlot et al. (2012) and Bron et al. (2014) adopt a barrier of K for carbon particles suggesting that defects might lower the barrier, although direct interaction will be limited by the surface coverage of defect sites. With a barrier of 300 K, and sufficiently high surface coverage of defects and grain surface area, the rate coefficient at K is 3-4 times the diffuse rate and provides a good fit to H2 line emission in the Orion Bar and NGC 7023 (Bron et al., 2014, Joblin et al., 2018). Since the diffuse rate is essentially a maximum in which every two H collisions result in an H2, the inferred high H2 formation rate in PDRs likely requires activation of new surface routes (see also discussion in Tielens, 2021).
Bron et al. (2014) considered the effects of temperature fluctuations in very small grains and PAHs caused by single photon absorption. Between photon absorptions, an H2 may form by the LH mechanism before another photon arrives and desorbs the H. The process has a low efficiency for but can be important for and . {marginnote} \entryEndothermic reactionChemical reaction where there is a net energy input between energy state of reactants and energy state of products {marginnote} \entryExothermic reactionChemical reaction where there is a net energy release between energy state of reactants and energy state of products {marginnote} \entryActivation energyEnergy required for a reaction to occur. Both endothermic and exothermic reactions may require an activation energy.
Another possibility, that takes advantage of the increased surface area of PAHs, are H abstraction reactions on PAHs that have adsorbed a large number of H (a superhydrogenated PAH; Thrower et al., 2012). An incident H from the gas phase reacts with H on the PAH to form H2. The barrier for attachment is minor K and easily achieved at PDR temperatures. However, the additional H is easily photodesorbed (Andrews et al., 2016) and if the abstraction cross section is as low as that measured for the PAH coronene (Mennella et al., 2012) then this process will be not be efficient. Another process is by way of photodesorption (Castellanos et al., 2018). An absorbed UV photon will excite the PAH, allow H to roam, and the energy is dissipated in a loss of an H or H2. Whether H or H2 is produced is quite sensitive to PAH structure, and might work in only a narrow band of PAH types. For optimum conditions, the H2 formation rate coefficient could be as high as (Tielens 2021, private communication).
Model fits to observations of the mid-infrared H2 line emission and the CO ladder can help to constrain the H2 formation rate (e.g., Habart et al. 2004, Sheffer et al. 2011, Stock et al. 2015, Joblin et al. 2018, Wu et al. 2018, and future observations of H2 with JWST). As already mentioned, higher H2 formation rates draws the H2 to warmer surface layers and increases the H2 line emission but can also produce a small fraction of warm CO through reactions with excited H2 (Sections 3.2.4 and 7.1).
Although there has been significant advances in our understanding from theoretical and laboratory work (see review by Wakelam et al., 2017), the H2 formation process is still uncertain, especially as a function of the gas and grain temperatures. Observations suggest or larger, even in regions of fairly high gas temperature ( K) and warm ( K) grains, as in the Orion Bar PDR. Further experimental and quantum chemical studies as well as confirmation by comparison to astronomical observations are warranted.
3.2.4 Reactions with
The internal energy of vibrationally or rotationally excited H2, , can be used to increase the rate of endothermic chemical reactions (TH85, Sternberg & Dalgarno, 1995, Agúndez et al., 2010). The reactions and are especially important for the formation of and . The activation energies of K and K respectively are too high to be achieved by gas temperatures in much of the PDR. However, these endothermic reactions can be driven near the surface of PDRs where the is FUV pumped or where gas temperatures are sufficiently high to drive the reactions (with rates ). Such enhanced rates are required to match observations of and (Nagy et al., 2013, Zanchet et al., 2019, Goicoechea et al., 2019), and can lead to the production of and CO.
Primary cosmic-ray ionization rate per hydrogen atom with units .
3.2.5 Cosmic-ray reactions
Since there are no stellar EUV photons beyond the H II region boundary, H and He can not be ionized by the radiation field but can be ionized by cosmic rays that penetrate the PDR.999Wolfire et al. (2003, 2010) included a thermal soft X-ray component produced by local Galactic white dwarfs and super novae remnants to partially ionize the diffuse WNM and molecular cloud surfaces but these photons do not penetrate more than . Although they are important for low column density diffuse gas, they are not important for dense PDRs. It is this ionization by cosmic rays that drives much of the ion-neutral chemistry in PDRs (an exception are reactions with ). Typical ion-neutral reaction rate coefficients are with no temperature dependence nor activation barrier, and thus ion-neutral chemistry proceeds rapidly compared to neutral-neutral reactions which have typical rate coefficients of . Typical ionization rates in diffuse gas are inferred from observations of , , , and to be per H atom (Hollenbach et al. 2012, Indriolo et al. 2015, Neufeld & Wolfire 2017, see also Shaw & Ferland 2021 for the effects of variable PAH abundance). Each ionization of H, H2 or He, by a cosmic-ray electron of energy MeV, produces a secondary electron of energy eV which can further ionize another H or H2 (the fast cosmic ray being considered as the primary particle). The total rate including secondary ionizations in H and H2 gas is and respectively, and depends in detail on the molecular and electron fractions (Cravens & Dalgarno, 1978, Glassgold & Langer, 1974, Dalgarno et al., 1999, Glassgold et al., 2012). Higher electron fractions result in more energy going into heat rather than secondary ionizations. The dependence of the ionization rate with column density into the PDR is not well known and depends on the incident cosmic-ray spectrum and interaction with turbulence and the magnetic field in the cloud (Padovani et al., 2009, Silsbee & Ivlev, 2019). The low energy cosmic rays are absorbed at increasing column density and decrease the total ionization rate compared to the rate at the surface. Observations indicate in protostellar envelopes (van der Tak & van Dishoeck, 2000) and marginal evidence for a dependence in clouds (Padovani et al., 2009, Neufeld & Wolfire, 2017). Higher ionization rates initially increase the abundance of molecular ions (Hollenbach et al., 2012, Le Petit et al., 2016), however, for with , the abundance of molecular ions decreases due to the destruction of H2 by cosmic rays and due to an increasing electron abundance from ionizations leading to faster dissociative recombination (e.g., Le Petit et al., 2016). Increased ionization rates destroy CO by reactions with , requiring higher densities for formation and pushing CO deeper into the cloud (e.g., Gong et al., 2017). Similarly, internal sources of cosmic rays from e.g., protostars can change the chemical structure by warming the gas in the interior and increasing the density which destroys CO and increases C (Gaches et al., 2019).
3.2.6 Grain assisted recombination
The effects of an increased cosmic-ray ionization rate are partly mitigated by grain assisted recombination where mainly light ions (, and ) recombine with electrons on or charge exchange with . Since the and species are the result of electron attachment to and , the result is to reduce the abundance of free electrons and increase the abundance of neutral species. If not for this additional recombination, the production of CO would be inhibited for rates as low as and most of the carbon would remain as C. The effects of grain assisted recombination have long been known from absorption line studies in diffuse clouds (e.g., Lepp et al., 1988, Weingartner & Draine, 2001a). Many modelers adopt the Draine & Sutin (1987) formalism to obtain the reaction rates as a function of the number of carbon atoms in a PAH. The rate must be either integrated over the distribution in PAH size and abundance or multiplied by a typical size and abundance. Wolfire et al. (2008, 2003) calibrated the theoretical rates to match the observed ratio in diffuse gas and suggested a correction factor is needed, although Liszt (2011) suggests rates should be recalibrated with the generally lower C columns from Burgh et al. (2010). Fits for the Draine & Sutin (1987) rates near K can be found in Hollenbach et al. (2012). We emphasize that the rates and required integrals are quite uncertain and urge that further work is needed.
The photoionization of metals, in particular S, produces free electrons and affects the ion-neutral chemistry at intermediate depths . Similar to the effects of cosmic rays, a high electron abundance from metal ions can suppress the ion-neutral chemistry. The effects are mitigated by recombination on PAHs or freeze-out of metals (e.g., Hollenbach et al., 2012).
3.2.7 Grain surface reactions
Atoms and molecules collide with grains, and if the grains are sufficiently cold, they will be adsorbed on grain surfaces thereby depleting the species from the gas phase and freeze out as ice on grains (e.g., Hollenbach et al., 2009, Esplugues et al., 2016, 2017, Tielens, 2021). Freeze out affects the gas-phase chemistry and cooling, and induces grain-surface chemistry which can produce simple molecules (e.g., ) and complex organic molecules (COMs; e.g., methanol ; Garrod et al., 2008), which can then be desorbed from the grain back into the gas. Reviews of surface chemistry in PDRs and dark cores can be found in Cuppen et al. (2017) and in pre- and protostellar environments in Öberg & Bergin (2021).
Similar to H, adsorbed species may diffuse across the surface, although heavier atoms or molecules diffuse slower, and undergo chemical reactions when meeting (the LH mechanism) or may be hit by a gas-phase species and chemically react (the ER mechanism). The atoms and molecules on the grain surface can be desorbed if they can overcome their binding energy. Potential desorption processes important near the cloud surface include photodesorption (e.g., Öberg et al., 2009), thermal desorption (Tielens & Allamandola, 1987), and thermal fluctuations (Bron et al., 2014), while deeper into the cloud, cosmic-ray desorption (e.g., Hasegawa & Herbst, 1993), cosmic-ray induced FUV photodesorption, and chemical desorption (Dulieu et al., 2013, Garrod et al., 2007) dominate. Photon and cosmic-ray desorptions are individual photon or cosmic-ray events, thermal desorption depends on the equilibrium (large) grain temperature, thermal fluctuations are the temperature spikes of small grains and PAHs after absorbing a photon, and chemical desorption relies on exothermic chemical reactions on the grain surface. The cosmic-ray rates, and chemical desorption in particular, are not well constrained. In addition, thermal desorption and chemical reaction rates are sensitive to variations in grain temperature (Esplugues et al., 2019). Additional photoprocessing can occur on the grain surface and species can be photodissociated during photodesorption. The formation of molecules is then a competition between the rates of adsorption and surface reactions versus the desorption rates. See e.g., Hollenbach et al. (2009), van Dishoeck et al. (2021), and Tielens (2021) for ice formation.
The ice is observed to be mainly composed of CO, , , (ammonia), (formaldehyde), (methane), and (methanol) (e.g., Gibb et al., 2004) but can vary considerably depending on grain temperature, radiation field strength, gas density, and depth into the cloud. For example, ice can be thermally desorbed at grain temperatures K while CO is desorbed at grain temperatures K. The depth for water ice formation is proportional to and is typically for moderate density () and low FUV field () sources (see review and papers therein by Boogert et al., 2015).101010In previous PDR reviews the transition was depicted at . However in Hollenbach et al. (2009) it was shown that the abundance of peaks at . At lower the photodesorption of OH and followed by the gas-phase reaction increases while at larger freeze-out of O in ice diminishes all O bearing gas-phase species. However, grain surface chemistry can produce minimum , OH, and NH gas-phase abundances even in diffuse gas (Crutcher & Watson, 1976, Sonnentrucker et al., 2015) although the fraction in ice is insignificant. The time scale for several processes can become longer than cloud lifetimes and these require a time dependent approach (see Section 6.1).
PDR chemical networks have been extended and updated to include e.g., N chemistry (e.g., Young Owl et al., 2002, Boger & Sternberg, 2005, Li et al., 2013, Persson et al., 2014), S chemistry (Sternberg & Dalgarno, 1995, Goicoechea et al., 2021), and H, C, and N isotopes (Le Petit et al., 2002, Heays et al., 2014, Szűcs et al., 2014, Roueff et al., 2015, Röllig & Ossenkopf, 2013, Visser et al., 2018). Photo rates and cross sections can be found on-line at https://home.strw.leidenuniv.nl/~ewine/photo/ and dielectronic and radiative recombination rates at http://amdpp.phys.strath.ac.uk/tamoc. Data bases for gas-phase reactions are KIDA (Wakelam et al., 2012) and UMIST (McElroy et al., 2013) although the latter is becoming somewhat dated.
3.3 Gas Heating
Several processes may contribute to the gas heating depending on the incident FUV field strength, cosmic-ray ionization rate, gas density, and depth into the cloud. At moderate depths (), the dominant gas heating process is from photoelectric ejection of electrons from small grains and PAHs (Bakes & Tielens, 1994, Weingartner & Draine, 2001c). The fraction of FUV photon energy that goes into gas heating is the heating efficiency, , and is a function of the grain charge. The charge parameter , is proportional to the ratio of the ionization rate of grains to the electron recombination rate where is the local (attenuated) field strength, is the gas temperature, and is the electron density. For grains are neutral and is at a maximum of about %, while for higher , grains become charged and drops due to the electron kinetic energy loss in escaping the Coulomb potential and because fewer photons can ionize a more highly charged species. Since the ionization to recombination rate is proportional to the grain size, small grains and PAHs have on average lower charge than larger species. In addition, the larger grains contribute less because the electron escape length is smaller than the photon absorption depth; i.e, the yield goes down. Thus, small grains and PAHs dominate the heating with half coming from grains smaller than Å. Note that the electrons contributed from PAHs are generally an insignificant fraction of the free electron abundance since the PAH fractional abundance is much less than that of .
The heating rate per unit volume is given by erg with from Bakes & Tielens (1994) (hereafter BT94), given by
| (8) |
The second term is only important at high temperatures where a higher recombination rate of electrons with ionized small grains and PAHs results in lower positive charge and higher . In addition, for gas temperatures K and , recombination may become a significant gas cooling process. The photoelectric heating rate is often reported as the net heating minus the cooling. Wolfire et al. (2008) introduced a parameter , that modifies the charge parameter as to account for a reduced recombination rate on grains, needed to explain the observed column densities of C in the diffuse ISM. The theoretical efficiency produces good agreement with gas temperatures, thermal pressures, and [C II] cooling rates in diffuse gas (Wolfire et al., 1995a, 2003, Jenkins & Tripp, 2011, Gerin et al., 2015) where K, , , and . The agreement with observed fine-structure line intensities and line ratios in dense PDRs is usually quite good (e.g., Stacey et al., 1991, Hollenbach & Tielens, 1999). The analytic fit for given by Weingartner & Draine (2001c) (hereafter WD01) for a B0 star radiation field is a factor of lower than BT94 at and lower at extreme values of . At low values of , WD01 is a factor 2.6 higher than BT94. The given by the WD01 fit is nearly the same as that derived from the Meudon PDR code (Section 5.1) at the cloud surface for an incident Draine (1978) field. Although the shape of various heating efficiencies that are in use are quite similar, there are differences by factors of a few especially for high . Observations such as those discussed next might help to constrain the efficiency.
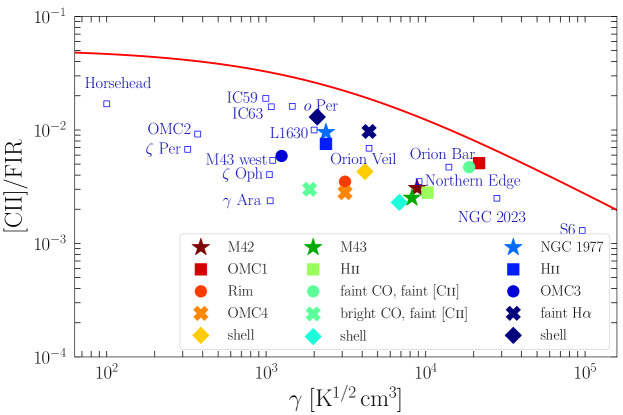
If [C II] is the dominant coolant and the integrated far-infrared (FIR) dust continuum is a measure of the incident radiative energy, then the ratio of [C II] intensity to FIR intensity ([C II]/FIR) provides an observational check of the theoretical . However, observations of several sources, including dense PDRs and diffuse gas, of [C II]/FIR (Figure 3) present a puzzling result (Salas et al., 2019, Pabst et al., 2022)111111Here FIR is defined as the integrated 40 m-500 m continuum. Another measure in use is the total infrared (TIR) 3 m-1100 m continuum (Dale & Helou, 2002). depending on grain temperature.. When compared to the BT94 efficiency, observational points fall below the theoretical curve. This may be the result of optical photons contributing to grain heating that do not heat the gas, a substantial contribution from [O I] cooling, or lower heating rates in dense PDRs where the PAH distribution is uncertain.
The photoelectric heating diminishes with depth into the cloud mainly due to dust opacity which reduces the integrated FUV radiation field. Reddening of the spectral energy distribution also reduces by % at and . For a normally incident B0 star spectrum and grains121212The total-to-selective extinction has a typical value of 3.1 in the diffuse ISM while molecular clouds can have larger ., the FUV field falls approximately as . A detailed treatment of the FUV radiation transfer (Le Petit et al., 2006, Röllig et al., 2013) and of the grain charge on a distribution of grains allows for different spectral energy distributions, angle of incidence, and different grain size distributions, than those used for the analytic expressions (van Hoof et al., 2004). A cooler incident spectrum (Spaans et al., 1994), shifts the grain charge to more neutral grains but ultimately produces less efficient heating since there are fewer high energy photons. Spaans et al. (1994) provide a simple formula that “corrects” equation 8 for the cooler radiation field and also quantitatively assesses the effect on photodissociation and photoionization. Increasing shifts the grain size distribution to larger grains, which have lower heating efficiency due to grain charging, and lower yield, and allows for increased penetration of FUV radiation into the cloud (Weingartner & Draine, 2001c, Abel et al., 2008).
Additional sources of heat come from H2 formation, photodissociation, and collisional de-excitation of excited rovibrational levels (Sternberg & Dalgarno, 1989). The formation of on grains releases eV of binding energy. The distribution of the energy is uncertain and depends on the formation process. For the the Eley-Rideal (ER) formation mechanism (see Section 3.2) eV goes into kinetic energy of the molecule which can heat the gas, 2.7 eV goes into internal rotational and vibrational excitation, and most of the remainder goes into grain heating (Sizun et al., 2010). For the Langmuir-Hinshelwood (LH) mechanism equipartition is generally assumed with eV going to the grain, kinetic energy, and excitation. These “formation pumped” excited levels can be collisionally de-excited at densities above the critical density where (Röllig et al., 2006), and contribute to gas heating. The total formation heating is the sum of the translational heating and de-excitation of excited levels. The photodissociated H2 attains eV in kinetic energy that also adds to gas heating (Stephens & Dalgarno, 1973, Abgrall et al., 2000).
The rovibrational levels can also be excited by FUV pumping, and contribute to gas heating, called vibrational heating, through collisional de-excitation of the excited levels (Sternberg & Dalgarno 1989, Burton et al. 1990 see also Röllig et al. 2006 for an analytic fit to the Sternberg & Dalgarno 1995 model). At the cloud edge, the formation and vibration heating can dominate that of photoelectric heating (Burton et al., 1990, Le Bourlot et al., 2012, Röllig et al., 2013). There, the gas temperature and the FUV field are high and the destruction and formation cycle is rapid thereby increasing the formation heating. In addition, rates of formation go as which is always higher at the surface. When the density is greater than the critical density for de-excitation, since there are 9 pumps for every formation, the vibrational heating by FUV pumping tends to dominate. At lower densities, the formation (translational) heating can be important.
Cosmic-ray ionization of H, , and He creates secondary electrons that heat the gas by similar processes discussed for X-ray photoelectrons (Section 4.2). Typical heating rates are eV per ion pair in diffuse molecular gas and eV per ion pair in molecular clouds with the heating rate per unit volume given by (Glassgold et al., 2012). For cosmic-ray ionization rates typical of those found in the Galactic disk, cosmic-ray heating is less important than photoelectric heating at the cloud surface even for radiation fields as low as the interstellar field, but can be important in cloud interiors that are shielded from FUV radiation. For higher cosmic-ray ionization rates as found in the central molecular zone near the Galactic center ( ; Le Petit et al., 2016) or supernovae remnants ( ; Priestley et al., 2017), the cosmic-ray heating can dominate that of photoelectric heating even close to the cloud surface (Bayet et al., 2011).
Gas collisions with grains can be either a heating or cooling process depending on if the gas temperature is lower or higher than the grain temperature. Grain temperatures are determined from radiative equilibrium using a full radiation transfer treatment with a distribution of grain sizes (e.g., Röllig et al., 2013), or with a simple fitted formula (Hollenbach et al., 1991, Hocuk et al., 2017). The gas is usually warmer than grains on PDR surfaces to but can be cooler than the IR heated grains at greater depths. Collisional de-excitation of fine-structure levels that are pumped by the infrared continuum radiation can also lead to gas heating. This is most likely to occur for the [O I] 63 m transition which can become optically thick to the continuum radiation and is at a wavelength where the dust continuum is strong.
3.4 Gas Cooling
In the atomic gas, cooling proceeds mainly through collisional excitation and radiative de-excitation of atomic fine-structure levels. The dominant coolants are [C II] 158 m and [O I] 63 m, and 145 m line emission. As recombines to C the fine-structure lines of [C I] 370, 609 m become important. In molecular gas rotational transitions of CO dominate the cooling (e.g., Neufeld & Kaufman, 1993). For high density and high FUV field PDRs, [Si II] 35 m and ro-vibrational transitions of can contribute to gas cooling (Abel et al., 2005, Kaufman et al., 2006). The calculation for the level populations are carried out in statistical equilibrium using non-LTE rate equations. Radiative pumping, self-absorption, and line transfer is generally handled using an escape probability formalism. The escape probability depends on , the cloud geometry, and whether a microturbulent or large velocity gradient (LVG) approach is used. The line optical depth integrated from the cloud surface to depth is given by:
| (9) |
where and are the densities of the species in the upper and lower levels, and is the Doppler line width which includes both thermal and turbulent broadening.
In a microturbulent model the velocity gradient is small compared to and the full column of the species along a line of sight contributes to the optical depth. In a large velocity gradient (LVG) model (e.g., RADEX, van der Tak et al. 2007) the velocity gradient, , is sufficiently large so that the integration is limited to the velocity coherent length . Most PDR models adopt a microturbulent approach because the physical size of the emitting region is narrow and the velocity gradient is small compared to the line width. The for a microturbulent, semi-infinite, plane-parallel layer can be found in TH85. See also Draine (2011) and Tielens (2021) for a derivation of escape probability formalism used in line radiation transfer. At the cloud surface and decreases as at large . In spherical geometry, the escape probability in microturbulent gas is given in Stoerzer et al. (1996) and in the LVG limit in Goldsmith et al. (2012).
It is important to use up-to-date collisional excitation rates in order to find the gas cooling and emitted line intensities. The LAMBDA (van der Tak et al., 2020) and BASECOL (Ba et al., 2020) databases are on-going efforts to provide rates on-line in a standard format. The dominant collision partners are usually atomic hydrogen near the PDR surface and molecular hydrogen at larger depth. Electron impact excitation may also be important for molecular ions (Hamilton et al., 2018). At intermediate depth both atomic and molecular hydrogen can contribute to the collisional excitation rates.
Several excitation rates have been calculated separately for collisions with Ortho and Para . Collision rates involving Ortho are generally faster than those for Para since the quadrupole interaction averages to zero for Para, although the difference is much greater for rotational transitions than for fine-structure transitions. Ortho to Para conversion of H2 should be accounted for in the chemical network (e.g., Sternberg & Neufeld, 1999, Bron et al., 2016). Wiesenfeld & Goldsmith (2014) note that the collisional rates for H2 with are quite close to those for H with , contrary to the factor of 2 difference expected previously. Impacts of electrons with cations (e.g., ) may also be important for sufficiently high electron fraction. For K, excitation of by and are comparable at . See Lique et al. (2018) for a recent derivation of the de-excitation coefficients of O I by , H, and He, but contact the authors for a corrected data set and extended to 8000 K.
4 The Physics of XDRs
4.1 1-D Structure
The 1-D structure of X-ray dominated regions (XDRs) differs from that of PDRs in two important ways: XDRs are characterized by much larger column densities () of warm gas ( K), and they have a peculiar enhanced abundance of molecular ions. The physical mechanisms causing the different 1-D structure of XDRs vs PDRs are linked to the deep penetration of X-rays and to the production of photoelectrons following primary ionizations. By analogy with PDRs, where the thermal and chemical conditions are determined by , the XDR structure can be parameterized in terms of , namely the ratio between the energy deposition rate per particle:
| (10) |
and the gas density . This follows from equating the heating and molecular destruction rates induced by X-ray photons (which are proportional to ), to the cooling and molecular formation rates (which are proportional to ). At equilibrium, the thermal and chemical conditions of XDRs are thus governed by . In equation 10, is the local photon energy flux per unit energy interval, that is generally assumed to be a power-law, (see Section 5.2 for a discussion regarding this and other functional forms), and is the photoelectric absorption cross section per hydrogen nucleus (Morrison & McCammon, 1983, Wilms et al., 2000). Given that goes roughly as (Maloney et al., 1996), the lowest energy photons are attenuated more than higher energy photons with increasing column density. The gas is optically thick to X-rays with where the energy for which depends on the column density. For molecular clouds with nearly all photons with keV are absorbed before the cloud center is reached. Considering a flux from to the energy deposition rate can be written as (see Maloney et al., 1996, for the complete derivation). Note its slow decline with column density as opposed to the FUV induced photoelectric heating in PDRs (see Section 3.3) that is instead confined in a much thinner layer by the exponential attenuation of the FUV flux due to dust. In XDRs the X-ray energy that is converted to heat and then re-radiated as line cooling – i.e., the heating efficiency – is larger (up to , Maloney et al., 1996) than in PDRs (, Hollenbach & Tielens, 1999, and discussion in Section 3.3). The chemistry is also affected up to high column densities (see Section 4.4) by ion-molecule reactions initiated by X-rays and this results in different emergent line emission and ratios that can be then used to distinguish XDRs from PDRs (see Section 5.3.2).
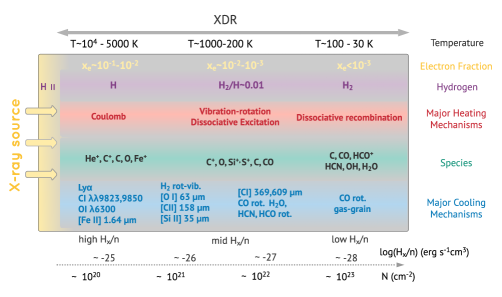
In general, a 1-D gas slab (Figure 4) illuminated by a nearby X-ray source with no attenuating foreground gas or dust has an external ionized layer. Figure 4 spans the range extending from substantially ionized gas to cold molecular gas. The corresponding effective ionization parameter (), which is related to the energy deposition rate as , ranges from . If the slab is shielded from the direct light of the X-ray source by e.g., a circumnuclear torus or a shadowing gas cloud, then the external H II region will not be present. The external H II region is followed by an FUV-produced PDR only if the ratio of the X-ray flux to the gas density is low and the X-rays do not dominate over FUV heating at low column densities. Note that FUV photons can be produced internally following the various degradation paths of the initial X-ray photon and this is discussed in detail in Section 4.2. At high column densities, and for high X ray incident flux (so as to dominate cosmic rays) regardless of the presence or not of an outer H II/PDR layer, X-rays completely dominate the heating and the chemical composition, and this is the actual XDR. A peculiar feature of XDRs is the much less abrupt transition as compared to PDRs. This is produced by the slow decrease of , and by the internally generated FUV photons resulting from collisions with secondary electrons which maintain fairly constant and C abundance until the CO dominates at large column densities (Meijerink & Spaans, 2005).
An important consideration regarding the X-ray photoelectric cross-section, , is that despite being much less abundant than H and He, heavy elements (C, O, Mg, etc) dominate above keV (Wilms et al., 2000), and hence they are the major sources of photoelectrons. Note that these elements are readily incorporated into dust grains, but there remains a significant fraction of C and O (mostly in the form of CO), and noble elements, in the gas phase. As such, the deposition of X-ray energy occurs through absorption by both gas and dust. Bethell & Bergin (2011) provide a simple polynomial fit to the X-ray photoelectric cross-section for a mixture of gas and dust, with specific focus on protoplanetary disks. For energies below 1 keV the gas is the main opacity source while at energies keV the metals in dust grains dominate the total opacity. Rab et al. (2018) also include the contribution of PAHs, concluding that they play a negligible role in the X-ray radiative transfer.
4.2 Gas Heating
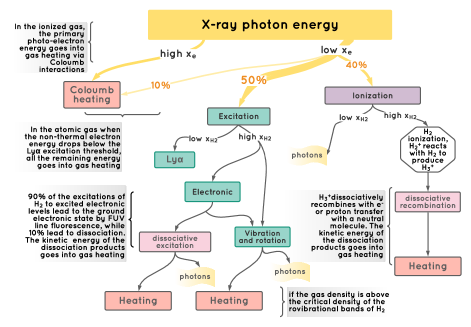
The XDR heating is produced by the degradation of the incident X-ray photon energy through several channels. The first step is the production of primary photoelectrons and secondary electrons as follows: The X-rays ionize heavy elements preferentially by removing a K-shell electron. The vacancy is then filled by a cascade of radiative (fluorescent) and non-radiative Auger transitions. These primary photoelectrons are typically energetic enough ( keV) to induce secondary ionizations resulting in the ejection of (non-thermal, secondary) electrons ( 8 eV) which, in turn, play a key role in all the subsequent heating processes. Given that each primary photoelectron loses about 20-30 eV per H ionization it produces secondary ionizations in addition to the initial ionization by the X-ray photon. The next steps involve the interactions of the primary and secondary electrons with the gas (see flowchart in Figure 5). Glassgold & Langer (1973), Cravens & Dalgarno (1978), Dalgarno et al. (1999), and Glassgold et al. (2012) carried out an extensive analysis of the energy loss of primary and secondary electrons in a H, He, mixture. They derived the heating produced by elastic collisions with ambient thermal electrons (Coulomb heating), along with a detailed treatment of the dissociation, vibrational and rotational heating, and an in-depth analysis of the chemical heating i.e., that resulting from exothermic dissociative recombination reactions between electrons and molecular ions. Each heating mechanism dominates in different conditions depending on the electron and H2 fractions (, and ). The first branching is set by (see Figure 5): if the electron fraction is relatively high () nearly all the primary photoelectron energy goes into heating through Coulomb interactions between the secondary electrons and the ambient thermal electrons (Swartz et al., 1971, Dalgarno et al., 1999). By contrast, in the low-ionization limit () only of the primary photoelectron energy goes into Coulomb heating while is expended in excitation processes, and the remainder in ionization processes (Glassgold et al., 2012). To summarize, the XDR heating due to Coloumb interactions can be parameterized in terms of the energy deposition rate , as , where is the Coloumb heating efficiency (Shull & van Steenberg, 1985, Dalgarno et al., 1999, Meijerink & Spaans, 2005, Glassgold et al., 2012). The excitation and/or ionization heating are instead mainly influenced by the H2/H I ratio because , having a wide variety of energy levels, offers more channels for energy loss than those of pure atomic hydrogen. In atomic gas (), the secondary electrons collisionally excite Lyman- (Shull & van Steenberg, 1985) and once their energy drops below , all the remaining electron energy goes into heating through elastic scattering with H and thermal electrons (Dalgarno et al., 1999). In this case the X-ray heating efficiency is only 12%, whereas in molecular gas it can be up to 50% at very high densities (Glassgold et al., 2012). If the H2 fraction is high, , the initial energy is deposited as heat into the gas through several processes. Among the possible mechanisms there is the excitation of the rovibrational levels of the molecules and the electronic excitation of H2 followed by fluorescence to states. If the gas density exceeds the critical densities of such transitions (), then the collisional de-excitation (Tiné et al., 1997) results in net heating (Meijerink & Spaans, 2005, Glassgold et al., 2012). Additionally, heating is produced by the excitation to dissociative states (Dalgarno et al., 1999, Glassgold et al., 2012) which injects energetic H atoms that then thermalize. A peculiarity of XDRs is the abundant presence of produced in secondary ionizations. These molecular ions react with to produce . The may further undergo an exothermic dissociative recombination with an electron or a proton-transfer reaction as e.g., in . The molecular ions can undergo an exothermic dissociative recombination thus adding to gas heating. If the density is high enough for collisional de-excitation of vibrationally excited H2, then in the limit of and , the total maximum heating is Q=18.7 eV per ion pair.
4.3 Gas Cooling
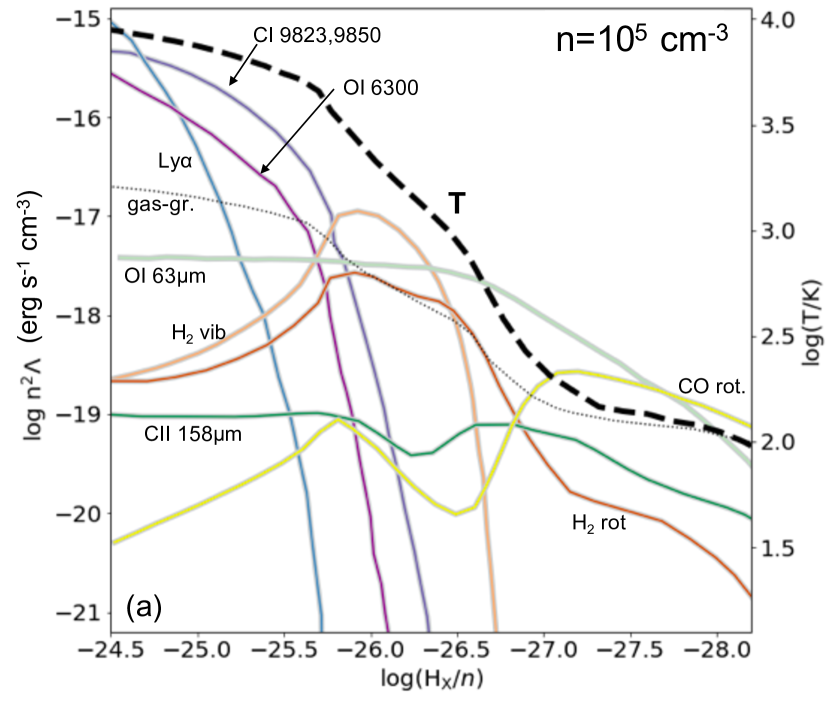
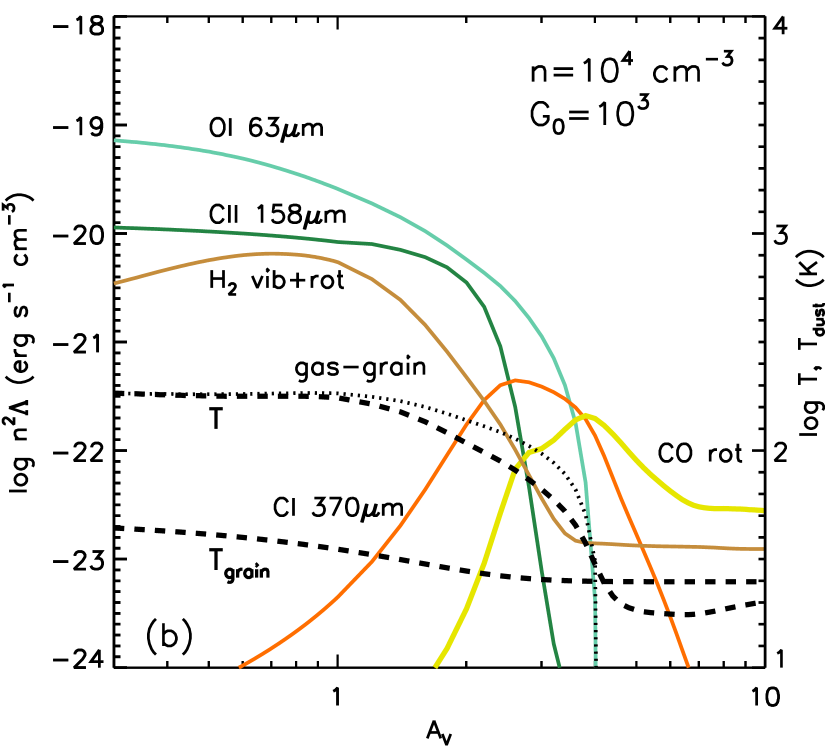
The deep penetration of X-ray photons heats the gas to high column densities. In thermal equilibrium, the heating is balanced by cooling, and the neutral and molecular gas stays warm to high column densities with the heating, cooling and temperature a function of (see Figure 6a. Also shown for comparison is a typical PDR in Figure 6b). One peculiarity of XDR cooling compared to PDRs is the overall higher ratio of the energy radiated as line emission over that emitted as infrared continuum (Maloney et al., 1996). That is, gas cooling/grain cooling is higher than in PDRs. While in PDRs almost all the FUV photon energy absorbed by dust is re-irradiated in the infrared, in XDRs about half of the energy is deposited into the gas and thus the cooling lines can carry a large fraction of the total deposited energy (Maloney et al., 1996, Meijerink et al., 2007). For high , the predominantly ionized gas () is characterized by , as sketched in Figure 4 and shown by the temperature profile in Figure 6a. Thermal collisions can thus excite Ly (e.g., Sternberg & Dalgarno, 1989), and forbidden lines such as [C I] 9823,9850 (e.g., Escalante et al., 1991), and [O I] 6300,6363 (e.g., Störzer & Hollenbach, 2000) that dominate the cooling. The [Fe II] 1.26 and 1.64 m lines are also efficient coolants for high X-ray illumination, temperature, and density as the upper state of the 1.64 m line lies about above the ground state. As decreases, the abundance increases while the gas temperature remains warm (). These conditions favor the excitation of rovibrational transitions that significantly contribute to the cooling (Sternberg & Dalgarno, 1989, Neufeld & Kaufman, 1993, Le Bourlot et al., 1999, Spaans & Meijerink, 2008, Glover & Abel, 2008, Lique, 2015). The range of values for which vibrational lines dominate the cooling are rather narrow because the first two vibrational levels ( and ) lie at and above the ground state, respectively (see Fig. 3 in Shaw et al., 2005). In particular, for the 1-0 S(1) 2.122 m transition significantly contributes to the total cooling, while once the temperature falls below the cooling is dominated by rotational lines in : 0-0 S(0) 28.22 m, 0-0 S(1) 17.03 m, 0-0 S(2) 12.28 m, and 0-0 S(3) 9.66 m.131313 The H2 spectroscopic notation reads as follows: the first two numbers refer to the vibrational level transition, the letter indicates the branch (S corresponding to transitions between rotational states with ), and the number in parenthesis is the rotational quantum number of the final state. For instance 1-0 S(1) stands for: () (). A recent analytic approximation of the cooling function can be found in Moseley et al. (2021).
Deeper into the XDR the temperature decreases () and the [O I] 63 m, [Si II] 35 m, and [C II] 158 m lines become the major coolants (Maloney et al., 1996, Meijerink et al., 2007). The [O I] 63 m cooling ( cm-3, ) is particularly efficient because warm temperatures () remain at high column densities where the oxygen is neutral. XDRs are thus characterized by high [O I]/[C II] ratios () as compared to values in PDRs (Maloney et al., 1996, Hollenbach & Gorti, 2009). XDRs also feature high [Si II]/[C II] ratios (Meijerink et al., 2007) reflecting the high abundance that results both from X-ray induced secondary ionizations and from those produced by Lyman and Werner photons following H2 excitation. As declines further, the neutral carbon [C I] 370 m and 609 m fine-structure transitions become important coolants (Bisbas et al., 2021). Enhanced [C I] emission as compared to PDRs is another peculiarity of XDRs as abundant C coexists with C+ through a thick layer in XDRs (see Section 4). In the same range of significant cooling is produced by high- CO rotational transitions which are exceptionally bright in XDRs, boosted by the warm () temperature at high column densities maintained by X-ray penetration (Meijerink et al., 2007, Spaans & Meijerink, 2008). By contrast, in typical PDRs most of the CO is present beyond the H/H2 transition at much lower temperatures ( K), which do not allow for bright high- emission. Other coolants of the warm molecular gas in XDRs are , , rotational lines. Goldsmith & Kauffmann (2017) found that electron excitation of HCN, HCO+, CN, and CS might be important. This might be especially relevant when using HCN/HCO+ ratios as a diagnostic for inferring the presence of XDRs in external galaxies (see Section 5.3.2). In the lowest regime the gas-grain collisions become an important cooling mechanism as the gas is warmer than the dust due to the effect of X-ray penetration and can therefore be cooled by collision with lower temperature dust grains (Maloney et al., 1996).
4.4 Chemistry
X-ray dominated regions are characterized by a peculiar chemistry initiated by the secondary ionizations resulting from the ejection of primary photoelectrons, and by the effect of internally generated Lyman and Werner photons arising from the decay of H2 excited states. These processes are generally more important than the effect of direct X-ray ionizations and dissociations. Numerous studies have explored the effects of X-ray irradiation on the chemistry of the ISM (Maloney et al., 1996, Meijerink & Spaans, 2005, Stäuber et al., 2005) assuming steady-state for the temperature and the abundances of the different species. Maloney et al. (1996) considered a chemical network focused primarily on carbon and oxygen, whereas the Meijerink & Spaans (2005) network included all species with sizes up to 3 atoms and some of 4 atoms and adopted the UMIST database for the chemical reaction rates. The chemical signature of X-ray induced processes can be retrieved from the abundances of key species. We highlight below and in Table 1 the major formation/destruction pathways that differ from PDRs.
The Hydrogen and Helium chemistry can be summarized as follows: (He+), resulting from H2 (He) collisional ionization produced by primary electrons trigger an X-ray characteristic chemistry which is similar to that induced by cosmic rays. These ions, whose abundance is particularly enhanced in XDRs, together with resulting from reactions of H2 with , efficiently exchange charge with neutral constituents (e.g., O, CO, OH, ) producing (molecular) ions.
The O-bearing molecular ions (OH+, and ) are overall enhanced in gas irradiated by X-rays (Maloney et al., 1996, Meijerink & Spaans, 2005). Among them, is produced either through the reaction of atomic oxygen with , or between ionized oxygen and H2. Note that the presence of ionized oxygen where the H2 is abundant is due to charge transfer reactions between O and H+ following X-ray induced ionizations of H. OH+ can also be formed in reactions between He+ and . The OH+ forms and, subsequently, by reactions with H2. For , models predict an order of magnitude greater abundance in XDRs than in PDRs. The / ratio is as large as in XDR models, while the ratios in PDRs are generally or less (van der Tak et al., 2008). This enhancement has been observed in relation to a strong X-ray illumination in the center of AGN host galaxy NGC 1068 (e.g., Aalto et al., 2011).
A feature of carbon chemistry in XDRs, which is also shared with environments characterized by high cosmic-ray fluxes (Bisbas et al., 2021), is the lack of the well defined C+/C/CO stratification that characterizes PDRs (Meijerink & Spaans, 2005, Meijerink et al., 2007). The C+ and C coexist through the XDR layers because the internally produced FUV photons cause CO dissociation and C ionization much deeper than in PDRs. In XDRs there is another viable path for the production of C+ through charge exchange reactions involving He+ which, for high X-ray fluxes, dominates over the carbon photoionization induced by FUV photons. The abundance of CO+ is enhanced in regions affected by strong UV and X-ray radiation fields (Wolfire et al., 1995b). At low , C is destroyed by reactions with abundant molecular ions such as and which are enhanced by the reactions of and with CO, and of C+ with (Lepp & Dalgarno, 1996).
| MAJOR FORMATION PATHWAYS | MAJOR DESTRUCTION PATHWAYS | ||||||||
| Hydrogen and Helium chemistry | |||||||||
| H2 |
|
|
|||||||
| H | - Secondary ionizations: H2+ H + 2 | - Reaction with H2 to form H | |||||||
| H | - Reaction of H with H2 | - H + X HX+ +H2 where X is O, CO, OH, H2O | |||||||
| He+ | - Secondary ionizations: He+ He+ + 2 | - Charge exchange reactions: He+ + XY He + X + Y+ | |||||||
| Oxygen chemistry | |||||||||
| O+ | - Charge exchange of O with H+ | - Reaction with H2: O+ + H2 OH+ + H | |||||||
| OH+ |
|
|
|||||||
| OH |
|
- At high temperature OH reacts with H2 to form H2O | |||||||
| H2O+, H3O+ |
|
- Dissociative recombination of H3O+ with | |||||||
| H2O |
|
|
|||||||
| Carbon chemistry | |||||||||
| C | - Photodissociation of CO by internally generated FUV photons |
|
|||||||
| C+ |
|
|
|||||||
| CO+ |
|
- Reactions of CO+ with H2 | |||||||
| HCO+ |
|
|
|||||||
| Sulfur chemistry | |||||||||
| S+ | - Photoionization of S due to the internally generated FUV photons | - Reaction with H2, OH, O2 | |||||||
| S2+ | - X-ray photoionization | - Reaction with H2 | |||||||
| SO+ SH+ |
|
- Electron recombination reactions | |||||||
| Nitrogen chemistry | |||||||||
| N+ |
|
|
|||||||
|
|
|
|||||||
The sulfur chemistry is also affected by X-rays because the internally produced FUV field dissociates SH, followed by direct X-ray photoionization of sulfur, which enhance S2+ column densities with respect to PDRs. Reactions of S+ with OH, and or HCO+ with OH produce SO+ and SH+ respectively, which are also particularly abundant in XDRs. As outlined by Abel et al. (2008) and Godard et al. (2012), SH+ can be formed also via another channel involving S2+ and H2. If the branching ratio of S2+ + H2 SH+ exceeds 1%, compared to other reaction products, then the double ionized chemistry will be the dominant pathway to SH+.
X-ray induced FUV photon production and the presence of He+ in XDRs influence the nitrogen chemistry by dissociation. The atomic nitrogen initiates a series of reactions which ultimately enhance HCN abundance. In particular N reacts with OH to form NO, which subsequently reacts with C to form CN. HCN and HNC are formed in almost equal amounts through the dissociative recombination of HCNH+, and through reactions of CN with H2. The abundance difference between HCN and HNC are thus largely determined by the selective destruction pathways of HNC which have relatively high activation barrier. For this reason low HNC-to-HCN line ratios generally indicate warm temperatures (e.g., Hacar et al., 2020). In XDRs, for high , HNC/HCN is lower than in PDRs. At high column densities, where is low (and so is the temperature), HNC/HCN ratios are equal or somewhat higher than those of PDRs (Meijerink & Spaans, 2005).
The most recent and comprehensive discussion concerning the physics and chemistry of water in star forming regions (van Dishoeck et al., 2021) is also relevant for those interested in XDR chemistry because the impact of X-ray irradiation on the H2O abundance is also addressed. In astrophysical environments three pathways lead to (see Fig. 4 in van Dishoeck et al., 2021, and references therein). The first route is through neutral-neutral reactions , that contribute to the water formation only at high temperatures ( K; van Dishoeck et al., 2013), the second route involves ion-molecule reactions (e.g., Hollenbach et al., 2009, Stäuber et al., 2005) that are effective in diffuse and moderately ionized gas, and the third route is by grain surface reactions (Notsu et al., 2021) because at low K water is efficiently formed by hydrogenation of oxygen atoms sticking onto dust grains (Cuppen et al., 2010). Thus, accounting for thermal and non-thermal gas-grain interactions and for grain-surface reactions is fundamental (Meijerink et al., 2012, Notsu et al., 2021).
Gas-phase destruction of molecules by X-ray chemistry and X-ray-induced photodesorption are important processes as well (e.g., Dupuy et al., 2018, Notsu et al., 2021). Gas-phase water is mainly destroyed by ion-molecule reactions (with X-ray boosted HCO+, H+, , He+) and by X-ray induced photodissociation (to H+OH; Meijerink et al., 2012). This might explain the low gas-phase abundance of warm water in the inner regions of protostellar envelopes (Notsu et al., 2021). Meijerink et al. (2012) instead, studied the possibility of enhanced gas phase abundance in X-ray exposed environments using (bare) carbonaceous dust grains as a catalyst. Outside the snowline, the gas-phase abundance of water is likely increased by X-ray photodesorption from icy grains, although results are very sensitive to the photodesorption rates assumed (see Notsu et al., 2021, which acknowledge that they might be overestimated).
Thermal equilibrium and chemical balance are often assumed when comparing PDR vs XDR chemical composition but time-dependence and non-equilibrium conditions are often relevant in many astrophysical environments. For instance, short-term X-ray flaring is common in young solar mass stars, and AGN activity varies due to strong fluctuations in the super massive black hole accretion rate. Meijerink et al. (2013) included time dependence in their XDR code and found that tracers such as the HCO+/HCN ratio (see Section 5.3.2) are strongly time-dependent (see also Harada et al., 2013). Strong evolutionary trends, occurring over time scales Myr are also found for , CO, and . These species reflect time dependent effects in the ionization balance, the transient nature of the production of molecular gas, and the freeze-out/sublimation of water (key to much of the grain surface chemistry), respectively. Viti (2017) also addressed time-dependence in XDR-like environments with UCLCHEM, focusing on the four most observed species (CO, HCN, HCO+, and CS). Among them, HCN is the most affected by time-dependence followed by CS. Recently, Waggoner & Cleeves (2019) addressed the effect of time-dependence on water chemistry reporting a significant but short-lived (days) boost in gas-phase abundance. Mackey et al. (2019) presented a non-equilibrium XDR chemistry calculation using a simplified chemical network of 17 species to study the time-dependent response of a molecular cloud to X-ray flares, emphasizing the faster destruction of CO by an internally generated FUV field as compared to H2. Using KROME (Grassi et al., 2014), Liu et al. (2020) presented a time-dependent study of the molecular chemistry of the Galaxy as resulting from the putative past AGN activity of Sgr∗. In particular, H2O, CH3OH, and H2CO abundances are enhanced with respect to the baseline model without X-ray irradiation both in the gas phase and on the dust grain surface up to 10 Myrs after the turn off of the X-ray source.
5 Using Models to Analyze Observations
5.1 Overview
Since the mid 70’s (e.g., Glassgold & Langer, 1975, Black & Dalgarno, 1977) several groups have developed PDR codes that are either directly available for download, or make their output available on-line. These include the model derived from the original TH85 code (Kaufman et al., 1999, 2006, Neufeld & Wolfire, 2016), the UCL-PDR code (Papadopoulos et al., 2002, Bell et al., 2006, Priestley et al., 2017), CLOUDY (Abel et al., 2005, Ferland et al., 2013, 2017), the Meudon PDR code (Le Petit et al., 2006, Le Bourlot et al., 2012, Bron et al., 2014) and KOSMA- (Röllig et al., 2006, Cubick et al., 2008, Röllig et al., 2013). Meijerink & Spaans (2005) emphasized modelling XDRs, but we note that now also CLOUDY (Ferland et al., 2017) explicitly handles XDR calculations. The majority of these models are 1-dimensional and steady-state. We discuss multi-dimensional and time-dependent models in Section 6. Specific PDR and XDR codes have also been developed for distinct applications, especially for the study of protoplanetary disks. We will not review the disk models here (see Bergin et al., 2007, Öberg & Bergin, 2021).
The considerable heterogeneity among models (including their geometry, physical and chemical structure, choice of parameters) makes the comparison between them challenging. Nevertheless, a number of benchmark models have been created to understand where different results originate and, as much as possible, converge on a common solution for a common input. Röllig et al. (2007) give a detailed report of the 2004 Lorentz Center workshop comparing 10 different PDR codes. An additional Lorentz Center workshop on the CO ladder from both PDR and XDR models was held in 2012 with results that can be found on-line at https://markusroellig.github.io/research/CO-workshop/. Even using consistent inputs and similar microphysics there is considerable range in the outputs in the gas temperatures, abundances, and line intensities. From the first workshop, for typical PDR conditions and neglecting the obvious outliers, the [C II] line is most consistent between models and varies within a factor of depending on . The next most consistent are the [O I] lines (varying by a factor and the least consistent are the [C I] lines. From the second workshop, the CO ladder line intensities can vary by 10-100 between models for similar inputs. The largest differences are likely due to differences in gas temperature where the lines are produced. The gas temperatures typically vary between models by factors of 2-3 at , but are seen to vary by as much as a factor 4-10 at , but also at between models with unconstrained microphysics. The most extreme variations occur for the test run , (see also Bruderer et al., 2012). The temperature differences could be the result of a thermal instability that rapidly drives gas temperatures from K to K with only minor differences in the heating/cooling rates. In addition, the details of the formation rates, vibrational heating rates, and photoelectric heating rates can cause large differences in gas temperature and are especially important for the prediction of and high-J CO line intensities. The conclusion from Röllig et al. (2007) is that the model outputs for specific densities and radiation fields should not be considered exact results but should instead be used as guides to the physical conditions. The choice of a specific code to compare to observations should be motivated by the physics and chemistry included in the code but also the characteristics (in terms of geometry, density profile, etc.) most adapted to the emission source. See Röllig et al. (2007) for a guide to PDR model characteristics while noting that many codes have been in continuous update since the workshops and another workshop would be well worth revisiting.
5.2 Main input parameters
An important parameter of the models is the incident radiation field. The field can be adjusted in several ways including setting the shape, strength, and geometry (isotropic, uni-directional, external vs internal source for spherical clouds, or one-sided vs two-sided for slabs). Several scalings of the FUV field are in use based on estimates of the local Galactic interstellar radiation field (see Table 2). For comparison, it is convenient to refer to the integrated energy density , where is the mean intensity and the specific intensity. The value of equals for an isotropic field only. When integrating over the surface of a semi-infinite cloud illuminated over and taking into account backscattering from grains, (Le Petit et al., 2006, Röllig et al., 2013).
The Habing field (Habing, 1968), noted as , when integrated over a range of energies 6 eV eV, has an energy density erg corresponding to an isotropic intensity of erg . The 1-D flux is the unidirectional flux equivalent to the total flux incident on a sphere in the isotropic radiation field erg . Other fields that are in use are the Mathis field (; Mathis et al. 1983, Weingartner & Draine 2001c) and the Draine field (; Draine 1978). In terms of the Habing field, the median local Galactic interstellar radiation field is estimated to be (Parravano et al., 2003), comparable to the Draine field, while for the PDR behind the Trapezium cluster.
For XDR codes the incident radiation flux between 1-100 keV, (in ) is instead the required input parameter. For historical reasons (Maloney et al., 1996), the impinging radiation is generally assumed to follow a powerlaw distribution, , with a low energy cut-off at 1 keV. In Meijerink et al. (2007), is chosen, while CLOUDY has a default . This is a good approximation of the X-ray regime of the spectral energy distribution (SED) of AGN. Note that the 1-100 keV range is only a fraction of the total AGN SED, which is also bright in the mid-infrared, optical and ultraviolet. XDR models including the total AGN SED instead of the standard power-law for the incident radiation, produce different kinetic temperatures, mid-infrared line intensities, and low level populations of despite being normalized to have the same between 1-100 keV (Ferland et al., 2013). XDR models are also used to derive the gas conditions in the vicinity of young stellar objects. The incident photon flux is then expressed in terms of the spectrum of a thermal plasma in units of photons s-1 cm-2 eV-1, where is the radius in the envelope from the central protostar, and is the temperature of the X-ray emitting plasma. In this case, the spectrum goes as an exponential and falls off more steeply at high column than a power-law.
| Energy Density | Isotropic Intensity | 1-D Flux | Examples | ||
|---|---|---|---|---|---|
| Notation | (erg ) | (erg ) | (erg ) | Ref. | of codes |
| [1] | UCL-PDR | ||||
| [2] | KOSMA- | ||||
| [3] | Meudonb |
aEnergy density, Isotropic Intensity, and 1-D flux for unit values of radiation fields , , and . Quantities are integrated over 6 eV to 13.6 eV unless otherwise noted. The Meudon code assumes limits of 912 Å to 2400 Å or 13.6 eV to 5.166 eV, resulting in energy densities of (erg ), (erg ), and (erg ) for , , and respectively.; bCan also use the Draine field. References: [1] Habing (1968); [2] Draine (1978); [3] Mathis et al. (1983).
In addition to the radiation field, the cosmic-ray ionisation rate is also a necessary input. This is usually given as the total (including secondaries) ionization rate per H2, , but may also be given as the primary ionization rate per H, , where the rate per H2 is higher by a factor .
The abundances of gas phase metals, PAHs, and large grains affect the cooling rates heating rates, and conversion between and column density, . These initially vary linearly with metallicity, Z⊙, where Z⊙ is the metallicity with respect to solar, but are observed to have different dependencies for Z⊙ (Gordon et al., 2003, Sandstrom et al., 2010, Rémy-Ruyer et al., 2014) and the model results will depend on the relative variations (see e.g., Röllig et al. 2006, and Jameson et al. 2018). In light of other uncertainties a linear dependence with Z⊙ is often assumed.
The choice of geometry is also important to consider. Many models adopt a plane-parallel slab of fixed width in terms of (or with a stopping condition provided as input), while others have spherical clouds with central cavities, spherical clumps, or distributions of clumps. Several density structures can be adopted, such as constant density, constant pressure, or a user specified density law. The adopted model for the photoelectric heating is also important and can result in significant temperature variations. Finally, different models include different chemical networks and elemental abundances. The species, reactions, and rates that are used have an impact on the resulting predictions.
5.3 Diagnostic plots
Combinations of line intensities and dust continuum can be used to constrain the physical conditions of the gas in PDRs and XDRs, as well as to distinguish between excitation sources (PDR, XDR, shocks). We describe here how some of the commonly observed line intensities and line ratios lead to predictions of the incident radiation field strength and gas density in the PDRs and XDRs, and help to distinguish between different heating processes.
5.3.1 Diagnostic to determine the gas density , and radiation field strength,
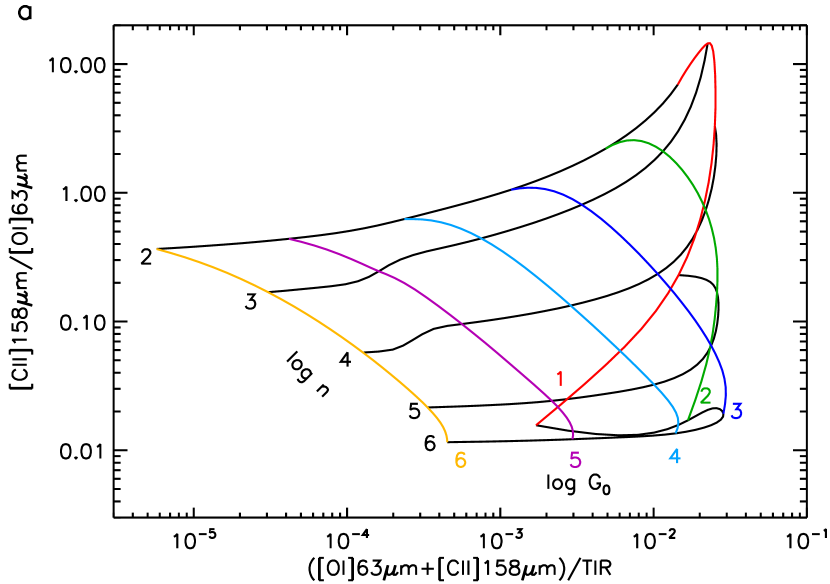
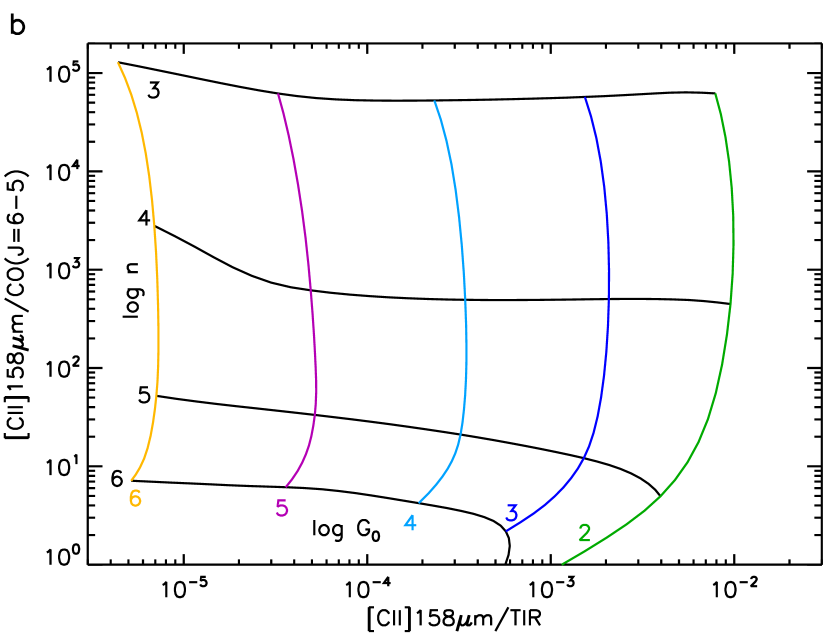
The PDR model used here is based on that described in Wolfire et al. (2010), Hollenbach et al. (2012), and Neufeld & Wolfire (2016). We use a maximum , freeze out turned off, and a power-law dependence of the cosmic-ray ionization rate . The [C II]/[O I] 63 m ratio is a good diagnostic for density since for , the critical density for [C II], this ratio will be a strong function of density, and for [O I] cooling is important. The ratio ([C II] + [O I])/TIR is a measure of the heating efficiency (Section 3.3) where TIR is the total (3 m-) infrared integrated dust continuum. The combination of these two ratios (Figure 7a), are useful to obtain physical conditions (gas density and radiation field strength) directly from plotted observations. Figure 7b shows [C II]/CO () versus [C II]/TIR and is an example that is especially useful for high density regions where CO () emission is produced. The CO () line is often near the peak of the CO ladder (Figure 8) in extragalactic observations and is often the brightest (or even the only) line observed. For the model plots, we assume the TIR intensity is where the factor of 2 accounts for dust heating by stellar optical radiation and by EUV radiation emitted by the star that is converted by line emission to optical radiation. The observed continuum intensity to plot on the model grids should ideally be the TIR. However, in practice, the integrated intensity depends on the wavelength range of the available observations. For m, generally referred to as the FIR continuum, depending on the grain temperature. See e.g., Dale & Helou (2002) to convert between TIR and FIR. Additional on-line plots and model results can be found at https://dustem.astro.umd.edu or https://ism.obspm.fr for the models included here and for the Meudon code respectively. Both also include the KOSMA- models. The on-line tools can analyze both pointed observations and maps.
Diagnostic plots typically use ratios of intensities rather than absolute values. This is justified because the model outputs are for unit beam filling factor, . For unresolved sources, and using line ratios has the advantage of cancelling the beam filling factor. However, if the emitting regions for different lines have substantially different filling factors, then the intensities used in the ratio should account for these differences as best as possible (see e.g., Wolfire et al. 1990, Kaufman et al. 1999, for a typical procedure). Once the physical conditions are estimated from diagnostic plots, the beam filling factor can be derived by comparing the model with the observed intensity, . Note that the filling factor is less than 1 for unresolved sources but can be greater than 1 for several PDRs along the line of sight. The covering factor, discussed by Cormier et al. (2019), is the fraction of the H II region surrounded by neutral PDR gas. This can be calculated using models that include both the ionized and neutral gas (e.g., CLOUDY). In a sample of low-metallicity galaxies, Cormier et al. (2019) find PDR covering factors , with a median value of 0.4, and show that the PDR covering factor decreases with metallicity (see Section 8.4).
Simple, model independent estimates can be made for , , and (e.g., Pabst et al., 2017). From the distribution of OB stars on the sky, the maximum is with the projected distance in cm between the source and PDR, and the stellar luminosity in erg . This maximum and the estimated from a PDR model are compared to determine the true (rather than projected) distance between an FUV source and the illuminated PDR and thus reveal the 3-dimensional geometry of a region. This method has been used for example to establish that the PDRs in 30 Doradus that seem close to the central cluster in projection are actually located at more than 40 pc away from it (Pellegrini et al., 2011, Chevance et al., 2016), and to measure the deprojected distance of the Trapezium stars to the Orion bar (0.33-0.45 pc, Salgado et al., 2016). From the physical distance, , between [C II] and CO emission peaks observed in a resolved edge-on PDR, and assuming an between the and CO transitions, the density can be estimated from where is measured in cm. Pabst et al. (2017) use this method to find in the Horsehead PDR and surrounding region. Finally, the gas temperature can be inferred from the peak [C II] line brightness and estimate of gas density, and from H2 pure rotational lines. Typical gas temperatures found are between 100 and 500 K (e.g. Young Owl et al., 2002, Pabst et al., 2021).
5.3.2 Diagnostics to distinguish X-rays from other heating mechanisms
Differences in the temperature and chemical abundance structure between PDRs and XDRs (Sections 3 and 4) can be leveraged to infer the presence of an XDR, despite the challenge – as we will discuss later in this Section – of distinguishing X-ray from cosmic-ray or shock heating.

The [Si II] 35 m/[C II] 158 m, [O I] 63 m/[C II] 158 m, and [Fe II] 26 m/[C II] 158 m, ratios are all larger in XDRs than in PDRs (Meijerink et al., 2007). The same holds true – albeit with caveats on similar results from an enhanced cosmic-ray rate (Bisbas et al., 2017, 2021) – for [C I]/CO and [C I]/[C II]. These ratios are often used as diagnostics in the circumnuclear disk of AGN (e.g Izumi et al., 2020) and in high- quasar host galaxies (e.g. Venemans et al., 2017, see Section 9).
The whole CO ladder of AGN host sources can be another valuable tool to infer the presence of an XDR component contributing to the gas heating (Bradford et al., 2009, van der Werf et al., 2010, Hailey-Dunsheath et al., 2012, Pozzi et al., 2017, Mingozzi et al., 2018, Valentino et al., 2021) as XDRs are characterized by large column densities of warm molecular gas, where high- CO lines () can be efficiently excited. For this reason the CO Spectral Line Energy Distribution (SLED) resulting from XDR models peaks at increasingly higher for increasing X-ray flux (Vallini et al., 2019, and see Figure 8), even though CO emission can be suppressed by X-ray induced CO dissociation (Section 4.4) at intermediate column densities (Kawamuro et al., 2020). As a caveat, note that mechanical heating from shocks can boost high- CO lines either on galactic scales (e.g. Meijerink et al., 2013, Bellocchi et al., 2020, as resulting from outflows and/or merger activity) or in resolved molecular complexes (Lee et al., 2016). Kazandjian et al. (2015) show that the temperature of the molecular gas can be significantly increased by a small amount of mechanical heating from stellar feedback in the form of stellar winds and supernovae, although we note that the mechanical energy input may be fairly localized in the star-forming regions and may be dissipated in neutral atomic or ionized gas (Lancaster et al., 2021a, b), thus having much less an impact on the bulk of the molecular gas. While the emission from low- CO lines only moderately increases with mechanical heating, high- CO line emission can increase by several orders of magnitude in clouds with and a galactic star formation rate of 1 M⊙ yr-1. For spatially resolved observations towards dense ( ) clumps in molecular clouds, the differentiation between PDRs and XDRs based on the peak of the CO ladder breaks down as high-density PDRs produce bright high- CO lines (Burton et al., 1990, Joblin et al., 2018, Wu et al., 2018). Note however that on galactic scales, high density PDR contributions to high- CO emission are generally diluted by low filling factors (Indriolo et al., 2017).
The use of line ratios involving high density tracers (such as HCN and HCO+ lines) as XDR diagnostics can be valuable but it is still debated given the non-trivial effects of gas density, temperature, opacity, and time-dependence (see Fig.1 in Viti, 2017). XDR models (Meijerink et al., 2007) indicate that HCN/HCO+ abundance ratios exceed that of PDRs only when , and . Below these limits, the enhanced abundance of HCO+ in XDRs (see Section 4.4) drives the ratio below that of dense PDRs. Note that HCN emission can be boosted by IR pumping (Costagliola et al., 2011, Martín et al., 2015, Vollmer et al., 2017, Harada et al., 2018) and electron impact excitation in XDRs (Goldsmith & Kauffmann, 2017). A combination of HCN/HCO+ ratios with HNC/HCN represents another set of valuable diagnostics, as outlined in Baan et al. (2008), Loenen et al. (2008) and recently in Krieger et al. (2020) where such diagrams have been exploited to study the heating mechanisms in star forming regions within NGC 253 (Figure 9). In particular the higher HNC/HCN abundance ratios in XDRs as compared to PDRs at large column densities (Baan et al., 2008, Loenen et al., 2008, and discussion in Section 4.4) make HCN/HNC intensity ratios in XDRs somewhat higher than those in PDRs. A caveat is that, as for HCN/HCO+, IR-pumping (Aalto et al., 2007) and shock heating could produce similar effects (Cañameras et al., 2021). Meijerink et al. (2007) and Harada et al. (2013) also suggest CN/HCN as a potential XDR-vs-PDR diagnostic because the column density ratios for PDRs and XDRs are very different, ranging from 40-1000 in the XDRs, to 0.5-2 in PDRs. Nevertheless, only relatively modest CN enhancements have been reported in circumnuclear disks of three AGN (Ledger et al., 2021).
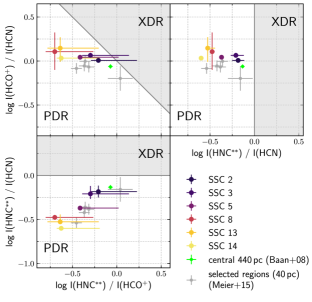
Observations of CH/CO ratios in four nearby AGN host galaxies (Rangwala et al., 2014) reveal values times higher than expected in normal galaxies, thus suggesting that CH/CO could have some potential as an XDR diagnostic. Rangwala et al. (2014) supported this conclusion by noting that Meijerink et al. (2007) models return CH abundances that are significantly enhanced relative to other molecules in XDRs. A discussion concerning the PDR vs XDR impact on the abundances of hydrides (CH+, OH+, H2O+, CH) in the context of young stellar objects is presented in Benz et al. (2016). By studying CH+/OH+, OH+/H2O+, and C+/CH+ Benz et al. (2016) find no chemical evidence for X-ray induced chemistry and put tight constrains on the (negligible) contribution of an XDR component to the observed emission.
Distinguishing an XDR from an environment characterized by high cosmic-ray rates is instead rather difficult, both in external galaxies where observations encompass very extended gas patches (Meijerink et al., 2006), and in the envelopes of young stellar objects (Bruderer et al., 2009b). The non-thermal electrons resulting from cosmic-ray and X-ray ionizations interact in a similar way with the atomic or molecular gas (Glassgold et al., 2012), thus producing comparable heating and chemistry (e.g., high [C I]/CO and [C I]/[C II] ratios; Bisbas et al. 2017, 2021). For this reason, enhanced cosmic-ray flux is sometimes used to “mimic” XDR-like conditions (Bayet et al., 2011, Viti, 2017). The X-ray chemistry can be reproduced by means of an enhanced cosmic-ray ionization rate with deviations by less than 25% (Bruderer et al., 2009b). Meijerink et al. (2011) suggested that OH+/OH and /H2O ratios might help in distinguishing very high cosmic-ray rates from the typical XDR conditions at pc from an AGN of . A cloud of density at such distance from the galaxy center experiences an impinging , and is expected to have OH+/OH and /H2O column density ratios as high as and , compared to and for high CR rates (for ). However no attempts were made to model the resulting line emission. Vallini et al. (2019) found that cosmic rays can boost the mid/high- end of the CO ladder but not at the level observed in XDRs (see also Rangwala et al., 2011, for Arp 220).
The effect of mechanical heating needs to be considered before determining physical parameters of the gas even though estimating the contribution of stellar winds/supernovae to the mechanical heating in external galaxies is challenging. Meijerink et al. (2013) suggest that shock dominated ISM yields a much larger (up to times) CO-to-continuum ratio than XDRs because shocks heat the gas directly, with little heating of dust, and hence do not contribute appreciably to the IR luminosity (Pellegrini et al., 2013). Note that shock velocities km/s are required to preserve the CO from dissociation (Hollenbach & McKee, 1989). Fast ( km/s) shocks destroy the CO (although it can reform in post shock gas to some extent before getting too cold) and also produce optical and FUV photons which heat the grains, providing IR continuum.
5.4 Origin of [C II]
The ionisation potential of neutral carbon C (11.3 eV) is lower than that of neutral hydrogen (13.6 eV). As a result, the [C II] line can in principle originate both from the ionized and the neutral gas. In the Milky Way and in nearby galaxies, most studies have concluded that the vast majority of the [C II] originates from the neutral regions (e.g., Oberst et al., 2011, Pineda et al., 2014, Goicoechea et al., 2015, Croxall et al., 2017, Pabst et al., 2017, 2021). A low contribution from the ionized gas to the [C II] emission is also found at high-redshift, both observationally (e.g., Stacey et al., 2010, Gullberg et al., 2015) and in simulations (e.g., Olsen et al., 2015, Katz et al., 2017, Pallottini et al., 2017, Lagache et al., 2018). Typically, observations find the ionized gas contributes % to the [C II] emission.
The component of the neutral phase of the ISM that dominates the [C II] emission is still a matter of debate. Early suggestions were that [C II] is associated with molecular clouds (Stacey et al., 1985, Shibai et al., 1991) or the diffuse ISM (Bennett et al., 1994). The dominant component must depend on the observing scale and emission source (Mookerjea et al., 2016). Observations concentrating on Galactic star-forming regions generally find the dense, intensely illuminated gas, dominating the emission. Analysis of the line emission from unresolved normal galaxies finds that [C II] arises from PDRs of moderately high FUV fields and densities (Malhotra et al., 2001) with similar range found in resolved ( kpc) star forming regions in local galaxies (Sutter et al., 2021) and in low-metallicity dwarf galaxies (Cormier et al., 2019). These are usually interpreted as the bright classic PDRs. Extended mapping of [C II] in Orion (Goicoechea et al., 2015, Pabst et al., 2017, 2021), and a detailed PDR analysis of extragalactic H II regions (Abdullah et al., 2017) finds that the extended, moderately illuminated, molecular cloud surfaces can contribute significantly or dominate the emission. An analysis of the COBE [C II] emission in pc beams from the Orion-Eridanus superbubble (Abdullah & Tielens, 2020) finds that molecular cloud surfaces up to pc from the stellar clusters dominate the emission with a moderate field strength of and density . Because these projected beam sizes are comparable to those of the Herschel Space Observatory observations in nearby galaxies, Abdullah & Tielens (2020) suggest that the [C II] emission in these observations may be similarly dominated by moderately illuminated extended cloud surfaces. Such moderate field strengths are also found for the Galactic [C II] emission using the all-sky COBE [C II] survey (Cubick et al., 2008), the pointed GOT C+ survey (Pineda et al., 2013), and for dust SEDs in nearby galaxies in which only % of the infrared luminosity arises from dust that is illuminated by strong, , radiation fields (Aniano et al., 2020). The result that Galactic and extragalactic observations point to different sources of [C II] emission still needs to be reconciled, and is perhaps the result of mixing various gas components within the beam (e.g., surfaces of molecular clouds, diffuse atomic gas, moderately strong PDRs, dense PDRs, ionized gas).
One way of separating the different components of Galactic [C II] emission is to use velocity resolved observations, where the H I, CO, and [C II] can be separated along a line of sight due to Galactic rotation. Relying on such observations, Pineda et al. (2014) find that 30% of Galactic [C II] luminosity comes from dense PDRs, 25% from CO-dark gas, 25% from cold H I, and 20% from ionized gas. For extragalactic observations the multiphase ISM mixed in the beam can be partially separated by comparing velocity resolved H I, CO, and fine-structure line profiles. Tarantino et al. (2021) find about equal [C II] contributions from atomic and molecular gas in pc beams, while separate CO and CO-dark gas contributions could not be easily separated at these spatial resolutions. Lebouteiller et al. (2019) and Okada et al. (2019) observing the LMC find most of the [C II] arises in CO or CO-dark gas. The fraction of [C II] arising in the CO-dark gas is generally seen to increase with lower metallicity (see Section 8.4).
5.5 Caveats in using models to analyze observations
As with any comparison between observations and models, the interpretation must be done carefully. Several potential difficulties can alter the accuracy or validity of the conclusions. Below is a non-exhaustive list of common points requiring careful consideration.
-
•
Differences in model gas temperature. PDR model workshops have shown variations in gas temperatures by factors of 2-3 at with the same input parameters and microphysics but can vary by 4-10 when the microphysics are unconstrained (see Section 5.1, Röllig et al. 2007, and CO ladder workshop https://markusroellig.github.io/research/CO-workshop/). These differences can strongly affect the predicted line intensities that are sensitive to temperature such as the mid-infrared lines and the CO ladder. The exact density or radiation field strength predicted by the models will vary but they are still good guides for the general physical conditions and dominant physical processes.
-
•
Contribution from ionized gas. A correction must be applied to subtract the fraction of the [C II] emission arising in the ionized gas (e.g., Rubin, 1985, Abel et al., 2005, Kaufman et al., 2006). This can be done using the theoretical [C II]/[N II] 205 m ratio that is nearly constant () with (e.g., Oberst et al., 2011, Langer et al., 2016). If the [N II] 205 m line is unobserved, the [C II]/[N II] 122 m ratio may be used with an estimate of from the [S III] 18 m/[S III] 33 m ratio (sensitive to ) or from the thermal pressure in the PDR/H II region (e.g., Seo et al., 2019). Alternatively, the fraction of [C II] can be determined by comparing the resolved velocity distributions of tracers of the ionized, neutral and molecular gas (e.g., Pineda et al., 2013, Anderson et al., 2019, Lebouteiller et al., 2019, Seo et al., 2019). The fraction of [C II] originating from the ionized gas typically amounts to 5-30% and should be subtracted before analysis.
-
•
Mixing of components in the beam. The origin and spatial distribution of [C II] and [O I] (or any other diagnostic line) may not be similar. Especially in the case of extragalactic observations, multiple gas components with a variety of physical properties are mixed in a single, large beam. The [C II] emission tends to be widespread while [O I] tends to trace more compact, dense, and warm regions (e.g., Lebouteiller et al., 2019, Okada et al., 2019).
-
•
Origin of the FIR emission. Velocity-resolved observations may show multiple emitting components and thus a fraction of the FIR continuum needs to be assigned to each (Schneider et al., 2018). The fraction of [O I] (or [C II]) emission may be used as a rough guide.
- •
-
•
Edge-on effects. A PDR viewed edge-on can have different emerging line intensities than one viewed face-on and the intensities may vary across the source as deeper layers are observed (e.g., see Hogerheijde et al. 1995b for the edge-on Orion Bar PDR). The intensities depend on the column densities along the line-of-sight. For face-on PDRs, [O I] 63 m and [C II] are optically thick or marginally thick but other lines (e.g., [O I] 145 m, H2 rovibrational) are optically thin, so these increase in intensity with increasing column density compared to [O I] 63 m and [C II]. The FIR continuum is directly proportional to the line of sight column density. Several models (e.g., Meudon code) provide the intensities viewed at several angles. Calculations of edge-on models are described and shown in Pabst et al. (2017).
-
•
Radiation pressure on grains. Solutions with might be excluded since radiation pressure, photoelectric emission, and photodesorption forces would drive grains through the gas and are therefore not consistent with a steady-state model solution (Weingartner & Draine, 2001b, Hollenbach et al., 2012). However, if the magnetic field is perpendicular to the radiation, and charged grains are tied to the field, then this may not be an issue.
-
•
Degeneracy of diagnostics. Model fits using a combination of [O I], [C II] and FIR often present a degeneracy between a low -high and high -low solution, while model fits using CO and [C I] are degenerate between low -low and high -high solutions, highlighting the need for additional, independent, observational constraints (e.g., Okada et al., 2019).
6 Time Dependent and Multi-Dimensional Models
The 1-D picture of PDRs described in section 3.1 needs further context since for O and early B stars, both H II region evolution and molecular cloud photodissociation and photoevaporation modify the PDR boundary conditions and internal structure. The H II region is initially embedded within the molecular cloud and expands rapidly into the surrounding gas but shortly slows down and proceeds as a “D-type” ionization front (IF) (e.g., Spitzer, 1978). The high thermal pressure in the ionized gas compared to the molecular cloud produces a shock wave that sweeps up and compresses the ambient gas so that there is pressure equilibrium between the ionized and neutral gas. In addition, the FUV radiation dissociates the H2 in the compressed layer in a dissociation front (DF) (e.g., Hill & Hollenbach, 1978). It is this layer and the ambient cloud beyond that are the PDR. When the H II region breaks out of the cloud, the hot gas escapes into the ISM in a “champagne flow” also called a blister H II region (e.g., Tenorio-Tagle, 1979). Several forces may be acting to expand the H II region and PDR and to disrupt the cloud that are collectively known as stellar feedback (e.g., Lopez et al., 2014, Krumholz et al., 2019). These include thermal pressure from the ionized gas, stellar radiation pressure, photoevaporation, and supernovae shock waves. Strong stellar winds during the embedded phase produce a bubble of hot K shocked gas which further compresses the H II region (e.g., Castor et al., 1975, Weaver et al., 1977), although e.g., Rosen et al. (2014) and Lancaster et al. (2021a, b) suggest that, due to turbulent mixing, the effects of stellar winds are weaker than predicted by Castor and Weaver. After breakout, the hot gas escapes and the wind shocks at the H II region and propagates inward towards the star (in a reverse shock). The post-shock hot gas expands and imparts some momentum to the H II region and PDR. The EUV photon heating of the ionized gas and the FUV heating of the neutral gas (if it becomes sufficiently warm) can evaporate the cloud resulting in both cloud dispersal and an additional pressure on the neutral layer. We assess the stellar feedback terms including PDR observations in Section 7.1. {marginnote}[] \entryIFIonization front where EUV photons ionize hydrogen at the interface between the H II region and the PDR. {marginnote}[] \entryDFDissociation front where H2 is photodissociated by the external FUV radiation that penetrates into the PDR. {marginnote}[] \entryAdvectionTransport of material, (in this case H2) by the mean fluid flow.
Time-dependent PDR models with non steady-state chemistry are warranted if chemical time scales exceed the dynamical time scales. The time for H2 to come to chemical balance, , is often the slowest and therefore the most important to consider, while dynamical time scales depend on the physical process. Time dependence could be important in several cases: (1)there is rapid transport to a different radiation field or density compared to , such as resulting from advection towards the IF or DF, or advection between thermal phases in a turbulent medium, (2)the radiation field or the density change faster than such as in expanding shells in planetary nebulae, compression of an atomic cloud, or due to turbulent compression and rarefaction, and (3)chemical time scales are long compared to cloud lifetimes ( Myr, Chevance et al. 2020a) such as can occur for grain-surface chemistry.
The time scale for H2 to achieve chemical balance is (e.g., Bialy et al., 2017), where is the formation rate coefficient and is the local photodissociation rate including H2 self-shielding. In mainly atomic regions, where there is relatively little H2 shielding and is large compared to , then can be quite short ( yr) and H2 rapidly approaches the steady-state abundance. However, in atomic regions that are suddenly shielded so that is much larger than , can be quite long ( yr to reach predominantly molecular gas). Molecular regions may also be suddenly illuminated by intense FUV radiation as in the case of massive star formation. Although is large at the surface, the interior is still shielded so that and is long to reach steady state. We note that can be slower at lower metallicity due to a lower dust abundance thereby increasing (e.g., Hu et al., 2021). In contrast, may be a few times faster in warm PDR surfaces compared to diffuse gas, perhaps due to the ER mechanism and H2 formation on PAHs, and can effectively increase in turbulent gas due to positive density fluctuations (Glover & Mac Low, 2007). Sternberg et al. (2021) considered time scales in a dust free environment where the formation of H2 is dominated by gas-phase processes. Similar to the dusty case, for , yr, but for dense cm-3, well shielded regions where cosmic-ray chemistry dominates yr.
6.1 One-dimensional time dependent models
The propagation of the IF and DF into the PDR and the time-dependent effects on the PDR structure and emission are considered by e.g., Hollenbach & Natta (1995), Bertoldi & Draine (1996), Störzer & Hollenbach (1998), and Natta & Hollenbach (1998). In the frame of the IF, the H2 is advected towards the edge of the PDR with a maximum speed of km where and are the isothermal sound speeds in the PDR and H II region respectively. The maximum speed occurs during the blister stage where a photoevaporated flow drives gas off the PDR and into the H II region and is at a minimum for an embedded H II region within a cloud where the evaporated flow speed is much smaller.
As the advected H2 nears the FUV illuminated surface, the H2 abundance can be enhanced over steady state leading to enhanced FUV pumping and enhanced vibrational populations that affect both heating and chemistry. Advection becomes increasingly important as the travel time decreases, and the IF front and DF will merge for a travel time less than the dissociation time. The travel time is , where is the column density for an optical depth of one in the FUV ( ), leading to the constraint for a merged IF and DF, (with in and in . A smaller value of or larger is required if chemical reactions destroy H2, such as reactions with . If advection is important then the PDR is known as a non-stationary PDR, although a steady-state structure is established in the frame of the IF. The CO has a much shorter photodissociation timescale than H2, so that the transition and the [C II] and [O I] emission are less affected relative to a stationary case. Since typically km and (see Figure 13 with K) then advection is expected to be of marginal importance, however, for a rapidly expanding H II region and for FUV illuminated clumps where the density is higher, advection may become significant (see Section 7). In expanding shells surrounding planetary nebulae, the advection of H2 is rapid, and the FUV and EUV radiation, as well as the shell density, change on sufficiently short time scales so that time dependent H2 chemistry is required (Goldshmidt & Sternberg, 1995, Natta & Hollenbach, 1998).
Bron et al. (2018) followed the evolution of the IF and DF including photoevaporation in a plane parallel code for a range of incident radiation fields, densities, and stellar spectra. Photoevaporation, either by EUV or FUV photons can increase the thermal pressure at the cloud (or clump) edge by a factor of 2 (e.g., Gorti & Hollenbach, 2002, Tielens, 2005). Bron et al. (2018) find that the PDR remains nearly isobaric and thus, in the molecular layer, efficient cooling and decreased heating due to dust opacity results in a temperature drop and gradual compression by factors of . The compression will be less if turbulent or magnetic pressures contribute (e.g., Pérez-Beaupuits et al., 2015) and individual clumps of high thermal pressure would not arise out of a surrounding medium of lower thermal pressure. Instead of a gradual density increase, individual high density clumps can arise from FUV heating and compression of existing over-dense structures (Gorti & Hollenbach, 2002, Decataldo et al., 2019).
1-D codes in spherical geometry account for the divergence of the radiation field for central sources, or for surface illumination of spherical clouds, clumps, or disks. Dynamical H II region models in spherical geometry have been combined with PDR models to predict the time dependent IF and DF, the line cooling, and line emission across the H II region and PDR. Examples include Hosokawa & Inutsuka (2006), the WARPFIELD-EMP code (Pellegrini et al., 2020) and the MARION code (Kirsanova et al., 2020). The WARPFIELD-EMP code uses CLOUDY to calculate the H II/PDR properties while the MARION code uses an updated network from Röllig et al. (2007) for the PDR. In general, models that follow the H II region dynamics do not include a detailed calculation of the PDR chemistry and thermal balance, however, the combined H II/PDR codes offer a coherent treatment of both the dynamics and physical conditions giving rise to both the H II region and PDR emission. Spherical PDR codes have also been used to model irradiated disks such as the proplyds seen in Orion (Johnstone et al., 1998, Störzer & Hollenbach, 1999).
Depending on , , and , the chemical time scales for grain surface reactions can become comparable to cloud life times for gas at moderately high , and time dependence becomes important (Bergin et al., 2000, Hollenbach et al., 2009). Estimates of time scales for various processes are given in Hollenbach et al. (2009). For example, the adsorption time for species is yrs where is the mass of oxygen. For CO at cloud densities , and K the adsorption time is yrs. At long time scales yrs, and large depths the gas-phase C/O ratio can become greater than 1 (Hollenbach et al., 2009). This is because of the slow dissociation of CO by produced by cosmic-ray ionizations. The oxygen produced will then freeze out in and ice leaving a high abundance of gas-phase carbon. This can occur for grain temperatures K and K where CO ice is thermally desorbed but ice can still form. A similar process occurs for colder grain temperatures where CO ice is desorbed by cosmic rays. Steady-state models will predict a large gas phase C abundance (and strong [C I] line intensities) if there are few chemical paths to reduce the gas-phase C abundance, for example, in the form of ice (e.g., Esplugues et al., 2019, and M. Kaufman, private communication). In general, time dependent surface chemistry is most important at large and low .
Additional time-dependent processes have been modelled in 1-D including fractionation of C, D, and N, species (Roueff et al., 2015), cosmic-ray production of H in cloud interiors (Goldsmith & Li 2005, see also Padovani et al. 2018 for steady-state), and the time dependent photoevaporation of an externally illuminated GMC containing a distribution of clump and interclump gas (Vallini et al., 2017).
6.2 Multidimensional codes with steady state chemistry
In some cases, a multidimensional geometry is more appropriate, rather than the plane-parallel or 1-D spherical geometry described above. For example, in 1-D geometry, the evaporated gas remains along a line between the star and cloud. This is especially problematic in the H II blister phase where the 1-D radial symmetry is broken and the evaporated gas streams into the ISM. Variations in the density structure from clumps or turbulence can lead to multiple pathways for the FUV field to enter the cloud, creating a range of physical conditions in the same telescope beam (e.g., Nagy et al., 2017). There may also be multiple internal sources of FUV radiation. To address these problems, PDR models for multidimensional clouds have been developed (e.g., KOSMA-, Röllig et al. 2013; 3D-PDR, Bisbas et al. 2012). The KOSMA- models consist of a single or distribution of 1-D spherical clumps. This was carried further by Andree-Labsch et al. (2017) who constructed a 3-D ensemble of pixels, each containing a distribution of clumps to simulate the structure of the Orion Bar. Multidimensional PDR codes have also been developed to model protostellar envelopes and outflows (Visser et al., 2012, Bruderer et al., 2009a, Lee et al., 2014). For example, Visser et al. (2012) found that the UV illumination of outflow walls can dominate the observed mid- CO line emission. Spaans et al. (1994) constructed a 2-D PDR model with arbitrary geometry and density that uses a Monte Carlo approach for the radiation transfer. A common technique is to use a time-dependent hydrodynamic simulation to obtain the density and velocity fields and then to “post-process” it with a PDR code to obtain the steady-state chemical abundances and thermal equilibrium gas temperature (e.g., Levrier et al., 2012). The 3D-PDR code is highly flexible and well suited to post-process the complex geometries and density distributions obtained with time-dependent magnetohydrodynamics (MHD) codes. The 3D-PDR code has been used, for example, to obtain the emission diagnostics from MHD simulations of a molecular cloud for a range of cosmic-ray ionization rates, UV fields and densities (Bisbas et al., 2021).
The H/H2 transition, and abundance of molecular ions, have been examined in simulations of FUV illuminated, turbulent, diffuse clouds by Bialy et al. (2017, 2019). The simulations were post-processed to find the steady-state abundances of H2 and from a steady-state PDR model, the molecular ion abundances. The density fluctuations broaden the probability distribution functions of column densities although the mean is well fit by the analytic solution of Sternberg et al. (2014) for uniform density. Comparing the model distribution of column densities to observations constrains the characteristic driving scale and Mach number of the turbulence. An approach by Bisbas et al. (2019) uses lognormal distributions in coupled with an relation from simulations as inputs to a 1-D PDR code to simulate the H/H2 and /C/CO fractions in the ISM.
Mach numberUsually noted as , is the ratio of the turbulent velocity dispersion over the sound speed in the gas.
6.3 3-D Magnetohydrodynamic codes with time dependent chemistry
The codes discussed in the previous section post-process the density and velocity fields with steady-state PDR models. Here we consider MHD codes with incident radiation that calculate simultaneously the time-dependent chemistry, and the density and velocity fields produced from turbulence. Due to large computational times, the chemistry is generally not as detailed as in a 1-D PDR code nor is the resolution as fine, but the density and velocity are physically motivated and lead to processes that can not be accounted for in a steady-state code. One technique is to follow only the H/H2 chemistry and assume the remaining chemistry is in balance with the H2. Another is to follow a more complete chemistry but with a number of pseudo reactions to limit and close the network (e.g., Glover et al., 2010, Gong et al., 2017, Hu et al., 2021). The KROME package can be used to integrate chemical networks with simulations (Grassi et al., 2014). Time dependent chemistry is important if exceeds the turbulent crossing time where is a characteristic length scale and is the (1D) velocity dispersion over that length. Observations show that for Galactic molecular clouds and Myr . Using the volume averaged density of a molecular cloud ( ) would yield long compared to and would indicate that a fully molecular gas is difficult to establish. However, turbulent compression leads to higher densities than the volume average and more rapid H2 formation. In a shocked, compressed, PDR layer, the turbulence may well be more related to the turbulence in the adjacent H II region and local feedback processes than to the larger cloud (e.g., Lancaster et al., 2021a). Observations of spectrally resolved [C II] lines show a range of Mach numbers from weakly supersonic (Goicoechea et al., 2015) to (Pérez-Beaupuits et al., 2015). Using a typical turbulent dispersion velocity of [C II] found in Orion PDRs, km (Pabst et al., 2020), a density of , and a column density for the layer of , then and turbulence may become important for the chemistry. Similarly, for typical diffuse clouds, these two time scales can be comparable for moderate Mach numbers (e.g., Bialy et al., 2017). As the metallicity decreases, increases, and time dependent H2 chemistry becomes increasingly important (Hu et al., 2021).
An important aspect for PDR chemistry is the 3-D penetration of the external FUV field through the turbulent gas, as well as the line transfer for the gas cooling and line emission. Typically, the column density to a point is estimated by averaging over several directions and the local FUV field is found by the normally incident attenuation by that column (equation 5). Similarly the CO and H2 self-shielding are found using the estimated column density. The averaging is done over a fixed number of angles or using a sophisticated algorithm such as TreeCol (Clark et al., 2012) to reduce the number of lines-of-sight. The excitation of atoms and molecules and the subsequent line-transfer is often handled in post-processing with a 3-D radiation transfer code such as RADMC-3D141414https://github.com/dullemond/radmc3d-2.0.
Simulations for the evolution of single or colliding clouds have been carried out by several groups (e.g., Clark et al., 2019, Seifried et al., 2017). As a result of turbulent compression, the molecular formation time is enhanced with % conversion to molecular gas within a few Myr, a factor of 10 faster than with no internal dynamics (Goldsmith et al., 2007). At early times, when the H2 fraction is small, the [C II] emission traces mainly H I and is a poor tracer of CO-dark gas, while [C I] and CO mainly trace H2. At later times, the fraction of [C II] emission tracing the H2 likely increases (Franeck et al., 2018, Clark et al., 2019). The density fluctuations can produce both CO-bright and CO-dark gas at the same depth, and Seifried et al. (2020) fit a relation for the H2 mass based on the CO line intensity and . The distribution of [C I] emission has long been a matter of debate. In a layered PDR the [C I] should arise in a thin region on the cloud surface tracing the CO, yet on molecular cloud scales, the [C I] is widespread and correlates better with in the interior than (e.g., Keene et al., 1985, Plume et al., 2000, Burton et al., 2015). The observed distribution might be the result of a complex turbulent geometry that produces many internal surfaces and allows for greater FUV penetration (Spaans et al. 1994, Glover et al. 2015, see also Szűcs et al. (2014) for in a turbulent cloud).
3-D MHD simulations describe a dynamical process for the formation of the thermal phases of the diffuse ISM: the hot ionized medium (HIM, K), the warm neutral medium (WNM, K), and cold neutral medium (CNM, K), as well as the gas flows between them. These phases coexist within a range of thermal pressures between K and K . Steady-state calculations have found that PDRs play an important role in producing and maintaining the WNM and CNM multiphase medium (Wolfire et al. 1995a, 2003, see also Wolfire et al. 1995b, Bialy & Sternberg 2019, and Hu et al. 2021 for low metallicity). Both phases are heated by the FUV radiation from the interstellar radiation field via grain photoelectric heating, while the CNM is cooled mainly by [C II], and the WNM is cooled by [C II], [O I], and H Ly radiation. Thermal instability caused by efficient fine-structure line cooling drives the separation between phases. The observed mass fractions in the local Galaxy are approximately 30% CNM, 50% WNM, and 20% in the thermally unstable regime (e.g., Murray et al., 2018b, Heiles & Troland, 2003). Kalberla & Haud (2018) find a larger unstable fraction (%) but with large systematic uncertainties. The 3-D MHD simulations of 2-phase (WNM+CNM) and 3-phase ISM, find that thermal instability and turbulence act together to continuously drive gas between phases (Audit & Hennebelle, 2010, Seifried et al., 2011, Walch et al., 2015, Kim & Ostriker, 2017, Hill et al., 2018, Bellomi et al., 2020). A multiphase ISM is produced with phases at similar thermal pressures, with a fraction of thermally unstable gas that is passing through phases. In global models of the ISM, (Ostriker et al., 2010) a feedback loop between the FUV radiation generated by star formation, the turbulence injected by SN, and the pressure of the gas in the Galactic midplane, maintains the thermal pressure in the range for a multiphase medium.
3-D MHD simulations (e.g., Bellomi et al., 2020) have also reproduced the distribution of H2 versus as observed in the diffuse gas (Shull et al., 2021). The simulations result in a distribution of gas densities where low densities are correlated with lower . Similarly, steady-state models with high values lead to low H2 column densities (Wolfire et al., 2008). In diffuse or low density gas within molecular clouds, H2 can have a significant abundance due to turbulent mixing or mass transfer between phases (e.g., Glover & Mac Low, 2007, Valdivia et al., 2016, Seifried et al., 2017, Bellomi et al., 2020). This is an abundance that is high compared to the steady-state value and is partially shielded from the dissociating FUV by intervening columns in the complex geometry. A small fraction of the diffuse H2 can be FUV pumped or collisionally excited in warm gas phases and drive endothermic reactions such as those required to produce (e.g., Lesaffre et al. 2007, Valdivia et al. 2016, Godard et al. 2022, in preparation). See also Gerin et al. (2016) for additional observations and models of the diffuse gas.
7 Galactic Observations
Since the previous reviews, Galactic PDRs have been observed with space based (Spitzer, Herschel), suborbital (Stratospheric Observatory for Infrared Astronomy; SOFIA, Stratospheric Terahertz Observatory 2; STO2), and ground based (many including Atacama Large Millimeter/submillimeter Array; ALMA) observatories, with increasing spatial and velocity resolution in pointed and mapping modes. Here we discuss results driven mainly by new observations.
7.1 High FUV field PDRs
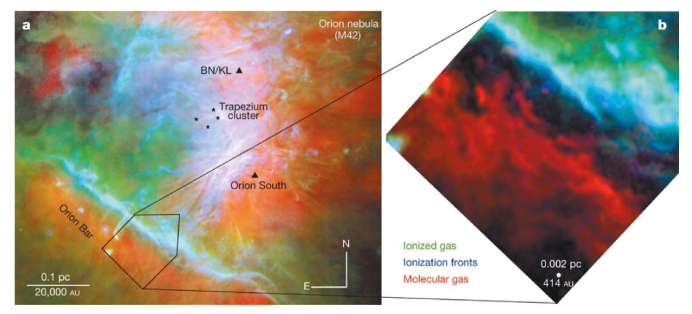
Figure 10a shows an overview of the Orion nebula. The PDR behind the Trapezium cluster is the one modeled by TH85. The Orion Bar is the prototypical edge-on PDR in which the PDR layers are spread across the sky (e.g., Tielens et al., 1993, Tauber et al., 1994, Hogerheijde et al., 1995b). The stellar winds and H II region powered by the stars in the Trapezium cluster have created a bowl in the molecular cloud and the Orion Bar is the FUV illuminated edge of the bowl. The IF traced by [O I] 6300 Å emission is seen in blue and the DF of the molecular PDR traced by in red. Although not shown in this figure, the [C II], [O I] 63 m, and PAH emission is bright between the ionized and molecular gas. Figure 10b shows a close-up view of the bar in () emission in red taken with ALMA, and clearly showing the separation between ionization and dissociation fronts filled by warm, neutral, atomic gas. Emission from FUV pumped is also observed at the edge of the molecular gas (Walmsley et al. 2000, Le Gal et al. in preparation).
High density ( ) and high pressure ( K ) clumps are a common feature in high FUV field PDRs, as demonstrated by a number of observations including interferometry (e.g., Young Owl et al., 2002, Lis & Schilke, 2003), H2 line emission (Sheffer et al., 2011), and [O I] and high- CO molecular line emission (Ossenkopf et al. 2010, Wu et al. 2018, Joblin et al. 2018, see also Visser et al. 2012 for discussion of the CO ladder in the context of protostellar envelopes). The clumps are embedded in a lower density medium mainly responsible for the [C II] and a portion of the [O I] line emission and the low- to mid- CO line emission. For the Orion Bar, an incident radiation field of and interclump density of is consistent with the [O I] and [C II] line emission as well as the separation between the IF and DF (Tielens et al., 1993, Hogerheijde et al., 1995b, Marconi et al., 1998). The ALMA observations close to the DF indicate clump densities of and sizes of pc. The high- CO ladder also indicates high density clumps (Joblin et al., 2018). Deeper into the bar, larger ( pc) clumps are observed. In general, thermal pressures in clumps are higher than in the interclump medium and could be self-gravitating, or transient, turbulently compressed features or compressed by FUV photoevaporation (Gorti & Hollenbach, 2002, Lis & Schilke, 2003). In the Orion Bar, thermal pressures are K for the clumps, and K for the interclump gas which is comparable to the magnetic pressure K (Goicoechea et al., 2016, Pabst et al., 2020).
The layered structure in the Orion Bar is apparent in many atomic and molecular tracers (e.g., Tielens et al., 1993, Walmsley et al., 2000, Lis & Schilke, 2003, van der Wiel et al., 2009, Bernard-Salas et al., 2012, Joblin et al., 2018, Parikka et al., 2018) demonstrating an edge-on geometry. Nevertheless, on small scales a more complex structure is seen at the DF. Molecular emission in the form of globules or plumes extends into the atomic gas, indicating advection of the molecular gas through the DF (Goicoechea et al., 2016). In addition, the , high- CO (Parikka et al., 2018), and are nearly coincident, suggesting a merging of the H2 and CO dissociation layers (Goicoechea et al., 2016, Kirsanova & Wiebe, 2019). However, we note that this may also be due to high densities and resulting small scale sizes, with vibrationally excited H2 driving the carbon chemistry to produce both CO and . We also note that the FUV pumping rate producing is proportional to the destruction rate which, in steady state, is equal to the formation rate (). Thus, both H2 formation and FUV pumping are proportional to and the peaks where the gas is atomic rather than molecular. In the (isobaric) [O I] and [C II] emitting regions, the temperature varies by a factor of a few and the gas density is relatively constant. In the Orion bar and NGC 7023, Joblin et al. (2018) find that the rate of H2 formation is enhanced by a factor of 3-4 over that in diffuse gas, thereby drawing the H2 closer to the surface and leading to warmer gas by collisional de-excitation of exited H2 (see Section 3.2). Endothermic carbon chemistry () driven by FUV pumped and warm H2 also draws and CO into warm gas regions (Goicoechea et al., 2019). However, (Goicoechea et al., 2021) find that endothermic reactions with are not sufficient to explain the observed column densities of sulfur species in the Orion Bar. Although sulfur chemistry is still poorly understood, they suggest that surface chemistry can make up the difference.
Velocity resolved line profiles of [C II] and [O I] used in combination with other tracers such as [C I] and CO reveal outflows (e.g., Schneider et al., 2018), thermal and non-thermal pressures (e.g., Goicoechea et al., 2015, Pérez-Beaupuits et al., 2015), multiple PDR components (e.g., Dedes et al., 2010, Seo et al., 2019), and can separate the neutral and ionized gas. For example, line widths suggest an equipartition of thermal, turbulent, and magnetic pressures in the PDRs associated with the Orion region and RCW 49 (Tiwari et al., 2021, Pabst et al., 2021). Anderson et al. (2019) find that the (velocity resolved) [N II] 205 m emission in S235 is clearly velocity shifted from the [C II] emission and only % of the [C II] comes from the neutral gas151515Many of the estimates of the ionized gas contribution to [C II] come from spectrally unresolved [N II] observations (Section 5.4). A limited number of resolved [N II] 205 m observations have been carried by Herschel HIFI, and by SOFIA GREAT. Large scale mapping of the spectrally resolved [N II] 205 m line will be carried by GUSTO.. In contrast, Seo et al. (2019) find in the Trumpler 14/Carina region that most of the [C II] comes from the ionized gas along lines of sight that pass through the blister H II region with embedded, high density, neutral cores also contributing.
The fine-structure line profiles, along with high spatial resolution large-scale mapping (Figure 11) have been used to examine the kinematics of the gas and stellar feedback processes (see Schneider et al., 2020, for an overview of the SOFIA FEEDBACK project).
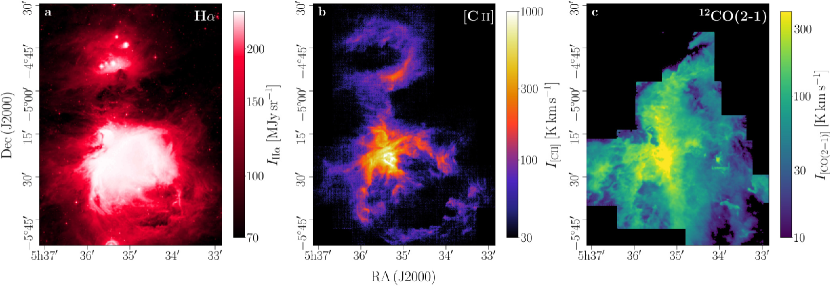
Analyzing the [C II] line spectra along cuts across the source (Figure 12) and position-velocity diagrams, delineates expanding shells of neutral gas and gives the radius, velocity, and mass of these expanding shells, which provides the energetics required to drive the expansion. An analysis of the Orion Veil [C II], associated with the M42 H II region (Pabst et al., 2019, 2020) and seen in the Orion map (Figure 11 to the south west) find the neutral shell is expanding at , and, along with estimates of the various feedback pressures using observations of H, CO, and X-rays, is interpreted as a consequence of a wind-blown bubble as discussed in Section 6. A similar result was found analyzing the [C II] emission in RCW 120 (Luisi et al., 2021). The bubbles in the M43 and NGC 1977 regions to the north of M42 are powered by early B stars, with weak winds, and are found instead to be dominated by the thermal expansion of the H II region (Pabst et al., 2020). The [C II] emission in RCW 49 (Tiwari et al., 2021) suggests the bubble was powered initially by the winds from the Wd2 cluster, but currently, in late stage evolution, is likely driven by a Wolf-Rayet star wind.
Analytic models (e.g., Krumholz & Matzner, 2009), simulations (e.g., Walch et al., 2012, Kim et al., 2018) and observations (e.g., Lopez et al., 2014, Barnes et al., 2020, Chevance et al., 2022) have been used to estimate the dominant feedback processes. It is clear that pre-SN feedback mechanisms dominate in destroying molecular clouds but there is disagreement between mainly observational determinations and hydrodynamical simulations as to the dominant process. Infrared radiation pressure is unlikely to be important since each thermal re-emission from dust is shifted to increasingly longer wavelengths where clouds are optically thin (Wolfire & Cassinelli, 1986, Reissl et al., 2018). The [C II] and pressure results from Orion and RCW 49 suggest that winds dominate, especially in the early phases but can also dominate in the later phases. Photoionization can also be important, especially for early B stars which lack strong stellar winds. The analysis of feedback timescales in nearby galaxies (Kruijssen et al., 2019, Chevance et al., 2022) suggests indeed that stellar winds and photoionization are the two dominant feedback mechanisms responsible for dispersing molecular clouds. In contrast, hydrodynamic simulations suggest that rapid admixing of cold shell material into the hot gas in a turbulent mixing layer leads to rapid radiative cooling and thereby diminishes the effects of winds (Lancaster et al., 2021a, b). Additional simulations and observations are called for in a range of evolutionary stages and environments.
Bubbles are seen throughout the Galactic plane in images from Spitzer at 8 m (Churchwell et al., 2006) mainly arising from PAH emission in PDRs. However, most have yet to be analyzed in velocity resolved PDR lines. The Galactic/Extragalactic ULDB Spectroscopic Terahertz Observatory; GUSTO, balloon project (Goldsmith et al., 2022), will map large areas of the inner Galactic plane (and LMC) at angular resolution , and spectral resolution greater than 1 in [C II], [O I] 63 m and [N II] 205 m. GUSTO will map the kinematics of large scale [C II] structures driven by feedback processes, the [C II] association with ionized gas and dense PDRs, and the CO-dark gas fraction.
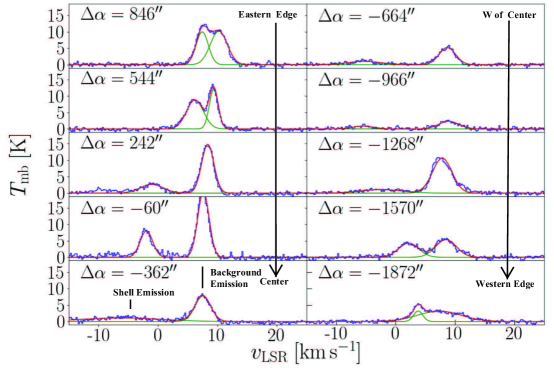
Small hydrocarbons and fullerenes observed near the surfaces of PDRs illuminated by high radiation fields could be the result of PAH fragmentation (Pety et al., 2005, Berné & Tielens, 2012, Guzmán et al., 2015). In addition, the observation of COMs near the surface, could be the result of the better mobility of molecules in warmer ice mantles that produce some COMs that are then photodesorbed (Guzmán et al., 2014). Le Gal et al. (2019) suggest, instead, that high C/O ratios (for example as a result of freeze-out) result in hydrocarbons, e.g., produced by gas-phase chemistry alone.
A greater understanding of PDR structure, chemistry, and thermal balance will come from James Webb Space Telescope (JWST) observations. With a resolution of in nearby Galactic PDRs, observations of the H2 line emission, for example, greatly constrain the PDR temperature profile, formation mechanism, and the chemistry (see e.g., the PDRs4ALL program targeting the Orion Bar; Berné et al. 2022).
7.2 Intermediate to Low FUV fields
A large number of PDRs have been observed in both pointed observations and mapping modes giving the integrated line strengths of the dominant cooling lines. These include e.g., observations from Spitzer, Herschel, and SOFIA and are too numerous to discuss separately and only a few have been mentioned throughout this review. They provide the inputs needed to analyze the physical conditions in many sources covering a wide range in densities, radiation fields, and temperatures, and lead to mapping the physical conditions over the source. The observations allow for an assessment of the dominant energy input and its magnitude, and to better understand the chemical and thermal processes in the ISM.
It has long been suspected that [O I] 63 m absorption along the line-of-sight can diminish the integrated [O I] 63 m emission and affect the interpretation of line ratios (e.g., Kraemer et al., 1998, Liseau et al., 2006). {marginnote} \entrySelf-absorptionA line profile is self-absorbed if there is dip at line center, generally caused by foreground absorption or a temperature gradient. Sources with high [O I] 145 m/[O I] 63 m ratios cannot be explained by an externally illuminated PDR model with face-on geometry, but presumably results from foreground absorption of the [O I] 63 m line. Note that PDR models do account for optical depth effects in the line within the PDR, with [O I] 63 m typically being optically thick, [O I] 145 m optically thin, and [C II] marginally thick. Guevara et al. (2020) used observations of the [13C II] hyperfine transitions to determine [12C II] optical depths of 1-2 in several PDRs. Goldsmith (2019) considering [O I], and earlier Wolfire et al. (1993) for CO, note that subthermal excitation at the edge of a cloud or decreasing gas temperatures can result in self-absorbed line profiles, but since models account for sub-thermal excitation and a variable temperature distribution, the emergent integrated intensity calculated by the models is unaffected by self-absorption within the PDR. The models, however, do not include foreground absorption due to cold or low density gas along the line-of-sight which would absorb the observed line intensity emitted at the surface. Generally, a self-absorbed line refers to the observed shape of the profile and not where it is produced. With velocity resolved line observations it has become clear that [O I] 63 m towards PDRs can be self-absorbed (e.g., Ossenkopf et al., 2015, Leurini et al., 2015, Schneider et al., 2018, Mookerjea et al., 2021). The [C II] line has also been observed to be self-absorbed towards a few PDRs (e.g., Graf et al., 2012, Guevara et al., 2020, Mookerjea et al., 2021) as well as both [C II] and [O I] seen in diffuse gas (Gerin et al., 2015, Wiesemeyer et al., 2016). Although it takes only a small column of cold oxygen to fit observations with , , the required column of cold can be quite large (Graf et al., 2012, Guevara et al., 2020). For example, the average foreground column towards M17SW is , requiring an in the layer, and is larger than expected from a single foreground PDR. The physical location of the O and absorbing layers are not well determined but must be closely associated with the PDR due to velocity coherence of the absorption and emission components. Absorption might result from a line-of-sight that passes through a cloud to a PDR on the far side (Kraemer et al., 1998, Goldsmith et al., 2021), or to a PDR on the inner edge of a neutral shell surrounding an H II region Kirsanova et al. (2020). The correction to the [O I] 63 m line intensity due to self-absorption is typically estimated to be a factor (e.g., Schneider et al., 2018, Goldsmith et al., 2021). The [O I] 145 m line can be used as a diagnostic if the 63 m line is self-absorbed, since it is not seen in absorption due to the high K height above ground of the lower level.
Using gamma-ray observations, Grenier et al. (2005) found gas that was not seen in either H I nor CO emission. It is now considered to be mainly molecular (Murray et al., 2018a) and is known as the CO-poor or CO-dark molecular gas that was observed earlier in translucent clouds and explained by theoretical models (Lada & Blitz, 1988, van Dishoeck & Black, 1987, van Dishoeck, 1990). The CO-dark layer is located at an in PDRs, where H2 self-shielding creates a layer of H2, while CO forms deeper into the cloud (van Dishoeck & Black, 1988). Wolfire et al. (2010) constructed theoretical models of the surfaces of illuminated molecular clouds and found, for local Galactic conditions, a CO-dark mass fraction of %. Values of % are roughly consistent with Galactic observations from gamma-ray observations (Grenier et al., 2005), dust emission from Planck (Planck Collaboration et al., 2011), extinction from 2MASS (Paradis et al., 2012), [C II] line emission from Herschel (Pineda et al., 2013), and from numerical simulations of galactic disks where the CO-dark gas is found in interarm filaments (e.g., Smith et al. 2014, see also Kalberla et al. 2020). There is also a significant CO-dark fraction in the diffuse gas discussed in Section 7.3. The [C II] and [C I] emission can in principle trace the CO-dark gas but must be calibrated since the [C II] also arises in H I gas, and [C I] misses the regions. Models (e.g., Wolfire et al., 2010, Nordon & Sternberg, 2016, Madden et al., 2020) predict the dark gas fraction should increase at lower metallicity due to reduced shielding of the CO, although Hu et al. (2021) suggests the effect of metallicity is not as large as in previous models. The trend is confirmed by observations in the Galactic disk where the metallicity decreases by a factor between 4 kpc and 10 kpc while the CO-dark gas fraction increases by a factor of (Pineda et al., 2013, Langer et al., 2014) and also by observations in low metallicity galaxies (Section 8.4).
Observations of several PDRs illuminated by low FUV fields suggest that grain photoelectric heating may not be sufficient to explain the observed line emission (Goldsmith et al., 2010, Pon et al., 2016). The H2 S(3)/S(1) line ratio observed in Taurus can not be achieved by FUV heating alone, and the mid- CO lines observed in several infrared dark clouds are stronger than can be produced by PDRs. Pon et al. (2016) suggest that weak shocks ( km ) plus PDRs can excite both the low and mid- CO lines, although uncertainties in the heating rate and temperature distribution may allow for sufficient CO emission without the addition of shock heating.
7.3 Diffuse Gas
The Herschel HIFI GOT C+ program carried out a pointed [C II] line survey in the Galactic plane161616The GOT C+ program consists of 500 lines-of-sight around the Galactic plane in a volume weighted sparse survey. Although dense molecular gas was detected, most of the volume is filled with diffuse gas.. The km s-1 velocity resolution allowed for the separation of [C II] clouds along the line of sight due to Galactic rotation and for the determination of kinematic distances (Pineda et al., 2013). An estimate of the H2 fraction was made by comparing the observed [C II] line emission with that expected from the observed H I column density and assuming any additional [C II] emission is the result of collisions with H2. Langer et al. (2014) find a significant mass fraction of CO-dark H2 gas that varies considerably over cloud type, from % for diffuse molecular clouds to % for dense molecular clouds and with an average mass fraction of %. Kalberla et al. (2020) find a mass fraction of % in diffuse molecular clouds by comparing observed H I column densities with extinction.
In addition to the inferred H2 fractions, observations have directly detected molecules in diffuse molecular clouds in absorption e.g., HCO+, HCN (Hogerheijde et al., 1995a, Lucas & Liszt, 1996), HF, (Flagey et al., 2013, Sonnentrucker et al., 2015), , (e.g., Wyrowski et al., 2010, Gerin et al., 2010), (Schilke et al., 2014, Jacob et al., 2020), CH Sheffer et al. (2008), SH Neufeld et al. (2015), and in both absorption and emission e.g., OH (Liszt & Lucas, 1996, Busch et al., 2019), with CH, HF and being particularly good (linear) tracers of the H2 fraction. Although not strictly CO-dark in the original sense since the bulk of the gas may be detectable in H I, nevertheless these observations detect a portion of molecular gas that is not seen in CO emission. The abundances of several carbon (e.g., , , and CO) and sulfur (e.g., SH, ) species are under produced in PDR models and additional processes are required to drive the initial endothermic reactions. These could be turbulent dissipation regions (Godard et al., 2014, Myers et al., 2015, Moseley et al., 2021), ion-neutral drift (Pineau des Forets et al., 1986, Visser et al., 2009), or warm H2 as a result of turbulent mixing (e.g., Valdivia et al., 2016). Observations of molecular ions have been used to constrain the cosmic-ray ionization rate in diffuse gas (see Section 3.3). See also the HyGAL survey using SOFIA/GREAT (Jacob et al., 2022), and reviews by Snow & McCall (2006) and Gerin et al. (2016) for additional observations and models.
8 Extragalactic Observations
Observations in the Milky Way have the advantage of a high spatial resolution. However, the range of environmental conditions that can be probed is limited and the confusion on the line of sight might be important when looking at regions within the disk. Extragalactic observations are therefore a crucial step towards understanding the physical processes at play in the ISM and how these vary with environmental properties such as gas pressure, temperature, and metallicity. The mixing of different regions within a beam of finite resolution of the observation remains a limitation, but recent and future telescopes are shedding a new light on extragalactic PDRs and XDRs. We present new findings from observations of the nearby Universe in this Section. The particular case of the high-redshift galaxies is discussed in Section 9.
8.1 Observations on galaxy scales
With recent infrared observatories such as Herschel and SOFIA, it is possible to resolve the ISM down to a few pc in the most nearby galaxies. However, most extragalactic observations remain unresolved, hindering the detailed studies possible in the Milky Way (see Section 7). The JWST will allow high-resolution observations of nearby galaxies in the near infrared ( at 8 m or 3.6 pc at 3 Mpc distance), complementing the sub-mm view of ALMA, now routinely mapping the molecular gas disks of nearby galaxies (e.g., Leroy et al., 2021), and bridging high-resolution Milky-Way observations and the large range of environments covered by extragalactic observations. We describe below commonly observed properties of extragalactic PDRs and challenges related to the interpretation of these unresolved observations.
While the [C II] intensity has been thought to correlate well with the FIR intensity, already with the Infrared Space Observatory observations a deficit in [C II] relative to FIR was observed at high FIR (Malhotra et al., 1997, Luhman et al., 1998, Malhotra et al., 2001). More recently, using the PACS instrument on board Herschel, the SHINING survey (Herrera-Camus et al., 2018a) has obtained observations of the six main FIR atomic and ionized gas lines in the range m for 52 galaxies. This sample includes star-forming galaxies, AGN dominated systems, as well as luminous and ultra-luminous infrared galaxies (ULIRGS). This line deficit relative to FIR seems to affect all observed fine-structure PDR and ionized gas lines (Herrera-Camus et al., 2018a, see also Graciá-Carpio et al. 2011). In environments with a FIR luminosity L⊙, line intensities relative to FIR can be more than an order of magnitude fainter than in lower FIR environments. Smith et al. (2017), using the KINGFISH survey of galaxies (Kennicutt et al., 2011) with an average spatial resolution of pc, found a decreasing [C II]/FIR ratio with increasing star formation surface density. It is important to note that this line ‘deficit’ is defined empirically by comparison with the [C II]/FIR ratio observed in normal galaxies. PDR models indeed predict that the correlation between [C II] and FIR weakens towards high radiation fields and high densities. There exist several possible explanations for this phenomenon (e.g., Herrera-Camus et al., 2018b, and references therein). PDR models show that an increase in the grain charge parameter with increasing FIR results in the charging of small grains and PAHs, and therefore a decrease in the photoelectric efficiency, plausibly causing the [C II] line (as well as other fine-structure lines from the PDRs) to cease tracing the FUV radiation field (Malhotra et al., 2001, Croxall et al., 2012). Alternatively, the fraction of EUV and FUV photons absorbed by dust increases with the ionization parameter in dusty star forming regions, increasing FIR, but leaving a comparatively smaller fraction of both EUV and FUV photons to ionize the H II region and heat the neutral gas (e.g. Graciá-Carpio et al., 2011). We note however, that Draine (2011) suggests that radiation pressure will push grains to the outer edge of an H II region and the dust absorption within the ionized gas will not be large. Line deficits (also relative to the SFR) have also been reported in high-redshift starburst galaxies (e.g., Maiolino et al., 2009, Stacey et al., 2010, Brisbin et al., 2015) and is discussed in more detail in Section 9.
Another commonly observed phenomenon is the deficit of [C II] emission towards galaxy centers (e.g., Parkin et al., 2013, Herrera-Camus et al., 2015, Smith et al., 2017, Pineda et al., 2018). This is not always linked to the presence or the influence of an AGN, but likely to the different physical conditions in the nucleus compared to the disk (warmer temperatures, higher densities, [O I] rather than [C II] becomes the main coolant of the gas). In the specific case of an AGN, the increased hardness of the radiation field changes the C++/C+ ratio (in the ionized gas), contributing to the [C II] deficit (Langer & Pineda, 2015).
The [C II] emission is often used as a star formation rate indicator in external galaxies. The low ionisation potential of C (11.3 eV) means that [C II] emission can arise from both the ionized and the neutral gas (Section 5.4). The comparison of [C II] with the ionized gas lines [N II] 122 m, [N II] 205 m, and [O III] 88 m shows that the majority of the [C II] emission originates from the neutral gas, and that this proportion increases in the most active star-forming regions (from 60% to 90% in the SHINING sample; Herrera-Camus et al. 2018a). Moreover, the fraction of the [C II] emission originating from the ionized gas likely arises from low-ionisation, diffuse gas, or from the outer parts of H II regions, where in both cases the ionization is driven by stellar EUV photons.
In the neutral gas, and at moderate densities, [C II] is the main coolant and, assuming thermal equilibrium, the [C II] emission is therefore a measure of the heating rate. For normal galaxies, the heating is dominated by the photoelectric heating effect, which results from the interaction of the FUV radiation from (young, high-mass) stars with small dust grains and PAHs (e.g., Hollenbach & Tielens, 1999, and Section 3.3). There is therefore a direct, expected link between [C II] emission and star formation activity, although this does not imply a linear relation, as evidenced above.
However, despite the encouraging correlations observed between FIR lines and the star formation rate (SFR) on galactic scales (e.g., Stacey et al., 1991, Boselli et al., 2002, De Looze et al., 2011, 2014, Herrera-Camus et al., 2015) an accurate calibration for their use as star formation tracers is still lacking. [C II], [O I] 63 m and [O III] 88 m, commonly observed in the nearby Universe with Herschel, are considered to trace relatively well the SFR (determined via H, FUV, 24 m, TIR or a combination of there; see e.g. Herrera-Camus et al. 2015) with uncertainties of about a factor of 2 in normal, starburst and AGN galaxies. There is an offset of this relation for ULIRGS due to the line deficit mentioned above (e.g., De Looze et al., 2014). The scatter of the SFR–[C II] relation strongly increases for metal-poor dwarf galaxies and in the high- Universe (with a dispersion of dex, approximately two times larger than observed for normal galaxies in the local universe, Carniani et al., 2018, see also discussion in Section 9). This suggests that in such environments, with lower metal abundance, warmer dust temperature, and higher ionisation state of the gas, other lines might dominate the cooling (see Section 8.4). This scatter can be reduced by combining the emission from multiple (ideally all) lines contributing to gas cooling.
SFRStar formation rate, often derived from observed intensities (or surface brightness) in units of or from observed luminosities in .
Another challenge regarding the use of PDR models to interpret extragalactic observations, is that even in the most nearby galaxies, the finite resolution mixes several environments in one beam. The various sources of [C II] emission can have multiple origins that might not be co-spatial and can originate from different physical regions with distinct physical properties. While PDR models have been originally developed to explain the emission from single, nearby, Galactic regions, such as the Orion nebula, they have also been successfully applied to larger scales and even full galaxies (e.g., Wolfire et al., 1990, Malhotra et al., 2001). Nonetheless, it is important to keep in mind that even PDR models considering an ensemble of clouds represent very idealized cases, especially when applied to extragalactic conditions, where observations result from a mix between (diffuse) ionized and neutral gas, and filamentary, highly structured molecular clouds. With the limited amount of data available, it is often only possible to constrain an average PDR model. Only high-sensitivity, high (spatial and velocity)-resolution, multi-wavelength observations enable disentangling the different components and help distinguishing between an extended component or a collection of dense clouds (e.g., Kramer et al., 2005). Even when restricting the analysis to the molecular gas alone, there is evidence for a diversity of environments from which emission lines arise. One example is the ratio 12CO/13CO, which is observed to be high in nearby galaxies (; Schulz et al., 2007, Gallagher et al., 2018), in contrast with high-resolution Galactic studies where it is typically (Burton et al., 2013). Although both lines are emitted from the same regions, these observations suggest the presence of a diffuse molecular gas component, where 12CO is marginally thick and radiative trapping drives levels towards thermal excitation, while 13CO is thin and remains subthermally excited.
Finally, by contrast with early PDR models suggesting that [C I] is emitted from a thin layer around molecular clouds, both observational studies (Plume et al. 1994, Ikeda et al. 1999 and more recently Popping et al. 2017, Nesvadba et al. 2019, Valentino et al. 2020) as well as theory and simulations (Papadopoulos et al., 2004, Offner et al., 2014, Glover et al., 2015, Gaches et al., 2019, Heintz & Watson, 2020) have shown a strong correlation between [C I] emission and that from CO isotopologues, likely resulting from turbulence within clouds. The turbulence produces a complex geometry with many internal surfaces and FUV pathways to dissociate the CO and excite [C I].
Despite being less luminous than [C II], both [C I] lines at 370 and 609 m therefore show a strong potential as tracers of the total mass of molecular gas, especially at low metallicity or at high redshift, where the fraction of CO-dark molecular gas is expected to increase (e.g., Glover & Clark, 2016, Madden et al., 2020, Hu et al., 2021). With Herschel SPIRE and now ALMA, [C I] observations of nearby to high-redshift galaxies are becoming more common, but further investigation will be required to better understand the conditions under which [C I] lines are emitted (also see Section 5.3.2) and establish an accurate calibration of the C I-to-H2 conversion factor.
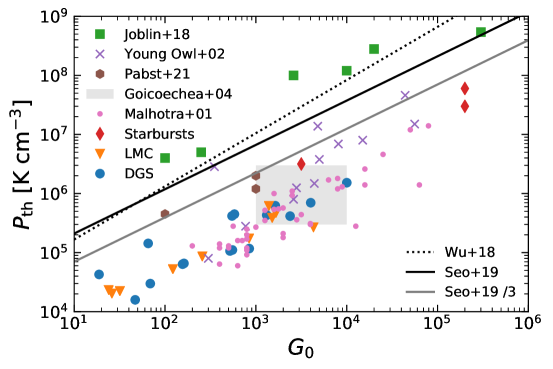
8.2 Mapping and velocity resolved observations applied to galaxies
A resolution of pc is typically required to separate the emission from individual giant molecular clouds. At the same time, covering areas of several kpc will reveal the influence of galactic structure (rotation curve, spiral arms, radial dependencies). In order to achieve both the required large scale coverage and the high spatial resolution within a feasible amount of time, galaxy surveys have typically been restricted to the most nearby ones, and to the brightest emission lines ([C II], [C I], CO, but HCN and other dense gas tracers are now becoming possible to map at high resolution thanks to ALMA), in combination with broadband infrared emission from dust (see e.g., Schruba et al. 2017 for observations of NGC 6288 at 2 pc resolution). Nonetheless, even in the most nearby galaxies, the sub-pc resolution attained by the Milky Way observations is unachievable. High-velocity resolution observations can be an asset to try and disentangle the different components mixed into the beam, and start bridging Galactic and extragalactic observations. We explore below some new results lead by recent observations at high (spatial and/or spectral) resolution.
The Antennae galaxies have been fully mapped in three CO transitions which were used in a PDR model to estimate the total molecular gas mass of the galaxies (Schulz et al., 2007). While the large size of the beam ( kpc) makes it impossible to disentangle the different components of the ISM, Schulz et al. (2007) argue that this spatial averaging has little influence on the derived total hydrogen column density, as well as on the temperature and density structure of the clouds (which determine the relative CO line intensities).
At higher spatial resolution, the HERM33ES survey (Kramer et al., 2010) obtained Herschel/PACS observations of M33, with a projected beam of pc. This is sufficient to associate most of the [C II] emission with a PDR, start probing the physical conditions around a single H II region, and suggest the presence of CO-dark molecular gas (Braine et al., 2012). Based on the comparison of [C II], [O I] and TIR emission with PDR models, Kramer et al. (2020) infer a relatively homogeneous medium on these scales in M33, with the large-scale average gas properties being similar to the average of the gas properties measured in four individual regions; namely: a moderate density ( cm-3) and radiation field (), with a relatively low beam filling factor of the PDRs, defined as the ratio between the radiation field constrained from the modeling and the radiation field inferred from the observed TIR emission ( by contrast to a larger value enabled by the presence of several PDRs on the line of sight). No difference was detected between the inner and outer parts of the galaxy.
In moderately-resolved galaxies, multi-wavelengths observations can help identify different components within the gas. Schirm et al. (2017) has mapped M51 at a spatial resolution of 40 pc with the SPIRE FTS instrument on Herschel and ground based observatories. They detect in total seven CO transitions and both [C I] transitions and identify two gas components: a cold molecular gas component residing in PDRs and a warm component requiring additional source of heating, potentially from supernovae, stellar winds, or shocks. For that same galaxy, Pineda et al. (2020) has made use of the high velocity resolution provided by the GREAT instrument on SOFIA to identify large-scale velocity gradients in H I, CO and [C II], at 700 pc spatial resolution. These observations reveal a clear offset in the position-velocity space between these lines at the location of the spiral arms, with CO tracing the upstream molecular gas and [C II] tracing the downstream star-forming regions. They also confirm the presence of shocked gas in the spiral arms of M51 and in the arm connecting the galaxy to its companion M51b. We note however that the interpretation might be complicated by the presence of strong tidal interactions, and it would be very valuable to perform a similar study in an isolated galaxy.
With these types of observations spanning a large range of environments, a correlation between the thermal pressure and the strength of the incident radiation field can be identified over several orders of magnitude. This has been observed for Galactic regions (Young Owl et al., 2002, Joblin et al., 2018, Wu et al., 2018, Pabst et al., 2022) and LMC and SMC star forming regions (Chevance, 2016). Figure 13 shows that this relation also holds for entire galaxies, from low metallicity dwarfs to starburst galaxies, although more observations are needed to confirm this trend. The lack of homogeneity between the various data sets makes it indeed difficult to quantitatively characterize this correlation. Different methods have been used to constrain the PDR models and the gas properties, such as the analysis of fine-structure line emissions or CO ladders, possibly creating a displacement in the – plane. In particular, the results from Joblin et al. (2018) and Wu et al. (2018), based on high- CO lines (with high critical density) are offset towards higher pressures in Figure 13, compared to studies based on fine-structure lines. Nonetheless, it is a puzzling result that, despite the differences in methodology and the wide range of sources, some that are described by an H II region/PDR interface and some that are not (reflection nebula, embedded clumps, large beams encompassing diffuse gas and star forming regions, unresolved galaxies), all these observations fall on a similar trend.
One possible explanation of the relation comes from balancing H II region and PDR thermal pressures at the Stömgren radius (Young Owl et al., 2002, Seo et al., 2019):
| (11) |
where is the ratio of the FUV photon luminosity to the hydrogen ionizing photon luminosity, . We show this relation as a black solid line in Figure 13 using and s-1, following Seo et al. (2019). However, if there are substantial contributions by magnetic and turbulent pressures in the PDR, then the thermal pressure required to balance the H II region is lower. We therefore also show in Figure 13 the above relation divided by a factor of three, assuming equipartition between thermal, turbulent, and magnetic pressure (as measured in Orion by Pabst et al. 2020). There is a qualitative agreement between the observations and the relatively simple theoretical model of pressure equilibrium between PDR and the ionized gas, assuming equipartition between thermal, turbulent, and magnetic pressure. We note nonetheless that entire galaxies have lower pressures for a given incident field, which could be at least partially explained by averaging over various environments (and in particular by significant diffuse gas reservoirs). We also note that the high pressure results derived from high- CO observations (Joblin et al., 2018) lead to a slightly steeper dependence.
In the future, bridging Milky-Way and extragalactic observations will be key to interpret the mix of environments present in one beam of unresolved observations, and understand the nature of the correlation described above. A promising project is the LMC+ survey (PI: S. Madden), which will cover a wide field-of-view () in the LMC, at high spatial resolution ( pc) with SOFIA/FIFI-LS. In the coming years, JWST observations will also contribute to this effort, by increasing the achievable spatial resolution for many near-IR PDR emission lines.
8.3 Galactic centers
Cold gas in the center of galaxies fuels both star formation and – in active galaxies – the accretion onto the central supermassive black hole. For this reason both PDRs and XDRs can exist in the center of galaxies. The high gas density and pressure, the presence of strong magnetic fields, highly turbulent gas, and strong radiation make it difficult to disentangle the different heating sources. The multiple diagnostics proposed for identifying the dominant heating mechanism(s) in extragalactic observations are not always decisive (see Section 5.3.2). Detailed, high resolution observations of a close-by galactic center, the one of our own Milky Way, can bring a better understanding of these extreme environments.
Several mechanisms are potentially responsible for the heating in the central pc (the Central Molecular Zone, CMZ) of the Milky Way (see e.g., Mills, 2017, for a recent review). We provide here a brief description of these different sources. The center of the Milky Way does not exhibit (at the moment) strong mid-infrared ionized lines which are typically associated with the presence of an AGN or XDR. Contrary to some other galaxy centers, X-rays are not thought to be the current dominant source of heating in the CMZ. However, past events could have triggered intense X-ray radiation, orders of magnitude higher than present values (Baganoff et al., 2001, Inui et al., 2009, Ponti et al., 2010). X-ray irradiation can enhance (by orders of magnitude) the abundances of molecular species such as , , and (e.g. Liu et al., 2020), and may remain visible several million years after the X-ray sources turns off, in particular in high-density molecular clouds in the vicinity of the galactic center.
FUV radiation participates in the heating of the gas in the CMZ, but most likely not as the only source (Rodríguez-Fernández et al., 2004). The [C II] emission can be accounted for by dense PDRs and ionized gas (Langer et al., 2017, Harris et al., 2021), but FUV photons do not penetrate deeply into the dense molecular gas, and cannot be responsible for the high temperatures (up to K) found there (e.g., as traced by H2CO; Ao et al., 2013). By contrast, cosmic rays penetrate deep into the clouds, and can lead to the difference in temperature observed between gas and dust (Ao et al., 2013, Clark et al., 2013, Krieger et al., 2017). The column density of H (as well as that of OH+, H2O and H3O+) is well reproduced with a cosmic-ray ionisation rate of s-1 (e.g., Oka et al., 2005, Le Petit et al., 2016, Oka et al., 2019), tracing a warm and diffuse gas component, in which the formation rate of H2 is likely enhanced, compared to local diffuse clouds. However, some low temperatures found in CMZ clouds ( K; e.g., Nagai et al. 2007, Krieger et al. 2017) indicate that a high cosmic-ray ionisation rate cannot be the globally dominant source of heating in the CMZ (Ginsburg et al., 2016). Turbulence and shocks are another likely heating source (e.g., Requena-Torres et al., 2012). Dissipation of supersonic turbulence can also explain the observed difference in temperature between dust and gas. Based on the emission of fine-structure lines of neutral species ([S I], [O I]) and of H2 rotation lines, Rodríguez-Fernández et al. (2004) conclude that low velocity C-shocks due to turbulence are good heating source candidates. These shocks are likely driven by the large-scale dynamics of the CMZ (e.g., tidal forces, shear, gas inflow along the bar; Kruijssen et al. 2014, 2019, Krumholz & Kruijssen 2015, Tress et al. 2020) rather than local processes (e.g., feedback ejecta). Detailed modelling of the molecular lines have led to the conclusion that turbulence is an important heating source in other galactic centers (e.g., Rosenberg et al., 2014a, b).
Around SgrA*, PDR models do not provide a good fit to the high- CO emission lines, suggesting the presence of another heating mechanism for the hot molecular gas in the inner central parsec of the Galaxy (Goicoechea et al., 2013). Low-density shocks (accompanied by supersonic turbulent dissipation and magnetic viscous heating) likely contribute to the heating of the gas. Interestingly, Goicoechea et al. (2013) point out similarities between the FIR spectrum of the hot gas around SgrA* and that of the starburst galaxy M82 (Kamenetzky et al., 2012), where shocks and turbulent heating are also found to be necessary to reproduce the high- CO emission.
Turning now to nearby galaxies, the presence of several ISM components is systematically established in galaxy centers. The central 650 pc of M82 are described as a ‘giant PDR’ by García-Burillo et al. (2002), with a very high HCO abundance at the outer edge of the molecular torus. However, velocity-resolved observations with Herschel HIFI of the nuclear region of M82 reveal a highly inhomogeneous medium, with the presence of multiple components within a beam, which can be modelled with a low density component (70%), a high density-low component (29%), and high density-high component covering only 1% of the beam area (Loenen et al., 2010). Similarly, three main ISM phases are identified in the central region of the starburst galaxy NGC 253 by Rosenberg et al. (2014a) and Pérez-Beaupuits et al. (2018): a diffuse, warm component and a high density, low temperature component reproducing the bulk of the low- and mid- CO emission, and a third, high-density, high temperature component accounting for the higher- CO emission and HCN emission, potentially heated by shock or turbulence. The importance of cosmic-ray heating in this region remains debated. In the center of 9 nearby active galaxies, Liu et al. (2017) also identified two ISM components, with a warm ( K), dense ( cm-3) phase (dominating the CO intensity up to , the FIR emission, and the emission of medium-excitation H2O lines), and a more extended cold ( K), dense ( cm-3) phase. In addition, the presence of a compact (100 pc), hotter component is identified for the two ULIRGs of the sample.
In addition to presenting a mix of ISM components, the extreme physical conditions found in galactic centers are likely to affect line emissions in different ways. Most galaxy centers are CO bright relative to their low molecular gas content, leading to CO-to-H2 conversion factors approximately ten times lower than the standard Milky Way value (Israel, 2020). The higher gas-phase carbon abundances, elevated kinetic gas temperatures, and high molecular gas velocity dispersion in extragalactic molecular zones seem to contribute equally to this decrease of the CO-to-H2 conversion factor. Moreover, enhanced HCN/HCO+ ratios in the central 100 pc region of AGN host galaxies (e.g., Krips et al., 2008, Izumi et al., 2016, Imanishi et al., 2019) have been proposed as a signpost of the effect of X-rays on the gas heating, but recent analysis (e.g., Privon et al., 2015, 2020) find no correlation between elevated HCN/HCO+ and AGN activity traced by X-rays. Finally, bright HC3N has been found in AGN nuclei such as Mrk 231 (Aalto et al., 2012) and NGC 1063 (Rico-Villas et al., 2021). Given that the strong radiation from the super massive black hole is expected to destroy this molecule, its detection implies large column densities (e.g., N cm-2 in the starburst ring of NGC 1068; see Rico-Villas et al., 2021).
In summary, the heating in galactic centers is caused by a mix of processes, which are difficult to model with a limited number of observational constraints, while keeping in mind that diagnostics can be ambiguous (see also Section 5.3.2). In addition, the relative importance of these different heating mechanisms (FUV radiation, presence of an EUV/X-ray source, cosmic rays, turbulence, and shocks) likely vary between galaxies.
8.4 Low metallicity environments
Nearby, low-metallicity environments are often suggested as good laboratories to better understand the physical processes taking place in unresolved, high-redshift galaxies. The FIR fine-structure lines tracing the cooling and the physical conditions of the gas indeed indicate that the structure of the low-metallicity ISM is qualitatively and quantitatively different from the one in higher metallicity galaxies (e.g., Kennicutt et al., 2003, Brauher et al., 2008). While it is becoming clear that a combination of XDR and PDR modelling is necessary to understand the observations at high redshift (see Section 9), the heating in most star-forming regions in moderately-low metallicity nearby galaxies is often dominated by UV radiation.
The LMC and SMC (0.5 Z⊙ and 0.3Z⊙), being our closest neighbors, have been extensively studied to understand the interplay between gas, star formation and feedback at low-metallicity (e.g., Leroy et al., 2009, Okada et al., 2015, Chevance et al., 2016, Jameson et al., 2018, Lee et al., 2016, 2019, Okada et al., 2019). On the scale of individual star-forming regions, these studies reveal a highly porous ISM structure (with a low volume filling factor of the dense gas) and a change in the relative abundances of C+, C and CO compared to higher metallicity regions: an extended PDR envelope exists around dense molecular clouds, where CO is photodissociated to deeper column densities but where H2 can survive through efficient self-shielding.
These findings are confirmed on larger scales, where several surveys have targeted the neutral gas in a large number of galaxies at intermediate-to-low metallicity, covering a wide range of galaxy type and star formation activity. A few examples are the sample of 22 Blue Compact Galaxies (BCGs) observed by Hunt et al. (2010), the LITTLE THINGS survey (Hunter et al., 2012) and the Dwarf Galaxy Survey (DGS, Madden et al., 2013). These studies indicate that [C II] remains a good tracer of the neutral atomic and CO-dark gas at low metallicity. Furthermore, there is a trend for increasing fraction of [C II] from the ionized gas with increasing metallicity (Croxall et al., 2017).
Several structural changes of the ISM at low metallicity are only indirectly linked to the reduced abundance of metals (including a reduced dust abundance), but more directly to a global increase of the strength of the radiation field. In the DGS, Cormier et al. (2015) find high ratios [O III] 88 m/[N II] 122 m and [N III] 57 m/[N II] 122 m, indicating a harder radiation field at low metallicities. On average, [O III] 88 m is the brightest line globally in these dwarf galaxies, indicating that the emission from the star forming regions dominates the emission even on galaxy scales. This fact is also reflected by the high [O III] 88 m/[O I] 63 m ratio, a factor of higher than in higher metallicity galaxies, revealing a decreasing filling factor of the PDRs with decreasing metallicity. The same trend seems to be confirmed for high- galaxies (Harikane et al., 2020, and Section 9). Using the Cloudy PDR model, higher radiation fields and densities in the PDRs are measured by Cormier et al. (2019). On average, this hard radiation field is also found responsible for the destruction of small PAHs (e.g., Hunt et al., 2010). We note however, that the ratio [O III]/[C II] is not noticeably elevated in the 5 galaxies from the LITTLE THINGS survey analyzed by Cigan et al. (2016), indicating harder radiation fields are not necessarily ubiquitous at low metallicity. In addition to a potential change of the hardness of the radiation field, the photoelectric heating from FUV radiation and the X-ray heating from high-mass X-ray binaries seem to scale in opposite directions with metallicity (or the dust-to-gas ratio). The comparison of FIR fine-structure lines with photoionization models indeed suggests that X-rays from binaries could be an important heating process in extremely metal-poor environments (e.g., IZw18 at 1/30 Z⊙; Lebouteiller et al. 2017).
Finally, the deficit of CO emission at low metallicity also confirms a highly structured and porous ISM, with a very clumpy distribution of the dense molecular gas limited to small volume clumps surrounded by diffuse gas (e.g., Indebetouw et al., 2013, Lebouteiller et al., 2017, Vallini et al., 2017, Jameson et al., 2018, Chevance et al., 2020b). H2 might be able to survive outside of these dense clumps, due to efficient self-shielding, implying potentially large reservoirs of CO-dark gas (e.g., Maloney & Black, 1988, Pak et al., 1998, Glover & Mac Low, 2011, Shetty et al., 2011, Narayanan et al., 2012). In the DGS, Madden et al. (2020) estimates that % of the molecular gas is not traced by CO(1-0). If high porosity is also characteristic of the high-redshift Universe, it could facilitate the escape of ionizing photons during cosmic reionization (Stark, 2016).
One extensively-studied region to probe a potential reservoir of CO-dark gas is the high-mass star forming region of 30 Doradus in the LMC, which is often considered as one of the best laboratories to study the impact of a super star cluster (SSC) on the sub-solar metallicity ISM. In its center is located the SSC R136, which contains a large population of massive stars (see the review by Crowther, 2019, and references therein) and creates an extreme environment over tens of parsecs. The ionizing radiation propagates far from the cluster due to the lower dust abundance of the LMC and a porous environment, creating extended PDR regions (e.g., Chevance et al., 2016). ALMA observations reveal a clumpy structure of the molecular gas in this region, showing small 12CO filaments and clumps (0.1 pc) covering only about 15% of the total area mapped by Indebetouw et al. (2013). Direct high spatial resolution H2 1-0 S(1) observations reveal that the H2 emission originates from the PDRs, with no evidence for shock excitation (Yeh et al., 2015). However, the molecular gas mass inferred from these observations of the warm H2 is a strong lower limit on the total molecular gas mass (it does not include the mass associated with other levels of H2 nor does it trace the cold molecular gas associated with star formation). Several [C II] components not associated with CO emission were identified around R136 by Okada et al. (2019), but the low spatial resolution of the H I observations prevents their clear association with atomic gas or CO-dark molecular gas. The comparison between the observed CO emission and the total molecular gas mass predicted by the Meudon PDR model based on SOFIA/FIFI-LS observations led Chevance et al. (2020b) to suggest the existence of a large reservoir of CO-dark molecular gas ( 75%). Melnick et al. (2021) caution however that this value is likely an upper limit on the fraction of CO-dark gas in 30 Doradus, if part of the dust emission originates from nebular dust not associated with the molecular gas. Even in that case, the combination of the strong radiation field with the half-solar metallicity of the surrounding gas does create a significant reservoir of CO-dark molecular gas around R136, as well as most likely in other high-mass star-forming regions at low metallicity. This has important implications for the inferred star formation efficiencies in these environments (biased towards higher values if a large fraction of the gas is undetected), the rate at which feedback from massive stars evaporate the reservoir of molecular gas, and the extent to which the associated shielding of molecular gas enables ongoing star formation in other parts of the cloud complex.
9 PDRs and XDRs in the high-redshift Universe
The advent of ALMA opened a new window on the characterization of PDR and XDR properties in the high-redshift () Universe (see Hodge & da Cunha, 2020, for a recent review). Resolving pc scales is possible only for bright gravitationally lensed sources (e.g., Rybak et al., 2020a). Nevertheless, the unprecedented sensitivity and resolution of ALMA enable observations approaching sub-kpc scales, thus providing a first glimpse on the overall ISM conditions of distant sources. The [C II] 158 m line is by far the most widely targeted PDR tracer in normal (SFR) sources at high-, while [O I] 63 and 145 m (e.g., Rybak et al., 2020b, Lee et al., 2021), [C I] 609 and 370 m (e.g., Strandet et al., 2017, Valentino et al., 2020), CO (e.g., D’Odorico et al., 2018, Pavesi et al., 2019, Apostolovski et al., 2019), and , , and lines (e.g., Casey et al., 2019, Lehnert et al., 2020, Riechers et al., 2021, Pensabene et al., 2021) are mostly detected in rare/massive and highly star forming galaxies and quasars.{marginnote} \entryHubble Deep FieldHubble Space Telescope observation carried out with long integration time that revealed many faint galaxies at high redshift.
Large [C II] surveys at , such as the ALMA-SPT (Spilker et al., 2016), ALPINE (Le Fèvre et al., 2020), and REBELS (Bouwens et al., 2021) targeted samples of galaxies with homogeneous properties, while ASPECS (Walter et al., 2016) blindly searched for CO (Boogaard et al., 2020) and [C II] emitters (Uzgil et al., 2021) in the Hubble Deep Field scanning the broad range. Importantly, by exploiting [C II] as a SFR indicator (see discussion in Section 8.1), Loiacono et al. (2021) estimated the cosmic SFR density in the range from the ALPINE survey. Before ALMA, only the rest-frame UV was accessible at such high-redshifts with deep imaging campaigns conducted with the Hubble Space Telescope and ground-based observatories (e.g. Stark, 2016, and references therein). Unlike [C II] though, the UV continuum needs to be corrected, as it is affected by dust extinction. Apart from large surveys, dozens of targeted [C II] detections in the Epoch of Reionization (EoR) have been reported (see Harikane et al., 2020, for a compilation), with MACS1149-JD1 at being the farthest [C II] emitter so far discovered (Carniani et al., 2020).{marginnote} \entryEoREpoch of Reionization is the time (translated to redshift ) in which H between galaxies became ionized by first stars, galaxies and quasars. Several peculiarities are emerging from EoR FIR line detections, including the presence of low surface brightness [C II] halos arising from the circumgalactic medium (Fujimoto et al., 2019, Ginolfi et al., 2020, Herrera-Camus et al., 2021), large scatter with respect to the local [C II]-SFR relation (De Looze et al., 2014), and remarkably low [C II]/[O III] 88m ratios (see Figure 14).
To infer the overall conditions of PDRs (and possibly XDRs), PDR/XDR models that provide an accurate treatment of atomic and molecular microphysics on small scales are coupled with a rapidly increasing number of zoom-in cosmological simulations able to resolve pc scales in the ISM (Vallini et al., 2013, 2015, Olsen et al., 2017, Pallottini et al., 2017, 2019, Katz et al., 2017, 2019, Arata et al., 2020, Lupi et al., 2020) and with semi-analytic models, describing the cosmic evolution of galaxies with (Lagache et al., 2018, Popping et al., 2019, Ferrara et al., 2019). Emission lines are computed in post-processing by interpolating pre-tabulated PDR/XDR calculations at the local FUV/X-ray flux, gas density, column density, and chemical abundances resulting from the hydro+radiative transfer simulations.
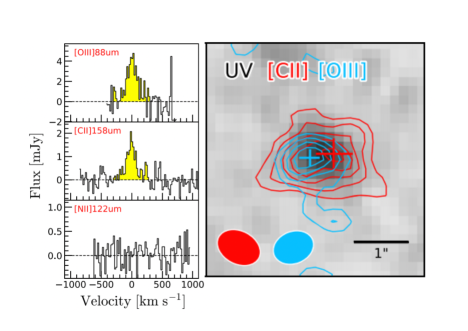
The cosmic microwave background (CMB) has non-negligible effects on the thermal equilibrium of cold gas in the EoR. Hence, any PDR/XDR model must include the appropriate CMB at the relevant redshift (da Cunha et al., 2013). The CMB sets a lower limit of at for the gas temperature, and provides a stronger background against which the lines are observed. The [C II] emission from the diffuse neutral medium (Vallini et al., 2015, Olsen et al., 2017), and the low- CO lines (da Cunha et al., 2013) are affected by these two competing effects. The comparison between simulations and the observed line luminosities, ratios, and morphology suggests early galaxies to be characterized by high FUV fluxes ( on kpc scales, Katz et al., 2017, Rybak et al., 2020a), high gas densities ( on kpc scales, Pallottini et al., 2017), high turbulence ( on 30 pc scales, Leung et al., 2020, Kohandel et al., 2020), and bursty star formation episodes during which PDRs are efficiently photoevaporated (Vallini et al., 2017, Decataldo et al., 2019). The low filling factor of PDRs in a predominantly ionized ISM on large scales, along with low C/O abundance ratios at low-metallicities, have been suggested as possible causes for the low [C II]/[O III] ratios observed at (Harikane et al., 2020, Arata et al., 2020). The occurrence of extended [C II] halos is, however, far from being fully understood. SN-driven cooling outflows in which the gas cools very rapidly to K and recombines at the same time is suggested as a viable mechanism (Pizzati et al., 2020). In this regime the formation and survival of C+ is guaranteed, and the [C II] emission comes from PDRs in the cold neutral outflowing gas.
The expected low metallicity and dust content of high- sources, and the correspondingly more widespread CO photodissociation (comparable to that of low- dwarf galaxies, Madden et al., 2020, and discussion in Section 8.4) make the [C II] likely a better tracer of the total H2 mass than CO in the high- Universe (Zanella et al., 2018, Dessauges-Zavadsky et al., 2020). H2 mass derivations from low- CO lines are still scarce (Pavesi et al., 2019) because the CMB (da Cunha et al., 2013) makes low- CO line detections challenging. Instead, simulations suggest mid- CO lines to be enhanced in EoR galaxies (Vallini et al., 2018, Inoue et al., 2020), boosted by the high turbulence, density, and molecular gas temperature characterizing these sources. As discussed in Section 5.3.2, high- CO lines and the [C I]/[C II] ratios can be useful diagnostics to determine whether, on global scales, FUV photons from star formation or X-rays by AGN accretion influence the ISM heating. Given that the host galaxies of massive quasars are now routinely detected in [C II] (e.g., Decarli et al., 2018, Li et al., 2020a), [C I], and CO (e.g., Gallerani et al., 2014, Venemans et al., 2017, Wang et al., 2019, Carniani et al., 2019, Li et al., 2020b), an overall estimate of the physical properties (gas density, gas temperature, dominant heating mechanism) in their ISM is now possible. In particular, the low [C I]/[C II] ratio observed by Venemans et al. (2017) and Pensabene et al. (2021) in quasars suggest that, despite the powerful accretion rates onto the central black hole, the heating of the bulk of molecular gas in the host galaxy is likely provided by star formation producing PDRs. Gallerani et al. (2014) exploited instead the CO(17-16) line to infer the presence of a substantial XDR component contributing to the molecular emission from the host galaxy of a quasar. Pensabene et al. (2021) also concluded that high- CO detections in two quasars at show evidence of an XDR component, although the emission in the same sources points towards a significant contribution of IR pumping from star formation.
[SUMMARY POINTS]
-
1.
Velocity resolved PDR lines provide the kinematics of the neutral atomic gas. These line observations point to stellar winds as having a prominent role in stellar feedback, although theoretical simulations suggest that stellar winds are much less important due to turbulent mixing of cool material into the wind shocked gas. In addition, it has long been suspected that foreground absorption has reduced the emitted PDR line intensities. The velocity resolved observations have confirmed this for [O I] and [C II] along diffuse lines of sight and towards dense PDRs.
-
2.
1-D models set the ground work for understanding the chemistry, thermal processes, radiation transfer, and line diagnostics. In general, these are in good agreement with observations of the dominant cooling lines. Integrating PDR models with hydrodynamic codes add an additional tool to understand the complex geometries, velocity fields, and time dependence in FUV illuminated turbulent gas. These are especially important for simulations of the diffuse ISM, cloud evolution, galactic disks, and global simulations of ISM phases.
-
3.
A correlation between the thermal pressure and the strength of the radiation field is observed over several orders of magnitude. It is particularly interesting to note that Galactic and extragalactic star forming regions as well as full galaxies covering a wide range of environments seem to follow a similar trend.
-
4.
A significant fraction of molecular mass resides in CO-dark gas especially in low-metallicity/highly irradiated environments. The fraction is estimated to be % in the solar neighborhood but is % for galaxies in the Herschel DGS.
-
5.
New observational facilities, reaching high spectral and spatial resolution, help to identify and characterize the mix of different components in the Galactic and extragalactic ISM.
-
6.
The CO ladder excitation and [C I]/[C II] ratios are useful diagnostics to determine if FUV or X-rays dominate the ISM heating of extragalactic sources. High spatial resolution observations of HCN and HCO+ lines can disentangle XDRs from PDRs in the galactic center of nearby sources, albeit time-dependence, shock heating, and IR pumping must be included in the modelling of the line ratios.
-
7.
PDR and XDR tracers are now routinely detected on galactic scales over cosmic time using ALMA. The combination with multi-wavelength observations enables linking the star formation history of the Universe to the evolution of the physical and chemical properties of the gas. Current PDR observations in high- galaxies suggest high , and high density. The high ratios between ionized vs PDR gas tracers point towards low PDR filling factors. In luminous high- quasars the bulk of molecular gas heating seems to be provided by star formation producing PDRs but high- CO lines are consistent with an enhancement produced by an XDR component. High spatial resolution observations can assess if the high- lines are confined to the galactic center.
[FUTURE ISSUES]
-
1.
Wide-field, high spatial and spectral resolution IR observations are crucially needed to examine the kinematics of large scale PDR structures, and to bridge Galactic and extragalactic observations, and improve the interpretation of lower-resolution observations. Several planned surveys and new instruments will make the first steps in this direction in the coming years (e.g., SOFIA, JWST, GUSTO). In the nearby Milky Way, JWST will resolve PDR line emission on scales so that thermal and chemical processes are well constrained.
-
2.
Several crucial chemical processes need further refinement through laboratory, theoretical, or observational work. These include H2 formation at high gas and grain temperatures and rates for ion recombination on grains.
-
3.
Another workshop comparing PDR models would be beneficial to understand more recent developments and to examine differences in temperature structure. This could also include hydrodynamic simulations to compare directly steady-state and time dependent codes.
-
4.
Further studies on time dependence in XDRs, with a specific focus on galactic centers are needed. Currently this aspect is mainly treated in the context of protoplanetary disks.
-
5.
An XDR-focused workshop would be beneficial to compare and benchmark models developed for different purposes (AGN impact on galactic centers, protoplanetary disk characterization) and to settle the capability of diagnostic line ratios to discriminate between X-ray and FUV induced heating.
DISCLOSURE STATEMENT
The authors are not aware of any affiliations, memberships, funding, or financial holdings that might be perceived as affecting the objectivity of this review.
ACKNOWLEDGMENTS
We would like to acknowledge helpful discussions with D. Hollenbach, A. Tielens, A. Sternberg, S. Bialy, G. Esplugues, A. Ferrara, S. Gresens, B. Godard, M. Kaufman, D. Kruijssen, D. Neufeld, C. Pabst, A. Pallottini, M. Pound, M. Röllig, D. Seifried, E. Tarantino, M. Tiwari, help with figures from C. Pabst, M. Pound, and M. Tiwari, and a careful reading of the manuscript and insightful comments from E. van Dishoeck and E. Ostriker. MGW was supported in part by SOFIA Legacy Programs FEEDBACK and HyGal provided by NASA through awards SOF070077 and SOF080038, and by the balloon project GUSTO through NASA award NNG16FC08C. LV gratefully acknowledges support from the European Research Council (ERC) under the European Union’s Horizon 2020 research and innovation programme via the ERC Advanced Grant INTERSTELLAR (grant agreement number 740120, PI Ferrara). MC gratefully acknowledges funding from the Deutsche Forschungsgemeinschaft (German Research Foundation) through an Emmy Noether Research Group (grant number KR4801/1-1) and from the European Research Council (ERC) under the European Union’s Horizon 2020 research and innovation programme via the ERC Starting Grant MUSTANG (grant agreement number 714907).
References
- Aalto et al. (2011) Aalto S, Costagliola F, van der Tak F, Meijerink R. 2011. A&A 527:A69
- Aalto et al. (2012) Aalto S, Garcia-Burillo S, Muller S, Winters JM, van der Werf P, et al. 2012. A&A 537:A44
- Aalto et al. (2007) Aalto S, Spaans M, Wiedner MC, Hüttemeister S. 2007. A&A 464:193–200
- Abdullah et al. (2017) Abdullah A, Brandl BR, Groves B, Wolfire M, Calzetti D, et al. 2017. ApJ 842:4
- Abdullah & Tielens (2020) Abdullah A, Tielens AGGM. 2020. A&A 639:A110
- Abel et al. (2005) Abel NP, Ferland GJ, Shaw G, van Hoof PAM. 2005. ApJS 161:65–95
- Abel et al. (2007) Abel NP, Sarma AP, Troland TH, Ferland GJ. 2007. ApJ 662:1024–1032
- Abel et al. (2008) Abel NP, van Hoof PAM, Shaw G, Ferland GJ, Elwert T. 2008. ApJ 686:1125–1136
- Abgrall et al. (1992) Abgrall H, Le Bourlot J, Pineau Des Forets G, Roueff E, Flower DR, Heck L. 1992. A&A 253:525–536
- Abgrall et al. (2000) Abgrall H, Roueff E, Drira I. 2000. A&AS 141:297–300
- Agúndez et al. (2010) Agúndez M, Goicoechea JR, Cernicharo J, Faure A, Roueff E. 2010. ApJ 713:662–670
- Aikawa et al. (2002) Aikawa Y, van Zadelhoff GJ, van Dishoeck EF, Herbst E. 2002. A&A 386:622–632
- Allamandola et al. (1989) Allamandola LJ, Tielens AGGM, Barker JR. 1989. ApJS 71:733
- Anderson et al. (2019) Anderson LD, Makai Z, Luisi M, Andersen M, Russeil D, et al. 2019. ApJ 882:11
- Andree-Labsch et al. (2017) Andree-Labsch S, Ossenkopf-Okada V, Röllig M. 2017. A&A 598:A2
- Andrews et al. (2016) Andrews H, Candian A, Tielens AGGM. 2016. A&A 595:A23
- Aniano et al. (2020) Aniano G, Draine BT, Hunt LK, Sandstrom K, Calzetti D, et al. 2020. ApJ 889:150
- Ao et al. (2013) Ao Y, Henkel C, Menten KM, Requena-Torres MA, Stanke T, et al. 2013. A&A 550:A135
- Apostolovski et al. (2019) Apostolovski Y, Aravena M, Anguita T, Spilker J, Weiß A, et al. 2019. A&A 628:A23
- Arata et al. (2020) Arata S, Yajima H, Nagamine K, Abe M, Khochfar S. 2020. MNRAS 498:5541–5556
- Aresu et al. (2012) Aresu G, Meijerink R, Kamp I, Spaans M, Thi WF, Woitke P. 2012. A&A 547:A69
- Audit & Hennebelle (2010) Audit E, Hennebelle P. 2010. A&A 511:A76
- Ba et al. (2020) Ba YA, Dubernet ML, Moreau N, Zwölf CM. 2020. Atoms 8:69
- Baan et al. (2008) Baan WA, Henkel C, Loenen AF, Baudry A, Wiklind T. 2008. A&A 477:747–762
- Baganoff et al. (2001) Baganoff FK, Bautz MW, Brandt WN, Chartas G, Feigelson ED, et al. 2001. Nature 413:45–48
- Bakes & Tielens (1994) Bakes ELO, Tielens AGGM. 1994. ApJ 427:822
- Barnes et al. (2020) Barnes AT, Longmore SN, Dale JE, Krumholz MR, Kruijssen JMD, Bigiel F. 2020. MNRAS 498:4906–4923
- Bayet et al. (2011) Bayet E, Williams DA, Hartquist TW, Viti S. 2011. MNRAS 414:1583–1591
- Bell et al. (2006) Bell TA, Roueff E, Viti S, Williams DA. 2006. MNRAS 371:1865–1872
- Bellocchi et al. (2020) Bellocchi E, Martín-Pintado J, Güsten R, Requena-Torres MA, Harris A, et al. 2020. A&A 642:A166
- Bellomi et al. (2020) Bellomi E, Godard B, Hennebelle P, Valdivia V, Pineau des Forêts G, et al. 2020. A&A 643:A36
- Bennett et al. (1994) Bennett CL, Fixsen DJ, Hinshaw G, Mather JC, Moseley SH, et al. 1994. ApJ 434:587
- Benz et al. (2016) Benz AO, Bruderer S, van Dishoeck EF, Melchior M, Wampfler SF, et al. 2016. A&A 590:A105
- Bergin et al. (2007) Bergin EA, Aikawa Y, Blake GA, van Dishoeck EF. 2007. The Chemical Evolution of Protoplanetary Disks. In Protostars and Planets V, eds. B Reipurth, D Jewitt, K Keil
- Bergin et al. (2000) Bergin EA, Melnick GJ, Stauffer JR, Ashby MLN, Chin G, et al. 2000. ApJ 539:L129–L132
- Bernard-Salas et al. (2012) Bernard-Salas J, Habart E, Arab H, Abergel A, Dartois E, et al. 2012. A&A 538:A37
- Berné et al. (2022) Berné O, Habart É, Peeters E, Abergel A, Bergin EA, et al. 2022. arXiv e-prints :arXiv:2201.05112
- Berné & Tielens (2012) Berné O, Tielens AGGM. 2012. Proceedings of the National Academy of Science 109:401–406
- Bertoldi & Draine (1996) Bertoldi F, Draine BT. 1996. ApJ 458:222
- Bethell & Bergin (2011) Bethell TJ, Bergin EA. 2011. ApJ 740:7
- Bialy et al. (2017) Bialy S, Burkhart B, Sternberg A. 2017. ApJ 843:92
- Bialy et al. (2019) Bialy S, Neufeld D, Wolfire M, Sternberg A, Burkhart B. 2019. ApJ 885:109
- Bialy & Sternberg (2019) Bialy S, Sternberg A. 2019. ApJ 881:160
- Bisbas et al. (2012) Bisbas TG, Bell TA, Viti S, Yates J, Barlow MJ. 2012. MNRAS 427:2100–2118
- Bisbas et al. (2019) Bisbas TG, Schruba A, van Dishoeck EF. 2019. MNRAS 485:3097–3111
- Bisbas et al. (2021) Bisbas TG, Tan JC, Tanaka KEI. 2021. MNRAS
- Bisbas et al. (2017) Bisbas TG, van Dishoeck EF, Papadopoulos PP, Szűcs L, Bialy S, Zhang ZY. 2017. ApJ 839:90
- Black & Dalgarno (1977) Black JH, Dalgarno A. 1977. ApJS 34:405–423
- Black & van Dishoeck (1987) Black JH, van Dishoeck EF. 1987. ApJ 322:412
- Boger & Sternberg (2005) Boger GI, Sternberg A. 2005. ApJ 632:302–315
- Bolatto et al. (2013) Bolatto AD, Wolfire M, Leroy AK. 2013. ARA&A 51:207–268
- Boogaard et al. (2020) Boogaard LA, van der Werf P, Weiss A, Popping G, Decarli R, et al. 2020. ApJ 902:109
- Boogert et al. (2015) Boogert ACA, Gerakines PA, Whittet DCB. 2015. ARA&A 53:541–581
- Boselli et al. (2002) Boselli A, Gavazzi G, Lequeux J, Pierini D. 2002. A&A 385:454–463
- Bouwens et al. (2021) Bouwens RJ, Smit R, Schouws S, Stefanon M, Bowler R, et al. 2021. arXiv e-prints :arXiv:2106.13719
- Bradford et al. (2009) Bradford CM, Aguirre JE, Aikin R, Bock JJ, Earle L, et al. 2009. ApJ 705:112–122
- Braine et al. (2012) Braine J, Gratier P, Kramer C, Israel FP, van der Tak F, et al. 2012. A&A 544:A55
- Brauher et al. (2008) Brauher JR, Dale DA, Helou G. 2008. ApJS 178:280–301
- Brisbin et al. (2015) Brisbin D, Ferkinhoff C, Nikola T, Parshley S, Stacey GJ, et al. 2015. ApJ 799:13
- Bron et al. (2018) Bron E, Agúndez M, Goicoechea JR, Cernicharo J. 2018. arXiv e-prints :arXiv:1801.01547
- Bron et al. (2014) Bron E, Le Bourlot J, Le Petit F. 2014. A&A 569:A100
- Bron et al. (2016) Bron E, Le Petit F, Le Bourlot J. 2016. A&A 588:A27
- Bruderer et al. (2009a) Bruderer S, Benz AO, Doty SD, van Dishoeck EF, Bourke TL. 2009a. ApJ 700:872–886
- Bruderer et al. (2009b) Bruderer S, Doty SD, Benz AO. 2009b. ApJS 183:179–196
- Bruderer et al. (2012) Bruderer S, van Dishoeck EF, Doty SD, Herczeg GJ. 2012. A&A 541:A91
- Burgh et al. (2010) Burgh EB, France K, Jenkins EB. 2010. ApJ 708:334–341
- Burton et al. (2015) Burton MG, Ashley MCB, Braiding C, Freeman M, Kulesa C, et al. 2015. ApJ 811:13
- Burton et al. (2013) Burton MG, Braiding C, Glueck C, Goldsmith P, Hawkes J, et al. 2013. PASA 30:e044
- Burton et al. (1990) Burton MG, Hollenbach DJ, Tielens AGGM. 1990. ApJ 365:620
- Busch et al. (2019) Busch MP, Allen RJ, Engelke PD, Hogg DE, Neufeld DA, Wolfire MG. 2019. ApJ 883:158
- Cañameras et al. (2021) Cañameras R, Nesvadba NPH, Kneissl R, König S, Yang C, et al. 2021. A&A 645:A45
- Carniani et al. (2020) Carniani S, Ferrara A, Maiolino R, Castellano M, Gallerani S, et al. 2020. MNRAS 499:5136–5150
- Carniani et al. (2019) Carniani S, Gallerani S, Vallini L, Pallottini A, Tazzari M, et al. 2019. MNRAS 489:3939–3952
- Carniani et al. (2018) Carniani S, Maiolino R, Amorin R, Pentericci L, Pallottini A, et al. 2018. MNRAS 478:1170–1184
- Casey et al. (2019) Casey CM, Zavala JA, Aravena M, Béthermin M, Caputi KI, et al. 2019. ApJ 887:55
- Castellanos et al. (2018) Castellanos P, Candian A, Andrews H, Tielens AGGM. 2018. A&A 616:A167
- Castor et al. (1975) Castor J, McCray R, Weaver R. 1975. ApJ 200:L107–L110
- Cazaux & Tielens (2004) Cazaux S, Tielens AGGM. 2004. ApJ 604:222–237
- Cazaux & Tielens (2010) Cazaux S, Tielens AGGM. 2010. ApJ 715:698–699
- Chevance (2016) Chevance M. 2016. The physical processes in the interstellar medium of the Magellanic Clouds. Ph.D. thesis, Université Sorbonne Paris Cité, Paris, France.
- Chevance et al. (2020a) Chevance M, Kruijssen JMD, Hygate APS, Schruba A, Longmore SN, et al. 2020a. MNRAS 493:2872–2909
- Chevance et al. (2022) Chevance M, Kruijssen JMD, Krumholz MR, Groves B, Keller BW, et al. 2022. MNRAS 509:272–288
- Chevance et al. (2020b) Chevance M, Madden SC, Fischer C, Vacca WD, Lebouteiller V, et al. 2020b. MNRAS 494:5279–5292
- Chevance et al. (2016) Chevance M, Madden SC, Lebouteiller V, Godard B, Cormier D, et al. 2016. A&A 590:A36
- Chokshi et al. (1988) Chokshi A, Tielens AGGM, Werner MW, Castelaz MW. 1988. ApJ 334:803
- Churchwell et al. (2006) Churchwell E, Povich MS, Allen D, Taylor MG, Meade MR, et al. 2006. ApJ 649:759–778
- Cigan et al. (2016) Cigan P, Young L, Cormier D, Lebouteiller V, Madden S, et al. 2016. AJ 151:14
- Clark et al. (2012) Clark PC, Glover SCO, Klessen RS. 2012. MNRAS 420:745–756
- Clark et al. (2019) Clark PC, Glover SCO, Ragan SE, Duarte-Cabral A. 2019. MNRAS 486:4622–4637
- Clark et al. (2013) Clark PC, Glover SCO, Ragan SE, Shetty R, Klessen RS. 2013. ApJ 768:L34
- Cormier et al. (2019) Cormier D, Abel NP, Hony S, Lebouteiller V, Madden SC, et al. 2019. A&A 626:A23
- Cormier et al. (2015) Cormier D, Madden SC, Lebouteiller V, Abel N, Hony S, et al. 2015. A&A 578:A53
- Costagliola et al. (2011) Costagliola F, Aalto S, Rodriguez MI, Muller S, Spoon HWW, et al. 2011. A&A 528:A30
- Cravens & Dalgarno (1978) Cravens TE, Dalgarno A. 1978. ApJ 219:750–752
- Crawford et al. (1985) Crawford MK, Genzel R, Townes CH, Watson DM. 1985. ApJ 291:755–771
- Crowther (2019) Crowther PA. 2019. Galaxies 7:88
- Croxall et al. (2017) Croxall KV, Smith JD, Pellegrini E, Groves B, Bolatto A, et al. 2017. ApJ 845:96
- Croxall et al. (2012) Croxall KV, Smith JD, Wolfire MG, Roussel H, Sandstrom KM, et al. 2012. ApJ 747:81
- Crutcher & Watson (1976) Crutcher RM, Watson WD. 1976. ApJ 209:778–781
- Cubick et al. (2008) Cubick M, Stutzki J, Ossenkopf V, Kramer C, Röllig M. 2008. A&A 488:623–634
- Cuppen & Hornekær (2008) Cuppen HM, Hornekær L. 2008. J. Chem. Phys. 128:174707–174707
- Cuppen et al. (2010) Cuppen HM, Ioppolo S, Romanzin C, Linnartz H. 2010. Physical Chemistry Chemical Physics (Incorporating Faraday Transactions) 12:12077
- Cuppen et al. (2017) Cuppen HM, Walsh C, Lamberts T, Semenov D, Garrod RT, et al. 2017. Space Sci Rev 212:1–58
- da Cunha et al. (2013) da Cunha E, Groves B, Walter F, Decarli R, Weiss A, et al. 2013. ApJ 766:13
- Dale & Helou (2002) Dale DA, Helou G. 2002. ApJ 576:159–168
- Dalgarno et al. (1999) Dalgarno A, Yan M, Liu W. 1999. ApJS 125:237–256
- De Looze et al. (2011) De Looze I, Baes M, Bendo GJ, Cortese L, Fritz J. 2011. MNRAS 416:2712–2724
- De Looze et al. (2014) De Looze I, Cormier D, Lebouteiller V, Madden S, Baes M, et al. 2014. A&A 568:A62
- Decarli et al. (2018) Decarli R, Walter F, Venemans BP, Bañados E, Bertoldi F, et al. 2018. ApJ 854:97
- Decataldo et al. (2019) Decataldo D, Pallottini A, Ferrara A, Vallini L, Gallerani S. 2019. MNRAS 487:3377–3391
- Dedes et al. (2010) Dedes C, Röllig M, Mookerjea B, Okada Y, Ossenkopf V, et al. 2010. A&A 521:L24
- Dessauges-Zavadsky et al. (2020) Dessauges-Zavadsky M, Ginolfi M, Pozzi F, Béthermin M, Le Fèvre O, et al. 2020. A&A 643:A5
- D’Odorico et al. (2018) D’Odorico V, Feruglio C, Ferrara A, Gallerani S, Pallottini A, et al. 2018. ApJ 863:L29
- Draine (1978) Draine BT. 1978. ApJS 36:595–619
- Draine (2011) Draine BT. 2011. Physics of the Interstellar and Intergalactic Medium. Princeton University Press
- Draine & Bertoldi (1996) Draine BT, Bertoldi F. 1996. ApJ 468:269
- Draine & Sutin (1987) Draine BT, Sutin B. 1987. ApJ 320:803
- Dulieu et al. (2013) Dulieu F, Congiu E, Noble J, Baouche S, Chaabouni H, et al. 2013. Scientific Reports 3:1338
- Dupuy et al. (2018) Dupuy R, Bertin M, Féraud G, Hassenfratz M, Michaut X, et al. 2018. Nature Astronomy 2:796–801
- Ercolano et al. (2008) Ercolano B, Drake JJ, Raymond JC, Clarke CC. 2008. ApJ 688:398–407
- Escalante et al. (1991) Escalante V, Sternberg A, Dalgarno A. 1991. ApJ 375:630
- Esplugues et al. (2019) Esplugues G, Cazaux S, Caselli P, Hocuk S, Spaans M. 2019. MNRAS 486:1853–1874
- Esplugues et al. (2016) Esplugues GB, Cazaux S, Meijerink R, Spaans M, Caselli P. 2016. A&A 591:A52
- Esplugues et al. (2017) Esplugues GB, Cazaux S, Meijerink R, Spaans M, Caselli P. 2017. A&A 598:C1
- Ferland et al. (2017) Ferland GJ, Chatzikos M, Guzmán F, Lykins ML, van Hoof PAM, et al. 2017. Rev. Mexicana Astron. Astrofis. 53:385–438
- Ferland et al. (2013) Ferland GJ, Porter RL, van Hoof PAM, Williams RJR, Abel NP, et al. 2013. Rev. Mexicana Astron. Astrofis. 49:137–163
- Ferrara et al. (2019) Ferrara A, Vallini L, Pallottini A, Gallerani S, Carniani S, et al. 2019. MNRAS 489:1–12
- Flagey et al. (2013) Flagey N, Goldsmith PF, Lis DC, Gerin M, Neufeld D, et al. 2013. ApJ 762:11
- Flannery et al. (1980) Flannery BP, Roberge W, Rybicki GB. 1980. ApJ 236:598–608
- Franeck et al. (2018) Franeck A, Walch S, Seifried D, Clarke SD, Ossenkopf-Okada V, et al. 2018. MNRAS 481:4277–4299
- Fujimoto et al. (2019) Fujimoto S, Ouchi M, Ferrara A, Pallottini A, Ivison RJ, et al. 2019. ApJ 887:107
- Gaches et al. (2019) Gaches BAL, Offner SSR, Bisbas TG. 2019. ApJ 883:190
- Gallagher et al. (2018) Gallagher MJ, Leroy AK, Bigiel F, Cormier D, Jiménez-Donaire MJ, et al. 2018. ApJ 858:90
- Gallerani et al. (2014) Gallerani S, Ferrara A, Neri R, Maiolino R. 2014. MNRAS 445:2848–2853
- García-Burillo et al. (2002) García-Burillo S, Martín-Pintado J, Fuente A, Usero A, Neri R. 2002. ApJ 575:L55–L58
- García-Burillo et al. (2010) García-Burillo S, Usero A, Fuente A, Martín-Pintado J, Boone F, et al. 2010. A&A 519:A2
- Garrod et al. (2007) Garrod RT, Wakelam V, Herbst E. 2007. A&A 467:1103–1115
- Garrod et al. (2008) Garrod RT, Widicus Weaver SL, Herbst E. 2008. ApJ 682:283–302
- Gerin et al. (2010) Gerin M, de Luca M, Black J, Goicoechea JR, Herbst E, et al. 2010. A&A 518:L110
- Gerin et al. (2016) Gerin M, Neufeld DA, Goicoechea JR. 2016. ARA&A 54:181–225
- Gerin et al. (2015) Gerin M, Ruaud M, Goicoechea JR, Gusdorf A, Godard B, et al. 2015. A&A 573:A30
- Gibb et al. (2004) Gibb EL, Whittet DCB, Boogert ACA, Tielens AGGM. 2004. ApJS 151:35–73
- Ginolfi et al. (2020) Ginolfi M, Jones GC, Béthermin M, Fudamoto Y, Loiacono F, et al. 2020. A&A 633:A90
- Ginsburg et al. (2016) Ginsburg A, Henkel C, Ao Y, Riquelme D, Kauffmann J, et al. 2016. A&A 586:A50
- Glassgold et al. (2012) Glassgold AE, Galli D, Padovani M. 2012. ApJ 756:157
- Glassgold & Langer (1973) Glassgold AE, Langer WD. 1973. ApJ 179:L147
- Glassgold & Langer (1974) Glassgold AE, Langer WD. 1974. ApJ 193:73–91
- Glassgold & Langer (1975) Glassgold AE, Langer WD. 1975. ApJ 197:347–350
- Glassgold et al. (1997) Glassgold AE, Najita J, Igea J. 1997. ApJ 480:344–350
- Glover & Abel (2008) Glover SCO, Abel T. 2008. MNRAS 388:1627–1651
- Glover & Clark (2016) Glover SCO, Clark PC. 2016. MNRAS 456:3596–3609
- Glover et al. (2015) Glover SCO, Clark PC, Micic M, Molina F. 2015. MNRAS 448:1607–1627
- Glover et al. (2010) Glover SCO, Federrath C, Mac Low MM, Klessen RS. 2010. MNRAS 404:2–29
- Glover & Mac Low (2007) Glover SCO, Mac Low MM. 2007. ApJ 659:1317–1337
- Glover & Mac Low (2011) Glover SCO, Mac Low MM. 2011. MNRAS 412:337–350
- Godard et al. (2012) Godard B, Falgarone E, Gerin M, Lis DC, De Luca M, et al. 2012. A&A 540:A87
- Godard et al. (2014) Godard B, Falgarone E, Pineau des Forêts G. 2014. A&A 570:A27
- Goicoechea et al. (2021) Goicoechea JR, Aguado A, Cuadrado S, Roncero O, Pety J, et al. 2021. A&A 647:A10
- Goicoechea et al. (2013) Goicoechea JR, Etxaluze M, Cernicharo J, Gerin M, Neufeld DA, et al. 2013. ApJ 769:L13
- Goicoechea & Le Bourlot (2007) Goicoechea JR, Le Bourlot J. 2007. A&A 467:1–14
- Goicoechea et al. (2020) Goicoechea JR, Pabst CHM, Kabanovic S, Santa-Maria MG, Marcelino N, et al. 2020. A&A 639:A1
- Goicoechea et al. (2016) Goicoechea JR, Pety J, Cuadrado S, Cernicharo J, Chapillon E, et al. 2016. Nature 537:207–209
- Goicoechea et al. (2004) Goicoechea JR, Rodríguez-Fernández NJ, Cernicharo J. 2004. ApJ 600:214–233
- Goicoechea et al. (2019) Goicoechea JR, Santa-Maria MG, Bron E, Teyssier D, Marcelino N, et al. 2019. A&A 622:A91
- Goicoechea et al. (2015) Goicoechea JR, Teyssier D, Etxaluze M, Goldsmith PF, Ossenkopf V, et al. 2015. ApJ 812:75
- Goldshmidt & Sternberg (1995) Goldshmidt O, Sternberg A. 1995. ApJ 439:256
- Goldsmith (2019) Goldsmith PF. 2019. ApJ 887:54
- Goldsmith & Kauffmann (2017) Goldsmith PF, Kauffmann J. 2017. ApJ 841:25
- Goldsmith et al. (2012) Goldsmith PF, Langer WD, Pineda JL, Velusamy T. 2012. ApJS 203:13
- Goldsmith et al. (2021) Goldsmith PF, Langer WD, Seo Y, Pineda J, Stutzki J, et al. 2021. ApJ 916:6
- Goldsmith & Li (2005) Goldsmith PF, Li D. 2005. ApJ 622:938–958
- Goldsmith et al. (2007) Goldsmith PF, Li D, Krčo M. 2007. ApJ 654:273–289
- Goldsmith et al. (2010) Goldsmith PF, Velusamy T, Li D, Langer WD. 2010. ApJ 715:1370–1382
- Goldsmith et al. (2022) Goldsmith PF, Walker CK, Kulesa CA, et al. 2022. Galactic/Extragalactic Spectroscopic Terahertz Observatory (GUSTO). In American Astronomical Society Meeting Abstracts #239, vol. 239
- Gong et al. (2017) Gong M, Ostriker EC, Wolfire MG. 2017. ApJ 843:38
- Gordon et al. (2003) Gordon KD, Clayton GC, Misselt KA, Landolt AU, Wolff MJ. 2003. ApJ 594:279–293
- Gorti & Hollenbach (2002) Gorti U, Hollenbach D. 2002. ApJ 573:215–237
- Gorti & Hollenbach (2004) Gorti U, Hollenbach D. 2004. ApJ 613:424–447
- Graciá-Carpio et al. (2011) Graciá-Carpio J, Sturm E, Hailey-Dunsheath S, Fischer J, Contursi A, et al. 2011. ApJ 728:L7
- Graf et al. (2012) Graf UU, Simon R, Stutzki J, Colgan SWJ, Guan X, et al. 2012. A&A 542:L16
- Graham et al. (1993) Graham JR, Serabyn E, Herbst TM, Matthews K, Neugebauer G, et al. 1993. AJ 105:250
- Grassi et al. (2014) Grassi T, Bovino S, Schleicher DRG, Prieto J, Seifried D, et al. 2014. MNRAS 439:2386–2419
- Grenier et al. (2005) Grenier IA, Casandjian JM, Terrier R. 2005. Science 307:1292–1295
- Guevara et al. (2020) Guevara C, Stutzki J, Ossenkopf-Okada V, Simon R, Pérez-Beaupuits JP, et al. 2020. A&A 636:A16
- Gullberg et al. (2015) Gullberg B, De Breuck C, Vieira JD, Weiß A, Aguirre JE, et al. 2015. MNRAS 449:2883–2900
- Guzmán et al. (2015) Guzmán VV, Pety J, Goicoechea JR, Gerin M, Roueff E, et al. 2015. ApJ 800:L33
- Guzmán et al. (2014) Guzmán VV, Pety J, Gratier P, Goicoechea JR, Gerin M, et al. 2014. Faraday Discussions 168:103–127
- Habart et al. (2004) Habart E, Boulanger F, Verstraete L, Walmsley CM, Pineau des Forêts G. 2004. A&A 414:531–544
- Habing (1968) Habing HJ. 1968. Bull. Astron. Inst. Netherlands 19:421
- Hacar et al. (2020) Hacar A, Bosman AD, van Dishoeck EF. 2020. A&A 635:A4
- Hailey-Dunsheath et al. (2012) Hailey-Dunsheath S, Sturm E, Fischer J, Sternberg A, Graciá-Carpio J, et al. 2012. ApJ 755:57
- Hamilton et al. (2018) Hamilton JR, Faure A, Tennyson J. 2018. MNRAS 476:2931–2937
- Harada et al. (2018) Harada N, Sakamoto K, Martín S, Aalto S, Aladro R, Sliwa K. 2018. ApJ 855:49
- Harada et al. (2013) Harada N, Thompson TA, Herbst E. 2013. ApJ 765:108
- Harikane et al. (2020) Harikane Y, Ouchi M, Inoue AK, Matsuoka Y, Tamura Y, et al. 2020. ApJ 896:93
- Harris et al. (2021) Harris AI, Güsten R, Requena-Torres MA, Riquelme D, Morris MR, et al. 2021. ApJ 921:33
- Hasegawa & Herbst (1993) Hasegawa TI, Herbst E. 1993. MNRAS 261:83–102
- Heays et al. (2017) Heays AN, Bosman AD, van Dishoeck EF. 2017. A&A 602:A105
- Heays et al. (2014) Heays AN, Visser R, Gredel R, Ubachs W, Lewis BR, et al. 2014. A&A 562:A61
- Heiles & Troland (2003) Heiles C, Troland TH. 2003. ApJ 586:1067–1093
- Heintz & Watson (2020) Heintz KE, Watson D. 2020. ApJ 889:L7
- Herrera-Camus et al. (2015) Herrera-Camus R, Bolatto AD, Wolfire MG, Smith JD, Croxall KV, et al. 2015. ApJ 800:1
- Herrera-Camus et al. (2021) Herrera-Camus R, Förster Schreiber N, Genzel R, Tacconi L, Bolatto A, et al. 2021. A&A 649:A31
- Herrera-Camus et al. (2018a) Herrera-Camus R, Sturm E, Graciá-Carpio J, Lutz D, Contursi A, et al. 2018a. ApJ 861:94
- Herrera-Camus et al. (2018b) Herrera-Camus R, Sturm E, Graciá-Carpio J, Lutz D, Contursi A, et al. 2018b. ApJ 861:95
- Higgins et al. (2021) Higgins R, Kabanovic S, Pabst C, Teyssier D, Goicoechea JR, et al. 2021. A&A 652:A77
- Hill et al. (2018) Hill AS, Mac Low MM, Gatto A, Ibáñez-Mejía JC. 2018. ApJ 862:55
- Hill & Hollenbach (1978) Hill JK, Hollenbach DJ. 1978. ApJ 225:390–404
- Hocuk et al. (2017) Hocuk S, Szűcs L, Caselli P, Cazaux S, Spaans M, Esplugues GB. 2017. A&A 604:A58
- Hodge & da Cunha (2020) Hodge JA, da Cunha E. 2020. Royal Society Open Science 7:200556
- Hogerheijde et al. (1995a) Hogerheijde MR, de Geus EJ, Spaans M, van Langevelde HJ, van Dishoeck EF. 1995a. ApJ 441:L93
- Hogerheijde et al. (1995b) Hogerheijde MR, Jansen DJ, van Dishoeck EF. 1995b. A&A 294:792–810
- Hollenbach & Gorti (2009) Hollenbach D, Gorti U. 2009. ApJ 703:1203–1223
- Hollenbach et al. (2009) Hollenbach D, Kaufman MJ, Bergin EA, Melnick GJ. 2009. ApJ 690:1497–1521
- Hollenbach et al. (2012) Hollenbach D, Kaufman MJ, Neufeld D, Wolfire M, Goicoechea JR. 2012. ApJ 754:105
- Hollenbach & McKee (1979) Hollenbach D, McKee CF. 1979. ApJS 41:555–592
- Hollenbach & McKee (1989) Hollenbach D, McKee CF. 1989. ApJ 342:306
- Hollenbach & Natta (1995) Hollenbach D, Natta A. 1995. ApJ 455:133
- Hollenbach & Salpeter (1971) Hollenbach D, Salpeter EE. 1971. ApJ 163:155
- Hollenbach et al. (1991) Hollenbach DJ, Takahashi T, Tielens AGGM. 1991. ApJ 377:192
- Hollenbach & Tielens (1997) Hollenbach DJ, Tielens AGGM. 1997. ARA&A 35:179–216
- Hollenbach & Tielens (1999) Hollenbach DJ, Tielens AGGM. 1999. Reviews of Modern Physics 71:173–230
- Hornekær et al. (2006) Hornekær L, Rauls E, Xu W, Šljivančanin Ž, Otero R, et al. 2006. Phys. Rev. Lett. 97:186102
- Hosokawa & Inutsuka (2006) Hosokawa T, Inutsuka Si. 2006. ApJ 646:240–257
- Hu et al. (2021) Hu CY, Sternberg A, van Dishoeck EF. 2021. ApJ 920:44
- Hunt et al. (2010) Hunt LK, Thuan TX, Izotov YI, Sauvage M. 2010. ApJ 712:164–187
- Hunter et al. (2012) Hunter DA, Ficut-Vicas D, Ashley T, Brinks E, Cigan P, et al. 2012. AJ 144:134
- Igea & Glassgold (1999) Igea J, Glassgold AE. 1999. ApJ 518:848–858
- Ikeda et al. (1999) Ikeda M, Maezawa H, Ito T, Saito G, Sekimoto Y, et al. 1999. ApJ 527:L59–L62
- Imanishi et al. (2019) Imanishi M, Nakanishi K, Izumi T. 2019. ApJS 241:19
- Indebetouw et al. (2013) Indebetouw R, Brogan C, Chen CHR, Leroy A, Johnson K, et al. 2013. ApJ 774:73
- Indriolo et al. (2017) Indriolo N, Bergin EA, Goicoechea JR, Cernicharo J, Gerin M, et al. 2017. ApJ 836:117
- Indriolo et al. (2007) Indriolo N, Geballe TR, Oka T, McCall BJ. 2007. ApJ 671:1736–1747
- Indriolo et al. (2015) Indriolo N, Neufeld DA, Gerin M, Schilke P, Benz AO, et al. 2015. ApJ 800:40
- Inoue et al. (2020) Inoue S, Yoshida N, Yajima H. 2020. MNRAS 498:5960–5971
- Inui et al. (2009) Inui T, Koyama K, Matsumoto H, Tsuru TG. 2009. PASJ 61:S241
- Israel (2020) Israel FP. 2020. A&A 635:A131
- Izumi et al. (2016) Izumi T, Kohno K, Aalto S, Espada D, Fathi K, et al. 2016. ApJ 818:42
- Izumi et al. (2020) Izumi T, Nguyen DD, Imanishi M, Kawamuro T, Baba S, et al. 2020. ApJ 898:75
- Jacob et al. (2020) Jacob AM, Menten KM, Wyrowski F, Winkel B, Neufeld DA. 2020. A&A 643:A91
- Jacob et al. (2022) Jacob AM, Neufeld DA, Schilke P, Wiesemeyer H, Kim W, et al. 2022. arXiv e-prints :arXiv:2202.05046
- Jameson et al. (2018) Jameson KE, Bolatto AD, Wolfire M, Warren SR, Herrera-Camus R, et al. 2018. ApJ 853:111
- Jenkins & Tripp (2011) Jenkins EB, Tripp TM. 2011. ApJ 734:65
- Joblin et al. (2018) Joblin C, Bron E, Pinto C, Pilleri P, Le Petit F, et al. 2018. A&A 615:A129
- Johnstone et al. (1998) Johnstone D, Hollenbach D, Bally J. 1998. ApJ 499:758–776
- Jura (1974) Jura M. 1974. ApJ 191:375–379
- Kalberla & Haud (2018) Kalberla PMW, Haud U. 2018. A&A 619:A58
- Kalberla et al. (2020) Kalberla PMW, Kerp J, Haud U. 2020. A&A 639:A26
- Kamenetzky et al. (2012) Kamenetzky J, Glenn J, Rangwala N, Maloney P, Bradford M, et al. 2012. ApJ 753:70
- Kamp et al. (2010) Kamp I, Tilling I, Woitke P, Thi WF, Hogerheijde M. 2010. A&A 510:A18
- Katz et al. (2019) Katz H, Galligan TP, Kimm T, Rosdahl J, Haehnelt MG, et al. 2019. MNRAS 487:5902–5921
- Katz et al. (2017) Katz H, Kimm T, Sijacki D, Haehnelt MG. 2017. MNRAS 468:4831–4861
- Kaufman et al. (2006) Kaufman MJ, Wolfire MG, Hollenbach DJ. 2006. ApJ 644:283–299
- Kaufman et al. (1999) Kaufman MJ, Wolfire MG, Hollenbach DJ, Luhman ML. 1999. ApJ 527:795–813
- Kawamuro et al. (2020) Kawamuro T, Izumi T, Onishi K, Imanishi M, Nguyen DD, Baba S. 2020. ApJ 895:135
- Kazandjian et al. (2015) Kazandjian MV, Meijerink R, Pelupessy I, Israel FP, Spaans M. 2015. A&A 574:A127
- Keene et al. (1985) Keene J, Blake GA, Phillips TG, Huggins PJ, Beichman CA. 1985. ApJ 299:967–980
- Kennicutt et al. (2003) Kennicutt Robert C. J, Armus L, Bendo G, Calzetti D, Dale DA, et al. 2003. PASP 115:928–952
- Kennicutt et al. (2011) Kennicutt RC, Calzetti D, Aniano G, Appleton P, Armus L, et al. 2011. PASP 123:1347
- Kim & Ostriker (2017) Kim CG, Ostriker EC. 2017. ApJ 846:133
- Kim et al. (2018) Kim JG, Kim WT, Ostriker EC. 2018. ApJ 859:68
- Kirsanova et al. (2020) Kirsanova MS, Ossenkopf-Okada V, Anderson LD, Boley PA, Bieging JH, et al. 2020. MNRAS 497:2651–2669
- Kirsanova & Wiebe (2019) Kirsanova MS, Wiebe DS. 2019. MNRAS 486:2525–2534
- Kohandel et al. (2020) Kohandel M, Pallottini A, Ferrara A, Carniani S, Gallerani S, et al. 2020. MNRAS 499:1250–1265
- Kraemer et al. (1998) Kraemer KE, Jackson JM, Lane AP. 1998. ApJ 503:785–791
- Kramer et al. (2010) Kramer C, Buchbender C, Xilouris EM, Boquien M, Braine J, et al. 2010. A&A 518:L67
- Kramer et al. (2005) Kramer C, Mookerjea B, Bayet E, Garcia-Burillo S, Gerin M, et al. 2005. A&A 441:961–973
- Kramer et al. (2020) Kramer C, Nikola T, Anderl S, Bertoldi F, Boquien M, et al. 2020. A&A 639:A61
- Krieger et al. (2020) Krieger N, Bolatto AD, Leroy AK, Levy RC, Mills EAC, et al. 2020. ApJ 897:176
- Krieger et al. (2017) Krieger N, Ott J, Beuther H, Walter F, Kruijssen JMD, et al. 2017. ApJ 850:77
- Krips et al. (2008) Krips M, Neri R, García-Burillo S, Martín S, Combes F, et al. 2008. ApJ 677:262–275
- Krolik & Kallman (1983) Krolik JH, Kallman TR. 1983. ApJ 267:610–624
- Krolik & Lepp (1989) Krolik JH, Lepp S. 1989. ApJ 347:179
- Kruijssen et al. (2019) Kruijssen JMD, Dale JE, Longmore SN, Walker DL, Henshaw JD, et al. 2019. MNRAS 484:5734–5754
- Kruijssen et al. (2014) Kruijssen JMD, Longmore SN, Elmegreen BG, Murray N, Bally J, et al. 2014. MNRAS 440:3370–3391
- Krumholz & Kruijssen (2015) Krumholz MR, Kruijssen JMD. 2015. MNRAS 453:739–757
- Krumholz & Matzner (2009) Krumholz MR, Matzner CD. 2009. ApJ 703:1352–1362
- Krumholz et al. (2019) Krumholz MR, McKee CF, Bland-Hawthorn J. 2019. ARA&A 57:227–303
- Lada & Blitz (1988) Lada EA, Blitz L. 1988. ApJ 326:L69
- Lagache et al. (2018) Lagache G, Cousin M, Chatzikos M. 2018. A&A 609:A130
- Lancaster et al. (2021a) Lancaster L, Ostriker EC, Kim JG, Kim CG. 2021a. ApJ 914:89
- Lancaster et al. (2021b) Lancaster L, Ostriker EC, Kim JG, Kim CG. 2021b. ApJ 914:90
- Langer et al. (2016) Langer WD, Goldsmith PF, Pineda JL. 2016. A&A 590:A43
- Langer & Pineda (2015) Langer WD, Pineda JL. 2015. A&A 580:A5
- Langer et al. (2017) Langer WD, Velusamy T, Morris MR, Goldsmith PF, Pineda JL. 2017. A&A 599:A136
- Langer et al. (2014) Langer WD, Velusamy T, Pineda JL, Willacy K, Goldsmith PF. 2014. A&A 561:A122
- Latter et al. (2000) Latter WB, Dayal A, Bieging JH, Meakin C, Hora JL, et al. 2000. ApJ 539:783–797
- Le Bourlot et al. (2012) Le Bourlot J, Le Petit F, Pinto C, Roueff E, Roy F. 2012. A&A 541:A76
- Le Bourlot et al. (1999) Le Bourlot J, Pineau des Forêts G, Flower DR. 1999. MNRAS 305:802–810
- Le Fèvre et al. (2020) Le Fèvre O, Béthermin M, Faisst A, Jones GC, Capak P, et al. 2020. A&A 643:A1
- Le Gal et al. (2019) Le Gal R, Brady MT, Öberg KI, Roueff E, Le Petit F. 2019. ApJ 886:86
- Le Petit et al. (2006) Le Petit F, Nehmé C, Le Bourlot J, Roueff E. 2006. ApJS 164:506–529
- Le Petit et al. (2002) Le Petit F, Roueff E, Le Bourlot J. 2002. A&A 390:369–381
- Le Petit et al. (2016) Le Petit F, Ruaud M, Bron E, Godard B, Roueff E, et al. 2016. A&A 585:A105
- Lebouteiller et al. (2019) Lebouteiller V, Cormier D, Madden SC, Galametz M, Hony S, et al. 2019. A&A 632:A106
- Lebouteiller et al. (2017) Lebouteiller V, Péquignot D, Cormier D, Madden S, Pakull MW, et al. 2017. A&A 602:A45
- Ledger et al. (2021) Ledger B, Wilson CD, Michiyama T, Iono D, Aalto S, et al. 2021. MNRAS 504:5863–5879
- Lee et al. (2021) Lee MM, Nagao T, De Breuck C, Carniani S, Cresci G, et al. 2021. ApJ 913:41
- Lee et al. (2019) Lee MY, Madden SC, Le Petit F, Gusdorf A, Lesaffre P, et al. 2019. A&A 628:A113
- Lee et al. (2016) Lee MY, Madden SC, Lebouteiller V, Gusdorf A, Godard B, et al. 2016. A&A 596:A85
- Lee et al. (2014) Lee S, Lee JE, Bergin EA, Park YS. 2014. ApJS 213:33
- Lehnert et al. (2020) Lehnert MD, Yang C, Emonts BHC, Omont A, Falgarone E, et al. 2020. A&A 641:A124
- Lepp & Dalgarno (1996) Lepp S, Dalgarno A. 1996. A&A 306:L21–L24
- Lepp et al. (1988) Lepp S, Dalgarno A, van Dishoeck EF, Black JH. 1988. ApJ 329:418
- Lepp & Shull (1983) Lepp S, Shull JM. 1983. ApJ 270:578–582
- Leroy et al. (2009) Leroy AK, Bolatto A, Bot C, Engelbracht CW, Gordon K, et al. 2009. ApJ 702:352–367
- Leroy et al. (2021) Leroy AK, Schinnerer E, Hughes A, Rosolowsky E, Pety J, et al. 2021. ApJS 257:43
- Lesaffre et al. (2007) Lesaffre P, Gerin M, Hennebelle P. 2007. A&A 469:949–961
- Leung et al. (2020) Leung TKD, Pallottini A, Ferrara A, Mac Low MM. 2020. ApJ 895:24
- Leurini et al. (2015) Leurini S, Wyrowski F, Wiesemeyer H, Gusdorf A, Güsten R, et al. 2015. A&A 584:A70
- Levrier et al. (2012) Levrier F, Le Petit F, Hennebelle P, Lesaffre P, Gerin M, Falgarone E. 2012. A&A 544:A22
- Li et al. (2020a) Li J, Wang R, Cox P, Gao Y, Walter F, et al. 2020a. ApJ 900:131
- Li et al. (2020b) Li J, Wang R, Riechers D, Walter F, Decarli R, et al. 2020b. ApJ 889:162
- Li et al. (2013) Li X, Heays AN, Visser R, Ubachs W, Lewis BR, et al. 2013. A&A 555:A14
- Lique (2015) Lique F. 2015. MNRAS 453:810–818
- Lique et al. (2018) Lique F, Kłos J, Alexander MH, Le Picard SD, Dagdigian PJ. 2018. MNRAS 474:2313–2322
- Lis & Schilke (2003) Lis DC, Schilke P. 2003. ApJ 597:L145–L148
- Liseau et al. (2006) Liseau R, Justtanont K, Tielens AGGM. 2006. A&A 446:561–567
- Liszt & Lucas (1996) Liszt H, Lucas R. 1996. A&A 314:917–926
- Liszt (2011) Liszt HS. 2011. A&A 527:A45
- Liu et al. (2020) Liu C, Chen X, Du F. 2020. ApJ 899:92
- Liu et al. (2017) Liu L, Weiß A, Perez-Beaupuits JP, Güsten R, Liu D, et al. 2017. ApJ 846:5
- Loenen et al. (2008) Loenen AF, Spaans M, Baan WA, Meijerink R. 2008. A&A 488:L5–L8
- Loenen et al. (2010) Loenen AF, van der Werf PP, Güsten R, Meijerink R, Israel FP, et al. 2010. A&A 521:L2
- Loiacono et al. (2021) Loiacono F, Decarli R, Gruppioni C, Talia M, Cimatti A, et al. 2021. A&A 646:A76
- Lopez et al. (2014) Lopez LA, Krumholz MR, Bolatto AD, Prochaska JX, Ramirez-Ruiz E, Castro D. 2014. ApJ 795:121
- Lucas & Liszt (1996) Lucas R, Liszt H. 1996. A&A 307:237
- Luhman et al. (1998) Luhman ML, Satyapal S, Fischer J, Wolfire MG, Cox P, et al. 1998. ApJ 504:L11–L15
- Luisi et al. (2021) Luisi M, Anderson LD, Schneider N, Simon R, Kabanovic S, et al. 2021. Science Advances 7:eabe9511
- Lupi et al. (2020) Lupi A, Pallottini A, Ferrara A, Bovino S, Carniani S, Vallini L. 2020. MNRAS 496:5160–5175
- Mackey et al. (2019) Mackey J, Walch S, Seifried D, Glover SCO, Wünsch R, Aharonian F. 2019. MNRAS 486:1094–1122
- Madden et al. (2020) Madden SC, Cormier D, Hony S, Lebouteiller V, Abel N, et al. 2020. A&A 643:A141
- Madden et al. (2013) Madden SC, Rémy-Ruyer A, Galametz M, Cormier D, Lebouteiller V, et al. 2013. PASP 125:600
- Maiolino et al. (2009) Maiolino R, Caselli P, Nagao T, Walmsley M, De Breuck C, Meneghetti M. 2009. A&A 500:L1–L4
- Malhotra et al. (1997) Malhotra S, Helou G, Stacey G, Hollenbach D, Lord S, et al. 1997. ApJ 491:L27–L30
- Malhotra et al. (2001) Malhotra S, Kaufman MJ, Hollenbach D, Helou G, Rubin RH, et al. 2001. ApJ 561:766–786
- Maloney & Black (1988) Maloney P, Black JH. 1988. ApJ 325:389
- Maloney et al. (1996) Maloney PR, Hollenbach DJ, Tielens AGGM. 1996. ApJ 466:561
- Marconi et al. (1998) Marconi A, Testi L, Natta A, Walmsley CM. 1998. A&A 330:696–710
- Martín et al. (2015) Martín S, Kohno K, Izumi T, Krips M, Meier DS, et al. 2015. A&A 573:A116
- Mathis et al. (1983) Mathis JS, Mezger PG, Panagia N. 1983. A&A 500:259–276
- McCall et al. (2004) McCall BJ, Huneycutt AJ, Saykally RJ, Djuric N, Dunn GH, et al. 2004. Phys Rev A 70:052716
- McElroy et al. (2013) McElroy D, Walsh C, Markwick AJ, Cordiner MA, Smith K, Millar TJ. 2013. A&A 550:A36
- McKee (1989) McKee CF. 1989. ApJ 345:782
- Meijerink et al. (2012) Meijerink R, Cazaux S, Spaans M. 2012. A&A 537:A102
- Meijerink et al. (2013) Meijerink R, Kristensen LE, Weiß A, van der Werf PP, Walter F, et al. 2013. ApJ 762:L16
- Meijerink & Spaans (2005) Meijerink R, Spaans M. 2005. A&A 436:397–409
- Meijerink et al. (2006) Meijerink R, Spaans M, Israel FP. 2006. ApJ 650:L103–L106
- Meijerink et al. (2007) Meijerink R, Spaans M, Israel FP. 2007. A&A 461:793–811
- Meijerink et al. (2011) Meijerink R, Spaans M, Loenen AF, van der Werf PP. 2011. A&A 525:A119
- Meixner et al. (1992) Meixner M, Haas MR, Tielens AGGM, Erickson EF, Werner M. 1992. ApJ 390:499
- Melnick et al. (2021) Melnick J, Tenorio-Tagle G, Telles E. 2021. A&A 649:A175
- Mennella et al. (2012) Mennella V, Hornekær L, Thrower J, Accolla M. 2012. ApJ 745:L2
- Mills (2017) Mills EAC. 2017. arXiv e-prints :arXiv:1705.05332
- Mingozzi et al. (2018) Mingozzi M, Vallini L, Pozzi F, Vignali C, Mignano A, et al. 2018. MNRAS 474:3640–3648
- Mookerjea et al. (2016) Mookerjea B, Israel F, Kramer C, Nikola T, Braine J, et al. 2016. A&A 586:A37
- Mookerjea et al. (2019) Mookerjea B, Sandell G, Güsten R, Riquelme D, Wiesemeyer H, Chambers E. 2019. A&A 626:A131
- Mookerjea et al. (2021) Mookerjea B, Sandell G, Veena VS, Güsten R, Riquelme D, et al. 2021. A&A 648:A40
- Morrison & McCammon (1983) Morrison R, McCammon D. 1983. ApJ 270:119–122
- Moseley et al. (2021) Moseley ER, Draine BT, Tomida K, Stone JM. 2021. MNRAS 500:3290–3308
- Moser et al. (2017) Moser L, Sánchez-Monge Á, Eckart A, Requena-Torres MA, García-Marin M, et al. 2017. A&A 603:A68
- Murray et al. (2018a) Murray CE, Peek JEG, Lee MY, Stanimirović S. 2018a. ApJ 862:131
- Murray et al. (2018b) Murray CE, Stanimirović S, Goss WM, Heiles C, Dickey JM, et al. 2018b. ApJS 238:14
- Myers et al. (2015) Myers AT, McKee CF, Li PS. 2015. MNRAS 453:2747–2758
- Nagai et al. (2007) Nagai M, Tanaka K, Kamegai K, Oka T. 2007. PASJ 59:25–31
- Nagy et al. (2017) Nagy Z, Choi Y, Ossenkopf-Okada V, van der Tak FFS, Bergin EA, et al. 2017. A&A 599:A22
- Nagy et al. (2012) Nagy Z, van der Tak FFS, Fuller GA, Spaans M, Plume R. 2012. A&A 542:A6
- Nagy et al. (2013) Nagy Z, Van der Tak FFS, Ossenkopf V, Gerin M, Le Petit F, et al. 2013. A&A 550:A96
- Narayanan et al. (2012) Narayanan D, Krumholz MR, Ostriker EC, Hernquist L. 2012. MNRAS 421:3127–3146
- Natta & Hollenbach (1998) Natta A, Hollenbach D. 1998. A&A 337:517–538
- Nesvadba et al. (2019) Nesvadba NPH, Cañameras R, Kneissl R, Koenig S, Yang C, et al. 2019. A&A 624:A23
- Neufeld et al. (2015) Neufeld DA, Godard B, Gerin M, Pineau des Forêts G, Bernier C, et al. 2015. A&A 577:A49
- Neufeld & Kaufman (1993) Neufeld DA, Kaufman MJ. 1993. ApJ 418:263
- Neufeld & Wolfire (2016) Neufeld DA, Wolfire MG. 2016. ApJ 826:183
- Neufeld & Wolfire (2017) Neufeld DA, Wolfire MG. 2017. ApJ 845:163
- Nordon & Sternberg (2016) Nordon R, Sternberg A. 2016. MNRAS 462:2804–2818
- Notsu et al. (2021) Notsu S, van Dishoeck EF, Walsh C, Bosman AD, Nomura H. 2021. A&A 650:A180
- Öberg & Bergin (2021) Öberg KI, Bergin EA. 2021. Phys. Rep. 893:1–48
- Öberg et al. (2009) Öberg KI, van Dishoeck EF, Linnartz H. 2009. A&A 496:281–293
- Oberst et al. (2011) Oberst TE, Parshley SC, Nikola T, Stacey GJ, Löhr A, et al. 2011. ApJ 739:100
- Offner et al. (2014) Offner SSR, Bisbas TG, Bell TA, Viti S. 2014. MNRAS 440:L81–L85
- Oka et al. (2019) Oka T, Geballe TR, Goto M, Usuda T, Benjamin, et al. 2019. ApJ 883:54
- Oka et al. (2005) Oka T, Geballe TR, Goto M, Usuda T, McCall BJ. 2005. ApJ 632:882–893
- Okada et al. (2019) Okada Y, Güsten R, Requena-Torres MA, Röllig M, Stutzki J, et al. 2019. A&A 621:A62
- Okada et al. (2015) Okada Y, Requena-Torres MA, Güsten R, Stutzki J, Wiesemeyer H, et al. 2015. A&A 580:A54
- Olsen et al. (2017) Olsen K, Greve TR, Narayanan D, Thompson R, Davé R, et al. 2017. ApJ 846:105
- Olsen et al. (2015) Olsen KP, Greve TR, Narayanan D, Thompson R, Toft S, Brinch C. 2015. ApJ 814:76
- Ossenkopf et al. (2015) Ossenkopf V, Koumpia E, Okada Y, Mookerjea B, van der Tak FFS, et al. 2015. A&A 580:A83
- Ossenkopf et al. (2010) Ossenkopf V, Röllig M, Simon R, Schneider N, Okada Y, et al. 2010. A&A 518:L79
- Ostriker et al. (2010) Ostriker EC, McKee CF, Leroy AK. 2010. ApJ 721:975–994
- Owen et al. (2011) Owen JE, Ercolano B, Clarke CJ. 2011. MNRAS 412:13–25
- Pabst et al. (2019) Pabst C, Higgins R, Goicoechea JR, Teyssier D, Berne O, et al. 2019. Nature 565:618–621
- Pabst et al. (2022) Pabst CHM, Goicoechea JR, Hacar A, Teyssier D, Berné O, et al. 2022. arXiv e-prints :arXiv:2111.12363
- Pabst et al. (2020) Pabst CHM, Goicoechea JR, Teyssier D, Berné O, Higgins RD, et al. 2020. A&A 639:A2
- Pabst et al. (2017) Pabst CHM, Goicoechea JR, Teyssier D, Berné O, Ochsendorf BB, et al. 2017. A&A 606:A29
- Pabst et al. (2021) Pabst CHM, Hacar A, Goicoechea JR, Teyssier D, Berné O, et al. 2021. A&A 651:A111
- Padovani et al. (2009) Padovani M, Galli D, Glassgold AE. 2009. A&A 501:619–631
- Padovani et al. (2018) Padovani M, Galli D, Ivlev AV, Caselli P, Ferrara A. 2018. A&A 619:A144
- Pak et al. (1998) Pak S, Jaffe DT, van Dishoeck EF, Johansson LEB, Booth RS. 1998. ApJ 498:735–756
- Pallottini et al. (2019) Pallottini A, Ferrara A, Decataldo D, Gallerani S, Vallini L, et al. 2019. MNRAS 487:1689–1708
- Pallottini et al. (2017) Pallottini A, Ferrara A, Gallerani S, Vallini L, Maiolino R, Salvadori S. 2017. MNRAS 465:2540–2558
- Papadopoulos et al. (2002) Papadopoulos PP, Thi WF, Viti S. 2002. ApJ 579:270–274
- Papadopoulos et al. (2004) Papadopoulos PP, Thi WF, Viti S. 2004. MNRAS 351:147–160
- Paradis et al. (2012) Paradis D, Dobashi K, Shimoikura T, Kawamura A, Onishi T, et al. 2012. A&A 543:A103
- Parikka et al. (2018) Parikka A, Habart E, Bernard-Salas J, Köhler M, Abergel A. 2018. A&A 617:A77
- Parkin et al. (2013) Parkin TJ, Wilson CD, Schirm MRP, Baes M, Boquien M, et al. 2013. ApJ 776:65
- Parravano et al. (2003) Parravano A, Hollenbach DJ, McKee CF. 2003. ApJ 584:797–817
- Pavesi et al. (2019) Pavesi R, Riechers DA, Faisst AL, Stacey GJ, Capak PL. 2019. ApJ 882:168
- Peeters et al. (2017) Peeters E, Bauschlicher Charles W. J, Allamandola LJ, Tielens AGGM, Ricca A, Wolfire MG. 2017. ApJ 836:198
- Peeters et al. (2002) Peeters E, Hony S, Van Kerckhoven C, Tielens AGGM, Allamandola LJ, et al. 2002. A&A 390:1089–1113
- Pellegrini et al. (2011) Pellegrini EW, Baldwin JA, Ferland GJ. 2011. ApJ 738:34
- Pellegrini et al. (2020) Pellegrini EW, Rahner D, Reissl S, Glover SCO, Klessen RS, et al. 2020. MNRAS 496:339–363
- Pellegrini et al. (2013) Pellegrini EW, Smith JD, Wolfire MG, Draine BT, Crocker AF, et al. 2013. ApJ 779:L19
- Pensabene et al. (2021) Pensabene A, Decarli R, Bañados E, Venemans B, Walter F, et al. 2021. A&A 652:A66
- Pérez-Beaupuits et al. (2018) Pérez-Beaupuits JP, Güsten R, Harris A, Requena-Torres MA, Menten KM, et al. 2018. ApJ 860:23
- Pérez-Beaupuits et al. (2015) Pérez-Beaupuits JP, Güsten R, Spaans M, Ossenkopf V, Menten KM, et al. 2015. A&A 583:A107
- Persson et al. (2014) Persson CM, Hajigholi M, Hassel GE, Olofsson AOH, Black JH, et al. 2014. A&A 567:A130
- Pety et al. (2005) Pety J, Teyssier D, Fossé D, Gerin M, Roueff E, et al. 2005. A&A 435:885–899
- Pineau des Forets et al. (1986) Pineau des Forets G, Flower DR, Hartquist TW, Dalgarno A. 1986. MNRAS 220:801–824
- Pineda et al. (2018) Pineda JL, Fischer C, Kapala M, Stutzki J, Buchbender C, et al. 2018. ApJ 869:L30
- Pineda et al. (2014) Pineda JL, Langer WD, Goldsmith PF. 2014. A&A 570:A121
- Pineda et al. (2013) Pineda JL, Langer WD, Velusamy T, Goldsmith PF. 2013. A&A 554:A103
- Pineda et al. (2020) Pineda JL, Stutzki J, Buchbender C, Koda J, Fischer C, et al. 2020. ApJ 900:132
- Pizzati et al. (2020) Pizzati E, Ferrara A, Pallottini A, Gallerani S, Vallini L, et al. 2020. MNRAS 495:160–172
- Planck Collaboration et al. (2011) Planck Collaboration, Ade PAR, Aghanim N, Arnaud M, Ashdown M, et al. 2011. A&A 536:A19
- Plume et al. (2000) Plume R, Bensch F, Howe JE, Ashby MLN, Bergin EA, et al. 2000. ApJ 539:L133–L136
- Plume et al. (1994) Plume R, Jaffe DT, Keene J. 1994. ApJ 425:L49
- Pon et al. (2016) Pon A, Kaufman MJ, Johnstone D, Caselli P, Fontani F, et al. 2016. ApJ 827:107
- Ponti et al. (2010) Ponti G, Terrier R, Goldwurm A, Belanger G, Trap G. 2010. ApJ 714:732–747
- Popping et al. (2017) Popping G, Decarli R, Man AWS, Nelson EJ, Béthermin M, et al. 2017. A&A 602:A11
- Popping et al. (2019) Popping G, Narayanan D, Somerville RS, Faisst AL, Krumholz MR. 2019. MNRAS 482:4906–4932
- Pozzi et al. (2017) Pozzi F, Vallini L, Vignali C, Talia M, Gruppioni C, et al. 2017. MNRAS 470:L64–L68
- Prasad & Tarafdar (1983) Prasad SS, Tarafdar SP. 1983. ApJ 267:603–609
- Priestley et al. (2017) Priestley FD, Barlow MJ, Viti S. 2017. MNRAS 472:4444–4455
- Privon et al. (2015) Privon GC, Herrero-Illana R, Evans AS, Iwasawa K, Perez-Torres MA, et al. 2015. ApJ 814:39
- Privon et al. (2020) Privon GC, Ricci C, Aalto S, Viti S, Armus L, et al. 2020. ApJ 893:149
- Puget & Leger (1989) Puget JL, Leger A. 1989. ARA&A 27:161–198
- Rab et al. (2018) Rab C, Güdel M, Woitke P, Kamp I, Thi WF, et al. 2018. A&A 609:A91
- Rangwala et al. (2014) Rangwala N, Maloney PR, Glenn J, Wilson CD, Kamenetzky J, et al. 2014. ApJ 788:147
- Rangwala et al. (2011) Rangwala N, Maloney PR, Glenn J, Wilson CD, Rykala A, et al. 2011. ApJ 743:94
- Reissl et al. (2018) Reissl S, Klessen RS, Mac Low MM, Pellegrini EW. 2018. A&A 611:A70
- Rémy-Ruyer et al. (2014) Rémy-Ruyer A, Madden SC, Galliano F, Galametz M, Takeuchi TT, et al. 2014. A&A 563:A31
- Requena-Torres et al. (2012) Requena-Torres MA, Güsten R, Weiß A, Harris AI, Martín-Pintado J, et al. 2012. A&A 542:L21
- Rico-Villas et al. (2021) Rico-Villas F, Martín-Pintado J, González-Alfonso E, Rivilla VM, Martín S, et al. 2021. MNRAS 502:3021–3034
- Riechers et al. (2021) Riechers DA, Nayyeri H, Burgarella D, Emonts BHC, Clements DL, et al. 2021. ApJ 907:62
- Rodríguez-Fernández et al. (2004) Rodríguez-Fernández NJ, Martín-Pintado J, Fuente A, Wilson TL. 2004. A&A 427:217–229
- Röllig et al. (2007) Röllig M, Abel NP, Bell T, Bensch F, Black J, et al. 2007. A&A 467:187–206
- Röllig & Ossenkopf (2013) Röllig M, Ossenkopf V. 2013. A&A 550:A56
- Röllig et al. (2006) Röllig M, Ossenkopf V, Jeyakumar S, Stutzki J, Sternberg A. 2006. A&A 451:917–924
- Röllig et al. (2013) Röllig M, Szczerba R, Ossenkopf V, Glück C. 2013. A&A 549:A85
- Rollins & Rawlings (2012) Rollins RP, Rawlings JMC. 2012. MNRAS 427:2328–2335
- Rosen et al. (2014) Rosen AL, Lopez LA, Krumholz MR, Ramirez-Ruiz E. 2014. MNRAS 442:2701–2716
- Rosenberg et al. (2014a) Rosenberg MJF, Kazandjian MV, van der Werf PP, Israel FP, Meijerink R, et al. 2014a. A&A 564:A126
- Rosenberg et al. (2014b) Rosenberg MJF, Meijerink R, Israel FP, van der Werf PP, Xilouris EM, Weiß A. 2014b. A&A 568:A90
- Roueff et al. (2019) Roueff E, Abgrall H, Czachorowski P, Pachucki K, Puchalski M, Komasa J. 2019. A&A 630:A58
- Roueff et al. (2015) Roueff E, Loison JC, Hickson KM. 2015. A&A 576:A99
- Rubin (1985) Rubin RH. 1985. ApJS 57:349
- Rybak et al. (2020a) Rybak M, Hodge JA, Vegetti S, van der Werf P, Andreani P, et al. 2020a. MNRAS 494:5542–5567
- Rybak et al. (2020b) Rybak M, Zavala JA, Hodge JA, Casey CM, Werf Pvd. 2020b. ApJ 889:L11
- Salas et al. (2019) Salas P, Oonk JBR, Emig KL, Pabst C, Toribio MC, et al. 2019. A&A 626:A70
- Salgado et al. (2016) Salgado F, Berné O, Adams JD, Herter TL, Keller LD, Tielens AGGM. 2016. ApJ 830:118
- Sandstrom et al. (2010) Sandstrom KM, Bolatto AD, Draine BT, Bot C, Stanimirović S. 2010. ApJ 715:701–723
- Schilke et al. (2014) Schilke P, Neufeld DA, Müller HSP, Comito C, Bergin EA, et al. 2014. A&A 566:A29
- Schirm et al. (2017) Schirm MRP, Wilson CD, Kamenetzky J, Parkin TJ, Glenn J, et al. 2017. MNRAS 470:4989–5006
- Schneider et al. (2021) Schneider N, Röllig M, Polehampton ET, Comerón F, Djupvik AA, et al. 2021. A&A 653:A108
- Schneider et al. (2018) Schneider N, Röllig M, Simon R, Wiesemeyer H, Gusdorf A, et al. 2018. A&A 617:A45
- Schneider et al. (2020) Schneider N, Simon R, Guevara C, Buchbender C, Higgins RD, et al. 2020. PASP 132:104301
- Schruba et al. (2017) Schruba A, Leroy AK, Kruijssen JMD, Bigiel F, Bolatto AD, et al. 2017. ApJ 835:278
- Schulz et al. (2007) Schulz A, Henkel C, Muders D, Mao RQ, Röllig M, Mauersberger R. 2007. A&A 466:467–479
- Seifried et al. (2020) Seifried D, Haid S, Walch S, Borchert EMA, Bisbas TG. 2020. MNRAS 492:1465–1483
- Seifried et al. (2011) Seifried D, Schmidt W, Niemeyer JC. 2011. A&A 526:A14
- Seifried et al. (2017) Seifried D, Walch S, Girichidis P, Naab T, Wünsch R, et al. 2017. MNRAS 472:4797–4818
- Seo et al. (2019) Seo YM, Goldsmith PF, Walker CK, Hollenbach DJ, Wolfire MG, et al. 2019. ApJ 878:120
- Sha & Jackson (2002) Sha X, Jackson B. 2002. Surface Science 496:318–330
- Shaw & Ferland (2021) Shaw G, Ferland GJ. 2021. ApJ 908:138
- Shaw et al. (2005) Shaw G, Ferland GJ, Abel NP, Stancil PC, van Hoof PAM. 2005. ApJ 624:794–807
- Sheffer et al. (2008) Sheffer Y, Rogers M, Federman SR, Abel NP, Gredel R, et al. 2008. ApJ 687:1075–1106
- Sheffer et al. (2011) Sheffer Y, Wolfire MG, Hollenbach DJ, Kaufman MJ, Cordier M. 2011. ApJ 741:45
- Shetty et al. (2011) Shetty R, Glover SC, Dullemond CP, Klessen RS. 2011. MNRAS 412:1686–1700
- Shibai et al. (1991) Shibai H, Okuda H, Nakagawa T, Matsuhara H, Maihara T, et al. 1991. ApJ 374:522
- Shull et al. (2021) Shull JM, Danforth CW, Anderson KL. 2021. ApJ 911:55
- Shull & van Steenberg (1985) Shull JM, van Steenberg ME. 1985. ApJ 298:268–274
- Silsbee & Ivlev (2019) Silsbee K, Ivlev AV. 2019. ApJ 879:14
- Sizun et al. (2010) Sizun M, Bachellerie D, Aguillon F, Sidis V. 2010. Chemical Physics Letters 498:32–37
- Smith et al. (2017) Smith JDT, Croxall K, Draine B, De Looze I, Sandstrom K, et al. 2017. ApJ 834:5
- Smith et al. (2014) Smith RJ, Glover SCO, Clark PC, Klessen RS, Springel V. 2014. MNRAS 441:1628–1645
- Snow & McCall (2006) Snow TP, McCall BJ. 2006. ARA&A 44:367–414
- Sonnentrucker et al. (2015) Sonnentrucker P, Wolfire M, Neufeld DA, Flagey N, Gerin M, et al. 2015. ApJ 806:49
- Spaans & Meijerink (2008) Spaans M, Meijerink R. 2008. ApJ 678:L5
- Spaans et al. (1994) Spaans M, Tielens AGGM, van Dishoeck EF, Bakes ELO. 1994. ApJ 437:270
- Spilker et al. (2016) Spilker JS, Marrone DP, Aravena M, Béthermin M, Bothwell MS, et al. 2016. ApJ 826:112
- Spitzer (1978) Spitzer L. 1978. Physical processes in the interstellar medium. Wiley-VCH
- Stacey et al. (1991) Stacey GJ, Geis N, Genzel R, Lugten JB, Poglitsch A, et al. 1991. ApJ 373:423
- Stacey et al. (2010) Stacey GJ, Hailey-Dunsheath S, Ferkinhoff C, Nikola T, Parshley SC, et al. 2010. ApJ 724:957–974
- Stacey et al. (1993) Stacey GJ, Jaffe DT, Geis N, Grenzel R, Harris AI, et al. 1993. ApJ 404:219
- Stacey et al. (1985) Stacey GJ, Viscuso PJ, Fuller CE, Kurtz NT. 1985. ApJ 289:803–806
- Stark (2016) Stark DP. 2016. ARA&A 54:761–803
- Stäuber et al. (2005) Stäuber P, Doty SD, van Dishoeck EF, Benz AO. 2005. A&A 440:949–966
- Steiman-Cameron et al. (1997) Steiman-Cameron TY, Haas MR, Tielens AGGM, Burton MG. 1997. ApJ 478:261–270
- Stephens & Dalgarno (1973) Stephens TL, Dalgarno A. 1973. ApJ 186:165–168
- Sternberg (2005) Sternberg A. 2005. PDRs and XDRs: Theory and Observations. In Astrochemistry: Recent Successes and Current Challenges, eds. DC Lis, GA Blake, E Herbst, vol. 231
- Sternberg & Dalgarno (1989) Sternberg A, Dalgarno A. 1989. ApJ 338:197
- Sternberg & Dalgarno (1995) Sternberg A, Dalgarno A. 1995. ApJS 99:565
- Sternberg et al. (2021) Sternberg A, Gurman A, Bialy S. 2021. ApJ 920:83
- Sternberg et al. (2014) Sternberg A, Le Petit F, Roueff E, Le Bourlot J. 2014. ApJ 790:10
- Sternberg & Neufeld (1999) Sternberg A, Neufeld DA. 1999. ApJ 516:371–380
- Stock et al. (2015) Stock DJ, Wolfire MG, Peeters E, Tielens AGGM, Vandenbussche B, et al. 2015. A&A 579:A67
- Stoerzer et al. (1996) Stoerzer H, Stutzki J, Sternberg A. 1996. A&A 310:592–602
- Störzer & Hollenbach (1998) Störzer H, Hollenbach D. 1998. ApJ 495:853–870
- Störzer & Hollenbach (1999) Störzer H, Hollenbach D. 1999. ApJ 515:669–684
- Störzer & Hollenbach (2000) Störzer H, Hollenbach D. 2000. ApJ 539:751–759
- Strandet et al. (2017) Strandet ML, Weiss A, De Breuck C, Marrone DP, Vieira JD, et al. 2017. ApJ 842:L15
- Sutter et al. (2021) Sutter J, Dale DA, Sandstrom K, Smith JDT, Bolatto A, et al. 2021. MNRAS
- Swartz et al. (1971) Swartz WE, Nisbet JS, Green AES. 1971. J. Geophys. Res. 76:8425–8426
- Szűcs et al. (2014) Szűcs L, Glover SCO, Klessen RS. 2014. MNRAS 445:4055–4072
- Tarantino et al. (2021) Tarantino E, Bolatto AD, Herrera-Camus R, Harris AI, Wolfire M, et al. 2021. ApJ 915:92
- Tauber et al. (1994) Tauber JA, Tielens AGGM, Meixner M, Goldsmith PF. 1994. ApJ 422:136
- Tenorio-Tagle (1979) Tenorio-Tagle G. 1979. A&A 71:59–65
- Thrower et al. (2012) Thrower JD, Jørgensen B, Friis EE, Baouche S, Mennella V, et al. 2012. ApJ 752:3
- Tielens (2005) Tielens AGGM. 2005. The Physics and Chemistry of the Interstellar Medium. Cambridge University Press
- Tielens (2008) Tielens AGGM. 2008. ARA&A 46:289–337
- Tielens (2021) Tielens AGGM. 2021. Molecular Astrophysics. Cambridge University Press
- Tielens & Allamandola (1987) Tielens AGGM, Allamandola LJ. 1987. Interstellar Processes, vol. 134 of ASSL. (Dordrecht: Spinger), 397
- Tielens & Hollenbach (1985a) Tielens AGGM, Hollenbach D. 1985a. ApJ 291:722–746
- Tielens & Hollenbach (1985b) Tielens AGGM, Hollenbach D. 1985b. ApJ 291:747–754
- Tielens et al. (1993) Tielens AGGM, Meixner MM, van der Werf PP, Bregman J, Tauber JA, et al. 1993. Science 262:86–89
- Tiné et al. (1997) Tiné S, Lepp S, Gredel R, Dalgarno A. 1997. ApJ 481:282–295
- Tiwari et al. (2021) Tiwari M, Karim R, Pound MW, Wolfire M, Jacob A, et al. 2021. ApJ 914:117
- Tress et al. (2020) Tress RG, Sormani MC, Glover SCO, Klessen RS, Battersby CD, et al. 2020. MNRAS 499:4455–4478
- Uzgil et al. (2021) Uzgil BD, Oesch PA, Walter F, Aravena M, Boogaard L, et al. 2021. ApJ 912:67
- Valdivia et al. (2016) Valdivia V, Hennebelle P, Gérin M, Lesaffre P. 2016. A&A 587:A76
- Valentino et al. (2021) Valentino F, Daddi E, Puglisi A, Magdis GE, Kokorev V, et al. 2021. A&A 654:A165
- Valentino et al. (2020) Valentino F, Magdis GE, Daddi E, Liu D, Aravena M, et al. 2020. ApJ 890:24
- Vallini et al. (2017) Vallini L, Ferrara A, Pallottini A, Gallerani S. 2017. MNRAS 467:1300–1312
- Vallini et al. (2013) Vallini L, Gallerani S, Ferrara A, Baek S. 2013. MNRAS 433:1567–1572
- Vallini et al. (2015) Vallini L, Gallerani S, Ferrara A, Pallottini A, Yue B. 2015. ApJ 813:36
- Vallini et al. (2018) Vallini L, Pallottini A, Ferrara A, Gallerani S, Sobacchi E, Behrens C. 2018. MNRAS 473:271–285
- Vallini et al. (2019) Vallini L, Tielens AGGM, Pallottini A, Gallerani S, Gruppioni C, et al. 2019. MNRAS 490:4502–4514
- van der Tak et al. (2008) van der Tak FFS, Aalto S, Meijerink R. 2008. A&A 477:L5–L8
- van der Tak et al. (2007) van der Tak FFS, Black JH, Schöier FL, Jansen DJ, van Dishoeck EF. 2007. A&A 468:627–635
- van der Tak et al. (2020) van der Tak FFS, Lique F, Faure A, Black JH, van Dishoeck EF. 2020. Atoms 8:15
- van der Tak & van Dishoeck (2000) van der Tak FFS, van Dishoeck EF. 2000. A&A 358:L79–L82
- van der Werf et al. (2010) van der Werf PP, Isaak KG, Meijerink R, Spaans M, Rykala A, et al. 2010. A&A 518:L42
- van der Wiel et al. (2009) van der Wiel MHD, van der Tak FFS, Ossenkopf V, Spaans M, Roberts H, et al. 2009. A&A 498:161–165
- van Dishoeck (1990) van Dishoeck EF. 1990. The chemistry of the diffuse interstellar gas. In The Evolution of the Interstellar Medium, ed. L Blitz, vol. 12 of Astronomical Society of the Pacific Conference Series
- van Dishoeck & Black (1986) van Dishoeck EF, Black JH. 1986. ApJS 62:109
- van Dishoeck & Black (1987) van Dishoeck EF, Black JH. 1987. The abundance of interstellar CO. In Physical Processes in Interstellar Clouds, eds. GE Morfill, M Scholer, vol. 210 of NATO Advanced Study Institute (ASI) Series C
- van Dishoeck & Black (1988) van Dishoeck EF, Black JH. 1988. ApJ 334:771
- van Dishoeck et al. (2013) van Dishoeck EF, Herbst E, Neufeld DA. 2013. Chemical Reviews 113:9043–9085
- van Dishoeck et al. (2021) van Dishoeck EF, Kristensen LE, Mottram JC, Benz AO, Bergin EA, et al. 2021. A&A 648:A24
- van Hoof et al. (2004) van Hoof PAM, Weingartner JC, Martin PG, Volk K, Ferland GJ. 2004. MNRAS 350:1330–1341
- van Kempen et al. (2010) van Kempen TA, Kristensen LE, Herczeg GJ, Visser R, van Dishoeck EF, et al. 2010. A&A 518:L121
- Venemans et al. (2017) Venemans BP, Walter F, Decarli R, Ferkinhoff C, Weiß A, et al. 2017. ApJ 845:154
- Visser et al. (2018) Visser R, Bruderer S, Cazzoletti P, Facchini S, Heays AN, van Dishoeck EF. 2018. A&A 615:A75
- Visser et al. (2012) Visser R, Kristensen LE, Bruderer S, van Dishoeck EF, Herczeg GJ, et al. 2012. A&A 537:A55
- Visser et al. (2009) Visser R, van Dishoeck EF, Black JH. 2009. A&A 503:323–343
- Viti (2017) Viti S. 2017. A&A 607:A118
- Vollmer et al. (2017) Vollmer B, Gratier P, Braine J, Bot C. 2017. A&A 602:A51
- Waggoner & Cleeves (2019) Waggoner AR, Cleeves LI. 2019. ApJ 883:197
- Wakelam et al. (2017) Wakelam V, Bron E, Cazaux S, Dulieu F, Gry C, et al. 2017. Molecular Astrophysics 9:1–36
- Wakelam et al. (2012) Wakelam V, Herbst E, Loison JC, Smith IWM, Chandrasekaran V, et al. 2012. ApJS 199:21
- Walch et al. (2015) Walch S, Girichidis P, Naab T, Gatto A, Glover SCO, et al. 2015. MNRAS 454:238–268
- Walch et al. (2012) Walch SK, Whitworth AP, Bisbas T, Wünsch R, Hubber D. 2012. MNRAS 427:625–636
- Walmsley et al. (2000) Walmsley CM, Natta A, Oliva E, Testi L. 2000. A&A 364:301–317
- Walter et al. (2016) Walter F, Decarli R, Aravena M, Carilli C, Bouwens R, et al. 2016. ApJ 833:67
- Wang et al. (2019) Wang F, Wang R, Fan X, Wu XB, Yang J, et al. 2019. ApJ 880:2
- Weaver et al. (1977) Weaver R, McCray R, Castor J, Shapiro P, Moore R. 1977. ApJ 218:377–395
- Weingartner & Draine (2001a) Weingartner JC, Draine BT. 2001a. ApJ 563:842–852
- Weingartner & Draine (2001b) Weingartner JC, Draine BT. 2001b. ApJ 553:581–594
- Weingartner & Draine (2001c) Weingartner JC, Draine BT. 2001c. ApJS 134:263–281
- Wiesemeyer et al. (2016) Wiesemeyer H, Güsten R, Heyminck S, Hübers HW, Menten KM, et al. 2016. A&A 585:A76
- Wiesenfeld & Goldsmith (2014) Wiesenfeld L, Goldsmith PF. 2014. ApJ 780:183
- Wilms et al. (2000) Wilms J, Allen A, McCray R. 2000. ApJ 542:914–924
- Woitke et al. (2010) Woitke P, Pinte C, Tilling I, Ménard F, Kamp I, et al. 2010. MNRAS 405:L26–L30
- Wolfire & Cassinelli (1986) Wolfire MG, Cassinelli JP. 1986. ApJ 310:207
- Wolfire et al. (2010) Wolfire MG, Hollenbach D, McKee CF. 2010. ApJ 716:1191–1207
- Wolfire et al. (1995a) Wolfire MG, Hollenbach D, McKee CF, Tielens AGGM, Bakes ELO. 1995a. ApJ 443:152
- Wolfire et al. (1993) Wolfire MG, Hollenbach D, Tielens AGGM. 1993. ApJ 402:195
- Wolfire et al. (1995b) Wolfire MG, McKee CF, Hollenbach D, Tielens AGGM. 1995b. ApJ 453:673
- Wolfire et al. (2003) Wolfire MG, McKee CF, Hollenbach D, Tielens AGGM. 2003. ApJ 587:278–311
- Wolfire et al. (1990) Wolfire MG, Tielens AGGM, Hollenbach D. 1990. ApJ 358:116
- Wolfire et al. (2008) Wolfire MG, Tielens AGGM, Hollenbach D, Kaufman MJ. 2008. ApJ 680:384–397
- Wu et al. (2018) Wu R, Bron E, Onaka T, Le Petit F, Galliano F, et al. 2018. A&A 618:A53
- Wyrowski et al. (2010) Wyrowski F, Menten KM, Güsten R, Belloche A. 2010. A&A 518:A26
- Yan (1997) Yan M. 1997. The Influence of X-Rays on Molecular Clouds. Ph.D. thesis, HARVARD UNIVERSITY
- Yeh et al. (2015) Yeh SCC, Seaquist ER, Matzner CD, Pellegrini EW. 2015. ApJ 807:117
- Yorke (1980) Yorke HW. 1980. A&A 86:286–294
- Young Owl et al. (2002) Young Owl RC, Meixner MM, Fong D, Haas MR, Rudolph AL, Tielens AGGM. 2002. ApJ 578:885–896
- Zanchet et al. (2019) Zanchet A, Lique F, Roncero O, Goicoechea JR, Bulut N. 2019. A&A 626:A103
- Zanella et al. (2018) Zanella A, Daddi E, Magdis G, Diaz Santos T, Cormier D, et al. 2018. MNRAS 481:1976–1999
- Zhang et al. (2021) Zhang ZE, Cummings SJ, Wan Y, Yang B, Stancil PC. 2021. ApJ 912:116