Flags, Landscapes and Signaling: Contact-mediated inter-cellular interactions enable plasticity in fate determination driven by positional information
Abstract
Multicellular organisms exhibit a high degree of structural organization with specific cell types always occurring in characteristic locations. The conventional framework for describing the emergence of such consistent spatial patterns is provided by Wolpert’s “French flag” paradigm. According to this view, intra-cellular genetic regulatory mechanisms use positional information provided by morphogen concentration gradients to differentially express distinct fates, resulting in a characteristic pattern of differentiated cells. However, recent experiments have shown that suppression of inter-cellular interactions can alter these spatial patterns, suggesting that cell fates are not exclusively determined by the regulation of gene expression by local morphogen concentration. Using an explicit model where adjacent cells communicate by Notch signaling, we provide a mechanistic description of how contact-mediated interactions allow information from the cellular environment to be incorporated into cell fate decisions. Viewing cellular differentiation in terms of trajectories along an epigenetic landscape (as first enunciated by Waddington), our results suggest that the contours of the landscape are moulded differently in a cell position-dependent manner, not only by the global signal provided by the morphogen but also by the local environment via cell-cell interactions. We show that our results are robust with respect to different choices of coupling between the inter-cellular signaling apparatus and the intra-cellular gene regulatory dynamics. Indeed, we show that the broad features can be observed even in abstract spin models. Our work reconciles interaction-mediated self-organized pattern formation with boundary-organized mechanisms involving signals that break symmetry.
I Introduction
Almost all multicellular organisms possess a characteristic structural organization, whereby cells possessing identical genetic information differentiate into several distinct types over the course of development Wolpert1991 ; Wolpert2011 ; Gilbert2013 . Moreover, such differentiation is ordered spatially, with specific cell types localized in tissues and organs at particular locations that are almost invariant across individuals. In conjunction with mechanical forces that result in changes in the geometry of the developing embryo, the acquisition of region-specific fates by cells in different parts of the organism is responsible for morphogenesis - the emergence of the characteristic body plan of the organism. The key problem that the mechanism underlying such pattern formation has to solve is to allow a cell to differentiate to the type that is the most appropriate for its spatial location. Thus, it involves relating the processes responsible for a cell acquiring one of several possible fates (that determine the morphology and function of the differentiated cell) with those that allow a cell to obtain information about its position in the tissue or organ it belongs to. The process of differentiation can be described from a dynamical perspective as a trajectory followed by the cell state as it traverses the epigenetic landscape shaped by the genetic regulatory network of the cell and its interaction with stimuli present in the cellular environment. In this picture, originally proposed by Waddington Waddington1940 , the possible fates correspond to different channels in the landscape that the cell state follows, depending upon initial conditions and perturbations that may arise from internal or external sources (as shown in Fig. 1 [top panel], where the cell can acquire any one of three possible fates B, W or R). A spatial pattern of cell fates will emerge if cells at different locations in a tissue can preferentially choose one of the fates over the others based on information about their position. This can come about by selective alteration of the landscape for a cell at a particular position in the tissue, so that the cell state is preferentially guided towards one of the channels [Fig. 1, bottom panel].
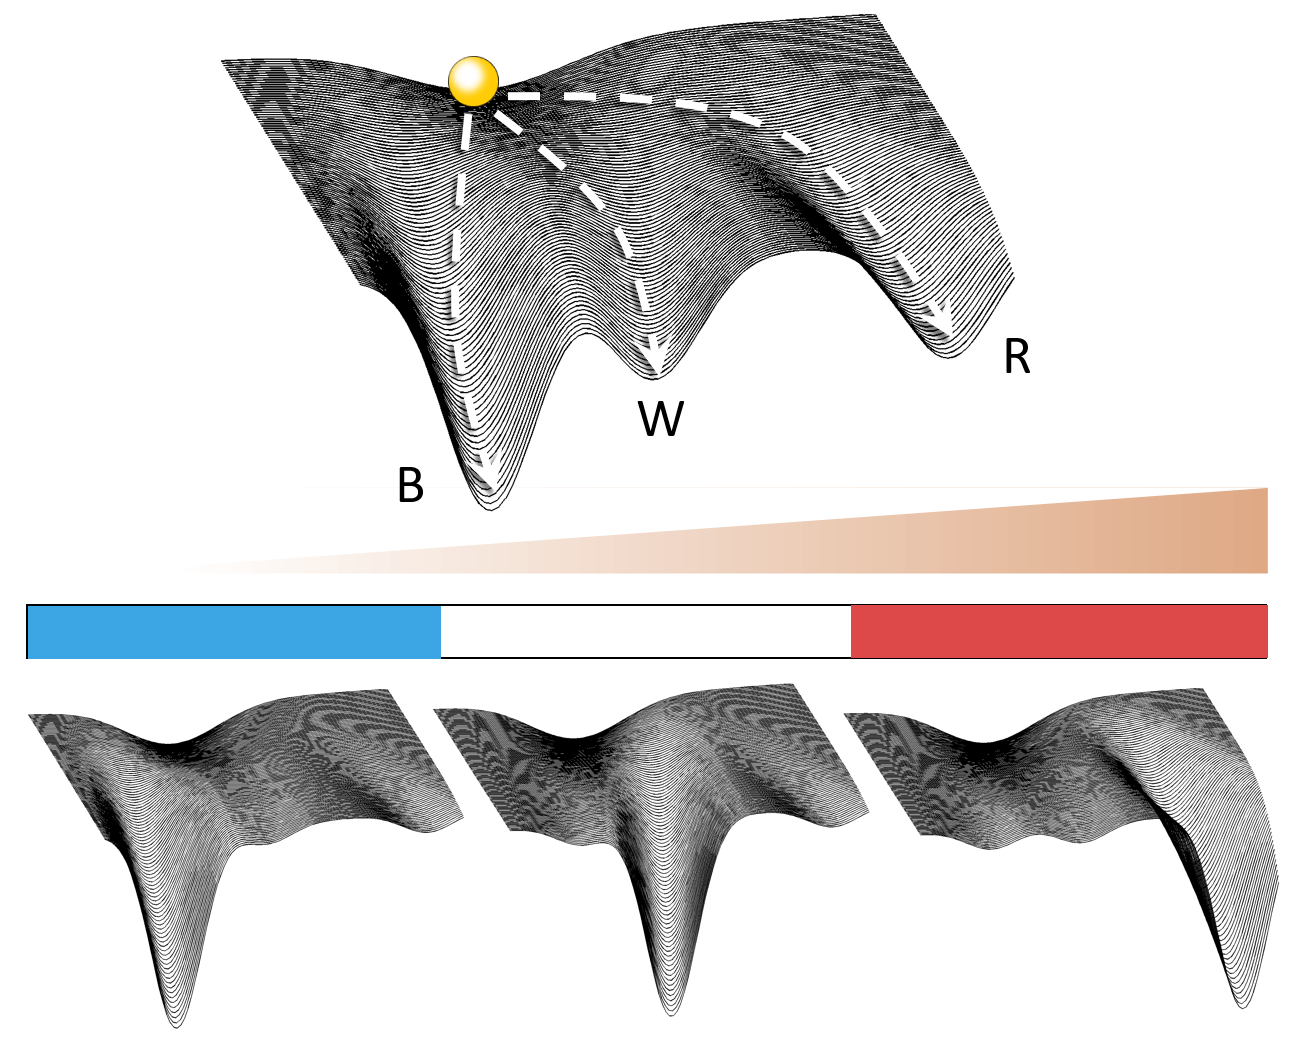
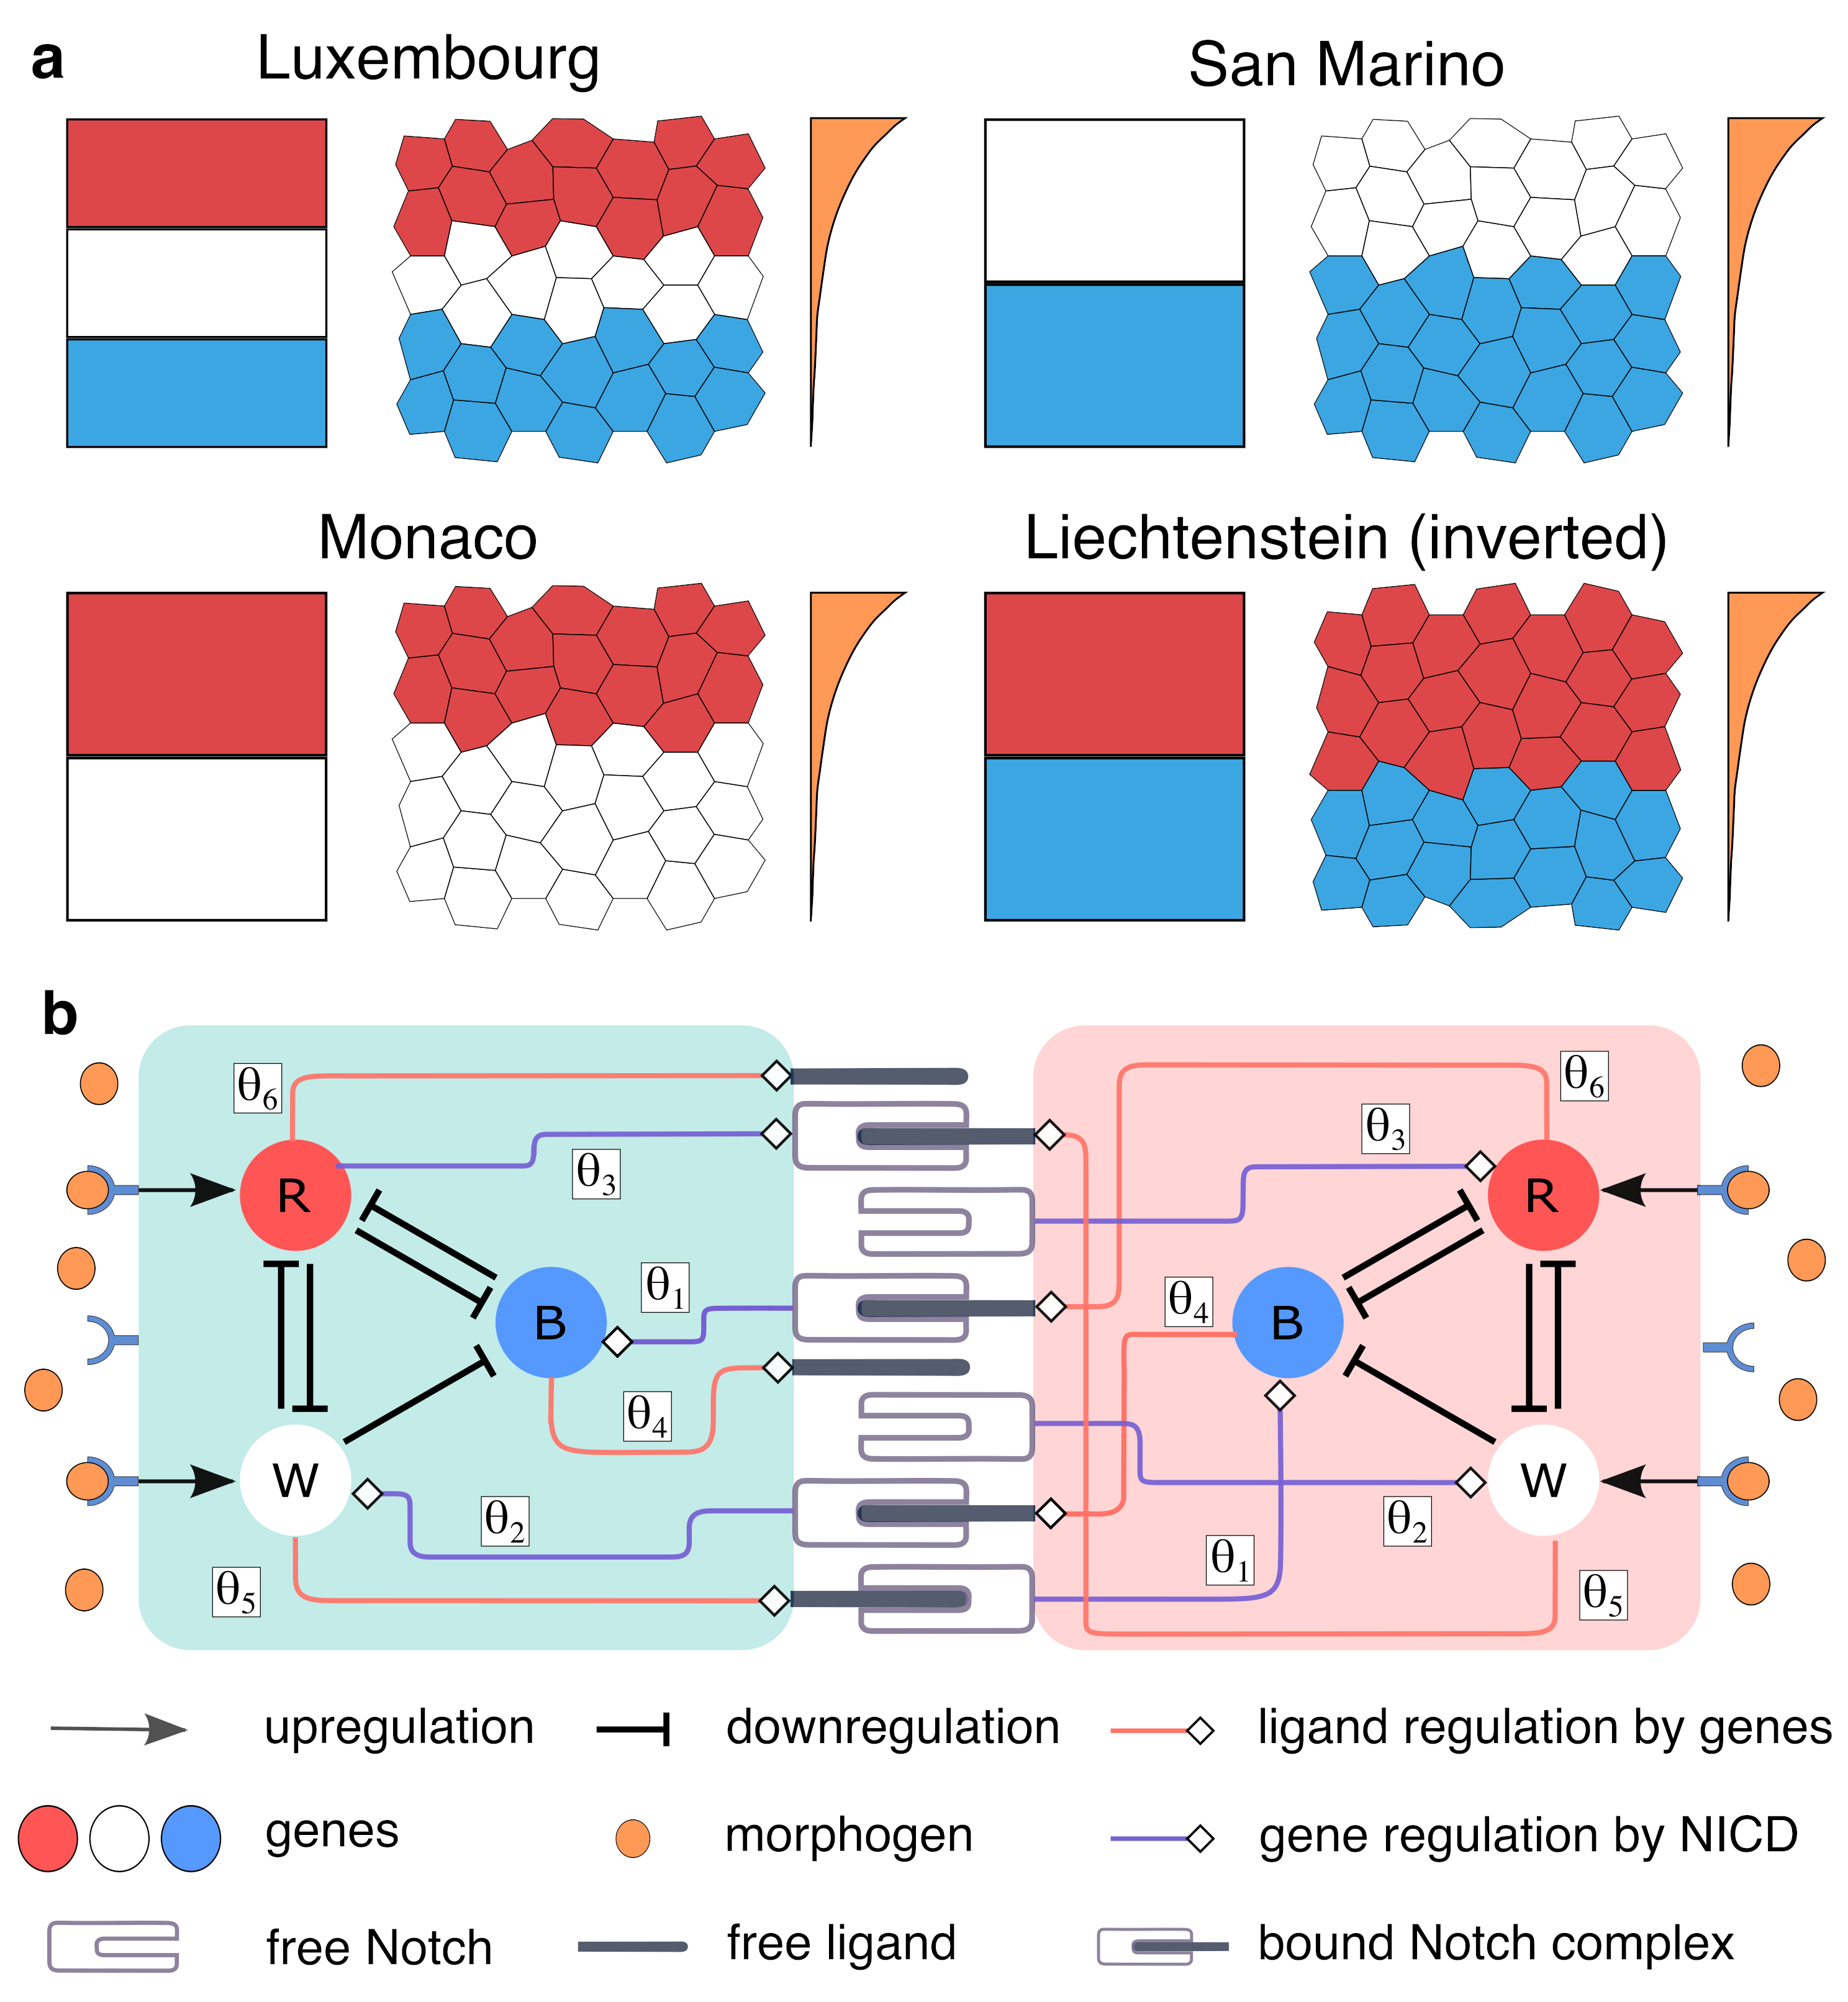
Such position-dependent perturbations of the landscape involve symmetry breaking, which in the context of biological development has typically been associated with molecules collectively referred to as morphogens Turing1952 ; Cross1993 ; Koch1994 ; Ball1999 ; Zhang2018 . The monotonic decrease in the concentration of a morphogen as it diffuses away from a source provides a cue to the cells about their relative placement in a tissue Crick1970 ; Driever1988 ; Teleman2001 ; Lander2002 ; Bollenbach2005 ; England2005 ; Hornung2005 ; Lander2007 ; Ben2010 ; Yuste2010 ; Muratov2011 . The resulting deviation from spatial homogeneity translates to patterns of differential cell fate expressions. The boundary-organized mechanisms by which the patterns emerge are dependent on the existence of spatially varying global signals (such as morphogen gradients Lander2011 or mechanical forces acting on the tissue Kuyyamudi2021_c ). This is often illustrated using the analogy of a flag (specifically, the French tricolor flag composed of blue, white and red bands) whose characteristic identity is related to the relative proportions and sequence of distinct colored regions, independent of the absolute dimensions of the flag Wolpert1969 . Identifying the flag with a tissue and the colors with distinct fates [Fig. 2 (a)], it is easy to see that the central question here is how the characteristic partitioning of the domain occurs consistently into the correct number of fate boundaries, while simultaneously maintaining the right order in which the different cell types appear. Using the “French flag” model, Wolpert showed that this can be solved if (i) the cells have the means to “infer” their location in the tissue and (ii) this allows them to switch on different programs based on the inferred position, leading to distinct fates Wolpert1969 ; Wolpert1989 ; Sharpe2019 . Thus, positional information is provided by the local morphogen concentration, which is interpreted by the intra-cellular gene regulatory network in terms of variations in the expression of certain genes (referred to as patterning genes) whose steady-state levels can be used to represent states corresponding to different fates Gurdon2001 ; Ashe2006 ; Rogers2011 ; Gilbert2013 . This links processes operating in the extra-cellular environment with intra-cellular gene regulatory dynamics, allowing the Waddington landscape of cells to be selectively perturbed depending on their position vis-a-vis the morphogen source (Fig. 1).
Recent experiments however have suggested that this may not be the whole story. In particular, work on developmental patterning in the mouse ventral spinal cord has brought to fore the role played by local cell-cell interactions Kong2015 . Coupling between cells is, of course, known to be the key process underlying the other important class of pattern formation mechanisms, namely that which relies on self-organization, as in the reaction-diffusion framework Turing1952 ; Meinhardt1982 ; Werner2015 . Therefore, it is intriguing to explore the consequences of possible interplay between the two principal paradigms proposed for explaining the genesis of biological patterns in the context of cell-fate patterning in tissues. Here, we do this by investigating assemblies of cells that communicate with their neighbors via contact-mediated signaling, while at the same time being exposed to a morphogen concentration gradient. Specifically, we focus on Notch signaling Artavanis1999 as the means by which a cell interacts with other physically adjacent cells. This involves ligands belonging to its neighbors binding to the Notch receptors located on the surface of the cell, triggering downstream signals that may eventually affect expression of the patterning genes. Notch has been shown to be critically important for development in all metazoans Artavanis1999 ; Kopan2009 . Moreover, it is known that in the presence of noise, such as fluctuations in the global signal (morphogen concentration), Notch-mediated interactions can help the tissue to retain sharpness of the fate boundaries Sprinzak2011 , thereby enhancing the robustness of developmental dynamics Erdmann2009 ; Lander2011 ; Lander2013 . This raises the possibility, explored in detail here, that Notch-mediated inter-cellular interactions may modulate the process of morphogen-driven cell-fate patterning to varying extents, giving rise to “flags” that may deviate quite markedly from the (tricolor) pattern one would expect in the absence of such interactions [Fig. 2 (a)].
In this paper we show that contact-mediated interactions between cells can provide a mechanism by which the cell can use information collected from its neighborhood to adapt its fate decision that would otherwise solely be guided by global positioning information, e.g., as obtained from the local concentration of a morphogen gradient. Our theoretical demonstration is consistent with reported results of experiments performed on the ventral spinal cord of mice which showed that the proportion of regions exhibiting distinct cell fates differ for the situation when Notch inter-cellular signaling is absent as compared to when it is present Kong2015 . Our model incorporates an explicit connection between the genes that respond to the morphogen signal and Notch signaling that allows physically adjacent cells to communicate. Specifically, the downstream effector of the Notching signaling pathway is assumed to regulate patterning gene expression, which in turn controls the production of the ligands that bind to the Notch receptors. The interaction between the patterning genes is described by equations originally proposed in the context of patterning in the vertebrate neural tube where a circuit comprising three mutually regulating genes serves as the interpreter for the positional information encoded in the concentration gradient of the Sonic Hedgehog (Shh) morphogen Dessaud2008 ; Dessaud2010 ; Balaskas2012 .
We systematically vary the nature of each of the regulatory links between the actors involved in inter-cellular interaction and those responsible for local cell fate decisions, and identify the ones that are most instrumental in altering the cell fate pattern. In particular, we show that upregulation of patterning gene expression by the Notch downstream effector consistently results in large deviation of the pattern from that observed in the absence of Notch-mediated coupling. Large perturbations in the sizes of the regions occupied by the various types of differentiated cells and the sequence in which they are arranged can potentially reduce the viability of (or otherwise be disadvantageous to) an organism in terms of its survival. This suggests the presence of strong evolutionary constraints on the nature of any regulatory interactions between the inter-cellular signaling machinery and the fate determining genes. We show that our results are not tied to the specific choices we have made in our model by demonstrating qualitatively identical results in a model variant where the Notch directly regulates ligand production, as well as, the patterning gene expression (the latter not affecting the ligands). Indeed, even generic models such as that of binary spins interacting via nearest-neighbor exchange interactions can illustrate the broad features of how local interactions can modulate the collective behavior of a system responding to a global field. Thus, they allow intermediate-scale phenomena (spanning the cellular neighborhood) to modulate cellular-scale fate decisions that would otherwise be determined solely by tissue-scale signals (the morphogen concentration gradient). In terms of the Waddington framework discussed above, the contact-mediated inter-cellular communication provides an alternative mechanism by which to mould the topography of the landscape shaped by the morphogen signal, that allows subtle (and not so subtle) variations in the flag formed by cell-fate decisions at the scale of the entire cellular assembly.
II Methods
| 100 | 0.3 | 4 | 6.3 | 5 | 5 | 5 | 1 | 1 | 1 | 1 | 1 | 1 | 1 | 6 | 2 | 5 | 1 | 1 |
|---|
We consider a -dimensional cellular array of length placed in a morphogen concentration gradient whose source is assumed to be located at one end of the array. Each cell responds to the local density of morphogen molecules with which its receptors (located on the cell surface) can bind. The morphogen concentration is assumed to be the outcome of a synthesis-diffusion-degradation (SDD) model having the same mean lifetime for the molecules across space. This yields an exponentially decaying profile for (with the maximum located at the source) in the steady state Crick1970 , viz., , where the integer index varies over the range . The cellular response to binding with morphogen can be measured in terms of the concentration of downstream signaling molecules that are triggered upon successful binding. Assuming that the cellular response mirrors the external morphogen concentration on average, we can express the spatial variation of the response as , with representing the distance from the morphogen source. As indicated in Table 1, we have chosen for all our simulations and , and have verified that our results are not qualitatively sensitive to changes in these values.
Each cell possesses a morphogen interpretation module comprising a set of genes that can regulate each other’s activity and whose expression levels are modulated by the signaling molecules downstream of the receptors triggered by the morphogen. The specific gene circuit that we have chosen for our simulations is composed of three genes B, W and R (which we refer to as patterning genes), using a model that has been used to describe the emergence of tissue differentiation in the vertebrate neural tube’s ventral region Balaskas2012 . The relevant morphogen in this case is Sonic hedgehog (Shh), while the genes are Pax6, Olig2 and Nkx2.2, with Pax6 being expressed even when the morphogen is not present and hence can be identified as the pre-patterning gene (taken to be gene B according to our naming convention). In the initial stage, before the morphogen gradient makes itself felt fully by the cells, this gene will have a higher level of expression compared to the other two genes. However, in the steady state, the morphogen, by promoting the activity of W and R genes, may induce repression of B in parts of the array.
The genes W and R mutually repress each other, as do the genes R and B; however, while W can repress B, B has no effect on W [see Fig. 2 (b)]. We assume that the fate of each cell is decided by the gene that has the highest level of expression in it in the steady state following initial transient dynamics. Thus, regions indicated by the colors blue, white and red, correspond to cells where the genes B, W and R are expressed most strongly, respectively. The following equations describe the time-evolution of the gene expressions:
| (1) | ||||
| (2) | ||||
| (3) |
where the maximal growth rates and decay rates for expression for each of the genes are represented by the parameters and , respectively. The response functions are specified by the parameters , and .
We also consider contact-mediated inter-cellular interactions via the Notch signaling pathway Artavanis1999 ; Kopan2009 . This is incorporated into the expression dynamics of the genes above by the parameters and . The effect of the inter-cellular signaling on the dynamics of the system can be described by augmenting the above equations with those describing the time evolution of concentration of Notch ligand and the Notch intra-cellular domain (NICD) , viz.,
| (4) | ||||
| (5) |
The maximum growth rates of the ligand and the NICD are given by , while their mean lifetimes are represented by , respectively. Upon the binding of ligands of a neighboring cell to a cell’s surface Notch receptors, the intracellular domain of the receptor is released and it subsequently translocates itself to the cell nucleus. We have assumed here a sufficiently high density of receptors for each cell so that they are not saturated. A key feature of our modeling is that the Notch signaling machinery and the morphogen interpretation module are considered to be able to control each other [Fig. 2 (b)].
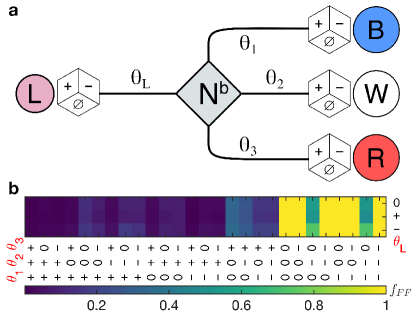
The ligand can be activated, inhibited or not affected at all by each of the patterning genes (promotion/repression being analogous to the situation corresponding to Jagged and Delta ligands, respectively Shimojo2011 ; Manderfield2012 ; Boareto2015 ) while the genes themselves can again be either regulated by NICD in a positive or negative manner or unaffected [Fig. 3 (a)]. Thus, depending on whether the regulation occurs at all and if so, then depending on its nature, there are classes of inter-cellular coupling (which includes also the trivial uncoupled case). If a patterning gene is upregulated by NICD, the corresponding parameters are given by , while in case of downregulation they are given by (with labeling the three genes). Similarly promotion of the ligand by a patterning gene will be represented by the corresponding parameters adopting the values , while repression corresponds to the parameters having the values (the three genes indexed as , respectively). For both types of interactions, absence of regulation of/by a gene will correspond to both the corresponding parameters having the values .
The values of the model parameters (shown in Table 1) are chosen such that in the absence of inter-cellular interactions (viz., and , ) we obtain a pattern that corresponds to the three fate segments having equal length and in the correct chromatic order (B,W,R). In order to investigate how the coupling between cells regulates the pattern, for each of the possible types of connections between the Notch signaling apparatus and the patterning genes we simulate the system dynamics with distinct combinations of the coupling strengths sampled randomly over an uniform distribution within the range for up-regulation and within for down-regulation.
III Results
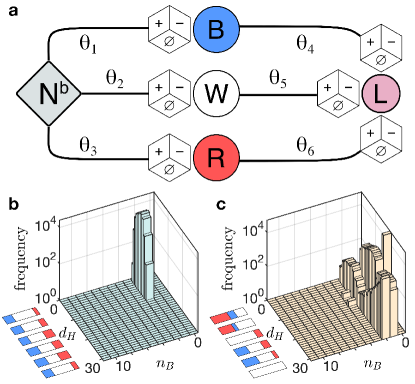
In order to characterize the various patterns that arise in the presence of inter-cellular coupling as we alter the qualitative and quantitative nature of the interactions, we note that the regions exhibiting different cell fates may not only differ in terms of their size (lateral extent) but also the sequence in which they occur in the domain, and even the number of times that a contiguous region with a particular fate appears in the flag. In order to take into account these distinctions quantitatively we employ two different measures, viz., (i) the total number of boundaries between regions having distinct fates and (ii) a metric for the difference between the observed pattern and the flag obtained in the absence of coupling, that measures the binary distance between the fate in each cell position in the two cases (i.e., if they are identical, and otherwise) and then sums over all positions. This latter is identical to a Hamming distance between two symbolic strings and hence represented as . As seen from Fig. 3 (b-c), depending on the motif being considered we can obtain flags that can be quite close to the idealized one having equal sized segments of B, W and R (in that order) [e.g., panel (b) where NICD downregulates B and R but does not affect W, while ligand production is downregulated by B and W but upregulated by R], or extremely divergent patterns [e.g., in panel (c) for the case where NICD upregulates all genes, while B upregulates, R downregulates and W does not affect ligand production].
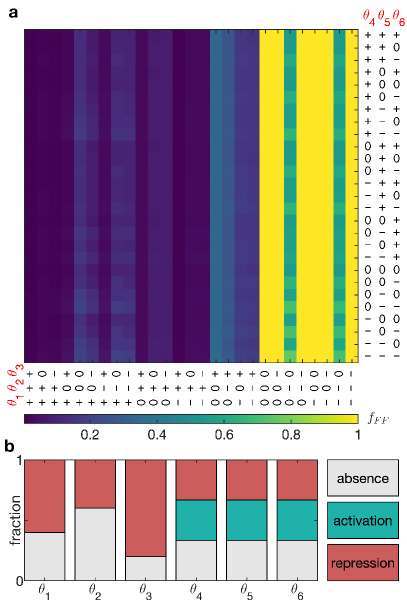
In order to systematically evaluate the patterns resulting from each of the possible interaction motifs, we quantify the fraction of realizations (with randomly sampled parameters ) for each motif that gives rise to a “French” flag, i.e., a pattern characterized by fate boundaries and the correct chromatic sequence of B, W and R. This is because flags that do not conserve or the chromatic order of the idealized flag represent marked aberrations that may be undesirable in the context of tissue development. Fig. 4 (a) shows a matrix of for all the motifs, estimated from realizations in each case. It is immediately clear that the nature of regulation of ligand production by the patterning genes plays an extremely minor role (if at all) in regulating the cell fate pattern, as is evident from the relative lack of variation in along each column (the different rows correspond to different choices, viz., up/down/no regulation of ligand production by the patterning genes). Further, we note that if the NICD upregulates any of the patterning genes, the resulting pattern almost never resembles a “French” flag. Thus, it appears that in order to yield patterns close to that obtained in the absence of any inter-cellular interactions, the NICD should either downregulate or not affect the genes B, W and R. We would like to point out however that the downregulation of the W gene, either in absence of regulation of the other genes or downregulation of only the B gene by NICD, can result in at least some fraction of the flags departing markedly from the idealized pattern.
The importance of the different interactions in regulating the fate pattern can be seen clearly from Fig. 4 (b) which shows the fractions of each type of regulation (up/down/none) that give rise to a “French” flag for each of the 6 regulatory connections (whose strengths are represented by , respectively) linking the pattern gene expression dynamics to Notch signaling. Consistent with the results stated above, we find that the nature of regulation is irrelevant for the interactions whose strengths are (i.e., the regulation of the ligand production by the 3 patterning genes), as each of the three possible types are equally likely to generate such a pattern. However, for the regulatory interaction of the patterning genes by NICD, only upregulation or no regulation can give rise to a “French” flag. This also resonates with our earlier results on the sensitivity of the pattern to variation in the values of the different parameters using either Sobol variation-based analysis or Sloppy model analysis techniques Kuyyamudi2021 . These results had suggested that the parameters and play the most important role in determining the modulation of the cell fate pattern by the inter-cellular interaction.
We would like to note that, for lateral induction or inhibition effected by inter-cellular signaling, it is known from experiments that Notch directly regulates the concentration of its ligand Collier1996 ; Sprinzak2010 ; Sprinzak2011 . Here, in order to connect inter-cellular signaling to gene expression leading to fate determination, we have considered a setting in which this regulation takes place indirectly via the action of NICD on the patterning genes, and subsequently, that of the genes on ligand production. However, we can also consider a different way by which patterns of distinct cell fates can be influenced by inter-cellular Notch interactions. In this alternative approach, we choose NICD to directly regulate the ligand production, as well as, the three genes in any of three possible ways (up/down/no regulation) [Fig. 5 (a)]. In contrast to the preceding model, the gene expression does not affect the components of Notch signaling. Almost all the equations describing the system dynamics earlier remain unchanged (Eqs. 1, 2, 3 and 5) in this alternative model, except the equation describing the time-evolution of the concentration of Notch ligand , viz.,
| (6) |
where the parameters () are given by () in the case of upregulation of ligand by the NICD, while for downregulation they are (). If there is no regulation, both parameters are set to . Fig. 5 (b) shows the fraction of “French” flags for all possible qualitatively distinct interaction motifs that are allowed in this new framework. As before these fractions are estimated from realizations in each case using randomly sampled initial conditions and values of the parameters . We immediately note the high degree of similarity of the results with those of the earlier model [compare the columns of the matrix in Fig. 4 (a) and that in Fig. 5 (b)]. Thus, upregulation of the patterning genes by NICD always results in the pattern diverging markedly from the idealized one having boundaries and the chromatic sequence B,W,R, while the manner in which ligand production is regulated seems to have little effect on the pattern. The near identity of the patterning behavior for the two coupling frameworks we have considered imply that the role played by inter-cellular interactions in determining morphogen-driven tissue patterning is robust to variations in the precise details of the mechanism through which Notch signaling and the gene expression governing cell fates are related.
IV Discussion
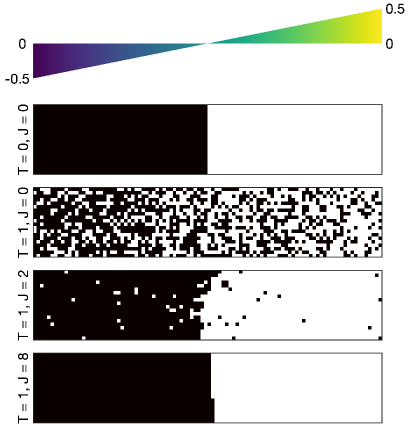
Our results reported here show how local interactions between neighboring elements (mediated by Notch signaling) can modulate the emergent response of the system to a global signal, specifically, a spatially varying external field (set up by a diffusing morphogen). Such phenomena can arise in contexts far removed from that of cell fate patterning in tissues that we use here to motivate the problem. In particular, one can use the generic Ising model used to study collective ordering in arrays of binary state elements (represented as spins that can either be in “up” or “down” orientations). The analog of inter-cellular interactions in this case is the exchange interaction that couples the state of a spin with those of its neighbors - the neighborhood being specified by the geometry of the lattice being considered. Similarly, the concentration gradient of the morphogen is echoed by a magnetic field whose intensity varies monotonically over space. One can, in principle, also consider temperature that introduces thermal fluctuations which disrupt the pattern imposed by the field. In the tissue, such stochastic effects will arise upon considering the presence of intrinsic and extrinsic noise affecting the system dynamics. While this has not been investigated here, we have elsewhere Chandrashekar2022 looked at how inter-cellular interactions can make a pattern robust against noise using a simpler setting of a single boundary separating regions with two distinct fates.
Fig. 6 shows the outcome of evolving a finite size -dimensional lattice of Ising spins for Monte Carlo (MC) steps, where the spins interact with their neighbors in the four cardinal directions (spins located at the boundaries interact with fewer neighbors than those in the bulk). The steady state behavior of the system for the case where only the field is present (first row: , ) corresponds to the idealized flag that we observe in the tissue model in absence of Notch signaling. We subsequently increase the temperature to a finite value () and investigate the resulting pattern in absence of local interactions (second row: ) and for the cases where the interactions are relatively weak (third row: ) and when they are strong (fourth row: ). We observe that while noise completely distorts the pattern resulting from the weak applied field, introducing strong spin-spin interactions restores the pattern seen in absence of thermal fluctuations and exchange interactions - analogous to results in the case of tissue patterning Chandrashekar2022 . Thus, it is possible to connect the specifically biological problem that motivated our study with physical analogues that may be easier to understand analytically.
To put our modeling framework in a broader context, we return once again to the analogy of the French flag that was used by Wolpert to discuss the key problem of differential fate expression in cells according to their spatial location leading to consistent tissue patterning. One of the central features emphasized by Wolpert is the size invariance of the pattern: regardless of the scale at which the tricolor is represented - be it on a lapel pin or displayed across the side of a building - the French flag is always recognizable by the characteristic sequence of blue, white and red domains of equal width. In biological tissue, this will correspond to the same proportion of cells converging to different fates regardless of the absolute size of the domain over which the morphogen gradient is imposed. From a conventional perspective, where the attractor (corresponding to the differentiated state) to which a cell converges to is a function of the local morphogen concentration, this may appear somewhat difficult to explain unless the gradient itself adapts to the dimension of the domain.
In the absence of such adaptation, it would appear that increasing or decreasing the size of the tissue would result in distortion of the pattern as the size of the regions corresponding to different fates will no longer be proportional. In order for the original pattern to be reproduced in domains having different sizes, it would be necessary for a cell at a particular location to be aware of the size of the domain it is part of - a problem analogous to that encountered in quorum sensing Miller2001 ; Waters2005 - so that it can appropriately adjust the information provided by the local morphogen signal. Thus, in a smaller domain, the cells located in the region farthest away from the morphogen source should express the fate B consistent with low morphogen signal, even though in absolute terms the concentration of morphogen they may be detecting would have given rise to the fates W or R in a larger domain.
To get a glimpse of how a cell can possibly gather the necessary information to be able to perform this recalibration, we note an analogous situation in the retina which needs to maintain a high level of sensitivity to the optical signal it receives under a broad range of varying light intensity. A response curve that varies gradually over the entire range of intensity would have extremely low contrast while one which changes sharply over a narrow range of intensities would be insensitive to variation over most of the full intensity range Blanchard1918 ; Werblin1973 . This problem is solved by the cells adaptively shifting the response curve according to the mean intensity of the signal received by neighboring cells, thereby achieving both sensitivity and contrast. We suggest that the problem of maintaining scale invariance of cell fate pattern in tissues can possibly also be resolved in a similar manner, with a cell acquiring knowledge of the larger scheme of things by exchanging information with its neighbors, using either Notch signaling or other contact-mediated communication mechanisms. This highlights the key theme that we explore here, viz., integrating the two principal classes of pattern formation mechanisms operating in biology Lander2011 , one involving a global signal providing position information (the boundary-organized patterning paradigm) and the other using local interactions between the elements (the self-organized paradigm), can yield novel insights in the quest to understand how form and organization arises during the development of an organism Green2015 ; Kuyyamudi2021_b .
V Conclusion
Cellular differentiation has been often described in terms of dynamical trajectories on an epigenetic landscape such that the cell state eventually converges to any one of multiple attractors that correspond to distinct cell fates Waddington1957 ; Ferrell2012 ; Wang2014 ; Mojtahedi2016 ; Moris2016 . For a single cell, the asymptotic behavior resulting from this dynamics - i.e., the fate it attains - is decided by the initial condition and external environment. However, when we consider the problem of tissue patterning wherein the collective behavior of many neighboring cells are at play in deciding their fates, additional influences need to be considered. In particular, inter-cellular interactions can modify the landscape over which the state trajectory of individual cells evolve. To demonstrate this, we chose a relatively simple model involving intra-cellular dynamics that results in the cells choosing between one of three different fates based upon the morphogen concentration (the external environment) and contact-mediated signaling with neighboring cells, which is realized in our model in terms of Notch signaling. While it is possible to couple the behavior of the patterning genes responsible for fate choice and the inter-cellular signaling in multiple ways, we show that two different ways of having the Notch signal affect the gene expression yields qualitatively identical results, suggesting that the broad contours of the behavior reported here are insensitive to the specific details of the model. The key finding is that cell-cell interactions can indeed modify the cell fate pattern imposed by the field realized by a gradient of diffusing morphogen molecules. Thus, while morphogens have been seen as the determinant of the broad contours in which an organism’s body is organized, the signaling between cells provide a flexibility that can allow them to adapt their eventual fates to local information rather than be enslaved to the global commands issued by morphogens. The analogy with collective ordering in abstract models such as Ising spin lattices suggest that this is a general feature, and possibly is at work in developmental pattern formation at multiple scales and using different coupling mechanisms.
Acknowledgements.
We would like to thank Marcin Zagórski for helpful discussions. SNM has been supported by the IMSc Complex Systems Project (12th Plan), and the Center of Excellence in Complex Systems and Data Science, both funded by the Department of Atomic Energy, Government of India. The simulations required for this work were supported by IMSc High Performance Computing facility (hpc.imsc.res.in) [Nandadevi].References
- (1) L. Wolpert, The Triumph of the Embryo (Oxford University Press, Oxford, 1991).
- (2) L. Wolpert and C. Tickle, Developmental Biology (Oxford University Press, Oxford, 2011).
- (3) S. Gilbert, Developmental Biology (Sinauer, Sunderland, MA., 2013).
- (4) C. H. Waddington, Organisers and Genes (Cambridge University Press, Cambridge, 1940).
- (5) A. M. Turing, The chemical basis of morphogenesis. Philos. Trans. R. Soc. London B 237, 37-72 (1952). \doi10.1098/rstb.1952.0012
- (6) M. C. Cross and P. C. Hohenberg, Pattern formation outside of equilibrium. Rev. Mod. Phys. 65, 851-1112 (1993). \doi10.1103/RevModPhys.65.851
- (7) A. J. Koch and H. Meinhardt, Biological pattern formation: From basic mechanisms to complex structures. Rev. Mod. Phys. 66, 1481-1507 (1994). \doi10.1103/RevModPhys.66.1481
- (8) P. Ball, The Self-made Tapestry: Pattern Formation in Nature (Oxford University Press, Oxford, 1999). \doi10.1119/1.880339
- (9) H. T. Zhang and T. Hiiragi, Symmetry breaking in the mammalian embryo. Annu. Rev. Cell Dev. Biol. 34, 405-426 (2018). \doi 10.1146/annurev-cellbio-100617-062616
- (10) F. Crick, Diffusion in embryogenesis. Nature (Lond.) 225, 420-422 (1970). \doi10.1038/225420a0
- (11) W. Driever and C. Nüsslein-Volhard, The bicoid protein determines position in the drosophila embryo in a concentration-dependent manner. Cell 54, 95-104 (1988). \doi10.1016/0092-8674(88)90183-3
- (12) A. A. Teleman, M. Strigini, and S. M. Cohen, Shaping morphogen gradients. Cell 105, 559-562 (2001). \doi10.1016/s0092-8674(01)00377-4
- (13) A. D. Lander, Q. Nie, and F. Y. M. Wan, Do morphogen gradients arise by diffusion? Dev. Cell 2, 785-796 (2002). \doi10.1016/s1534-5807(02)00179-x
- (14) T. Bollenbach, K. Kruse, P. Pantazis, M. González-Gaitán, and F. Jülicher, Robust formation of morphogen gradients. Phys. Rev. Lett. 94, 018103 (2005). \doi10.1103/physrevlett.94.018103
- (15) J. L. England and J. Cardy, Morphogen gradient from a noisy source. Phys. Rev. Lett. 94, 078101 (2005). \doi10.1103/physrevlett.94.078101
- (16) G. Hornung, B. Berkowitz, and N. Barkai, Morphogen gradient formation in a complex environment: An anomalous diffusion model. Phys. Rev. E 72, 041916 (2005). \doi10.1103/physreve.72.041916
- (17) A. D. Lander, Morpheus unbound: Reimagining the morphogen gradient. Cell 128, 245-256 (2007). \doi10.1016/j.cell.2007.01.004
- (18) D. Ben-Zvi and N. Barkai, Scaling of morphogen gradients by an expansion-repression integral feedback control. Proc. Natl. Acad. Sci. USA 107, 6924-6929 (2010). \doi10.1073/pnas.0912734107
- (19) S. B. Yuste, E. Abad, and K. Lindenberg, Reaction-subdiffusion model of morphogen gradient formation. Phys. Rev. E 82, 061123 (2010). \doi10.1103/physreve.82.061123
- (20) C. B. Muratov, P. V. Gordon, and S. Y. Shvartsman, Self-similar dynamics of morphogen gradients. Phys. Rev. E 84, 041916 (2011). \doidoi.org/10.1103/physreve.84.041916
- (21) A. D. Lander, Pattern, growth, and control. Cell 144, 955-969 (2011). \doi10.1016/j.cell.2011.03.009
- (22) C. Kuyyamudi, S. N. Menon, F. Casares, and S. Sinha, Disorder in cellular packing can alter proliferation dynamics to regulate growth. Phys. Rev. E 104, L052401 (2021). \doi10.1103/PhysRevE.104.L052401
- (23) L. Wolpert, Positional information and the spatial pattern of cellular differentiation. J. Theor. Biol. 25, 1-47 (1969). \doi10.1016/s0022-5193(69)80016-0
- (24) L. Wolpert, Positional information revisited. Development 107, 3-12 (1989). \doi10.1016/j.jtbi.2010.10.034
- (25) J. Sharpe, Wolpert’s french flag: What’s the problem? Development, 146, dev185967 (2019). \doi10.1242/dev.185967
- (26) J. B. Gurdon and P-Y. Bourillot, Morphogen gradient interpretation. Nature (Lond.) 413, 797-803 (2001). \doi10.1038/35101500
- (27) H. L. Ashe and J. Briscoe, The interpretation of morphogen gradients. Development 133, 385-394 (2006). \doi10.1242/dev.02238
- (28) K. W. Rogers and A. F. Schier, Morphogen gradients: From generation to interpretation. Annu. Rev. Cell Dev. Biol. 27, 377-407 (2011). \doi10.1146/annurev-cellbio-092910-154148
- (29) J. H. Kong, L. Yang, E. Dessaud, K. Chuang, D. M. Moore, R. Rohatgi, J. Briscoe, and B. G. Novitch, Notch activity modulates the responsiveness of neural progenitors to sonic hedgehog signaling. Dev. Cell 33, 373-387 (2015). \doi10.1016/j.devcel.2015.03.005
- (30) H. Meinhardt, Models of Biological Pattern Formation (Academic Press, London, 1982).
- (31) S. Werner, T. Stückemann, M. B. Amigo, J. C. Rink, F. Jülicher, and B. M. Friedrich, Scaling and regeneration of self-organized patterns. Phys. Rev. Lett. 114, 138101 (2015). \doi10.1103/PhysRevLett.114.138101
- (32) S. Artavanis-Tsakonas, M. D. Rand, and R. J. Lake, Notch signaling: Cell fate control and signal integration in development. Science 284, 770-776 (1999). \doi10.1126/science.284.5415.770
- (33) R. Kopan and M. X. G. Ilagan, The canonical notch signaling pathway: Unfolding the activation mechanism. Cell 137, 216-233 (2009). \doi10.1016/j.cell.2009.03.045
- (34) D. Sprinzak, A. Lakhanpal, L. LeBon, J. Garcia-Ojalvo, and M. B. Elowitz, Mutual inactivation of notch receptors and ligands facilitates developmental patterning. PLoS Comput. Biol. 7, e1002069 (2011). \doi10.1371/journal.pcbi.1002069
- (35) T. Erdmann, M. Howard, and P. R. Ten Wolde, Role of spatial averaging in the precision of gene expression patterns. Phys. Rev. Lett. 103, 258101 (2009). \doi10.1103/physrevlett.103.258101
- (36) A. D. Lander, How cells know where they are. Science 339, 923-927 (2013). \doi10.1126/science.1224186
- (37) E. Dessaud, A. P. McMahon, and J. Briscoe, Pattern formation in the vertebrate neural tube: A sonic hedgehog morphogen-regulated transcriptional network. Development 135, 2489-2503 (2008). \doidoi.org/10.1242/dev.009324
- (38) E. Dessaud, V. Ribes, N. Balaskas, L. L. Yang, A. Pierani, A. Kicheva, B. G. Novitch, J. Briscoe, and N. Sasai, Dynamic assignment and maintenance of positional identity in the ventral neural tube by the morphogen sonic hedgehog. PLoS Biol. 8, e1000382 (2010). \doi10.1371/journal.pbio.1000382
- (39) N. Balaskas, A. Ribeiro, J. Panovska, E. Dessaud, N. Sasai, K. M. Page, J. Briscoe, and V. Ribes, Gene regulatory logic for reading the sonic hedgehog signaling gradient in the vertebrate neural tube. Cell 148, 273-284 (2012). \doidoi.org/10.1016/j.cell.2011.10.047
- (40) H. Shimojo, T. Ohtsuka, and R. Kageyama, Dynamic expression of notch signaling genes in neural stem/progenitor cells. Front. Neurosci. 5, 78 (2011). \doi10.3389/fnins.2011.00078
- (41) L. J. Manderfield, F. A. High, K. A. Engleka, F. Liu, L. Li, S. Rentschler, and J. A. Epstein, Notch activation of jagged1 contributes to the assembly of the arterial wall. Circulation 125, 314-323 (2012). \doi10.1161/circulationaha.111.047159
- (42) M. Boareto, M. K. Jolly, M. Lu, J. N. Onuchic, C. Clementi, and E. Ben-Jacob, Jagged–delta asymmetry in notch signaling can give rise to a sender/receiver hybrid phenotype. Proc. Natl. Acad. Sci. USA 112, E402-E409 (2015). \doi10.1073/pnas.1416287112
- (43) C. Kuyyamudi, S. N. Menon, and S. Sinha, Contact-mediated cellular communication supplements positional information to regulate spatial patterning during development. Phys. Rev. E 103, 062409 (2021). \doi10.1103/PhysRevE.103.062409
- (44) J. R. Collier, N. A. Monk, P. K. Maini, and J. H. Lewis, Pattern formation by lateral inhibition with feedback: A mathematical model of delta-notch intercellular signalling. J. Theor. Biol. 183, 429-446 (1996). \doi10.1006/jtbi.1996.0233
- (45) D. Sprinzak, A. Lakhanpal, L. LeBon, L. A. Santat, M. E. Fontes, G. A. Anderson, J. Garcia-Ojalvo, and M. B. Elowitz, Cis-interactions between Notch and Delta generate mutually exclusive signalling states. Nature 465, 86-90 (2010). \doi10.1038/nature08959
- (46) C. Kuyyamudi, S. N. Menon, and S. Sinha, Precision of morphogen-driven tissue patterning during development is enhanced through contact-mediated cellular interactions. arXiv:2110.12927 (2021).
- (47) M. B. Miller and B. L. Bassler, Quorum sensing in bacteria. Annu. Rev. Microbiol. 55, 165-199 (2001) \doi10.1146/annurev.micro.55.1.165
- (48) C. M. Waters and B. L. Bassler, Quorum sensing: Cell-to-cell communication in bacteria. Annu. Rev. Cell Dev. Bi. 21, 319-346 (2005). \doi10.1146/annurev.cellbio.21.012704.131001
- (49) J. Blanchard., The brightness sensibility of the retina. Phys. Rev. 11, 81-99 (1918). \doi10.1103/PhysRev.11.81
- (50) F. S. Werblin, The control of sensitivity in the retina. Sci. Am. 228, 70-79 (1973). \doi10.1038/scientificamerican0173-70
- (51) J. B. Green and J. Sharpe, Positional information and reaction-diffusion: Two big ideas in developmental biology combine. Development 142, 1203-1211 (2015). \doi10.1242/dev.114991
- (52) C. Kuyyamudi, S. N. Menon, and S. Sinha, Morphogen-regulated contact-mediated signaling between cells can drive the transitions underlying body segmentation in vertebrates. Phys. Biol. 19, 016001 (2022). \doi10.1088/1478-3975/ac31a3
- (53) C. H. Waddington, The Strategy of the Genes (George Allen & Unwin, London, 1957).
- (54) J. E. Ferrell, Bistability, bifurcations, and Waddington’s epigenetic landscape. Curr. Biol. 22, R458-R466 (2012). \doi10.1016/j.cub.2012.03.045
- (55) P. Wang, C. Song, H. Zhang, Z. Wu, X. J. Tian, and J. Xing, Epigenetic state network approach for describing cell phenotypic transitions. Interface Focus 4, 20130068 (2014). \doi10.1098/rsfs.2013.0068
- (56) M. Mojtahedi, A. Skupin, J. Zhou, I. G. Castao, R. Y. Y. Leong-Quong, H. Chang, K. Trachana, A. Giuliani, and S. Huang, Cell fate decision as high-dimensional critical state transition. PLoS Biol. 14, e2000640 (2016). \doi10.1371/journal.pbio.2000640
- (57) N. Moris, C. Pina, and A. M. Arias, Transition states and cell fate decisions in epigenetic landscapes. Nat. Rev. Genet. 17, 693-703 (2016). \doi10.1038/nrg.2016.98