Discovery of hot subdwarfs covered with helium-burning ash
Abstract
Helium rich subdwarf O stars (sdOs) are hot compact stars in a pre-white dwarf evolutionary state. Most of them have effective temperatures and surface gravities in the range = 40 000–50 000 K and = 5.5–6.0. Their atmospheres are helium dominated. If present at all, C, N, and O are trace elements. The abundance patterns are explained in terms of nucleosynthesis during single star evolution (late helium core flash) or a binary He-core white dwarf merger. Here we announce the discovery of two hot hydrogen-deficient sdOs (PG1654322 and PG1528025) that exhibit unusually strong carbon and oxygen lines. A non-LTE model atmosphere analysis of spectra obtained with the Large Binocular Telescope and by the LAMOST survey reveals astonishingly high abundances of C () und O () and that the two stars are located close to the helium main sequence. Both establish a new spectroscopic class of hot H-deficient subdwarfs (CO-sdO) and can be identified as the remnants of a He-core white dwarf that accreted matter of a merging low-mass CO-core white dwarf. We conclude that the CO-sdOs represent an alternative evolutionary channel creating PG1159 stars besides the evolution of single stars that experience a late helium-shell flash.
keywords:
stars: abundances – stars: atmospheres – stars: evolution – subdwarfs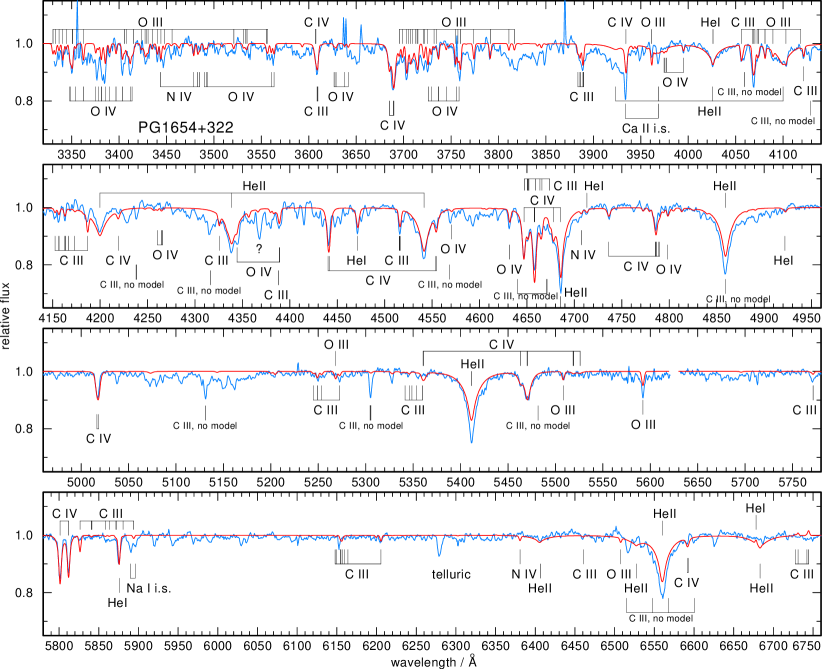
1 Introduction
In the Kiel diagram, helium rich subdwarf O stars (He-sdOs) cluster around effective temperatures and gravities of = 40 000–50 000 K and = 5.5–6.0 (Heber 2016). They exhibit little or no hydrogen in their atmospheres. The carbon abundance is either slightly above the solar value (up to about C = 0.03 mass fraction) or strongly depleted. Nitrogen is 3–10 times oversolar for many He-sdOs while it is strongly depleted in others. Abundance measurements of oxygen are scarce and reveal values (strongly) below the solar abundance, see e.g. Schindewolf et al. (2018) and Werner et al. (2021). The abundance patterns indicate the dominance of hydrogen-burning ash on the stellar surface. As to the origin of He-sdOs, two competing scenarios are discussed, namely a late He-core flash (e.g. Battich et al. 2018) or a He-core white dwarf merger (Zhang & Jeffery 2012). The He-sdOs are on or near the helium main sequence and evolutionary models suggest that they are either He-core or He-shell burners, respectively.
In contrast to all He-sdOs studied so far, we present here two exceptional objects of a new spectral class that we call CO-sdOs. They caught our attention because they exhibit unusually strong carbon and oxygen lines in their spectra. We will show that the stars are He rich with very high C and O abundances, thus, exhibiting a large fraction of helium-burning ash on their surface. They cannot be explained by any of the two mentioned evolutionary scenarios.
PG1528025 was discovered in the Palomar-Green survey (Green et al. 1986) as a V = 16.4 mag hot subdwarf and classified as sdBO. It has been observed twice within the course of the LAMOST, DR5 (Luo et al. 2019; Lei et al. 2019). These authors classified it as He-sdO and performed an automated spectral analysis using NLTE models with pure H/He composition. Luo et al. (2019) found = 64 194593 K, = 6.400.08, and a number abundance ratio , while Lei et al. (2019) arrived at = 88 70029 720 K, = 5.210.39, and . PG1654322 was also discovered in the Palomar-Green survey (Green et al. 1986) as a V = 15.4 mag hot subdwarf and classified as sdOC. No spectroscopic analysis was performed up to now.
2 Observations and spectral analysis
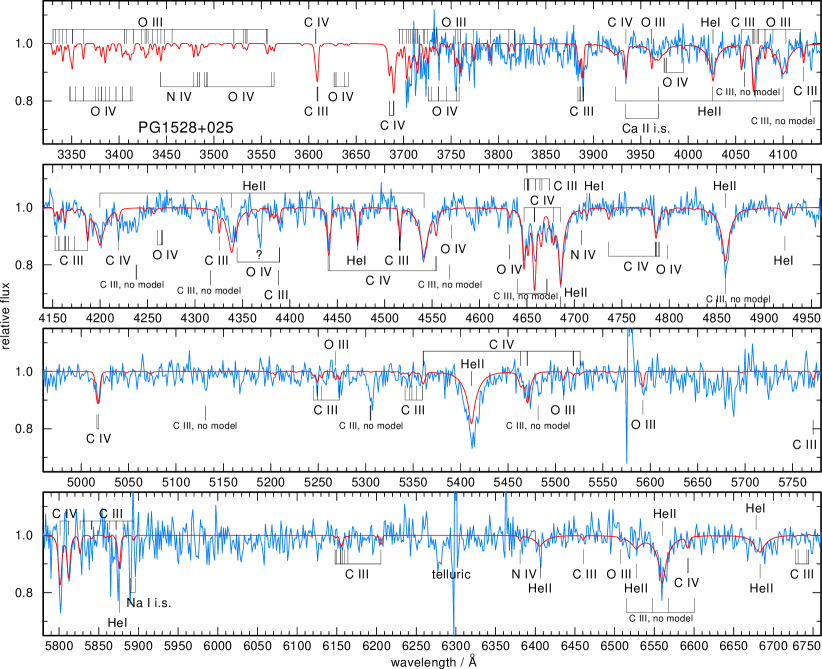
We have observed PG1654322 with the Large Binocular Telescope (LBT) on July 9, 2021, using the MODS instrument that provides two-channel grating spectroscopy. The spectra cover the wavelength region 3330–5800 Å and 5500–10 000 Å with a resolving power of and 2300, respectively. They are shown in Fig. 1. Besides lines of He ii and weaker He i lines, we identify a plethora of carbon lines (C iii and C iv) which are stronger than usual in He-sdOs. But what is most remarkable is the fact that we see rather strong oxygen lines (O iii and O iv). Usually lines from this element are very weak if visible at all and can only be detected in high-resolution spectra. So just by visual inspection it is clear that these sdOs show unusually high C and O abundances. Nitrogen lines cannot be detected and there are no hints as to the presence of hydrogen. PG1528025 was observed in the course of the LAMOST survey (Luo et al. 2019) on March 21 and April 22, 2017. The two spectra do not show any radial velocity shift and the star is therefore likely not in a close binary system. For the spectral analysis we use the co-added spectrum. It covers the range 3700–9080 Å with at 5500 Å and looks very similar to PG1654322 (Fig. 4). To search for variabilities in the light curves indicative of close binarity we checked the data archives. Both stars were observed in the course of the ZTF (Masci et al. 2019; Bellm et al. 2019) 269 and 763 times in the r-band, respectively. They do not exhibit any variability.
We used the Tübingen Model-Atmosphere Package to compute non-LTE, plane-parallel, line-blanketed atmosphere models in radiative and hydrostatic equilibrium (Werner & Dreizler 1999; Werner et al. 2003, 2012). We computed models of the type introduced in detail by Werner & Rauch (2014). They were tailored to investigate the optical spectra of relatively cool PG1159 stars. In essence, they consist of the main atmospheric constituents, namely He, C, and O. N was included as a trace element in subsequent line-formation iterations, i.e., the atmospheric structure was kept fixed.
For the analysis of PG1654322 we computed a small set of models with different abundances and 5000 K steps in and 0.3 dex steps in . The models were calculated in a step-by-step procedure to improve the spectral fit after each single model computation. Computing a grid of models by systematically varying all parameters was prohibitive, because the model atmospheres turned out to be numerically very unstable in this parameter range.
To constrain the effective temperature we can use the ionisation balances of He, C, and O. First of all, the relative strengths of lines from He i and He ii are important. In particular, the neutral helium lines are very sensitive to changes in . In addition we can compare lines from C iii and C iv, from which the C iii lines react strongly on changes in temperature. Like the He i lines they become too weak at too-high temperature. In the case of oxygen, O iii lines become weaker with increasing while O iv lines become stronger in the temperature region of interest. In the case of PG1654322 we found a best fit at = 55 000 K. Since models that are cooler or hotter by 5000 K predict the He i lines much too strong or too weak, respectively, we estimate our uncertainty for the temperature determination to 3000 K. Constraining the surface gravity is more difficult because none of the models can fit the lower series members of the He ii Pickering lines. In particular, the lines at 6560, 5412, and 4859 Å are always too weak in the models. This is reminiscent of the Balmer line problem (Bergeron et al. 1993; Werner 1996) and hence could be a hint that additional opacity sources that are not included in the models are important. So we rely on the higher series members. At too-low gravity the computed line cores become too strong while at too-high gravity the lines disappear due to pressure broadening. We find a compromise at = 5.8 and assign a conservatively large error of 0.5 dex.
As to the C and O abundances, we started from helium-dominated atmosphere models with mass fractions of 0.03 for both species and gradually increased the abundances until a good by-eye fit was achieved to the spectral lines. We arrived at C = and O = . Uncertainties were estimated from models showing too weak and too strong lines. For nitrogen, only an upper limit could be found by the absence of N iv lines in the observed spectrum. The location of the strongest N iv lines that would be detectable above an abundance threshold of N = 0.005 is indicated in Fig. 1. Our best fit model is computed with this value for the N abundance and some weak lines are visible. Finally we looked for an upper limit of the hydrogen abundance. Trace hydrogen would become detectable first by an emission peak of the H line close to the core of the respective He ii line. We found that at an abundance exceeding H = 0.005 this emission core would produce a noticeable dent in the He ii line profile of the model which is however not observed. We therefore accept this value as an upper limit.
The best fitting model is displayed in Fig. 1. It is obvious that a number of observed lines are not present in the model. Some of them are highly excited C iii lines which are not included in our model atom. These lines are indicated as “C iii no model”. Many other lines remain unidentified, one of the strongest is at 4368 Å. Also, broad and shallow features are seen, for example at 3800–3850 Å, 3910–3930 Å, and 5060-5180 Å. We can only speculate that these are other high-excitation lines from C iii or O iii-iv. Note that some of these unidentified lines are also present in PG1528025. We have looked for lines from other elements (Ne ii, Mg ii, Al iii, Si iii-iv, P iv-v, S iv-v, Ti v, Pb iv) discovered by Schindewolf et al. (2018), Dorsch et al. (2019), and Dorsch et al. (2021) in high-resolution spectra of He-sdOs, but to no avail.
The analysis of PG1528025 proceeded in the same way. Its spectrum is noisier than that of PG1654322 and it does not reach as far in the blue wavelength region (Appendix A). As a consequence, the measured element abundances have larger error estimates. PG1528025 is cooler than PG1654322 as can bee seen by the stronger He i lines. The shape of the He ii line profiles suggest a lower gravity. We determined = K, = , and abundances as given in Table 1. Our values for temperature and gravity are significantly lower than those found by Luo et al. (2019) mentioned in the Introduction, probably due to their model atmospheres that are composed of H and He only.
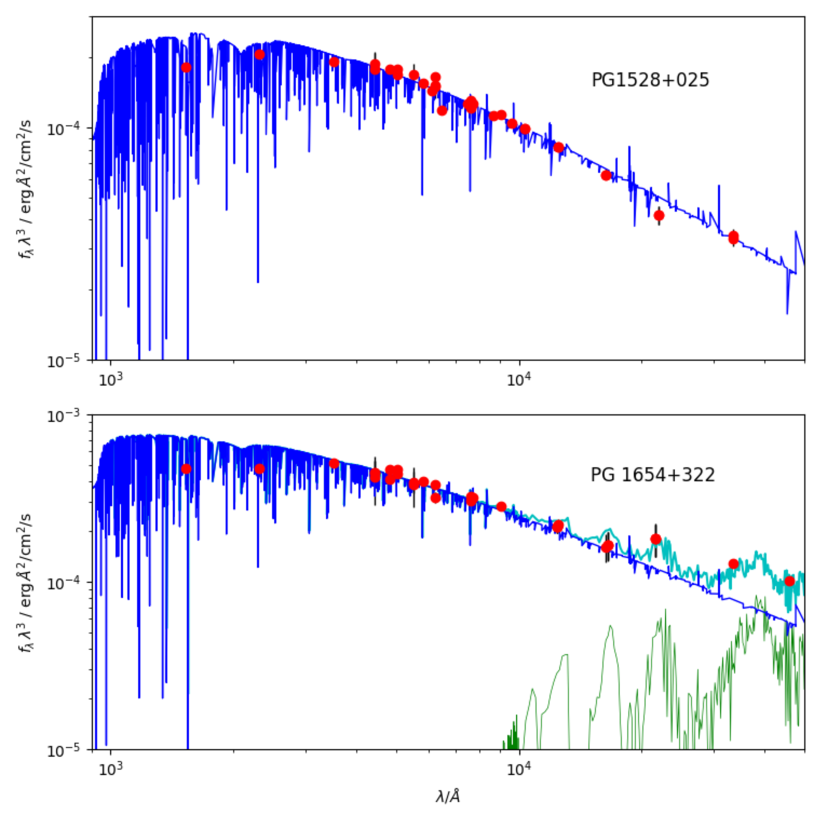
The model atmospheres for both stars were used to perform a fit to the observed spectral energy distribution (Fig. 2). Using the Fitzpatrick (1999) reddening law our synthetic spectra were reddened at the values reported by the 2D dust map of Schlafly & Finkbeiner (2011). We employed photometry from various catalogs: GALEX (Bianchi et al. 2017), Pan-STARRS1 (Chambers et al. 2016), Landolt B, V (Henden et al. 2015), Gaia DR2 and EDR3 (Gaia Collaboration et al. 2020), UKIDSS-DR9 (Lawrence et al. 2007), SDSS (Alam et al. 2015), 2MASS (Cutri et al. 2003), and WISE (Schlafly et al. 2019). Magnitudes were converted into fluxes using the VizieR Photometry viewer (http://vizier.unistra.fr/vizier/sed/). The stellar radius follows from the Gaia EDR3 parallax distances from Bailer-Jones et al. (2021). The luminosity can then be computed from (Table 1).
The visual extinction is evaluated from the standard relation so that we obtain a dereddened visual magnitude . The spectroscopic distance is found by the relation
where is the Eddington flux of the best-fit atmosphere model at 5400 Å (Table 1). We assume a mass of 0.8 (see discussion below). The results are listed in Table 1 as well as the distances derived from the Gaia EDR3 parallaxes. The main error source for the spectroscopic distance is the uncertainty in the surface gravity, preventing a meaningful mass determination. Both distance determinations agree within error limits.
PG1654322 shows an infrared excess redward of the SDSS z-band that can be reproduced with a NextGen stellar model atmosphere (Allard et al. 2012) with = 2000 K and = 1.7 . This radius is more than an order of magnitude higher than what is expected for an L dwarf ( ). For comparison, hot Jupiters and M dwarfs in a post-common envelope binary with a central star of a planetary nebula are found to be inflated only by up to (see Mol Lous & Miguel 2020; Jones et al. 2020 and references therein). A close, low-mass companion to PG1654322 is also doubtful because at such high primary , typically emission lines originating from the highly irradiated side of the cool companion are visible in the optical spectra. A by-chance alignment of two such peculiar objects also seems unconvincing. Thus, PG1654322 may harbor a gaseous disk with a similar temperature.
| PG1654322 | PG1528025 | |
| / K | ||
| ( / cm s-2) | ||
| H | ||
| He | ||
| C | ||
| N | ||
| O | ||
| / | ||
| / | ||
| V / mag | 15.468 | 16.395 |
| / mag | 0.025 | 0.043 |
| / erg cm-2s-1Hz-1 | ||
| / pc (spectroscopic) | ||
| / pc (Gaia parallax) |
3 Discussion
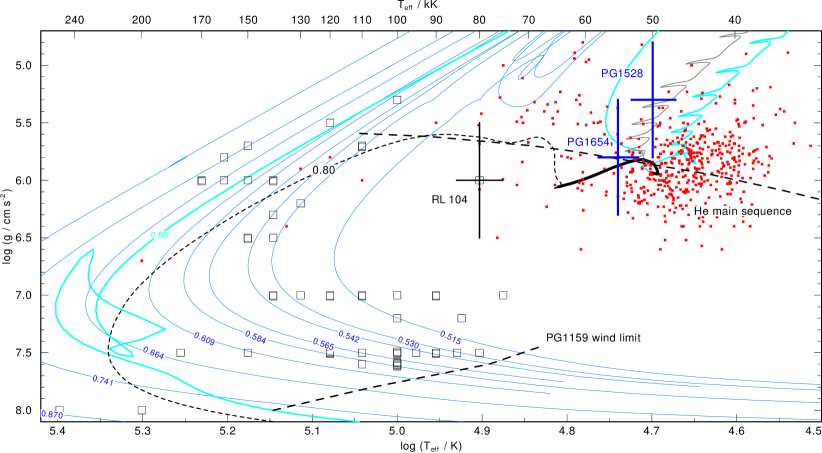
We have analysed two helium rich (He 0.6) hot subdwarfs which turn out to be unusually abundant in carbon (C 0.2) and oxygen (O 0.2; mass fractions). They establish a new spectral type that we call CO-sdOs in contrast to the usual He-sdOs which have carbon abundances from strongly subsolar to at most 3% and strongly subsolar oxygen abundances (Hirsch 2009; Németh et al. 2012; Schindewolf et al. 2018). Fig. 3 shows the position of our two CO-sdOs in the Kiel diagram. They are within the region of He-sdOs (red symbols; Geier (2020); Jeffery et al. (2021); Luo et al. (2021)). This region is crossed by evolutionary tracks of remnants of a merger of two He-core white dwarfs. We show as two examples a 0.5 remnant (green graph) and a 0.8 remnant (light blue graph) from Zhang & Jeffery (2012). The He-sdOs and their CNO abundances are commonly discussed in terms of this merger scenario. However, the CO-sdOs must have another origin.
The merger of a He-core and a CO-core white dwarf was discussed in the literature since Webbink (1984). The He white dwarf is disrupted and accreted onto the CO white dwarf to form a helium giant. In a companion paper in this volume of MNRAS, Miller Bertolami et al. suggest that the CO-sdOs discovered by us are the result of such a merger but in this case the CO white dwarf was the less massive component being accreted onto the He white dwarf. This can happen only under very special conditions. First of all the first (stable) mass transfer episode has to begin close to the tip of the Red Giant Branch, producing a rather massive He-core white dwarf ( ). The second requirement is, that the initially less massive star has to increase its mass to during this first mass transfer event, forming the lowest possible mass sdBs and CO white dwarfs with masses . In Fig. 3 we present the track of a 0.8 remnant from this scenario. It settles onto the He main sequence performing He shell flashes before central He burning starts, causing the small loops. Later on it leaves the He main sequence to become a hot white dwarf.
The position of our two CO-sdO stars in the Kiel diagram indicates that they are currently in the He-core burning stage, where CO+He white dwarf merger products spend most of their pre-white dwarf life ( Myr). The pre-He-core burning phase lasts for only 0.5 Myr, yet stars in that stage are on average ten times more luminous. Thus, for one pre-He-core burning star 4–5 He-core burning CO-sdO stars can be expected.
After He-core burning, the CO+He-merger evolves through the region of the PG1159 stars (black symbols in Fig. 3). The abundance patterns of these latter stars (approximately He = 0.30–0.85, C = 0.15–0.60, O = 0.02–0.20) are indeed found to be very similar to that of the two CO-sdOs. Usually, PG1159 stars are thought to be post-AGB (pre-) white dwarfs whose H-deficient nature was caused by a very late thermal pulse (VLTP, Werner & Herwig (2006)). In Fig. 3 VLTP evolutionary tracks from Miller Bertolami & Althaus (2006) are shown as blue graphs and the PG1159 wind limit indicating that evolution across this line transforms PG1159 stars in DA or DO white dwarfs by gravitational settling of heavy elements (Unglaub & Bues 2000). However, while a VLTP object reaches its maximum within yr, the post-He-core burning and pre-white dwarf stage ( 7.0) of the CO+He merger lasts for 2.5 Myr. Considering that PG1159 stars in the pre-white dwarf stage are about one order of magnitude more luminous than the CO-sdOs, one could expect one luminous PG1159 star per CO-sdO in a flux limited star sample. One good candidate for this scenario is the recently discovered, low-luminosity PG1159 star RL104 (black error cross in Fig. 3, Werner et al. (2021)), whose position in the Kiel diagram is not consistent with VLTP tracks. We conclude that the CO+He white dwarf merger likely represents a non-negligible evolutionary channel creating PG1159 stars.
One may now speculate if the IR excess of PG1654322 is a relic from a circumstellar disk formed by the disrupted CO white dwarf during the merger event. Such a disk would be made mainly of metals, and it has been suggested that it could be the birthplace of second generation planets (Livio et al. 2005). Therefore, further investigations on the nature of the IR excess of PG1654322 are highly desirable.
Data availability
Observed and computed spectra are available upon request from the corresponding author.
Acknowledgements
We thank Marcelo Miller Bertolami for informing us about his results on merger evolution calculations explaining the existence of the CO-sdOs. MP was funded by the Deutsche Forschungsgemeinschaft under grants GE2506/9-1 and GE2506/12-1. The TMAD tool (http://astro.uni-tuebingen.de/~TMAD) used for this paper was constructed as part of the activities of the German Astrophysical Virtual Observatory. This research has made use of NASA’s Astrophysics Data System and the SIMBAD database, operated at CDS, Strasbourg, France. This research has made use of the VizieR catalogue access tool, CDS, Strasbourg, France. This work has made use of data from the European Space Agency (ESA) mission Gaia. LAMOST is operated and managed by the National Astronomical Observatories, Chinese Academy of Sciences. Based on observations obtained with the Samuel Oschin 48-inch Telescope at the Palomar Observatory as part of the Zwicky Transient Facility project, which is supported by the National Science Foundation under Grant No. AST-1440341 and the participating institutions of the ZTF collaboration. This paper used data obtained with the MODS spectrographs built with funding from NSF grant AST-9987045 and the NSF Telescope System Instrumentation Program (TSIP), with additional funds from the Ohio Board of Regents and the Ohio State University Office of Research. The LBT is an international collaboration among institutions in the United States, Italy and Germany. LBT Corporation partners are: The University of Arizona on behalf of the Arizona university system; Istituto Nazionale di Astrofisica, Italy; LBT Beteiligungsgesellschaft, Germany, representing the Max-Planck Society, the Astrophysical Institute Potsdam, and Heidelberg University; The Ohio State University, and The Research Corporation, on behalf of The University of Notre Dame, University of Minnesota and University of Virginia.
References
- Alam et al. (2015) Alam S. et al., 2015, ApJS, 219, 12
- Allard et al. (2012) Allard F., Homeier D., Freytag B., 2012, Philosophical Transactions of the Royal Society of London Series A, 370, 2765
- Bailer-Jones et al. (2021) Bailer-Jones C. A. L., Rybizki J., Fouesneau M., Demleitner M., Andrae R., 2021, AJ, 161, 147
- Battich et al. (2018) Battich T., Miller Bertolami M. M., Córsico A. H., Althaus L. G., 2018, A&A, 614, A136
- Bellm et al. (2019) Bellm E. C. et al., 2019, PASP, 131, 018002
- Bergeron et al. (1993) Bergeron P., Wesemael F., Lamontagne R., Chayer P., 1993, ApJ, 407, L85
- Bianchi et al. (2017) Bianchi L., Shiao B., Thilker D., 2017, ApJS, 230, 24
- Chambers et al. (2016) Chambers K. C. et al., 2016, arXiv e-prints, arXiv:1612.05560
- Cutri et al. (2003) Cutri R. M. et al., 2003, VizieR Online Data Catalog, 2246, 0
- Dorsch et al. (2021) Dorsch M., Jeffery C. S., Irrgang A., Woolf V., Heber U., 2021, A&A, 653, A120
- Dorsch et al. (2019) Dorsch M., Latour M., Heber U., 2019, A&A, 630, A130
- Fitzpatrick (1999) Fitzpatrick E. L., 1999, PASP, 111, 63
- Gaia Collaboration et al. (2020) Gaia Collaboration , Brown A. G. A., Vallenari A., Prusti T., de Bruijne J. H. J., Babusiaux C., Biermann M., 2020, arXiv e-prints, arXiv:2012.01533
- Geier (2020) Geier S., 2020, A&A, 635, A193
- Green et al. (1986) Green R. F., Schmidt M., Liebert J., 1986, ApJS, 61, 305
- Heber (2016) Heber U., 2016, PASP, 128, 082001
- Henden et al. (2015) Henden A. A., Levine S., Terrell D., Welch D. L., 2015, in American Astronomical Society Meeting Abstracts, Vol. 225, American Astronomical Society Meeting Abstracts #225, p. 336.16
- Hirsch (2009) Hirsch H. A., 2009, Ph.D. thesis, Friedrich-Alexander University Erlangen-Nürnberg
- Jeffery et al. (2021) Jeffery C. S., Miszalski B., Snowdon E., 2021, MNRAS, 501, 623
- Jones et al. (2020) Jones D. et al., 2020, A&A, 642, A108
- Lawrence et al. (2007) Lawrence A. et al., 2007, MNRAS, 379, 1599
- Lei et al. (2019) Lei Z., Zhao J., Németh P., Zhao G., 2019, ApJ, 881, 135
- Livio et al. (2005) Livio M., Pringle J. E., Wood K., 2005, ApJ, 632, L37
- Luo et al. (2019) Luo Y., Németh P., Deng L., Han Z., 2019, ApJ, 881, 7
- Luo et al. (2021) Luo Y., Németh P., Wang K., Wang X., Han Z., 2021, ApJS, 256, 28
- Masci et al. (2019) Masci F. J. et al., 2019, PASP, 131, 018003
- Miller Bertolami & Althaus (2006) Miller Bertolami M. M., Althaus L. G., 2006, A&A, 454, 845
- Mol Lous & Miguel (2020) Mol Lous M., Miguel Y., 2020, MNRAS, 495, 2994
- Németh et al. (2012) Németh P., Kawka A., Vennes S., 2012, MNRAS, 427, 2180
- Schindewolf et al. (2018) Schindewolf M., Németh P., Heber U., Battich T., Miller Bertolami M. M., Irrgang A., Latour M., 2018, A&A, 620, A36
- Schlafly & Finkbeiner (2011) Schlafly E. F., Finkbeiner D. P., 2011, ApJ, 737, 103
- Schlafly et al. (2019) Schlafly E. F., Meisner A. M., Green G. M., 2019, ApJS, 240, 30
- Unglaub & Bues (2000) Unglaub K., Bues I., 2000, A&A, 359, 1042
- Webbink (1984) Webbink R. F., 1984, ApJ, 277, 355
- Werner (1996) Werner K., 1996, ApJ, 457, L39
- Werner et al. (2003) Werner K., Deetjen J. L., Dreizler S., Nagel T., Rauch T., Schuh S. L., 2003, in Astronomical Society of the Pacific Conference Series, Vol. 288, Hubeny I., Mihalas D., Werner K., ed, Stellar Atmosphere Modeling, p. 31
- Werner & Dreizler (1999) Werner K., Dreizler S., 1999, Journal of Computational and Applied Mathematics, 109, 65
- Werner et al. (2012) Werner K., Dreizler S., Rauch T., 2012, TMAP: Tübingen NLTE Model-Atmosphere Package, Astrophysics Source Code Library [record ascl:1212.015]
- Werner & Herwig (2006) Werner K., Herwig F., 2006, PASP, 118, 183
- Werner & Rauch (2014) Werner K., Rauch T., 2014, A&A, 569, A99
- Werner et al. (2021) Werner K., Reindl N., Dorsch M., Geier S., Munari U., Raddi R., 2021, arXiv e-prints, arXiv:2111.13549
- Zhang & Jeffery (2012) Zhang X., Jeffery C. S., 2012, MNRAS, 419, 452