SCAT Uncovers ATLAS’s First Tidal Disruption Event ATLAS18mlw: A Faint and Fast TDE in a Quiescent Balmer Strong Galaxy
Abstract
We present the discovery that ATLAS18mlw was a tidal disruption event (TDE) in the galaxy WISEA J073544.83+663717.3, at a distance of 334 Mpc. Initially discovered by the Asteroid Terrestrial Impact Last Alert System (ATLAS) on 2018 March 17.3, the TDE nature of the transient was uncovered only recently with the re-reduction of a SuperNova Integral Field Spectrograph (SNIFS) spectrum. This spectrum, taken by the Spectral Classification of Astronomical Transients (SCAT) survey, shows a strong blue continuum and a broad H emission line. Here we present roughly six years of optical survey photometry beginning before the TDE to constrain AGN activity, optical spectroscopy of the transient, and a detailed study of the host galaxy properties through analysis of archival photometry and a host spectrum. ATLAS18mlw was detected in ground-based light curves for roughly two months. From a blackbody fit to the transient spectrum and bolometric correction of the optical light curve, we conclude that ATLAS18mlw is likely a low-luminosity TDE with a peak luminosity of log(L [erg s-1]) = . The TDE classification is further supported by the quiescent Balmer strong nature of the host galaxy. We also calculated the TDE decline rate from the bolometric light curve and find dex, making ATLAS18mlw a member of the growing class of “faint and fast” TDEs with low peak luminosities and fast decline rates.
1 Introduction
When a star passes within the tidal radius of a supermassive black hole (SMBH), the self-gravity of the star is overwhelmed by tidal forces and the star is disrupted, resulting in a tidal disruption event (TDE; Rees, 1988; Evans & Kochanek, 1989; Phinney, 1989). A TDE results in a luminous flare as the disrupted stellar material falls back onto the SMBH (e.g., Ulmer, 1999). To date, of these flares have been observed (Gezari, 2021), with a majority discovered in the optical. This is in large part due to the recent expansion of transient surveys such as the All-Sky Automated Survey for Supernovae (ASAS-SN; Shappee et al., 2014; Kochanek et al., 2017), the Asteroid Terrestrial Impact Last Alert System (ATLAS; Tonry et al., 2018), Gaia Alerts (Wyrzykowski et al., 2012), the Panoramic Survey Telescope and Rapid Response System (Pan-STARRS; Chambers et al., 2016), and the Zwicky Transient Facility (ZTF; Bellm et al., 2019).
However, it is not only optical sky surveys that play an important role in discovering TDEs. Spectroscopic classification surveys are crucial in obtaining rapid spectra to not only classify transients but to also identify interesting sources. Alongside the expansion of transient surveys has been the growth of such spectroscopic surveys. In the past two years, roughly three-quarters of all spectroscopically-confirmed transients have been classified by the Zwicky Transient Facility classification efforts (e.g., Fremling et al., 2020, 2021), the Public ESO Spectroscopic Survey for Transient Objects (PESSTO; Smartt et al., 2015) and successors (e.g., Barbarino et al., 2019), and the Spectral Classification of Astronomical Transients (SCAT) survey (Tucker et al., in prep.), in that order.
Spectroscopic classification of TDEs has become easier as our understanding of the typical observed emission from TDEs becomes more complete. The emission of TDEs is hot, typically exhibiting a blue optical continuum, with a UV excess. The UV/optical spectral energy distribution (SED) of TDEs is often well-fit by a blackbody with a temperature on the order of T K (e.g., Holoien et al., 2014a, 2016; Blagorodnova et al., 2017; Hinkle et al., 2021a). Roughly half of optically-selected TDEs show X-ray emission, commonly in the form of a blackbody with kT eV, or a soft power-law with a photon index of (Brown et al., 2017; Auchettl et al., 2017, 2018). The characteristic lifetime of a TDE in the optical bands is on the order of a few months (e.g., Hinkle et al., 2020; van Velzen et al., 2020) although UV emission can exist above host galaxy levels for several years after disruption (e.g., van Velzen et al., 2019).
TDEs represent an excellent opportunity to study otherwise non-active SMBHs. For example, TDE emission is likely sensitive to black hole spin and mass (e.g. Ulmer, 1999; Graham et al., 2001; Mockler et al., 2019; Gafton & Rosswog, 2019). It has been shown that the SMBH masses obtained through fits to TDE light curves are consistent with those derived through other means (Mockler et al., 2019). This is particularly important, as the large majority of SMBHs are not active (%; Ho, 2008; Lacerda et al., 2020).
Unfortunately, TDEs are rare, with observational rates estimated to be between and per galaxy (e.g. van Velzen & Farrar, 2014; Holoien et al., 2016; van Velzen, 2018; Auchettl et al., 2018). Interestingly, TDEs seem to prefer particular host galaxies where a recent burst of star formation has occurred (e.g., Stone & van Velzen, 2016; French et al., 2016) and moderately massive stars may be preferred (Mockler et al., 2022). These include quiescent Balmer strong (QBS) and post-starburst (PSB) galaxies, both likely post-merger systems (French, 2021). TDEs occur at rates enhanced by factors of roughly 20 and 40 times the typical values for QBS and PSB galaxies respectively (e.g. Arcavi et al., 2014; French et al., 2016; Law-Smith et al., 2017; Graur et al., 2018; French et al., 2020b).
Due in part to the preference for TDEs to occur in unique galaxies and their slightly increased rates around lower mass SMBHs (Wang & Merritt, 2004; Stone & Metzger, 2016; van Velzen, 2018), the host galaxies of TDEs have received special attention (Law-Smith et al., 2017; French et al., 2020a, b). To fulfill the promise of TDEs as probes of SMBHs, studies of the history of accretion, mergers, and star-formation in the TDE host galaxies are needed (e.g., Prieto et al., 2016).
Here we present the observations of the first TDE discovered by ATLAS, ATLAS18mlw. The paper is organized in the following manner. In Section 2 we detail observations of the TDE candidate and host galaxy. In Section 3 we discuss the properties of the host galaxy of ATLAS18mlw. In Section 4 we analyze the data on this source, and in Section 5 we discuss our results. Throughout this paper, we have used a cosmology with = 69.6 km s-1 Mpc-1, , and (Wright, 2006; Bennett et al., 2014).
2 Data
2.1 Archival Photometry
We obtained archival photometry of the host galaxy WISEA J073544.83+663717.3 including magnitudes from the Sloan Digital Sky Survey (SDSS) Data Release 15 (Aguado et al., 2019) and and magnitudes from the Wide-field Infrared Survey Explorer (WISE; Wright et al., 2010) AllWISE catalog. While the host galaxy was not listed in any Galaxy Evolution Explorer (GALEX; Martin et al., 2005) catalog, we measured a 60 radius aperture and limit and magnitude from GALEX images using gPhoton (Million et al., 2016). These ultraviolet, optical, and infrared host-galaxy magnitudes and estimated uncertainties are presented in Table 1.
| Filter | Magnitude | Magnitude Uncertainty |
|---|---|---|
| 23.56 | 3 | |
| 23.66 | 0.34 | |
| 21.76 | 0.23 | |
| 20.08 | 0.03 | |
| 19.34 | 0.02 | |
| 18.96 | 0.02 | |
| 18.79 | 0.06 | |
| 19.04 | 0.06 | |
| 19.46 | 0.16 |
Archival magnitudes of the host galaxy WISEA J073544.83+663717.3. The and magnitudes were measured from GALEX images, the magnitudes are taken from the SDSS catalog and the and magnitudes are taken from the AllWISE catalog. All magnitudes are presented in the AB system.
2.2 Transient Imaging
The transient ATLAS18mlw, (07:35:44.777, 66:37:16.43), was discovered on 2018 March 17.3 by the ATLAS survey. The discovery was announced publicly on the Transient Name Server (TNS) and given the name AT2018ahl111https://www.wis-tns.org/object/2018ahl. However, rather than obscure the discovering survey, we will refer to the transient by its survey name ATLAS18mlw throughout the remainder of this manuscript.
Soon after the ATLAS discovery, we obtained a -band acquisition image with the Supernova Integral Field Spectrograph (SNIFS; Lantz et al., 2004) on the University of Hawai‘i 88-in telescope (UH88). From this, we are able to compare the location of the transient to the location of the host galaxy to determine if the source is spatially consistent with the nucleus. We first used astrometry.net (Barron et al., 2008; Lang et al., 2010) to compute astrometry for both the SNIFS acquistion image and a Pan-STARRS -band image (Chambers et al., 2016). We then measured the centroid of the host galaxy from the Pan-STARRS image and the centroid of the TDE in the SNIFS image with the IRAF task imcentroid. We find a transient position of 07:35:44.79366:37:16.53 and a host galaxy position of 07:35:44.76966:37:16.34. Combined, these give an offset of 0405, where the uncertainty is dominated by the uncertainties in the astrometric solutions for the SNIFS and Pan-STARRS images. At the host distance, this offset corresponds to a physical distance of pc, consistent with ATLAS18mlw being a nuclear transient.
We then obtained the ATLAS light curves of ATLAS18mlw from the ATLAS forced point-spread function (PSF) photometry service. ATLAS uses two 0.5-m telescopes located on Haleakalā and at the Mauna Loa Observatory. During typical operation, the ATLAS telescopes obtain four 30 s exposures covering roughly a quarter of the sky per night (Smith et al., 2020). ATLAS obtains images in two broad-band filters, the ‘cyan’ () filter between 420–650 nm and the ‘orange’ () filter from 560–820 nm (Tonry et al., 2018). We combine intra-night epochs using a weighted mean to obtain deeper limits and more robust detections.
In addition to ATLAS photometry, we obtained ZTF photometry in the - and -bands from their forced PSF photometry service. The ZTF survey makes use of the Samuel Oschin 48-in telescope at the Palomar Observatory. In normal operation, ZTF images down to a depth of 20.5 -band mag in a 30 s exposure (Bellm et al., 2019). Similar to the ATLAS data, we combined the intra-night photometric observations using a weighted average to get a single flux measurement.
We also obtained a light curve of the host galaxy from the Transiting Exoplanet Survey Satellite (TESS; Ricker et al., 2015). TESS observed the location of ATLAS18mlw during Sector 20, at a phase of approximately 650 days after discovery. The TESS full frame images (FFIs) were reduced using the ISIS package (Alard & Lupton, 1998; Alard, 2000). We performed image subtraction following the procedures of (Vallely et al., 2019, 2021) to compute our differential light curves. The reference image was constructed from the first 100 FFIs of good quality. The measured count rates were converted into fluxes using the instrumental zero point of 20.44 electrons per second (Vanderspek et al., 2018). To quantify the host variability, we binned the TESS data in 12 hour bins and computed the root mean squared scatter, finding a value of 8.1 Jy, which indicates no significant host-galaxy variability in quiescence.
Finally, we obtained ASAS-SN photometry in the - and -bands from the newly-public subtracted light curve server222https://asas-sn.osu.edu/ (Kochanek et al., 2017). Over the full baseline of the ASAS-SN survey, the host galaxy of ATLAS18mlw was imaged 285 times in and 349 in with no images showing significant detections. The median 5 upper limits are 17.6 and 18.0 mag for the - and -bands respectively.
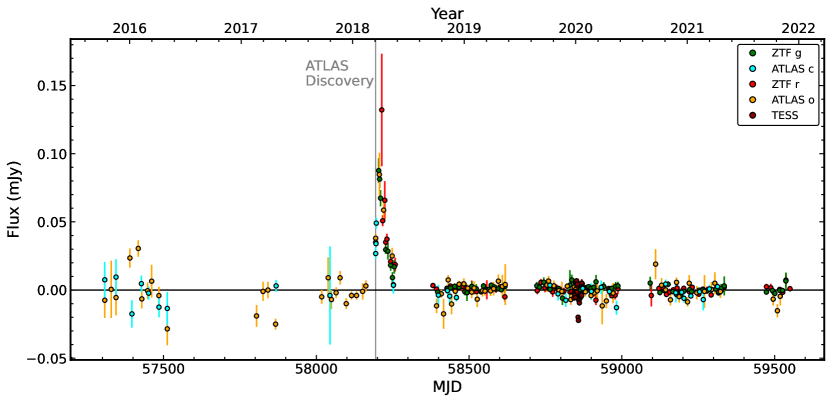
Figure 1 shows the ATLAS, ZTF, and TESS data for ATLAS18mlw both during the flare and in periods of quiescence. Here the ATLAS and ZTF data have been stacked in 10 day bins and the TESS data has been stacked in 1 day bins. Besides the ATLAS18mlw flare itself, it is apparent that no other large flare exists in the roughly six years of coverage. This suggests that the host galaxy did not exhibit AGN-like activity prior to the detection of ATLAS18mlw.
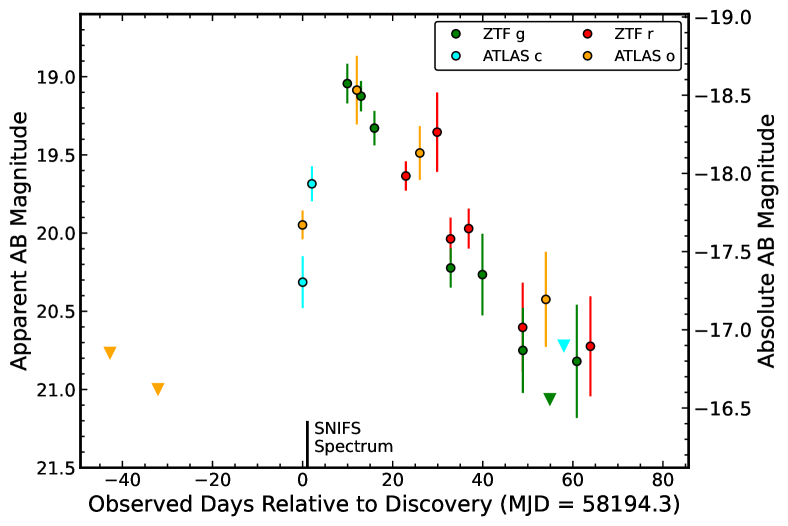
The subset of the light curve during the ATLAS18mlw flare is shown in Figure 2, showing that ATLAS18mlw rose to peak within days after discovery, although there are no non-detections near the discovery epoch to help constrain the time of first light further. After peak, the transient fades by two mags within sixty days and is not detected afterwards. This is faster than most TDEs, although there is no simultaneous UV coverage to test the longevity of the UV excess commonly seen in TDEs (e.g., Holoien et al., 2016; van Velzen et al., 2020; Gezari, 2021).
2.3 Spectroscopy
A classification spectrum was obtained 1.05 days after discovery by the SCAT survey (Tucker et al., 2018) using SNIFS on UH88. SNIFS is comprised of a blue (B; 320 – 560 nm) and red (R; 520 nm – 1000 nm) channel. The original classification spectrum was reduced with a summit-based quick-look pipeline which is a simplified version of the full SNfactory pipeline (Aldering et al., 2006). The quick-look pipeline estimates the extraction location by averaging over the wavelength axis in each channel and then does aperture photometry.
The quick-look pipeline is reliable when the wavelength dependence of the trace position is less than the seeing. This is true for targets observed near zenith, but atmospheric dispersion shifts the object’s location on the chip as the airmass increases. ATLAS18mlw was observed at an airmass of which introduced a wavelength-dependence to the relative contributions from the TDE and the host-galaxy to the final spectrum, masking the transient’s signal and hindering classification.
The development of an upgraded reduction pipeline at the University of Hawai‘i in June 2021 incorporates wavelength-dependent tracing across each channel. Reanalysis of the classification spectrum revealed a strong blue continuum with narrow host lines and a broad H line at a redshift of z = 0.073. These spectral features, along with the peak absolute magnitude of mag, are consistent with a tidal disruption event (e.g., van Velzen et al., 2020). A full description of the updated reduction pipeline will be presented in a forthcoming publication (Tucker et al., in prep.).
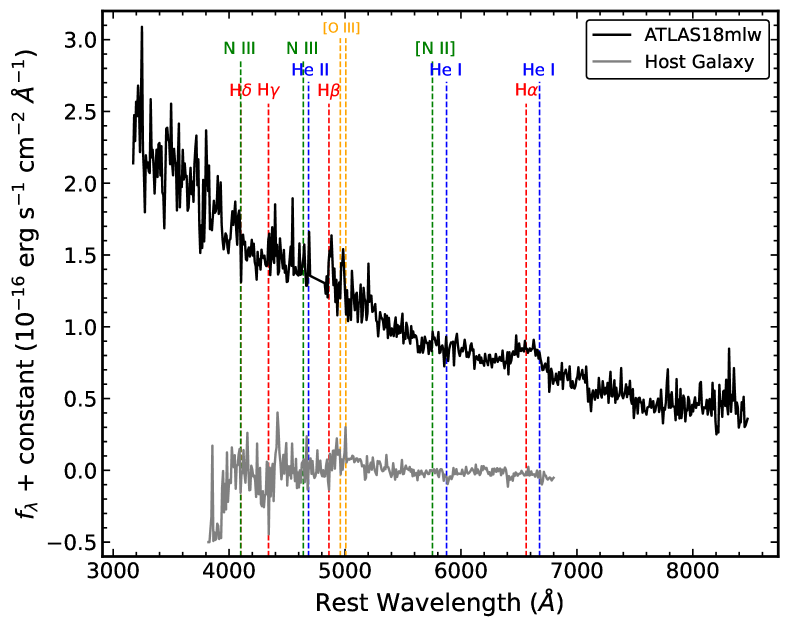
After concluding that ATLAS18mlw was likely a TDE, we obtained a spectrum of the host galaxy WISEA J073544.83+663717.3 with the Gemini Multi-Object Spectrograph (GMOS; Hook et al., 2004) on the 8.1-m Gemini North telescope. This spectrum was taken with the B600 grating and dithered both along the spatial and spectral directions to mitigate the presence of chip gaps and avoid the influence of bad pixels. The spectra were reduced using normal methods such as bias, flat-fielding, and wavelength calibration using arc lamps. The individual dithered spectra were median combined to minimize the effect of cosmic ray hits. Figure 3 shows the SNIFS and GMOS spectra with common TDE emission lines marked. With this deeper and higher resolution GMOS spectrum we fit for the redshift using the methods of Hayden et al. (2021). Using the weighted average of six binning choices from 5 to 20 Å we find a redshift of for the GMOS spectrum, which we will adopt for the remainder of our analysis.
3 Host-Galaxy Properties
To better understand the host galaxy, we fit stellar population synthesis models to the archival photometry of WISEA J073544.83+663717.3 (shown in Table 1), excluding the limit. We made use of the Fitting and Assessment of Synthetic Templates (Fast; Kriek et al., 2009) code to obtain an SED for the host galaxy. In this fit we assumed a Cardelli et al. (1988) extinction law with and a foreground Galactic extinction of mag (Schlafly & Finkbeiner, 2011), a Salpeter IMF (Salpeter, 1955), an exponentially declining star-formation rate, and the Bruzual & Charlot (2003) stellar population models. From our Fast fit, we find that WISEA J073544.83+663717.3 has a stellar mass of M M⊙, an age of Gyr, and a star formation rate of SFR M⊙ yr-1.
From the scaling relationship between stellar mass and SMBH mass (McConnell & Ma, 2013; Mendel et al., 2014), we estimate a central black hole mass of M⊙, where these scaling relations have a typical scatter of dex. This mass is close to the median BH mass on which TDEs occur (; Wevers et al., 2017; Ryu et al., 2020) and is also consistent with the range of SMBH masses for which TDEs occur most efficiently (; van Velzen, 2018).
The GMOS spectrum provides additional insight into the host-galaxy properties. Using the common scaling between SFR and H luminosity from Osterbrock & Ferland (2006), we obtain a SFR of M⊙ yr-1, which is smaller than, but consistent with, the value obtained from the SED fits.
In addition to the bulk host galaxy properties, we can constrain the presence of AGN activity from the spectrum. We used the Penalized Pixel-Fitting code (pPXF; Cappellari & Emsellem, 2004; Cappellari, 2017) to simultaneously fit a stellar and gas component to the host galaxy spectrum, which allows for more robust measurements of emission line fluxes. From pPXF we measure an [O III] 5007 emission line luminosity of erg s-1. This is well below the median AGN [O III] line luminosity indicating that the host galaxy does not harbor a strong AGN, but not ruling out the presence of low-luminosity AGN (e.g., Zakamska et al., 2003; Bongiorno et al., 2010).
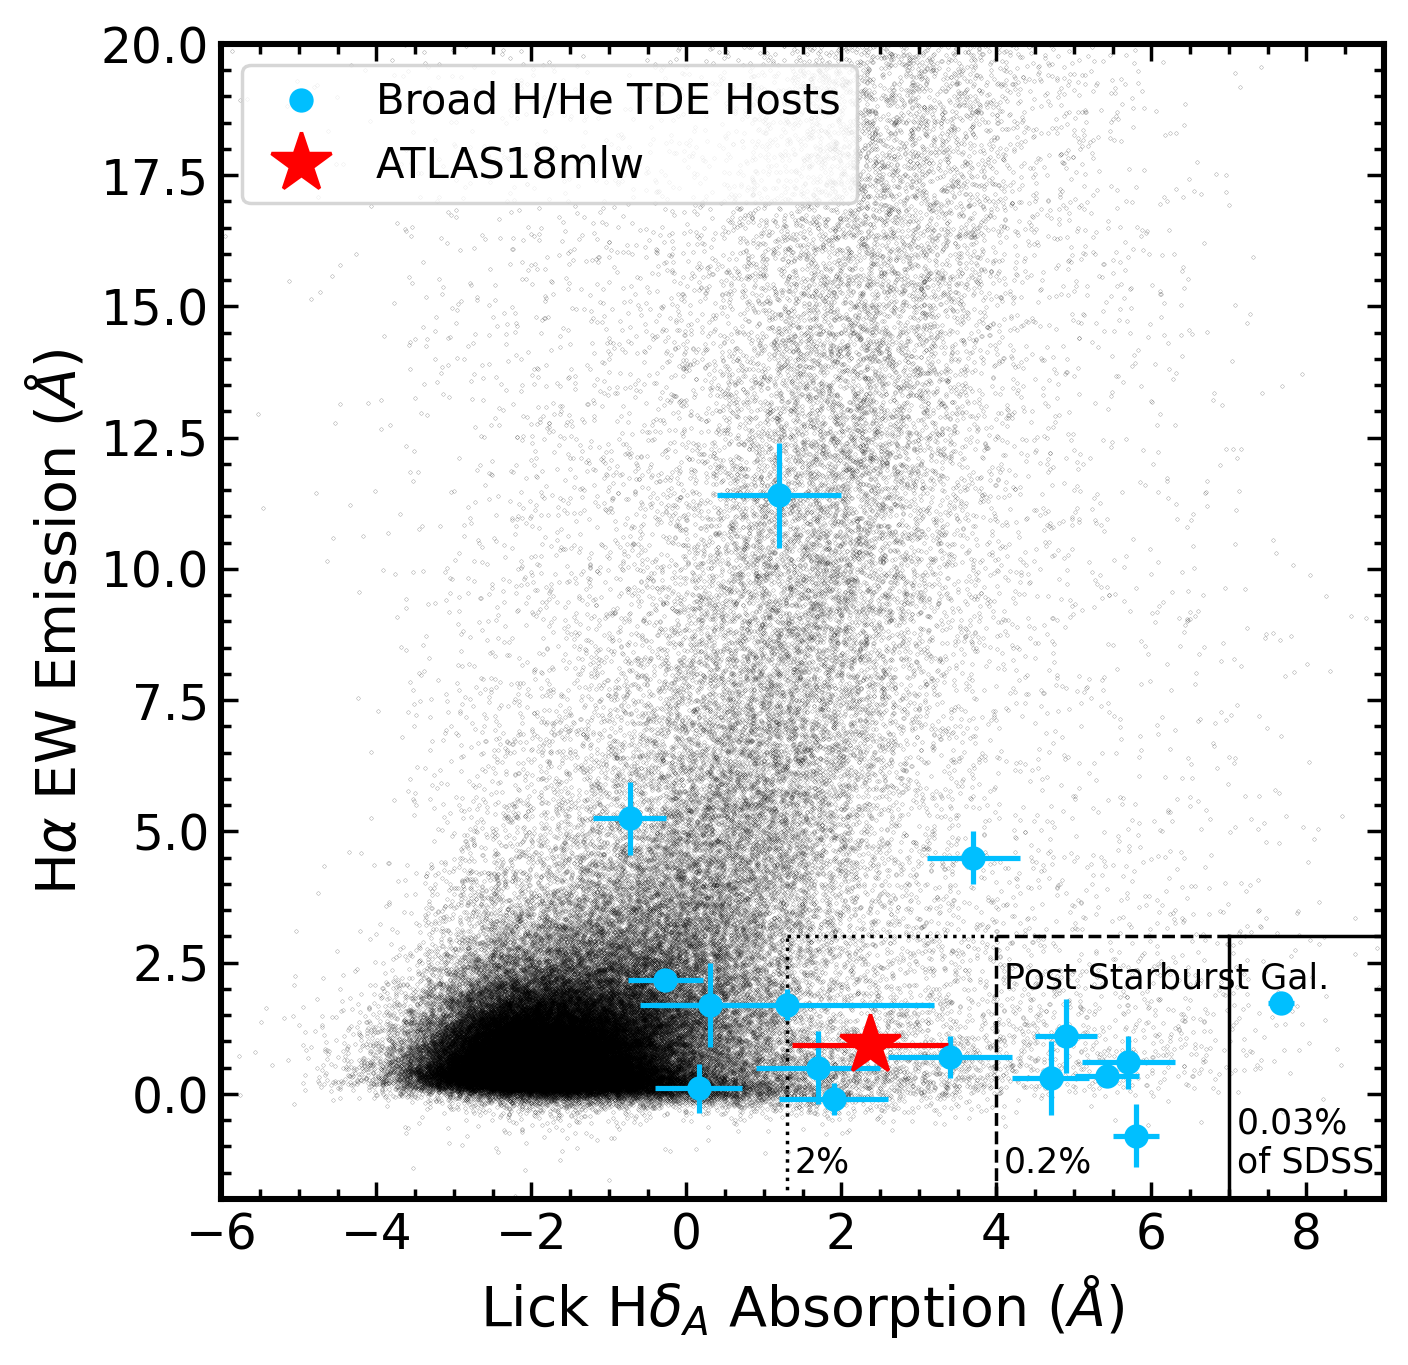
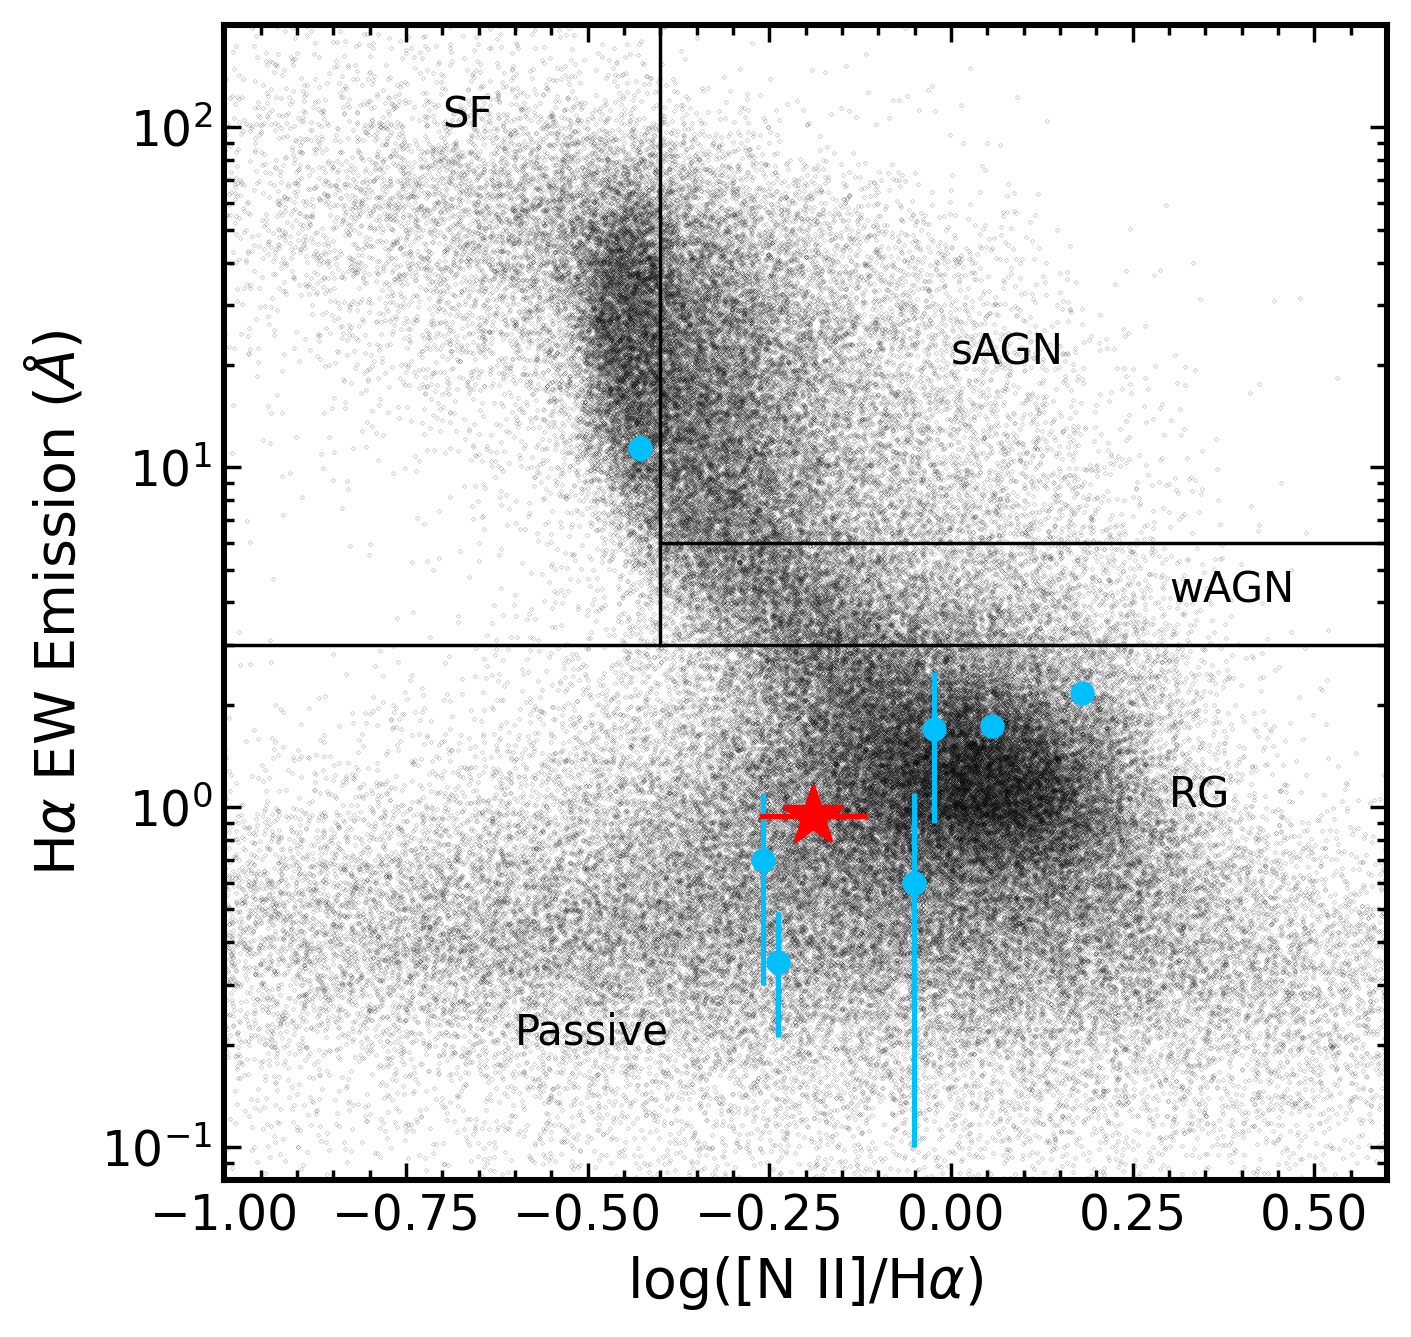
In addition to straightforward line-luminosity measurements, we make use of well-accepted emission-line diagnostic diagrams to understand the host galaxy properties and activity levels. Again using pPXF, we estimated emission line fluxes and uncertainties from the GMOS spectrum. In the upper left panel of Figure 4 we show the H emission equivalent width (EW) as compared to the Lick H absorption index. The H EW traces current star formation whereas the Lick H index traces star formation within the past Gyr. This diagram is commonly used to select post-merger and post-starburst systems based on their low current star formation rate but high recent star formation (e.g., French et al., 2018). The host galaxy of ATLAS18mlw has Lick H Å, as measured by PyPHOT333https://mfouesneau.github.io/docs/pyphot/#, consistent with a quiescent Balmer strong galaxy, similar to many other TDE host galaxies.
In the upper right panel of Figure 4 we show the H emission EW (WHα), as compared to log10([N II] / H), also known as the WHAN diagram (Cid Fernandes et al., 2011). This diagram separates actively star forming and active galaxies from passive galaxies using the H emission EW. The galaxies with high WHα are further separated by log10([N II] / H) into pure star-forming galaxies and active galaxies. The host galaxy of ATLAS18mlw resides in between the retired and passive galaxies regimes, suggesting that the host does not harbor a strong AGN. Again, the host galaxy is similar in terms of its location in the WHAN diagram to other TDE hosts.
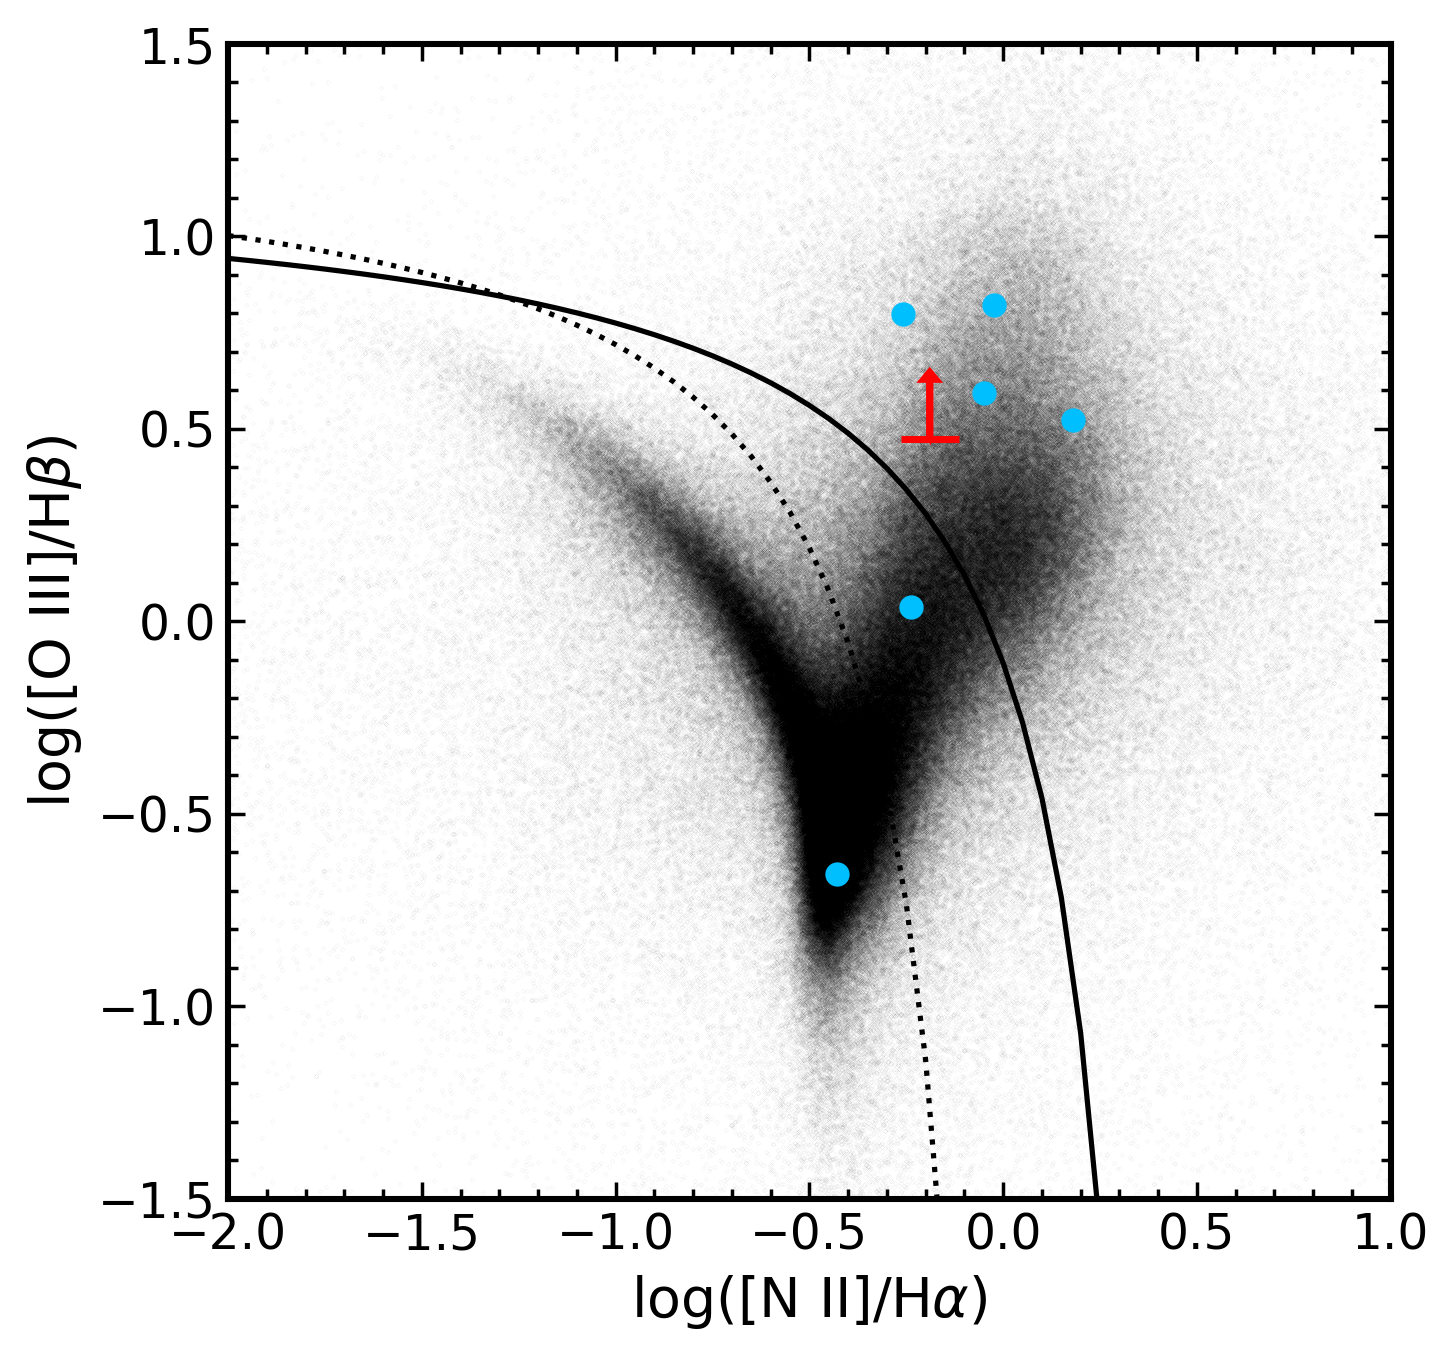
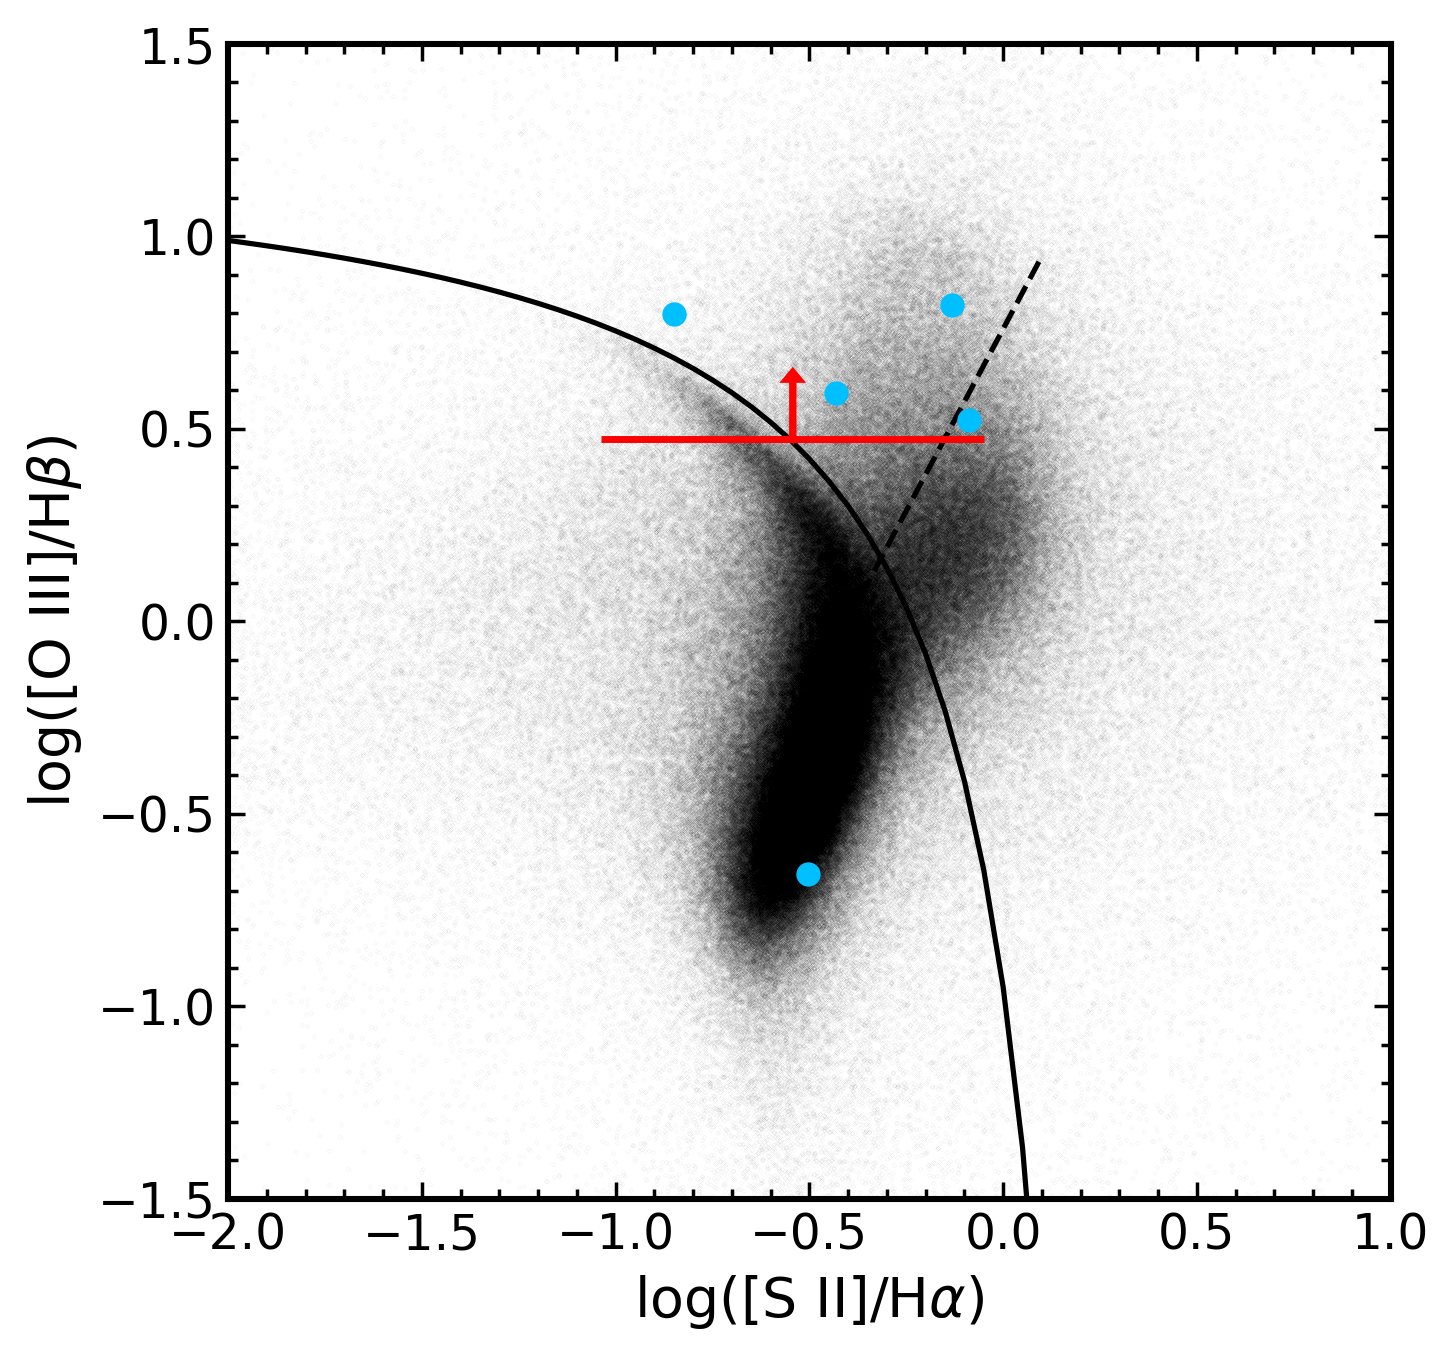
In the bottom two panels of Figure 4 we show the traditional log10([N II] / H) and log10([S II] / H) emission line ratio diagrams (Baldwin et al., 1981; Veilleux & Osterbrock, 1987). H emission was not detected in the host galaxy spectrum, and we therefore use 3 upper limits. In both diagrams, the lower limit on log10([O III] / H) lies in the AGN/Seyfert region, but similar to other TDE hosts (Graur et al., 2018). Addition, the large uncertainty on [S II] flux leads to ambiguity on the classification of the source between a star-forming galaxy, a Seyfert, and a LINER (low-ionization nuclear emission-line region; Heckman, 1980). Finally, if we assume a typical Balmer decrement of 2.86 (Osterbrock, 1989) to estimate the H flux from the observed H flux, we obtain a line ratio of log10([O III] / H) .
Finally, we measured an X-ray flux at the position of the host galaxy using archival ROSAT (ROentgen SATellite; Voges et al., 1999) images. We find a 3 upper limit of counts s-1 in the keV bandpass. Assuming an AGN-like photon index of 1.75 (Ricci et al., 2017) and the Galactic column density along the line of sight of cm-2 (HI4PI Collaboration et al., 2016), we find a keV limit of erg s-1 cm-2, which corresponds to a luminosity of erg s-1. This is fully consistent with a normal AGN, and cannot solely rule out the presence of a strong AGN. Unfortunately, besides ROSAT, there is little X-ray coverage of this host galaxy to further constrain the prescence of an AGN. Nevertheless, combining emission line diagnostics and the X-ray upper limit suggest that WISEA J073544.83+663717.3 is unlikely to host a strong AGN.
4 Analysis
While there is relatively little data during the transient event, we can nonetheless place constraints on the transient evolution and understand it in the context of other TDEs. Fitting the H emission as a single Gaussian, we find a flux of erg cm-2 s-1 corresponding to a line luminosity of erg s-1. The equivalent width of the line relative to the nearby continuum is Å, indicating a very strong emission line. The width of the spectral line is km s-1, all similar to known TDEs (e.g., van Velzen et al., 2020; Gezari, 2021). Finally, because of the location of the SNIFS dichroic crossover region at the redshift of ATLAS18mlw, it is not possibly to cleanly detect and measure the properties of the tentative H emission line.
A common analysis of optically-selected TDEs is blackbody fits to their UV/optical SEDs to obtain effective temperatures and bolometric luminosities. Unfortunately we do not have any UV photometry during the flare to probe the high-energy emission from this event directly. It is known that TDEs without UV photometry near their peaks can have sizable uncertainties on their SED properties (e.g., Hinkle et al., 2020).
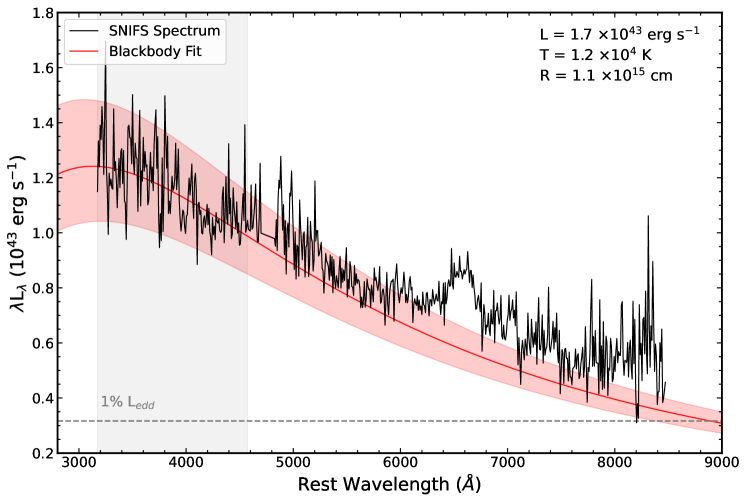
We can nonetheless make a rough estimate of these properties by fitting the optical spectrum as a blackbody. To do this, we first corrected the SNIFS spectrum for Galactic extinction. The GMOS host-galaxy spectrum does not cover a wide enough range in wavelength to host-subtract the SNIFS transient spectrum. Nevertheless, we fit the spectrum below Å where the host galaxy is faint and a large majority of the flux is from the transient. Additionally, fitting below 4900 Å allowed us to avoid the affects of the crossover region, where the SNIFS quick-look flux calibration is often poor and artifacts can be present.
We fit the TDE spectrum with a Markov Chain Monte Carlo (MCMC) approach with flat temperature priors of 1000 K T 55000 K. We assumed a blackbody model for our fit and obtained the bolometric luminosity, radius, and effective temperature. The per degree of freedom for this fit is 1.0, indicating a good fit to the blue portion of the spectrum. The spectrum and corresponding blackbody fit are shown in Figure 5. The fitted luminosity of L erg s-1, radius of R cm, and temperature of T K are also shown on the figure. These uncertainties are very likely underestimated as they only represent the statistical uncertainty on the fact and ignore the systematic affects associated with fitting only optical data for hot sources. As expected from the lack of host subtraction, the spectrum deviates from the blackbody fit at redder wavelengths.
Using the blackbody parameters computed above, we can better understand the light curve of ATLAS18mlw in the context of other TDEs. Similar to previous TDEs (Holoien et al., 2020; Hinkle et al., 2020, 2021a), we bolometrically corrected the optical light curves shown in Fig. 2 using the fitted luminosity at the time of the SNIFS spectrum. This allows us to compute an approximate bolometric luminosity evolution for the TDE. This assumes a relatively flat temperature evolution, which is often acceptable for a TDE (Hinkle et al., 2021b; van Velzen et al., 2021; Gezari, 2021).
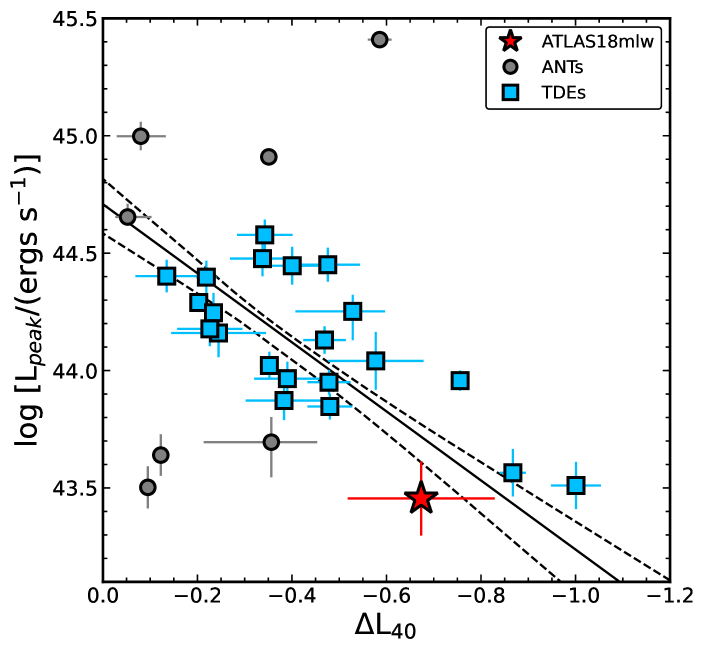
Following the procedure outlined in Hinkle et al. (2020), we computed the peak luminosity and decline rate measured at 40 days for ATLAS18mlw. Given the small number of epochs near peak light, we used a Monte Carlo approach to estimate the peak luminosity, fitting the data near peak 5000 times, each time with the luminosities perturbed by their uncertainties assuming Gaussian errors. This yielded a peak luminosity of log(L [erg s-1]) = . To ensure a robust uncertainty estimate given the lack of UV data, this error represents the 90% confidence interval of the luminosities computed from our Monte Carlo estimation. Estimating a time of peak light with the same procedure yields MJD, consistent with the approximate optical peak seen in Fig. 2. Given the SMBH mass estimated from the host galaxy SED fitting, this represents an Eddington ratio of %, similar to other TDEs (e.g., Wevers et al., 2017). We next computed the decline rate and found . The peak luminosity and decline rate of ATLAS18mlw, along with well-studied TDEs and ambiguous nuclear transients (ANTs) are shown in Figure 6, with ATLAS18mlw broadly following the trend seen for TDEs (e.g., Hinkle et al., 2020, 2021a).
5 Discussion
The observational data of ATLAS18mlw appears similar to many other TDEs, with no significant archival host variability, a likely post-merger host galaxy, a strong blue continuum with broad emission lines near peak, and a timescale of a few months in the optical. While we do not have direct measurements of the UV flux, the presence of strong H emission indicates that there must be significant far UV flux in the neighborhood of the transient, typical of TDEs (e.g., Roth & Kasen, 2018) and Seyfert galaxies (e.g., Antonucci, 1993). In fact, the line width and luminosity of the H line seen for ATLAS18mlw is similar to other TDEs near peak like iPTF16fnl (Blagorodnova et al., 2017), iPTF16axa (Hung et al., 2017), PS18kh (Holoien et al., 2019), and ASASSN-19dj (Hinkle et al., 2021b). Additionally, the appearance of the broad H line at an approximate phase of nine days before peak is among the earliest detected. Many TDEs show an increase in line luminosity near or shortly after peak light before declining (Charalampopoulos et al., 2021), although here we only have a single spectrum with which to constrain the line emission.
Transients associated with AGN accretion rate changes also commonly exhibit broad H emission (e.g., Gezari et al., 2017; Neustadt et al., 2020; Frederick et al., 2020). As such, we must consider the possibility that ATLAS18mlw is a smooth AGN flare. Firstly, the short overall timescale of ATLAS18mlw is less than the roughly year-long timescales of AGN-related flares (Hinkle et al., 2021a). Additionally, the spectrum of ATLAS18mlw is well-fit as blackbody, consistent with TDEs (e.g., Holoien et al., 2014a, 2016), whereas most AGN are better fit by power-laws (e.g., Vanden Berk et al., 2001; Neustadt et al., 2020). Finally, the lack of significant optical variability and weak H emission from the host galaxy are inconsistent with the presence of an AGN.
Using the optical spectroscopic classification scheme of Leloudas et al. (2019) and van Velzen et al. (2021), this TDE would likely be a TDE-H due to the dominance of H over any other spectral feature. TDE-H objects tend to have broader lines than TDE-Bowen objects (Charalampopoulos et al., 2021), consistent with the H line width computed for ATLAS18mlw. There does appear to be a He II line, but it is narrow and seen in the host galaxy spectrum. However, some TDEs, like ASASSN-15oi (Holoien et al., 2018) and ASASSN-19dj (Hinkle et al., 2021b) show signs for changes in spectral features and the properties of observed emission lines, which we cannot probe for ATLAS18mlw with our single spectrum.
The temperature derived from our blackbody fit, log(T[K]) = , is towards the low end of temperatures for the TDE-H subclass (van Velzen et al., 2021). However, the lack of UV photometry makes the systematic errors on our temperature significantly higher than the statistical errors from the blackbody fit alone. Nonetheless, both the TDE-He and TDE-Bowen classes have much higher median temperatures, in support of this object belonging to the TDE-H class. Additionally, the estimated blackbody radius of log(R [cm]) = is fully consistent with the radii of the TDE-H objects. van Velzen et al. (2021) find that the separation between TDE-H and TDE-Bowen is strongest for the blackbody radius, again supporting a TDE-H nature. Still, if our crude blackbody fit without UV photometry underestimates the temperature, then the blackbody radius may be overestimated for a similar luminosity.
In terms of the bolometric evolution, we find that ATLAS18mlw is most similar to the “faint and fast” TDEs iPTF16fnl (Blagorodnova et al., 2017; Brown et al., 2018) and ZTF19abzrhgq (AT2019qiz; Nicholl et al., 2020). Of the three, ATLAS18mlw is the lowest luminosity, although the bolometric luminosity estimate is the weakest as there is no UV data to confirm the temperature. ATLAS18mlw is also the only likely TDE-H object of these three TDEs. The decline rate of ATLAS18mlw indicates that it is a fast evolving TDE, with only three sources declining faster. These are iPTF16fnl, ZTF19abzrhgq, and ASASSN-14ae (Holoien et al., 2014b). It is also interesting to note that the position of ATLAS18mlw in peak-luminosity/decline-rate space is much more similar to the TDEs than any of the ambiguous nuclear transients (ANTs) shown on Fig. 6. This result supports using the log(Lpeak) – L40 parameter space to help us differentiate between different classes of transients even without abundant data during the event, as will be the case for many discoveries by the Legacy Survey of Space and Time (LSST; Ivezić et al., 2019) on the Vera Rubin Observatory.
For the case of ATLAS18mlw, the late identification as a TDE precluded any follow-up observations, highlighting the need for rapid response to newly-discovered nuclear transients. As the discovery of TDEs continues to expand, it is important to prioritize data that best helps us understand physics driving the observed emission. Optical spectroscopy and high-energy UV/X-ray photometry, ideally beginning prior to peak light, are necessary to understand the detailed properties of individual events.
This goal requires the expansion of spectroscopic classification surveys to match the growing flood of transient discoveries each night. Even now, the number of discovered transients is roughly an order of magnitude higher than the number of transients classified spectroscopically. One obvious improvement is the robotizing of existing classification surveys to improve efficiency. For instance, the SCAT survey is currently classically scheduled and observed with 323 classifications in the last year, representing % of all classified transients. After the ongoing robotizing of the UH88 telescope444This effort is funded by an NSF Major Research Instrumentation Program (MRI) grant (Award Number: 1920392). is completed in late 2022, this number is expected to increase to per year.
Sources like ATLAS18mlw show that even with minimal data, important conclusions can be drawn and comparisons to very well-studied objects can be made. In particular, the host galaxies of sources like ATLAS18mlw can and should be incorporated into TDE population studies as these samples grow.
References
- Aguado et al. (2019) Aguado, D. S., Ahumada, R., Almeida, A., et al. 2019, ApJS, 240, 23, doi: 10.3847/1538-4365/aaf651
- Alard (2000) Alard, C. 2000, AAPS, 144, 363, doi: 10.1051/aas:2000214
- Alard & Lupton (1998) Alard, C., & Lupton, R. H. 1998, ApJ, 503, 325, doi: 10.1086/305984
- Aldering et al. (2006) Aldering, G., Antilogus, P., Bailey, S., et al. 2006, ApJ, 650, 510, doi: 10.1086/507020
- Antonucci (1993) Antonucci, R. 1993, ARA&A, 31, 473, doi: 10.1146/annurev.aa.31.090193.002353
- Arcavi et al. (2014) Arcavi, I., Gal-Yam, A., Sullivan, M., et al. 2014, ApJ, 793, 38, doi: 10.1088/0004-637X/793/1/38
- Auchettl et al. (2017) Auchettl, K., Guillochon, J., & Ramirez-Ruiz, E. 2017, ApJ, 838, 149, doi: 10.3847/1538-4357/aa633b
- Auchettl et al. (2018) Auchettl, K., Ramirez-Ruiz, E., & Guillochon, J. 2018, ApJ, 852, 37, doi: 10.3847/1538-4357/aa9b7c
- Baldwin et al. (1981) Baldwin, J. A., Phillips, M. M., & Terlevich, R. 1981, PASP, 93, 5, doi: 10.1086/130766
- Barbarino et al. (2019) Barbarino, C., Carracedo, A. S., Tartaglia, L., & Yaron, O. 2019, Transient Name Server Classification Report, 2019-287, 1
- Barron et al. (2008) Barron, J. T., Stumm, C., Hogg, D. W., Lang, D., & Roweis, S. 2008, AJ, 135, 414, doi: 10.1088/0004-6256/135/1/414
- Bellm et al. (2019) Bellm, E. C., Kulkarni, S. R., Graham, M. J., et al. 2019, PASP, 131, 018002, doi: 10.1088/1538-3873/aaecbe
- Bennett et al. (2014) Bennett, C. L., Larson, D., Weiland, J. L., & Hinshaw, G. 2014, ApJ, 794, 135, doi: 10.1088/0004-637X/794/2/135
- Blagorodnova et al. (2017) Blagorodnova, N., Gezari, S., Hung, T., et al. 2017, ApJ, 844, 46, doi: 10.3847/1538-4357/aa7579
- Bongiorno et al. (2010) Bongiorno, A., Mignoli, M., Zamorani, G., et al. 2010, A&A, 510, A56, doi: 10.1051/0004-6361/200913229
- Brown et al. (2017) Brown, J. S., Holoien, T. W.-S., Auchettl, K., et al. 2017, MNRAS, 466, 4904, doi: 10.1093/mnras/stx033
- Brown et al. (2018) Brown, J. S., Kochanek, C. S., Holoien, T. W.-S., et al. 2018, MNRAS, 473, 1130, doi: 10.1093/mnras/stx2372
- Bruzual & Charlot (2003) Bruzual, G., & Charlot, S. 2003, MNRAS, 344, 1000, doi: 10.1046/j.1365-8711.2003.06897.x
- Cappellari (2017) Cappellari, M. 2017, MNRAS, 466, 798, doi: 10.1093/mnras/stw3020
- Cappellari & Emsellem (2004) Cappellari, M., & Emsellem, E. 2004, PASP, 116, 138, doi: 10.1086/381875
- Cardelli et al. (1988) Cardelli, J. A., Clayton, G. C., & Mathis, J. S. 1988, ApJ, 329, L33, doi: 10.1086/185171
- Chambers et al. (2016) Chambers, K. C., Magnier, E. A., Metcalfe, N., et al. 2016, ArXiv e-prints. https://arxiv.org/abs/1612.05560
- Charalampopoulos et al. (2021) Charalampopoulos, P., Leloudas, G., Malesani, D. B., et al. 2021, arXiv e-prints, arXiv:2109.00016. https://arxiv.org/abs/2109.00016
- Cid Fernandes et al. (2011) Cid Fernandes, R., Stasińska, G., Mateus, A., & Vale Asari, N. 2011, MNRAS, 413, 1687, doi: 10.1111/j.1365-2966.2011.18244.x
- Eisenstein et al. (2011) Eisenstein, D. J., Weinberg, D. H., Agol, E., et al. 2011, AJ, 142, 72, doi: 10.1088/0004-6256/142/3/72
- Evans & Kochanek (1989) Evans, C. R., & Kochanek, C. S. 1989, ApJ, 346, L13, doi: 10.1086/185567
- Frederick et al. (2020) Frederick, S., Gezari, S., Graham, M. J., et al. 2020, arXiv e-prints, arXiv:2010.08554. https://arxiv.org/abs/2010.08554
- Fremling et al. (2020) Fremling, C., Miller, A. A., Sharma, Y., et al. 2020, ApJ, 895, 32, doi: 10.3847/1538-4357/ab8943
- Fremling et al. (2021) Fremling, C., Hall, X. J., Coughlin, M. W., et al. 2021, ApJ, 917, L2, doi: 10.3847/2041-8213/ac116f
- French (2021) French, K. D. 2021, PASP, 133, 072001, doi: 10.1088/1538-3873/ac0a59
- French et al. (2016) French, K. D., Arcavi, I., & Zabludoff, A. 2016, ApJ, 818, L21, doi: 10.3847/2041-8205/818/1/L21
- French et al. (2020a) French, K. D., Arcavi, I., Zabludoff, A. I., et al. 2020a, ApJ, 891, 93, doi: 10.3847/1538-4357/ab7450
- French et al. (2020b) French, K. D., Wevers, T., Law-Smith, J., Graur, O., & Zabludoff, A. I. 2020b, Space Sci. Rev., 216, 32, doi: 10.1007/s11214-020-00657-y
- French et al. (2018) French, K. D., Yang, Y., Zabludoff, A. I., & Tremonti, C. A. 2018, ApJ, 862, 2, doi: 10.3847/1538-4357/aacb2d
- Gafton & Rosswog (2019) Gafton, E., & Rosswog, S. 2019, MNRAS, 487, 4790, doi: 10.1093/mnras/stz1530
- Gezari (2021) Gezari, S. 2021, arXiv e-prints, arXiv:2104.14580. https://arxiv.org/abs/2104.14580
- Gezari et al. (2017) Gezari, S., Hung, T., Cenko, S. B., et al. 2017, ApJ, 835, 144, doi: 10.3847/1538-4357/835/2/144
- Graham et al. (2001) Graham, A. W., Erwin, P., Caon, N., & Trujillo, I. 2001, ApJ, 563, L11, doi: 10.1086/338500
- Graur et al. (2018) Graur, O., French, K. D., Zahid, H. J., et al. 2018, ApJ, 853, 39, doi: 10.3847/1538-4357/aaa3fd
- Harris et al. (2020) Harris, C. R., Millman, K. J., van der Walt, S. J., et al. 2020, Nature, 585, 357, doi: 10.1038/s41586-020-2649-2
- Hayden et al. (2021) Hayden, B., Rubin, D., Boone, K., et al. 2021, ApJ, 912, 87, doi: 10.3847/1538-4357/abed4d
- Heckman (1980) Heckman, T. M. 1980, A&A, 500, 187
- HI4PI Collaboration et al. (2016) HI4PI Collaboration, Ben Bekhti, N., Flöer, L., et al. 2016, A&A, 594, A116, doi: 10.1051/0004-6361/201629178
- Hinkle et al. (2021a) Hinkle, J. T., Holoien, T. W. S., Shappee, B. J., & Auchettl, K. 2021a, ApJ, 910, 83, doi: 10.3847/1538-4357/abe4d8
- Hinkle et al. (2020) Hinkle, J. T., Holoien, T. W. S., Shappee, B. J., et al. 2020, ApJ, 894, L10, doi: 10.3847/2041-8213/ab89a2
- Hinkle et al. (2021b) Hinkle, J. T., Holoien, T. W. S., Auchettl, K., et al. 2021b, MNRAS, 500, 1673, doi: 10.1093/mnras/staa3170
- Ho (2008) Ho, L. C. 2008, ARA&A, 46, 475, doi: 10.1146/annurev.astro.45.051806.110546
- Holoien et al. (2018) Holoien, T. W.-S., Brown, J. S., Auchettl, K., et al. 2018, MNRAS, 480, 5689, doi: 10.1093/mnras/sty2273
- Holoien et al. (2014a) Holoien, T. W.-S., Prieto, J. L., Stanek, K. Z., et al. 2014a, ApJ, 785, L35, doi: 10.1088/2041-8205/785/2/L35
- Holoien et al. (2014b) Holoien, T. W.-S., Prieto, J. L., Bersier, D., et al. 2014b, MNRAS, 445, 3263, doi: 10.1093/mnras/stu1922
- Holoien et al. (2016) Holoien, T. W.-S., Kochanek, C. S., Prieto, J. L., et al. 2016, MNRAS, 455, 2918, doi: 10.1093/mnras/stv2486
- Holoien et al. (2019) Holoien, T. W. S., Huber, M. E., Shappee, B. J., et al. 2019, ApJ, 880, 120, doi: 10.3847/1538-4357/ab2ae1
- Holoien et al. (2020) Holoien, T. W. S., Auchettl, K., Tucker, M. A., et al. 2020, arXiv e-prints, arXiv:2003.13693. https://arxiv.org/abs/2003.13693
- Hook et al. (2004) Hook, I. M., Jørgensen, I., Allington-Smith, J. R., et al. 2004, PASP, 116, 425, doi: 10.1086/383624
- Hung et al. (2017) Hung, T., Gezari, S., Blagorodnova, N., et al. 2017, ApJ, 842, 29, doi: 10.3847/1538-4357/aa7337
- Hunter (2007) Hunter, J. D. 2007, Computing in Science & Engineering, 9, 90, doi: 10.1109/MCSE.2007.55
- Ivezić et al. (2019) Ivezić, Ž., Kahn, S. M., Tyson, J. A., et al. 2019, ApJ, 873, 111, doi: 10.3847/1538-4357/ab042c
- Kauffmann et al. (2003) Kauffmann, G., Heckman, T. M., Tremonti, C., et al. 2003, MNRAS, 346, 1055, doi: 10.1111/j.1365-2966.2003.07154.x
- Kelly (2007) Kelly, B. C. 2007, ApJ, 665, 1489, doi: 10.1086/519947
- Kewley et al. (2001) Kewley, L. J., Dopita, M. A., Sutherland, R. S., Heisler, C. A., & Trevena, J. 2001, ApJ, 556, 121, doi: 10.1086/321545
- Kewley et al. (2006) Kewley, L. J., Groves, B., Kauffmann, G., & Heckman, T. 2006, MNRAS, 372, 961, doi: 10.1111/j.1365-2966.2006.10859.x
- Kochanek et al. (2017) Kochanek, C. S., Shappee, B. J., Stanek, K. Z., et al. 2017, PASP, 129, 104502, doi: 10.1088/1538-3873/aa80d9
- Kriek et al. (2009) Kriek, M., van Dokkum, P. G., Labbé, I., et al. 2009, ApJ, 700, 221, doi: 10.1088/0004-637X/700/1/221
- Lacerda et al. (2020) Lacerda, E. A. D., Sánchez, S. F., Cid Fernandes, R., et al. 2020, MNRAS, 492, 3073, doi: 10.1093/mnras/staa008
- Lang et al. (2010) Lang, D., Hogg, D. W., Mierle, K., Blanton, M., & Roweis, S. 2010, AJ, 139, 1782, doi: 10.1088/0004-6256/139/5/1782
- Lantz et al. (2004) Lantz, B., Aldering, G., Antilogus, P., et al. 2004, in Proc. SPIE, Vol. 5249, Optical Design and Engineering, ed. L. Mazuray, P. J. Rogers, & R. Wartmann, 146–155, doi: 10.1117/12.512493
- Law-Smith et al. (2017) Law-Smith, J., Ramirez-Ruiz, E., Ellison, S. L., & Foley, R. J. 2017, ApJ, 850, 22, doi: 10.3847/1538-4357/aa94c7
- Leloudas et al. (2019) Leloudas, G., Dai, L., Arcavi, I., et al. 2019, arXiv e-prints. https://arxiv.org/abs/1903.03120
- Martin et al. (2005) Martin, D. C., Fanson, J., Schiminovich, D., et al. 2005, ApJ, 619, L1, doi: 10.1086/426387
- McConnell & Ma (2013) McConnell, N. J., & Ma, C.-P. 2013, ApJ, 764, 184, doi: 10.1088/0004-637X/764/2/184
- Mendel et al. (2014) Mendel, J. T., Simard, L., Palmer, M., Ellison, S. L., & Patton, D. R. 2014, ApJS, 210, 3, doi: 10.1088/0067-0049/210/1/3
- Million et al. (2016) Million, C., Fleming, S. W., Shiao, B., et al. 2016, ApJ, 833, 292, doi: 10.3847/1538-4357/833/2/292
- Mockler et al. (2019) Mockler, B., Guillochon, J., & Ramirez-Ruiz, E. 2019, ApJ, 872, 151, doi: 10.3847/1538-4357/ab010f
- Mockler et al. (2022) Mockler, B., Twum, A. A., Auchettl, K., et al. 2022, ApJ, 924, 70, doi: 10.3847/1538-4357/ac35d5
- Neustadt et al. (2020) Neustadt, J. M. M., Holoien, T. W. S., Kochanek, C. S., et al. 2020, MNRAS, 494, 2538, doi: 10.1093/mnras/staa859
- Nicholl et al. (2020) Nicholl, M., Wevers, T., Oates, S. R., et al. 2020, arXiv e-prints, arXiv:2006.02454. https://arxiv.org/abs/2006.02454
- Osterbrock (1989) Osterbrock, D. E. 1989, Astrophysics of Gaseous Nebulae and Active Galactic Nuclei
- Osterbrock & Ferland (2006) Osterbrock, D. E., & Ferland, G. J. 2006, Astrophysics of gaseous nebulae and active galactic nuclei
- Phinney (1989) Phinney, E. S. 1989, Nature, 340, 595, doi: 10.1038/340595a0
- Prieto et al. (2016) Prieto, J. L., Krühler, T., Anderson, J. P., et al. 2016, ApJ, 830, L32, doi: 10.3847/2041-8205/830/2/L32
- Rees (1988) Rees, M. J. 1988, Nature, 333, 523, doi: 10.1038/333523a0
- Ricci et al. (2017) Ricci, C., Trakhtenbrot, B., Koss, M. J., et al. 2017, ApJS, 233, 17, doi: 10.3847/1538-4365/aa96ad
- Ricker et al. (2015) Ricker, G. R., Winn, J. N., Vanderspek, R., et al. 2015, Journal of Astronomical Telescopes, Instruments, and Systems, 1, 014003, doi: 10.1117/1.JATIS.1.1.014003
- Roth & Kasen (2018) Roth, N., & Kasen, D. 2018, ApJ, 855, 54, doi: 10.3847/1538-4357/aaaec6
- Ryu et al. (2020) Ryu, T., Krolik, J., & Piran, T. 2020, arXiv e-prints, arXiv:2007.13765. https://arxiv.org/abs/2007.13765
- Salpeter (1955) Salpeter, E. E. 1955, ApJ, 121, 161, doi: 10.1086/145971
- Schlafly & Finkbeiner (2011) Schlafly, E. F., & Finkbeiner, D. P. 2011, ApJ, 737, 103, doi: 10.1088/0004-637X/737/2/103
- Shappee et al. (2014) Shappee, B. J., Prieto, J. L., Grupe, D., et al. 2014, ApJ, 788, 48, doi: 10.1088/0004-637X/788/1/48
- Smartt et al. (2015) Smartt, S. J., Valenti, S., Fraser, M., et al. 2015, A&A, 579, A40, doi: 10.1051/0004-6361/201425237
- Smith et al. (2020) Smith, K. W., Smartt, S. J., Young, D. R., et al. 2020, arXiv e-prints, arXiv:2003.09052. https://arxiv.org/abs/2003.09052
- Stone & Metzger (2016) Stone, N. C., & Metzger, B. D. 2016, MNRAS, 455, 859, doi: 10.1093/mnras/stv2281
- Stone & van Velzen (2016) Stone, N. C., & van Velzen, S. 2016, ApJ, 825, L14, doi: 10.3847/2041-8205/825/1/L14
- Tonry et al. (2018) Tonry, J. L., Denneau, L., Heinze, A. N., et al. 2018, PASP, 130, 064505, doi: 10.1088/1538-3873/aabadf
- Tucker et al. (2018) Tucker, M. A., Huber, M., Shappee, B. J., et al. 2018, The Astronomer’s Telegram, 11444, 1
- Ulmer (1999) Ulmer, A. 1999, ApJ, 514, 180, doi: 10.1086/306909
- Vallely et al. (2021) Vallely, P. J., Kochanek, C. S., Stanek, K. Z., Fausnaugh, M., & Shappee, B. J. 2021, MNRAS, 500, 5639, doi: 10.1093/mnras/staa3675
- Vallely et al. (2019) Vallely, P. J., Fausnaugh, M., Jha, S. W., et al. 2019, arXiv e-prints. https://arxiv.org/abs/1903.08665
- van Velzen (2018) van Velzen, S. 2018, ApJ, 852, 72, doi: 10.3847/1538-4357/aa998e
- van Velzen & Farrar (2014) van Velzen, S., & Farrar, G. R. 2014, ApJ, 792, 53, doi: 10.1088/0004-637X/792/1/53
- van Velzen et al. (2020) van Velzen, S., Holoien, T. W. S., Onori, F., Hung, T., & Arcavi, I. 2020, Space Sci. Rev., 216, 124, doi: 10.1007/s11214-020-00753-z
- van Velzen et al. (2019) van Velzen, S., Stone, N. C., Metzger, B. D., et al. 2019, ApJ, 878, 82, doi: 10.3847/1538-4357/ab1844
- van Velzen et al. (2021) van Velzen, S., Gezari, S., Hammerstein, E., et al. 2021, ApJ, 908, 4, doi: 10.3847/1538-4357/abc258
- Vanden Berk et al. (2001) Vanden Berk, D. E., Richards, G. T., Bauer, A., et al. 2001, AJ, 122, 549, doi: 10.1086/321167
- Vanderspek et al. (2018) Vanderspek, R., Doty, J., Fausnaugh, M., et al. 2018, TESS Instrument Handbook, Tech. rep., Kavli Institute for Astrophysics and Space Science, Massachusetts Institute of Technology
- Veilleux & Osterbrock (1987) Veilleux, S., & Osterbrock, D. E. 1987, ApJS, 63, 295, doi: 10.1086/191166
- Virtanen et al. (2020) Virtanen, P., Gommers, R., Oliphant, T. E., et al. 2020, Nature Methods, 17, 261, doi: 10.1038/s41592-019-0686-2
- Voges et al. (1999) Voges, W., Aschenbach, B., Boller, T., et al. 1999, A&A, 349, 389
- Wang & Merritt (2004) Wang, J., & Merritt, D. 2004, ApJ, 600, 149, doi: 10.1086/379767
- Wevers et al. (2017) Wevers, T., van Velzen, S., Jonker, P. G., et al. 2017, MNRAS, 471, 1694, doi: 10.1093/mnras/stx1703
- Wright (2006) Wright, E. L. 2006, PASP, 118, 1711, doi: 10.1086/510102
- Wright et al. (2010) Wright, E. L., Eisenhardt, P. R. M., Mainzer, A. K., et al. 2010, AJ, 140, 1868, doi: 10.1088/0004-6256/140/6/1868
- Wyrzykowski et al. (2012) Wyrzykowski, Ł., Hodgkin, S., Blogorodnova, N., Koposov, S., & Burgon, R. 2012, in 2nd Gaia Follow-up Network for Solar System Objects, 21. https://arxiv.org/abs/1210.5007
- Zakamska et al. (2003) Zakamska, N. L., Strauss, M. A., Krolik, J. H., et al. 2003, AJ, 126, 2125, doi: 10.1086/378610