Identifying Weaknesses in Machine Translation Metrics Through Minimum Bayes Risk Decoding: A Case Study for COMET
Abstract
Neural metrics have achieved impressive correlation with human judgements in the evaluation of machine translation systems, but before we can safely optimise towards such metrics, we should be aware of (and ideally eliminate) biases toward bad translations that receive high scores. Our experiments show that sample-based Minimum Bayes Risk decoding can be used to explore and quantify such weaknesses. When applying this strategy to COMET for ende and deen, we find that COMET models are not sensitive enough to discrepancies in numbers and named entities. We further show that these biases are hard to fully remove by simply training on additional synthetic data and release our code and data for facilitating further experiments.111https://github.com/ZurichNLP/mbr-sensitivity
1 Introduction
Recently, neural machine translation evaluation metrics have reached better correlation scores with human evaluators than surface-level metrics like BLEU (Papineni et al., 2002). In particular, COMET (Rei et al., 2020a) has shown significant potential as a leading evaluation metric both in shared tasks (Mathur et al., 2020; Freitag et al., 2021b) and other studies on machine translation evaluation metrics (Kocmi et al., 2021). The main benefits of such neural metrics are that they do not rely on surface-level similarity to a reference translation and that some of them operate in a multilingual representation space. This also allows for comparing translations to the source sentence.
A recent evaluation as part of the WMT 2021 metrics shared task (Freitag et al., 2021b) suggests that neural metrics are also less susceptible to many weaknesses of earlier non-neural metrics, e.g. an antonym in the translation hurting the BLEU score exactly the same amount as a synonym. However, it is still unclear whether or not these metrics also introduce new biases that are harder to detect since they are essentially “black box” metrics that do not explain why a certain score is attributed to a translation. Failing to identify these biases in neural metrics could lead the community to optimise towards metric “blind spots”, either directly through reward-based training methods such as Minimum Risk Training Shen et al. (2016), or more slowly by basing modelling choices on metric scores. It is therefore worthwhile to find new means to uncover weaknesses of neural machine translation metrics.
In this paper, we show that sampling-based Minimum Bayes Risk (MBR) decoding - where a pool of samples are compared against each other using a machine translation evaluation metric as a utility function - can render blind spots of these metrics more observable. When applying COMET as the utility function, we find many examples where a translation hypothesis is chosen that contains different numbers or named entities than the source and reference (see examples in Table 1). Through a targeted sensitivity analysis, we identify that these are indeed weaknesses of COMET and we show that it can be hard to remove them from the model.
Our contributions are the following:
-
•
We propose to use sample-based MBR decoding to explore and measure weaknesses of neural machine translation evaluation metrics.
-
•
We find that COMET is not sensitive enough to number differences and mistranslations of named entities when translating from deen.
-
•
We show that simply retraining COMET on synthetic data is not enough to fully eliminate these blind spots.
| src | Schon drei Jahre nach der Gründung verließ Green die Band 1970. |
|---|---|
| ref | Green left the band three years after it was formed, in 1970. |
| MBRchrF++ | Already three years after the foundation, Green left the band in 1970. |
| MBRCOMET | Three years after the creation, Green left the band in 1980. |
| src | […] Mahmoud Guemama’s Death - Algeria Loses a Patriot […], Says President Tebboune. |
| ref | […] Mahmoud Guemamas Tod - Algerien verliert einen Patrioten […], sagt Präsident Tebboune. |
| MBRchrF++ | […] Mahmoud Guemamas Tod - Algerien verliert einen Patriot […], sagt Präsident Tebboune. |
| MBRCOMET | […] Mahmud Guemamas Tod - Algerien verliert einen Patriot […], sagt Präsident Tebboene. |
2 Related Works
How to best evaluate machine translation models has been a long-standing question in the research community. Ideally, we could employ humans to judge the quality of different models but this is time-consuming, costly and requires trained professionals. Various automatic machine translation metrics have been proposed over the years that typically compare a machine translation output to a reference sentence according to surface-level similarity (Papineni et al., 2002; Popović, 2015) or on a shallow semantic level (Banerjee and Lavie, 2005).
With the rise of contextual embeddings and large multilingual Transformer language models, metrics that map translations and references into the same latent space and compare the cosine similarity between them (Lo, 2020) or use them as inputs to predict a score (Sellam et al., 2020; Rei et al., 2020a) have become popular. Such neural metrics have been shown to agree more with human evaluation than previously popular metrics such as BLEU (Papineni et al., 2002) or chrF (Popović, 2015).
However, these neural metrics can also introduce new biases that we are not yet aware of (Hanna and Bojar, 2021). In this paper, we aim to find a way to identify such weaknesses via Minimum Bayes Risk (MBR) decoding. While MBR decoding was a frequently used decoding strategy in the days of statistical machine translation (Goel and Byrne, 2000; Kumar and Byrne, 2004; Tromble et al., 2008), it has only recently gained traction in the context of neural machine translation. Eikema and Aziz (2020) argue that MBR decoding using samples as hypotheses results in an unbiased candidate pool in contrast to beam search outputs which maximise the probability under the model. Indeed, if the machine translation model generating the samples is strong enough, humans prefer MBR-decoded hypotheses selected with BLEURT (Sellam et al., 2020) as the utility function over beam search outputs (Freitag et al., 2022).
Müller and Sennrich (2021) further show that MBR outputs can inherit biases from the utility function, for example, the length bias (Nakov et al., 2012) when BLEU is used as the utility function. Consequently, it stands to reason that MBR decoding can also be used to uncover new biases of metrics that are used as utility functions, as we will show in this work.
3 Minimum Bayes Risk Decoding
Traditionally, maximum a posteriori (MAP) decoding is used in the context of neural machine translation. The goal is to find the translation hypothesis among all possible hypotheses that is most probable under the translation model given the source sentence and the model parameters :
| (1) |
In practice, it is not feasible to consider every possible hypothesis. Beam search offers a popular and effective approximation.
In contrast, MBR decoding aims to find a translation that minimises the expected cost (risk) of choosing a candidate translation , assuming that we have some loss function to compare the candidate to a true translation , and access to the true probability distribution :
| (2) |
Since we do not have access to the true probability distribution , and cannot exhaustively sum over all possible translations , we have to make several approximations. First, we select a subset of all possible hypotheses as candidate translations to make the computation tractable. Eikema and Aziz (2020) suggest drawing ancestral samples from the translation model as a set of unbiased candidates, and we follow this sampling-based MBR approach. Ancestral samples are created by sampling the next token from the translation model according to the probability distribution over the vocabulary at each time step :
| (3) |
The probability distribution is conditioned on the source sentence and the previously produced output tokens . For each ancestral sample , this sampling continues until the end-of-sentence symbol is sampled as the next token .
Second, we need to create an additional set of “support hypotheses” that serve as an approximation to the unknown true translation. The set of candidates and the set of support hypotheses can be created separately but in this work, we follow Eikema and Aziz (2020) and let our translation model produce a set of 100 ancestral samples that are used both as candidates and support ().
Third, we need to define a loss function . In practice, we often substitute the loss function for a similarity function where higher values are better. Such a “utility function” is then used to search for the translation that maximises the expected utility or – to paraphrase – is most similar to all hypotheses in the support set :
| (4) |
Any automatic machine translation evaluation metric can be used as the utility function . Eikema and Aziz (2021) find that BEER (Stanojević and Sima’an, 2014) works best among a range of non-neural metrics. More recently, Freitag et al. (2022) compare several metrics as utility functions in a human evaluation of MBR-decoded outputs where the neural metric BLEURT (Sellam et al., 2020) clearly outperforms non-neural metrics. In this paper, we explore the use of another neural evaluation metric as the utility function, namely COMET. Since the reference-based COMET model takes the source, a translation hypothesis and a reference (approximated in MBR decoding with another hypothesis) as input, our formulation of MBR decoding now takes into account the source sentence :
| (5) |
For an efficiency-related discussion of our implementation, please refer to Section 4.3.
4 Experiment Setup
4.1 Translation Model
To be able to generate samples, we train two Transformer Base machine translation models (Vaswani et al., 2017) using the nematus222github.com/EdinburghNLP/nematus (Sennrich et al., 2017) framework, one from deen and one from ende. We follow Eikema and Aziz (2021) and use all available parallel data from the WMT 2018 news shared task (Bojar et al., 2018) except for Paracrawl as training data. This amounts to 5.9 million sentence pairs. After deduplication, we have approximately 5.6 million training examples.
Both models are trained for 250k updates and we choose the best checkpoint based on the BLEU score as evaluated on newstest2017 using SacreBLEU (Post, 2018). We compute a joint subword vocabulary of size 32k with byte pair encoding (Sennrich et al., 2016) using the SentencePiece implementation (Kudo and Richardson, 2018). During training and decoding, the maximum sequence length is set to 200 tokens.
Our models are built with 6 encoder layers, 6 decoder layers, 8 attention heads with an embedding and hidden state dimension of 512 and a feed-forward network dimension of 2048. For regularisation, we use a dropout rate of 0.1 for BPE-dropout (Provilkov et al., 2020) during training, for the embeddings, for the residual connections, in the feed-forward sub-layers and for the attention weights. We train with tied encoder and decoder input embeddings as well as tied decoder input and output embeddings (Press and Wolf, 2017) and apply exponential smoothing of model parameters (decay ) Junczys-Dowmunt et al. (2018). Following previous work on MBR decoding (Eikema and Aziz, 2020), we train without label smoothing.
For optimisation, we use Adam (Kingma and Ba, 2015) with standard hyperparameters and a learning rate of . We follow the Transformer learning schedule described in (Vaswani et al., 2017) with a linear warm-up over 4,000 steps. Our token batch size is set to 16,348 and we train on 4 NVIDIA Tesla V100 GPUs.
4.2 COMET Models
We experiment with two COMET models that were trained towards two different regression objectives:
- •
- •
4.3 MBR Decoding Implementations
For non-neural metrics, we use the MBR decoding implementation333https://github.com/Roxot/mbr-nmt provided by Eikema and Aziz (2021). We use only unique samples such that no hypothesis is assigned a higher average MBR score simply because it perfectly matches one or multiple hypotheses in the support.444Using all samples does not affect our results. In our experiments, we use chrF++ (Popović, 2017) and BLEU as non-neural metrics. For BLEU, the implementation internally uses SacreBLEU (Post, 2018)555Using floor smoothing with a smoothing value of 0.1..
For our experiments with COMET, we adapt the official COMET implementation666https://github.com/Unbabel/COMET and implement an option for MBR decoding. Since COMET first creates a pooled sentence representation of the source and each of the two hypotheses before constructing a single vector from these representations and passing it through a regression layer, it is crucial that the implementation does not naively call COMET on every hypothesis pair. Instead, we encode the source sentence and hypotheses only once with XLM-R (Conneau et al., 2020) and then score all combinations of hypothesis pairs in parallel.
4.4 Evaluation Data
We decide to use the test sets from the WMT 2021 news shared task (Akhbardeh et al., 2021) as our evaluation data. This dataset brings two major benefits to our analysis:
-
•
In the deen directions, it provides at least two references for every source sentence. This allows us to compare how much MBR scores differ between two equivalent human translation alternatives as a reference point.
-
•
This dataset was not part of the training data of the wmt20-comet-da and wmt21-comet-mqm COMET models which avoids the risk that the models have seen scores for similarly erroneous translations of these source sentences before.
There are 1000 sentence triplets (source, two human translations) for deen where we use translation A as our reference and translation B as an alternative translation and 1002 sentence triplets for ende where we use translation C as our reference and translation D as an alternative translation.
| Numbers | Named Entities | |||||||
| de-en | en-de | de-en | en-de | |||||
| reference | 93.24 | 93.46 | n/a | n/a | ||||
| alternative | 94.83 | +1.59 | 95.66 | +2.20 | 73.73 | 77.66 | ||
| beam search | 95.91 | +2.67 | 95.73 | +2.27 | 71.55 | -2.18 | 70.03 | -7.63 |
| MBR chrF++ | 91.22 | -2.02 | 93.43 | -0.03 | 67.59 | -6.14 | 62.44 | -15.22 |
| MBR bleu | 93.88 | +0.64 | 91.37 | -2.09 | 65.14 | -8.59 | 62.50 | -15.16 |
| MBR wmt20-comet-da | 90.34 | -2.90 | 89.14 | -4.32 | 65.33 | -8.40 | 54.17 | -23.49 |
| MBR wmt21-comet-mqm | 82.35 | -10.89 | 77.10 | -16.36 | 58.15 | -15.58 | 53.31 | -24.35 |
| MBR retrain-comet-da | 92.65 | -0.59 | 90.17 | -3.29 | 66.48 | -7.25 | 60.48 | -17.18 |
5 Exploration of MBR-Decoded Outputs
We employ sampling-based MBR decoding as a strategy to identify weaknesses in evaluation metrics that are used as utility functions. We believe that – in addition to general errors – we may also find other errors that can stem from two sources:
First, since samples are often of lower quality than hypotheses produced with beam search, neural metrics may behave unexpectedly when faced with errors that occur less frequently in beam search based machine translation outputs on which they were trained. Second, in MBR decoding, we compare a candidate translation hypothesis to a pseudo-reference (another hypothesis) instead of an actual reference. This is also something neural metrics were neither trained on nor designed to do.
We are most interested in general errors and errors of the first type since the second type is only relevant for MBR decoding itself. Therefore, we conduct additional experiments in Section 6 to distinguish between these two sources for the errors we identify below. Note that errors of the second type may become more important to investigate as MBR decoding becomes more prevalent or if we evaluate against multiple translation hypotheses instead of references (Fomicheva et al., 2020).
In our experiments, we first manually compare MBR-decoded outputs that were chosen with two different evaluation metrics as the utility function: chrF++ and COMET. For COMET, we notice several cases where the chosen hypothesis contains numbers and named entities that do not match with the source and the reference, even though the majority of samples in the support set contain the correct numbers and named entities. Two examples are shown in Table 1.
To test if these findings apply at scale, we run an automatic evaluation. For numbers, we use regular expressions to identify numbers in the MBR-decoded outputs. We measure the overlap between numbers in the source and the translation with the F1-score. We decide to compare to the source to be able to compute the overlaps for the reference and the alternative human translation as well. The results can be seen in the left part of Table 2. For named entities, we use spaCy777English: en_core_web_lg, German: de_core_news_lg (Honnibal et al., 2020) to identify entities of type “person”. Here, we compute the F1-scores to measure the overlap to the reference rather than to the source (as done for numbers) since the named entity recognition (NER) models are different for English and German. The results are shown in Table 2 on the right.
These simple automatic “gold” annotations produce false positives888For example, translating “3 pm” in the source to “15:00” is a valid translation, but would be counted as a mistake with the automatic number matching. Similarly, numbers translated as numerals are counted as errors, e.g. “15” and “fifteen”., which explains why neither the reference nor the alternative reference (for named entities) achieves an F1-score of 100%. However, this approximate method is sufficient to expose the large gap between the reference translation, the beam search output, and the output with MBR decoding with surface-level metrics and with COMET. We perform a manual error analysis of all numbers that our evaluation script identifies as errors for the MBR decoded outputs. The false positive rate is similar for all three utility functions: Around 3% of all numbers that occur either in the source or the translation are mistakenly identified as number mismatches. In contrast, the percentage of genuine errors increases: MBR bleu has a true negative rate of 4.4%, MBR chrF++ of 4.6%, MBR wmt20-comet-da of 7.2% and MBR wmt21-comet-mqm of 16.6% (computed jointly over deen). Thus, the wide gap caused with COMET as the utility function is due to genuine number mismatches, not paraphrasing.
Consequently, these results indicate that MBR decoding with the COMET metrics chooses more erroneous translations with respect to these criteria than with the two non-neural metrics or compared to beam search decoding. Interestingly, the wmt21-comet-mqm model performs considerably worse than the wmt20-comet-da model in this analysis. Oracle experiments where we choose the sample closest to the two references according to different metrics (see Appendix B) show smaller F1-score differences between both COMET models and the non-neural metrics but they still perform worse, particularly compared to chrF++.
It is worth noting that the beam search output has the highest F1-score of all tested decoding strategies. This suggests that mistranslations of numbers and named entities do not occur as frequently in beam search outputs and COMET’s insensitivity to numbers and named entities could therefore be less harmful when evaluating beam search outputs. However, Wang et al. (2021) recently showed that state-of-the-art research models and commercial NMT systems still struggle with numerical translations even when decoding with beam search. Such mistranslations may also occur more frequently in out-of-domain and low-resource settings and therefore, we argue that this insensitivity of COMET is not only harmful for sampling-based MBR decoding but also when evaluating beam search output.
This automatic evaluation has strengthened the findings in our manual exploration that wrong number and named entity translations are recurring problems. To better quantify how sensitive COMET models are toward these error types, we propose to perform an MBR-based sensitivity analysis in the next section.
| Samples as Support | References as Support | Controls | ||||||||
|---|---|---|---|---|---|---|---|---|---|---|
| Numbers | NEs | Nouns | Numbers | NEs | Nouns | Samples | Ref. | |||
| de-en | add | -0.047 | -0.054 | -0.255 | -0.086 | -0.101 | -0.385 | altern. | 0.022 | |
| del | -0.048 | -0.044 | -0.214 | -0.085 | -0.079 | -0.314 | copy | -0.593 | -0.472 | |
| sub | -0.024 | -0.056 | -0.270 | -0.041 | -0.119 | -0.410 | hallucin. | -1.277 | -1.907 | |
| whole | -0.064 | -0.122 | -0.320 | -0.111 | -0.212 | -0.496 | ||||
| en-de | add | -0.024 | -0.053 | -0.160 | -0.057 | -0.108 | -0.257 | altern. | -0.014 | |
| del | -0.037 | -0.044 | -0.113 | -0.063 | -0.078 | -0.215 | copy | -1.449 | -1.350 | |
| sub | -0.011 | -0.064 | -0.180 | -0.019 | -0.113 | -0.295 | hallucin. | -1.560 | -2.055 | |
| whole | -0.040 | -0.103 | -0.347 | -0.079 | -0.173 | -0.509 | ||||
| average | -0.037 | -0.068 | -0.232 | -0.068 | -0.123 | -0.360 | ||||
6 MBR-Based Sensitivity Analysis
Our findings in the previous section stand in contrast to the corrupted reference analysis performed as part of the WMT 2021 metrics shared task (Freitag et al., 2021b) where COMET mostly preferred the correct alternative human translation to one with swapped numbers when comparing to the reference. In reality, we will seldom have a hypothesis pool with a perfect translation and variants of it that only differ in one aspect. Ideally, evaluation metrics should be able to order translation hypotheses with many different error types according to their severity. Therefore, it makes sense to compare how much metrics punish different error types.
Since our previous analysis showed that many samples with number and named entity mismatches are chosen in MBR decoding, this indicates that COMET is not as sensitive to these error types as to other errors. To further support this finding, we propose to look more closely at how COMET behaves with different error types. As described in Section 3, in MBR decoding, every candidate translation is assigned a score that represents the average similarity to the support hypotheses. Consequently, if the support is kept constant and a targeted change is made to a candidate translation, the difference in this MBR score indicates how sensitive the utility function was towards this change. We term this an “MBR-based sensitivity analysis”.
To measure COMET’s sensitivity towards changes in numbers and named entities, we create a candidate pool that consists of the reference translation and several changed variants. Note that the support still contains the same 100 samples that were used to find the MBR-decoded outputs described in Section 5. In particular, we make the following targeted changes to the reference to measure the sensitivity towards each change:
-
•
numadd: one digit is added to a number at a random position.
-
•
numdel: one digit is removed from a number at a random position.
-
•
numsub: one digit is substituted with another digit in a number at a random position.
-
•
numwhole: one entire number is substituted with another number.
-
•
NEadd: one letter is added to a named entity at a random position.
-
•
NEdel: one letter is removed from a named entity at a random position.
-
•
NEsub: one letter is substituted with another letter in a named entity at a random position.
-
•
NEwhole: a named entity is substituted with another named entity.
As reference points, we also apply the same types of changes to random nouns in the reference:
-
•
nounadd: one letter is added to a random noun at a random position.
-
•
noundel: one letter is removed from a random noun at a random position.
-
•
nounsub: one letter is substituted with another letter in a random noun at a random position.
-
•
nounwhole: a random noun is substituted with another noun.
Additionally, our candidate pool contains the following hypotheses to be used as controls:
-
•
alternative: the second human reference provided as part of the WMT 2021 news shared task simulating an alternative translation.
-
•
copy: the original, unchanged source sentence simulating a model that simply copied the source to the decoder side.
-
•
hallucination: a sentence that is completely unrelated to the source and randomly picked from a larger corpus.
We use the same tools to identify numbers and named entities as in Section 5 to create these perturbations of the reference. For each newly created candidate, we compute the difference to the MBR score of the reference. We then average those differences across sentences for each perturbation type. The results for the sensitivity analysis with the wmt20-comet-da model can be seen in the left part of Table 3. We focus here on the wmt20-comet-da model since this is currently the model the authors recommend to use.999https://github.com/Unbabel/COMET/blob/master/METRICS.md
The controls, i.e. alternative translation, copied sentence and hallucination, behave as expected. The MBR score difference to the hallucination is by far the largest, followed by the copied source. For the alternative reference, we see the smallest MBR score difference.101010Note that this is due to averaging over sentences where the alternative sometimes gets a higher, sometimes a lower score. The average absolute difference is 0.111 which shows that the difference to the alternative of an individual sentence can be much larger. More importantly, all targeted changes to numbers or named entities result in a much smaller difference in MBR score compared to changes to the random nouns. This shows that COMET is not as sensitive to such discrepancies as it should be since such mistranslations can drastically alter the meaning. Both BLEU and chrF++ are more sensitive to changes to numbers and named entities than to random nouns (see Appendix C).
Following our discussion of error sources at the beginning of Section 5, it is a valid concern that if we were to compare the candidates to high-quality support translations rather than samples, COMET may be more sensitive toward number and named entity differences as there would be fewer other discrepancies between the candidates and the support. To test if this is the case, we repeat the sensitivity analysis but now use the two alternative references as the support instead of the 100 samples that were used before. The candidates are formed by applying the same perturbations as before to the 1-best beam search output instead of the reference. This mimics an oracle setup. The results for this experiment are shown in the middle of Table 3. Note that we cannot compare to an alternative translation for the beam search output in this setup.
The differences in the MBR score of the unperturbed beam search output are generally larger in this setup, which indicates that COMET is indeed more sensitive to errors when used as intended, i.e. with high-quality translations and correct references. However, we can still see that the perturbations made to random nouns result in much larger differences than perturbations made to numbers or named entities. This indicates that the problem cannot be attributed to the MBR decoding setting and low-quality pseudo-references alone.
7 COMET Retraining
One possible explanation for the low sensitivity of COMET to perturbations of numbers and named entities is that these errors are too rare in the WMT outputs used to train COMET. We decide to retrain COMET on the original training data plus added synthetic data on which we perform the same perturbations as described in Section 6. The idea is that the newly trained model is more sensitive toward named entity or number mismatches between the translation and its reference and/or source.
To retrain the wmt20-comet-da model, we use the data from the WMT metrics shared tasks collected in the years 2017 to 2019 (Bojar et al., 2017; Ma et al., 2018, 2019) as training data. For every deen or ende system output that contains a number or a named entity, we randomly apply one of the perturbations described in Section 6 (except for the perturbations of random nouns and whole named entities). To encourage COMET to punish such synthetically inserted mismatches, we modify the scores of the original examples by subtracting a penalty from the z-score of the Direct Assessment (DA) score. We retrain three different models with penalties of -0.2, -0.5 and -0.8 respectively. Within every experiment, the penalty is the same for all error classes. The resulting 61k synthetic training examples are then added to the 640k original examples which means that roughly 10% of the data are synthetic.111111We also trained models with larger amounts of synthetic data but did not see an improvement (see Appendix E).
We follow the hyperparameter suggestions in Rei et al. (2020b) for retraining COMET but we do not perform model averaging. The models are trained for two epochs and the hyperparameters are listed in Appendix A. We ensure that the retrained models still perform as well as the original model on the WMT 2020 metrics shared task Mathur et al. (2020). The average difference in system-level Pearson correlation to the original COMET model lies within 0.006 for all three penalties. The full results can be found in Appendix F.
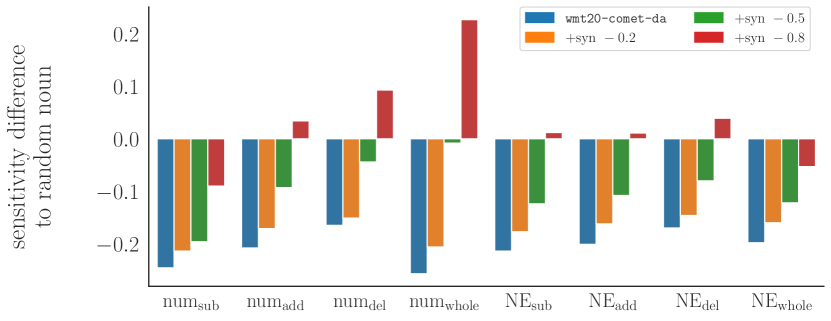
The effects of retraining with different penalties can be seen in Figure 1 (tables in Appendix D). Subtracting -0.2 from the original scores for synthetic examples can slightly reduce the difference between the MBR scores for numbers / named entities and random nouns with the same error types. Retraining with -0.5 subtracted from the original score improves this further but still cannot close this gap completely. With a penalty of -0.8, we now see a larger sensitivity to numbers and named entities than to random nouns for several error types. However, the difference to random nouns is still rather high for substituting a digit in numbers.
When repeating the automatic analysis from Section 5 with the penalty -0.8 model, we see that retraining does improve the F1-scores (see last row in Table 2). However, the retrained COMET model can still not beat non-neural utility functions which indicates that it is still less sensitive to mismatches in numbers and named entities.
From this experiment, we conclude that removing such blind spots from COMET - once identified - might need more effort than simply training on additional synthetic data. We hypothesise is that the XLM-R component learns very similar representations for numbers and rare words like named entities during pretraining which could be hard to reverse with finetuning only. Lin et al. (2020) show that pretrained language models are surprisingly bad at guessing the correct number from context (e.g. "A bird usually has [MASK] legs.") which supports this hypothesis. Several other works also find that task-specific models often struggle with numbers and named entities such as in summarisation (Zhao et al., 2020) or question answering (Dua et al., 2019; Kim et al., 2021). We leave a more extensive analysis of biases in the human evaluation training data (e.g. unpunished number mismatches) and further experiments on weakness-targeted training for future work.
8 Conclusion
Identifying weaknesses of neural machine translation evaluation metrics becomes more important as these essentially “black box” evaluation tools become more popular and are optimised towards during model development. We show that MBR decoding can be used to explore biases of such metrics. Through a case study, we show that COMET is relatively insensitive to mistranslated numbers and named entities. This can be seen both in the MBR-decoded output which contains a higher number of these errors compared to beam search (or MBR with other utility functions) and in an MBR-based sensitivity analysis which compares the differences in MBR scores that arise when such errors are introduced to a candidate translation. We also show that this insensitivity is not simply the result of insufficient training data containing such errors: retraining COMET with additional synthetic data did not fully alleviate this weakness.
While errors related to number and named entity translation were very salient in our exploration, we do not claim that this case study is exhaustive. In our manual analysis, we also see anecdotal evidence of polarity errors and nonsensical German compounds. We hope our findings motivate further research into identifying and mitigating biases of neural machine translation metrics – we envision that actively searching for biases in neural metrics, for example by using them as utility functions in MBR, could become an important step during metric development.
Acknowledgements
We are grateful to Ricardo Rei for the support in retraining COMET and the anonymous reviewers for their helpful feedback. We also thank Janis Goldzycher, Mathias Müller, Nikita Moghe and Tannon Kew for their valuable inputs and interesting discussions throughout the development of this paper. This work was funded by the Swiss National Science Foundation (project MUTAMUR; no. 176727) and made use of the infrastructure services provided by S3IT, the Service and Support for Science IT team at the University of Zurich.
Ethical Considerations
In our work, we only use publicly available toolkits and datasets and do not collect any additional data. Our experiments also do not involve human annotators (other than ourselves). The main contribution of our paper is a new approach for identifying weaknesses in neural machine translation evaluation metrics using MBR decoding. We believe this approach is largely beneficial to the research community as a tool to investigate “blind spots” of metrics and we do not see any immediate risks.
Limitations
We limited our analysis in this work to the ende translation directions and one machine translation evaluation metric, namely COMET. Consequently, we cannot draw any conclusions on whether the identified weaknesses are specific to COMET or also apply to other neural machine translation evaluation metrics and language pairs. We leave such exploration for future work. While our approach for identifying weaknesses in evaluation metrics is readily applicable to other surface-level or neural metrics, the runtime for MBR decoding can explode if the similarity computation cannot be parallelised or the size of the sample pool is increased. However, since our proposed approach is a tool for metric analysis and is not intended to be run regularly, we believe an increased runtime is not obstructive.
Another limitation is that we do not use a state-of-the-art machine translation model (in terms of data size) to generate the samples for our metric analysis. This does, however, not limit our findings that COMET is not as sensitive to number and named entity differences as it should be. Even if machine translation models may produce fewer mistakes of this nature in the future, eliminating such weaknesses remains relevant, for example, if COMET is used for Minimum Risk Training.
Finally, while our experiments indicate that weaknesses related to number and named entity changes cannot easily be eliminated by retraining on synthetic data, alternative strategies to create or retrain on synthetic data may be more successful.
References
- Akhbardeh et al. (2021) Farhad Akhbardeh, Arkady Arkhangorodsky, Magdalena Biesialska, Ondřej Bojar, Rajen Chatterjee, Vishrav Chaudhary, Marta R. Costa-jussa, Cristina España-Bonet, Angela Fan, Christian Federmann, Markus Freitag, Yvette Graham, Roman Grundkiewicz, Barry Haddow, Leonie Harter, Kenneth Heafield, Christopher Homan, Matthias Huck, Kwabena Amponsah-Kaakyire, Jungo Kasai, Daniel Khashabi, Kevin Knight, Tom Kocmi, Philipp Koehn, Nicholas Lourie, Christof Monz, Makoto Morishita, Masaaki Nagata, Ajay Nagesh, Toshiaki Nakazawa, Matteo Negri, Santanu Pal, Allahsera Auguste Tapo, Marco Turchi, Valentin Vydrin, and Marcos Zampieri. 2021. Findings of the 2021 conference on machine translation (WMT21). In Proceedings of the Sixth Conference on Machine Translation, pages 1–88, Online. Association for Computational Linguistics.
- Banerjee and Lavie (2005) Satanjeev Banerjee and Alon Lavie. 2005. METEOR: An automatic metric for MT evaluation with improved correlation with human judgments. In Proceedings of the ACL Workshop on Intrinsic and Extrinsic Evaluation Measures for Machine Translation and/or Summarization, pages 65–72, Ann Arbor, Michigan. Association for Computational Linguistics.
- Bojar et al. (2018) Ondřej Bojar, Christian Federmann, Mark Fishel, Yvette Graham, Barry Haddow, Matthias Huck, Philipp Koehn, and Christof Monz. 2018. Findings of the 2018 conference on machine translation (WMT18). In Proceedings of the Third Conference on Machine Translation: Shared Task Papers, pages 272–303, Belgium, Brussels. Association for Computational Linguistics.
- Bojar et al. (2017) Ondřej Bojar, Yvette Graham, and Amir Kamran. 2017. Results of the WMT17 metrics shared task. In Proceedings of the Second Conference on Machine Translation, pages 489–513, Copenhagen, Denmark. Association for Computational Linguistics.
- Conneau et al. (2020) Alexis Conneau, Kartikay Khandelwal, Naman Goyal, Vishrav Chaudhary, Guillaume Wenzek, Francisco Guzmán, Edouard Grave, Myle Ott, Luke Zettlemoyer, and Veselin Stoyanov. 2020. Unsupervised cross-lingual representation learning at scale. In Proceedings of the 58th Annual Meeting of the Association for Computational Linguistics, pages 8440–8451, Online. Association for Computational Linguistics.
- Dua et al. (2019) Dheeru Dua, Yizhong Wang, Pradeep Dasigi, Gabriel Stanovsky, Sameer Singh, and Matt Gardner. 2019. DROP: A reading comprehension benchmark requiring discrete reasoning over paragraphs. In Proceedings of the 2019 Conference of the North American Chapter of the Association for Computational Linguistics: Human Language Technologies, Volume 1 (Long and Short Papers), pages 2368–2378, Minneapolis, Minnesota. Association for Computational Linguistics.
- Eikema and Aziz (2020) Bryan Eikema and Wilker Aziz. 2020. Is MAP decoding all you need? the inadequacy of the mode in neural machine translation. In Proceedings of the 28th International Conference on Computational Linguistics, pages 4506–4520, Barcelona, Spain (Online). International Committee on Computational Linguistics.
- Eikema and Aziz (2021) Bryan Eikema and Wilker Aziz. 2021. Sampling-based minimum bayes risk decoding for neural machine translation.
- Fomicheva et al. (2020) Marina Fomicheva, Lucia Specia, and Francisco Guzmán. 2020. Multi-hypothesis machine translation evaluation. In Proceedings of the 58th Annual Meeting of the Association for Computational Linguistics, pages 1218–1232, Online. Association for Computational Linguistics.
- Freitag et al. (2021a) Markus Freitag, George Foster, David Grangier, Viresh Ratnakar, Qijun Tan, and Wolfgang Macherey. 2021a. Experts, errors, and context: A large-scale study of human evaluation for machine translation. Transactions of the Association for Computational Linguistics, 9:1460–1474.
- Freitag et al. (2022) Markus Freitag, David Grangier, Qijun Tan, and Bowen Liang. 2022. High quality rather than high model probability: Minimum Bayes risk decoding with neural metrics. Transactions of the Association for Computational Linguistics, 10:811–825.
- Freitag et al. (2021b) Markus Freitag, Ricardo Rei, Nitika Mathur, Chi-kiu Lo, Craig Stewart, George Foster, Alon Lavie, and Ondřej Bojar. 2021b. Results of the WMT21 metrics shared task: Evaluating metrics with expert-based human evaluations on TED and news domain. In Proceedings of the Sixth Conference on Machine Translation, pages 733–774, Online. Association for Computational Linguistics.
- Goel and Byrne (2000) Vaibhava Goel and William J Byrne. 2000. Minimum bayes-risk automatic speech recognition. Computer Speech & Language, 14(2):115–135.
- Graham et al. (2017) Yvette Graham, Timothy Baldwin, Alistair Moffat, and Justin Zobel. 2017. Can machine translation systems be evaluated by the crowd alone. Natural Language Engineering, 23(1):3–30.
- Hanna and Bojar (2021) Michael Hanna and Ondřej Bojar. 2021. A fine-grained analysis of BERTScore. In Proceedings of the Sixth Conference on Machine Translation, pages 507–517, Online. Association for Computational Linguistics.
- Honnibal et al. (2020) Matthew Honnibal, Ines Montani, Sofie Van Landeghem, and Adriane Boyd. 2020. spaCy: Industrial-strength Natural Language Processing in Python.
- Junczys-Dowmunt et al. (2018) Marcin Junczys-Dowmunt, Roman Grundkiewicz, Tomasz Dwojak, Hieu Hoang, Kenneth Heafield, Tom Neckermann, Frank Seide, Ulrich Germann, Alham Fikri Aji, Nikolay Bogoychev, André F. T. Martins, and Alexandra Birch. 2018. Marian: Fast neural machine translation in C++. In Proceedings of ACL 2018, System Demonstrations, pages 116–121, Melbourne, Australia. Association for Computational Linguistics.
- Kim et al. (2021) Jeonghwan Kim, Giwon Hong, Kyung-min Kim, Junmo Kang, and Sung-Hyon Myaeng. 2021. Have you seen that number? investigating extrapolation in question answering models. In Proceedings of the 2021 Conference on Empirical Methods in Natural Language Processing, pages 7031–7037, Online and Punta Cana, Dominican Republic. Association for Computational Linguistics.
- Kingma and Ba (2015) Diederik P. Kingma and Jimmy Ba. 2015. Adam: A Method for Stochastic Optimization. In 3rd International Conference on Learning Representations, ICLR 2015, San Diego, CA, USA, May 7-9, 2015, Conference Track Proceedings.
- Kocmi et al. (2021) Tom Kocmi, Christian Federmann, Roman Grundkiewicz, Marcin Junczys-Dowmunt, Hitokazu Matsushita, and Arul Menezes. 2021. To ship or not to ship: An extensive evaluation of automatic metrics for machine translation. In Proceedings of the Sixth Conference on Machine Translation, pages 478–494, Online. Association for Computational Linguistics.
- Kudo and Richardson (2018) Taku Kudo and John Richardson. 2018. SentencePiece: A simple and language independent subword tokenizer and detokenizer for neural text processing. In Proceedings of the 2018 Conference on Empirical Methods in Natural Language Processing: System Demonstrations, pages 66–71, Brussels, Belgium. Association for Computational Linguistics.
- Kumar and Byrne (2004) Shankar Kumar and William Byrne. 2004. Minimum Bayes-risk decoding for statistical machine translation. In Proceedings of the Human Language Technology Conference of the North American Chapter of the Association for Computational Linguistics: HLT-NAACL 2004, pages 169–176, Boston, Massachusetts, USA. Association for Computational Linguistics.
- Lin et al. (2020) Bill Yuchen Lin, Seyeon Lee, Rahul Khanna, and Xiang Ren. 2020. Birds have four legs?! NumerSense: Probing Numerical Commonsense Knowledge of Pre-Trained Language Models. In Proceedings of the 2020 Conference on Empirical Methods in Natural Language Processing (EMNLP), pages 6862–6868, Online. Association for Computational Linguistics.
- Lo (2020) Chi-kiu Lo. 2020. Extended study on using pretrained language models and YiSi-1 for machine translation evaluation. In Proceedings of the Fifth Conference on Machine Translation, pages 895–902, Online. Association for Computational Linguistics.
- Ma et al. (2018) Qingsong Ma, Ondřej Bojar, and Yvette Graham. 2018. Results of the WMT18 metrics shared task: Both characters and embeddings achieve good performance. In Proceedings of the Third Conference on Machine Translation: Shared Task Papers, pages 671–688, Belgium, Brussels. Association for Computational Linguistics.
- Ma et al. (2019) Qingsong Ma, Johnny Wei, Ondřej Bojar, and Yvette Graham. 2019. Results of the WMT19 metrics shared task: Segment-level and strong MT systems pose big challenges. In Proceedings of the Fourth Conference on Machine Translation (Volume 2: Shared Task Papers, Day 1), pages 62–90, Florence, Italy. Association for Computational Linguistics.
- Mathur et al. (2020) Nitika Mathur, Johnny Wei, Markus Freitag, Qingsong Ma, and Ondřej Bojar. 2020. Results of the WMT20 metrics shared task. In Proceedings of the Fifth Conference on Machine Translation, pages 688–725, Online. Association for Computational Linguistics.
- Müller and Sennrich (2021) Mathias Müller and Rico Sennrich. 2021. Understanding the properties of minimum Bayes risk decoding in neural machine translation. In Proceedings of the 59th Annual Meeting of the Association for Computational Linguistics and the 11th International Joint Conference on Natural Language Processing (Volume 1: Long Papers), pages 259–272, Online. Association for Computational Linguistics.
- Nakov et al. (2012) Preslav Nakov, Francisco Guzman, and Stephan Vogel. 2012. Optimizing for sentence-level BLEU+1 yields short translations. In Proceedings of COLING 2012, pages 1979–1994, Mumbai, India. The COLING 2012 Organizing Committee.
- Papineni et al. (2002) Kishore Papineni, Salim Roukos, Todd Ward, and Wei-Jing Zhu. 2002. Bleu: a method for automatic evaluation of machine translation. In Proceedings of the 40th Annual Meeting of the Association for Computational Linguistics, pages 311–318, Philadelphia, Pennsylvania, USA. Association for Computational Linguistics.
- Popović (2015) Maja Popović. 2015. chrF: character n-gram F-score for automatic MT evaluation. In Proceedings of the Tenth Workshop on Statistical Machine Translation, pages 392–395, Lisbon, Portugal. Association for Computational Linguistics.
- Popović (2017) Maja Popović. 2017. chrF++: words helping character n-grams. In Proceedings of the Second Conference on Machine Translation, pages 612–618, Copenhagen, Denmark. Association for Computational Linguistics.
- Post (2018) Matt Post. 2018. A call for clarity in reporting BLEU scores. In Proceedings of the Third Conference on Machine Translation: Research Papers, pages 186–191, Brussels, Belgium. Association for Computational Linguistics.
- Press and Wolf (2017) Ofir Press and Lior Wolf. 2017. Using the output embedding to improve language models. In Proceedings of the 15th Conference of the European Chapter of the Association for Computational Linguistics: Volume 2, Short Papers, pages 157–163, Valencia, Spain. Association for Computational Linguistics.
- Provilkov et al. (2020) Ivan Provilkov, Dmitrii Emelianenko, and Elena Voita. 2020. BPE-dropout: Simple and effective subword regularization. In Proceedings of the 58th Annual Meeting of the Association for Computational Linguistics, pages 1882–1892, Online. Association for Computational Linguistics.
- Rei et al. (2021) Ricardo Rei, Ana C Farinha, Chrysoula Zerva, Daan van Stigt, Craig Stewart, Pedro Ramos, Taisiya Glushkova, André F. T. Martins, and Alon Lavie. 2021. Are references really needed? unbabel-IST 2021 submission for the metrics shared task. In Proceedings of the Sixth Conference on Machine Translation, pages 1030–1040, Online. Association for Computational Linguistics.
- Rei et al. (2020a) Ricardo Rei, Craig Stewart, Ana C Farinha, and Alon Lavie. 2020a. COMET: A neural framework for MT evaluation. In Proceedings of the 2020 Conference on Empirical Methods in Natural Language Processing (EMNLP), pages 2685–2702, Online. Association for Computational Linguistics.
- Rei et al. (2020b) Ricardo Rei, Craig Stewart, Ana C Farinha, and Alon Lavie. 2020b. Unbabel’s participation in the WMT20 metrics shared task. In Proceedings of the Fifth Conference on Machine Translation, pages 911–920, Online. Association for Computational Linguistics.
- Sellam et al. (2020) Thibault Sellam, Dipanjan Das, and Ankur Parikh. 2020. BLEURT: Learning robust metrics for text generation. In Proceedings of the 58th Annual Meeting of the Association for Computational Linguistics, pages 7881–7892, Online. Association for Computational Linguistics.
- Sennrich et al. (2017) Rico Sennrich, Orhan Firat, Kyunghyun Cho, Alexandra Birch, Barry Haddow, Julian Hitschler, Marcin Junczys-Dowmunt, Samuel Läubli, Antonio Valerio Miceli Barone, Jozef Mokry, and Maria Nădejde. 2017. Nematus: a toolkit for neural machine translation. In Proceedings of the Software Demonstrations of the 15th Conference of the European Chapter of the Association for Computational Linguistics, pages 65–68, Valencia, Spain. Association for Computational Linguistics.
- Sennrich et al. (2016) Rico Sennrich, Barry Haddow, and Alexandra Birch. 2016. Neural machine translation of rare words with subword units. In Proceedings of the 54th Annual Meeting of the Association for Computational Linguistics (Volume 1: Long Papers), pages 1715–1725, Berlin, Germany. Association for Computational Linguistics.
- Shen et al. (2016) Shiqi Shen, Yong Cheng, Zhongjun He, Wei He, Hua Wu, Maosong Sun, and Yang Liu. 2016. Minimum risk training for neural machine translation. In Proceedings of the 54th Annual Meeting of the Association for Computational Linguistics (Volume 1: Long Papers), pages 1683–1692, Berlin, Germany. Association for Computational Linguistics.
- Stanojević and Sima’an (2014) Miloš Stanojević and Khalil Sima’an. 2014. Fitting sentence level translation evaluation with many dense features. In Proceedings of the 2014 Conference on Empirical Methods in Natural Language Processing (EMNLP), pages 202–206, Doha, Qatar. Association for Computational Linguistics.
- Tromble et al. (2008) Roy Tromble, Shankar Kumar, Franz Och, and Wolfgang Macherey. 2008. Lattice Minimum Bayes-Risk decoding for statistical machine translation. In Proceedings of the 2008 Conference on Empirical Methods in Natural Language Processing, pages 620–629, Honolulu, Hawaii. Association for Computational Linguistics.
- Uszkoreit and Lommel (2013) Hans Uszkoreit and Arle Lommel. 2013. Multidimensional quality metrics: A new unified paradigm for human and machine translation quality assessment. Localization World, London, pages 12–14.
- Vaswani et al. (2017) Ashish Vaswani, Noam Shazeer, Niki Parmar, Jakob Uszkoreit, Llion Jones, Aidan N Gomez, Łukasz Kaiser, and Illia Polosukhin. 2017. Attention is All you Need. In I. Guyon, U. V. Luxburg, S. Bengio, H. Wallach, R. Fergus, S. Vishwanathan, and R. Garnett, editors, Advances in Neural Information Processing Systems 30, pages 5998–6008. Curran Associates, Inc.
- Wang et al. (2021) Jun Wang, Chang Xu, Francisco Guzmán, Ahmed El-Kishky, Benjamin Rubinstein, and Trevor Cohn. 2021. As easy as 1, 2, 3: Behavioural testing of NMT systems for numerical translation. In Findings of the Association for Computational Linguistics: ACL-IJCNLP 2021, pages 4711–4717, Online. Association for Computational Linguistics.
- Zhao et al. (2020) Zheng Zhao, Shay B. Cohen, and Bonnie Webber. 2020. Reducing quantity hallucinations in abstractive summarization. In Findings of the Association for Computational Linguistics: EMNLP 2020, pages 2237–2249, Online. Association for Computational Linguistics.
Appendix A Hyperparameters for COMET Retraining
We list all hyperparameters used for training the retrain-comet-da models with different penalties in Tables 4. Each model was trained on 1 NVIDIA Tesla V100 GPU.
| Hyperparameter | Value |
|---|---|
| nr_frozen_epochs | 1 |
| keep_embeddings_frozen | True |
| optimizer | Adam |
| encoder_learning_rate | 1.0e-05 |
| learning_rate | 3.0e-05 |
| layerwise_decay | 0.95 |
| encoder_model | XLM-RoBERTa |
| pretrained_model | xlm-roberta-large |
| pool | avg |
| layer | mix |
| dropout | 0.1 |
| batch_size | 2 |
| accumulate_grad_batches | 8 |
| hidden_sizes | 3072, 1536 |
| load_weights_from_checkpoint | null |
| min_epochs | 2 |
| max_epochs | 2 |
| Numbers | Named Entities | ||||||||
| de-en | en-de | de-en | en-de | ||||||
| reference | 93.24 | 93.46 | n/a | n/a | |||||
| alternative | 94.83 | +1.59 | 95.66 | +2.20 | 73.73 | 77.66 | |||
| beam search | 95.91 | +2.67 | 95.73 | +2.27 | 71.55 | -2.18 | 70.03 | -7.63 | |
| Oracle chrF++ | 91.91 | -1.33 | 93.64 | +0.18 | 69.54 | -4.19 | 63.59 | -14.07 | |
| Oracle bleu | 90.77 | -2.47 | 92.05 | -1.41 | 65.73 | -8.00 | 60.16 | -17.50 | |
| Oracle wmt20-comet-da | 90.83 | -2.41 | 88.79 | -4.67 | 65.64 | -8.09 | 56.41 | -21.25 | |
| Oracle wmt21-comet-mqm | 91.35 | -1.89 | 86.01 | -7.45 | 64.75 | -8.98 | 55.98 | -21.68 | |
| Samples as Support | References as Support | Controls | ||||||||
|---|---|---|---|---|---|---|---|---|---|---|
| Numbers | NEs | Nouns | Numbers | NEs | Nouns | Samples | Ref. | |||
| de-en | add | -1.80 | -1.80 | -1.20 | -4.92 | -5.62 | -4.41 | altern. | 1.11 | |
| del | -1.70 | -1.79 | -1.20 | -4.84 | -5.62 | -4.41 | copy | -5.87 | -21.43 | |
| sub | -1.78 | -1.84 | -1.19 | -5.10 | -5.78 | -4.44 | hallucin. | -6.71 | -22.75 | |
| whole | -1.80 | -2.28 | -1.25 | -4.92 | -6.64 | -4.46 | ||||
| en-de | add | -1.62 | -1.41 | -0.88 | -4.10 | -3.56 | -2.73 | altern. | -0.33 | |
| del | -1.65 | -1.37 | -0.88 | -4.24 | -3.58 | -2.73 | copy | -6.02 | -20.06 | |
| sub | -1.57 | -1.41 | -0.86 | -4.09 | -3.71 | -2.75 | hallucin. | -6.71 | -21.14 | |
| whole | -1.62 | -1.72 | -0.90 | -4.10 | -4.41 | -2.79 | ||||
| average | -1.69 | -1.70 | -1.05 | -4.54 | -4.87 | -3.59 | ||||
| Samples as Support | References as Support | Controls | ||||||||
|---|---|---|---|---|---|---|---|---|---|---|
| Numbers | NEs | Nouns | Numbers | NEs | Nouns | Samples | Ref. | |||
| de-en | add | -1.18 | -1.66 | -1.20 | -2.18 | -2.91 | -2.55 | altern. | 0.32 | |
| del | -1.52 | -1.99 | -1.41 | -2.53 | -3.30 | -2.94 | copy | -17.18 | -32.94 | |
| sub | -1.54 | -2.00 | -1.47 | -2.74 | -3.53 | -3.07 | hallucin. | -22.82 | -43.39 | |
| whole | -1.91 | -4.85 | -2.50 | -3.25 | -8.57 | -5.27 | ||||
| en-de | add | -0.88 | -1.25 | -0.80 | -2.28 | -2.04 | -1.52 | altern. | -0.73 | |
| del | -1.10 | -1.47 | -0.94 | -1.89 | -2.37 | -1.78 | copy | -19.13 | -32.68 | |
| sub | -1.08 | -1.51 | -0.96 | -1.87 | -2.44 | -1.81 | hallucin. | -24.96 | -42.11 | |
| whole | -1.33 | -3.72 | -1.98 | -2.28 | -5.81 | -3.68 | ||||
| average | -1.32 | -2.31 | -1.41 | -2.38 | -3.87 | -2.83 | ||||
Appendix B Oracle Results for Automatic Analysis
In MBR, we use machine translation metrics in an unintended way since we compare translation hypotheses against other hypotheses rather than a reference translation. To check if the results for the COMET models in our automatic analysis stem from this train-test mismatch, we also run an oracle experiment. Rather than comparing all samples against each other with MBR, we choose the sample that is most similar to the human reference translations. The results can be seen in Table 5. Most error rates are better in the oracle setup compared to the MBR setup. Especially, the error rates for the COMET models are now closer to the non-neural metrics. However, the gap to chrF++ is still rather large, especially for named entities.
Appendix C MBR-based Sensitivity Analysis for BLEU and chrF++
The MBR-based sensitivity analysis can also be used to compare COMET to non-neural metrics. The results when using BLEU or chrF++ as the utility function can be seen in Table 6 and Table 7 respectively. We can see that with BLEU the changes made to random nouns result in smaller MBR differences than changes to numbers or named entities. For chrf++, the changes to random nouns result in smaller MBR differences than changes to named entities but slightly larger differences than changes to numbers. The cause for this may be that numbers are often shorter than named entities or nouns and a change will affect fewer n-grams. For random nouns, there may be many possible alternative translations in the samples and the references. If the random noun does not occur in the sentence we compare to, making a change to it will not affect the BLEU score and only partially the chrF++ score which can explain these results.
| Samples as Support | References as Support | Controls | ||||||||
|---|---|---|---|---|---|---|---|---|---|---|
| Numbers | NEs | Nouns | Numbers | NEs | Nouns | Samples | Ref. | |||
| de-en | add | -0.059 | -0.067 | -0.230 | -0.116 | -0.135 | -0.386 | altern. | 0.021 | |
| del | -0.048 | -0.053 | -0.199 | -0.092 | -0.105 | -0.326 | copy | -0.778 | -0.690 | |
| sub | -0.028 | -0.065 | -0.242 | -0.054 | -0.146 | -0.403 | hallucin. | -1.081 | -1.720 | |
| whole | -0.082 | -0.127 | -0.287 | -0.151 | -0.250 | -0.493 | ||||
| en-de | add | -0.040 | -0.044 | -0.153 | -0.083 | -0.107 | -0.260 | altern. | -0.015 | |
| del | -0.046 | -0.038 | -0.117 | -0.080 | -0.083 | -0.211 | copy | -1.513 | -1.625 | |
| sub | -0.015 | -0.051 | -0.169 | -0.034 | -0.111 | -0.277 | hallucin. | -1.402 | -1.891 | |
| whole | -0.055 | -0.106 | -0.353 | -0.109 | -0.197 | -0.541 | ||||
| average | -0.047 | -0.069 | -0.219 | -0.090 | -0.108 | -0.362 | ||||
| Samples as Support | References as Support | Controls | ||||||||
|---|---|---|---|---|---|---|---|---|---|---|
| Numbers | NEs | Nouns | Numbers | NEs | Nouns | Samples | Ref. | |||
| de-en | add | -0.243 | -0.229 | -0.337 | -0.417 | -0.382 | -0.523 | altern. | 0.026 | |
| del | -0.217 | -0.180 | -0.261 | -0.380 | -0.295 | -0.410 | copy | -0.471 | -0.409 | |
| sub | -0.152 | -0.223 | -0.347 | -0.256 | -0.402 | -0.542 | hallucin. | -1.076 | -1.724 | |
| whole | -0.312 | -0.197 | -0.320 | -0.529 | -0.374 | -0.521 | ||||
| en-de | add | -0.224 | -0.210 | -0.231 | -0.405 | -0.379 | -0.379 | altern. | -0.017 | |
| del | -0.197 | -0.156 | -0.148 | -0.319 | -0.261 | -0.262 | copy | -1.142 | -1.133 | |
| sub | -0.129 | -0.196 | -0.250 | -0.213 | -0.352 | -0.392 | hallucin. | -1.370 | -1.895 | |
| whole | -0.275 | -0.196 | -0.339 | -0.493 | -0.351 | -0.516 | ||||
| average | -0.219 | -0.198 | -0.279 | -0.377 | -0.350 | -0.511 | ||||
| Samples as Support | References as Support | Controls | ||||||||
|---|---|---|---|---|---|---|---|---|---|---|
| Numbers | NEs | Nouns | Numbers | NEs | Nouns | Samples | Ref. | |||
| de-en | add | -0.435 | -0.412 | -0.401 | -0.706 | -0.687 | -0.617 | altern. | 0.024 | |
| del | -0.385 | -0.331 | -0.293 | -0.655 | -0.526 | -0.450 | copy | -0.306 | -0.234 | |
| sub | -0.305 | -0.547 | -0.394 | -0.472 | -0.667 | -0.614 | hallucin. | -1.225 | -1.962 | |
| whole | -0.547 | -0.267 | -0.320 | -0.889 | -0.495 | -0.539 | ||||
| en-de | add | -0.381 | -0.337 | -0.337 | -0.657 | -0.635 | -0.575 | altern. | -0.015 | |
| del | -0.355 | -0.254 | -0.230 | -0.614 | -0.457 | -0.402 | copy | -0.852 | -0.755 | |
| sub | -0.264 | -0.322 | -0.351 | -0.437 | -0.585 | -0.570 | hallucin. | -1.498 | -2.046 | |
| whole | -0.470 | -0.271 | -0.370 | -0.827 | -0.484 | -0.550 | ||||
| average | -0.393 | -0.343 | -0.337 | -0.657 | -0.567 | -0.540 | ||||
Appendix D Retraining with Different Penalties
Tables 8, 9, 10 show the results of the sensitivity analysis for the retrained models with penalties of -0.2, -0.5 and -0.8 respectively. The difference between the sensitivity scores for numbers / named entities and for random nouns becomes smaller as the penalty increases. With a penalty of -0.8, we see that for most error types the sensitivity scores for random nouns are either lower than either (blue) or both (green) for numbers and named entities. Note that the differences in MBR score compared to the reference (left) and the 1-best beam search output (right) also become larger as the penalties increase. However, this does not affect on the models’ ability to score real translations as we confirm in Section F.
Appendix E Retraining with Different Amounts of Synthetic Data
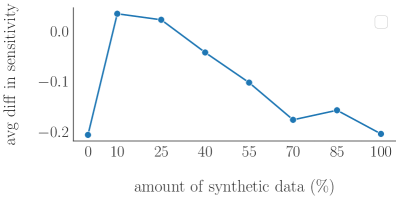
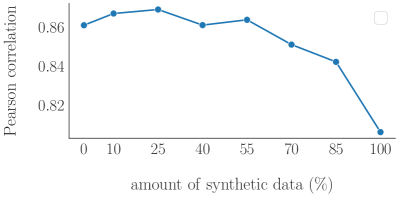
Aside from varying the penalties for retraining COMET (see Appendix D), we can also vary the amount of synthetic data. Using the best performing penalty from before (0.8), we run experiments with 0%, 10%, 25%, 40%, 55%, 70%, 85% and 100% synthetic data for retraining COMET. Note that 0% corresponds to the original wmt20-comet-da model and 10% corresponds to retrain-comet-da in the main paper experiments. We evaluate these models based on two factors: 1) the average difference in sensitivity between the number and named entity error types and the random nouns (corresponding to an average over the individual columns in Figure 1) and 2) the change in Pearson correlation compared to wmt20-comet-da. The first measure indicates how the retrained models’ sensitivity to numbers and named entities changes compared to random nouns with increased synthetic data. The second measure shows whether an increased amount of synthetic data reduces the agreement with human judgements (this is computed as described in Appendix F).
Figure 2 shows that with an increased percentage of synthetic data, the difference between sensitivity towards nouns and named entities and towards random noun changes first becomes smaller (at 10% synthetic). When we further increase the amount of synthetic data, this improvement gradually decreases as the model sees less and less contrasting examples and more and more only examples with number mismatches.
Increasing the amount of synthetic data during retraining also has an effect on the correlation with human judgements. We show this in Figure 3. Similarly to the difference in sensitivity, the correlation with human judgements also improves with small amounts of synthetic data (10% and 25%) but then decreases slowly as the amount of synthetic data is increased further. These additional experiments show that using 10% of synthetic data is a sensible choice for our main experiments.
Appendix F Correlation with Human Evaluators
We use our retrained retrain-comet-da models to score all systems that are part of the WMT 2020 metrics shared task evaluation (Mathur et al., 2020).121212We run the run_ref_metrics.sh script provided at https://drive.google.com/drive/folders/1n_alr6WFQZfw4dcAmyxow4V8FC67XD8p Then, we use the official evaluation script131313https://github.com/WMT-Metrics-task/wmt20-metrics from the WMT 2020 shared task to compute the system-level Pearson correlation for our retrained models. The results can be seen in Table 11. We also ensure that evaluation setup results in the same scores as in the WMT 2020 publication (Mathur et al., 2020) when we use wmt20-comet-da to score the systems. For most language pairs, all models reach an almost identical correlation with human assessments.
| wmt20-comet-da | retrain-comet-da | |||
|---|---|---|---|---|
| -0.2 | -0.5 | -0.8 | ||
| en-cs | 0.978 | 0.981 | 0.981 | 0.981 |
| en-de | 0.972 | 0.971 | 0.965 | 0.963 |
| en-ja | 0.974 | 0.987 | 0.974 | 0.982 |
| en-pl | 0.981 | 0.983 | 0.985 | 0.983 |
| en-ru | 0.925 | 0.863 | 0.900 | 0.918 |
| en-ta | 0.944 | 0.948 | 0.949 | 0.954 |
| en-zh | 0.007 | 0.026 | 0.034 | 0.049 |
| en-iu | 0.860 | 0.861 | 0.851 | 0.873 |
| cs-en | 0.783 | 0.799 | 0.798 | 0.808 |
| de-en | 0.998 | 0.996 | 0.995 | 0.997 |
| ja-en | 0.964 | 0.966 | 0.968 | 0.968 |
| pl-en | 0.591 | 0.570 | 0.570 | 0.563 |
| ru-en | 0.923 | 0.924 | 0.921 | 0.925 |
| ta-en | 0.880 | 0.888 | 0.887 | 0.890 |
| zh-en | 0.952 | 0.952 | 0.942 | 0.951 |
| iu-en | 0.852 | 0.878 | 0.866 | 0.880 |
| km-en | 0.971 | 0.981 | 0.981 | 0.974 |
| ps-en | 0.941 | 0.951 | 0.949 | 0.945 |
| avg diff | +0.0016 | -0.0006 | +0.0060 | |