A nitrogen-rich atmosphere on ancient Mars consistent with isotopic evolution models
Abstract
The ratio of nitrogen isotopes in the Martian atmosphere is a key constraint on the planet’s atmospheric evolution. However, enrichment of the heavy isotope expected due to atmospheric loss from sputtering and photochemical processes is greater than measurements. A massive, multi-bar early \ceCO2-dominated atmosphere and recent volcanic outgassing have been proposed to explain this discrepancy, and many previous models have assumed atmospheric nitrogen rapidly reached a steady state where loss to space balanced volcanic outgassing. Here we show using time-dependent models that the abundance and isotopic composition of nitrogen in the Martian atmosphere can be explained by a family of evolutionary scenarios in which the initial partial pressure of nitrogen is sufficiently high that a steady state is not reached and nitrogen levels gradually decline to present-day values over 4 billion years. Our solutions do not require a multi-bar early \ceCO2 atmosphere and are consistent with volcanic outgassing indicated by both geologic mapping and the atmospheric 36Ar/38Ar ratio. Monte Carlo simulations that include these scenarios estimate that the partial pressure of \ceN2 was 60 – 740 mbar (90% confidence, with a median value of 310 mbar) at 3.8 billion years ago when the valley networks formed. We suggest that such a high nitrogen partial pressure could have contributed substantially to warming on early Mars.
Jet Propulsion Laboratory, California Institute of Technology, Pasadena, CA 91109, USA, email: renyu.hu@jpl.nasa.gov
Division of Geological and Planetary Sciences, California Institute of Technology, Pasadena, CA 91125, USA
Department of Earth and Space Sciences and Astrobiology Program, University of Washington, Seattle, WA 98195, USA
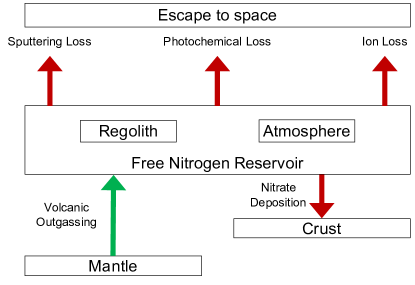
We have constructed a multi-functional model for the evolution of the nitrogen’s abundance and isotopic composition in Mars’s atmosphere and regolith, with volcanic outgassing, escape to space, and nitrate deposition as sources and sinks (Methods and Fig. E1). The model starts at 3.8 Ga, i.e., after the last major impact ( Ga[1, 2]), and from a N value of the mantle component measured in the Martian meteorite ALH 84001[3]. N is defined as the relative enhancement of the ratio 15N/14N with respect to a reference standard (Earth’s atmosphere). During the modeled period, the escape processes include photochemical escape, sputtering, and ion escape. We seek to reproduce the present-day size and isotopic composition of the \ceN2 reservoir[4]. The model has seven parameters, listed in Table 1, to capture the uncertainty in the rates of escape, volcanic outgassing, and nitrate deposition, as well as the extent of diffusive fractionation between the bulk atmosphere and the exobase, where escape takes place.
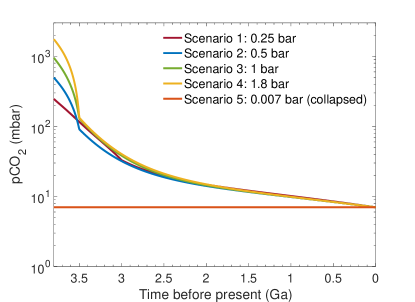
Compared with previous evolutionary models of Mars nitrogen[5, 6, 7, 8, 9, 10, 11, 12] (Supplementary Information A), new aspects of this model include: (1) a revised photochemical escape rate and fractionation factor; (2) inclusion of nitrate deposition guided by its recent discovery[13, 14]; (3) constraints of the volcanic outgassing history from argon isotopes[15]; and (4) coupling with the \ceCO2 evolution histories constrained by carbon isotopes[16]. We have made a substantial revision to the escape rate of the photodissociation of \ceN2 and have calculated the fractionation factor in this process, using the photochemical isotope effect method[16] and the recent experimental results on the \ceN2 photodissociation channels[17] (Supplementary Information B). Because the escape rate of nitrogen is also proportional to the mixing ratio of \ceN2 with respect to \ceCO2 when nitrogen is a relatively minor species in the atmosphere, the nitrogen evolution model must be coupled with evolutionary scenarios of \ceCO2. We have applied representative \ceCO2 evolution scenarios[16], where the initial pressure ranges in 0.25 – 1.8 bars (Fig. E2), and adopted the \ceCO2 scenario with an initial partial pressure of 1.0 bar as the default because it may be more consistent with the comprehensive extrapolation from Mars Atmosphere and Volatile Evolution (MAVEN) measurements[18, 19] and required to cause water ice melting on early Mars’s surface[20, 21].
| Parameter | Symbol | Unconstrained MCMC | Constrained MCMC |
|---|---|---|---|
| Power-law index of photochemical loss | 0.5 - 3.0 | 0.5 - 3.0 | |
| Multiplier of photochemical loss | 0.001 - 100 | 0.001 - 2 | |
| Multiplier of sputtering loss | 0.001 - 100 | 0.001 - 2 | |
| Multiplier of volcanic outgassing | 0.001 - 100 | 0.001 - 2 | |
| Diffusion parameter (km/K) | 0.2 - 0.5 | 0.2 - 0.5 | |
| Depth of nitrate deposition (m) | 0.001 - 1000 | 0.001 - 1000 | |
| Partial pressure of \ceN2 at 3.8 Ga (mbar) | 0.001 - 1000 | 0.001 - 1000 |
0.1 Bifurcation.
We discovered a bifurcation between the evolutionary tracks starting from a low \ceN2 partial pressure and those from a high one. The low-start solutions feature the “steady state,” where atmospheric loss balances outgassing and nitrate deposition, while the high-start solutions never reach the steady state (Fig. 1). When the initial \ceN2 partial pressure is low, the rate of atmospheric escape quickly converges with the combined rate of outgassing and nitrate deposition, i.e., the steady state. Over a wide range of the initial pressure, it takes a few hundred million years to reach the steady state. The time it takes, however, does increases for a higher initial pressure. When the initial pressure is high enough (e.g., a few 100 mbar or more), the steady state is never reached within the age of the Solar System, and a different family of evolution tracks emerges. We call this new family ‘dynamical.’ The dynamical tracks have a protracted descent of the partial pressure of \ceN2 during evolution rather than a speedy descent to the steady state. While the steady-state tracks converge to the same final partial pressure, the dynamical tracks lead to different final partial pressures depending on the initial value. For the same set of parameters, the final pressures of the dynamical tracks are always higher than the final pressure of the steady-state tracks (Fig. 1).
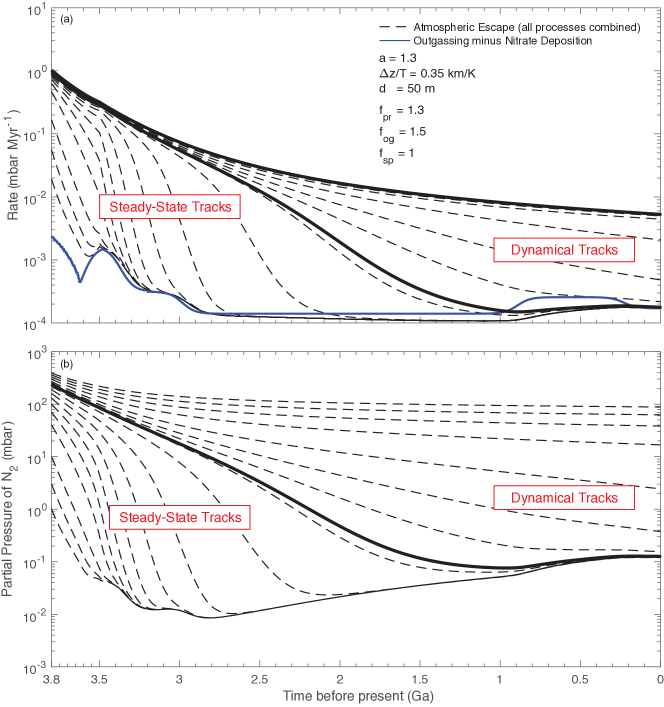
The bifurcation can be understood with the help of the following idealized and analytical model. Let be the size of the nitrogen reservoir, be the addition rate to this reservoir by volcanic outgassing (discounted by the rate of nitrate deposition, if any), and be the escape rate. When the size of the nitrogen reservoir is small compared with the carbon reservoir, the escape is proportional to its size (Methods), and at the limit of a constant background \ceCO2 pressure, we can write , where is a coefficient. The equation for is then
| (1) |
For a constant and , the equation has following solution
| (2) |
where is at . Therefore, the solution converges to the steady state with a timescale of . Note that the solution in Eq. (2), despite its idealized nature, is quite similar to the segment of a given steady-state solution that rapidly approaches the steady state (Fig. 1). Currently the timescale for sputtering loss is Myr[23], and that for photochemical loss is Myr[8]. The corresponding timescales were Myr and Myr (for a power-law index of 1.5) at 3.5 Ga when the solar extreme ultraviolet (EUV) flux was approximately 6 times the current value (see Methods). These estimates tell us that (1) it is possible to reach the steady state in the early evolution and it becomes harder as time goes by; and (2) sputtering loss is the main process that drives the system to the steady state in the early epoch (because of its small timescale).
Then, why do some evolution tracks never reach the steady state? This is because the sputtering rate is no longer proportional to the size of the nitrogen reservoir when the atmosphere is moderately nitrogen-rich (see Eq. 9 in Methods). The sputtering rate decouples when the size of the nitrogen reservoir approaches the size of the carbon reservoir, corrected by the diffusive separation factor between \ceN2 and \ceCO2. This factor is for typical upper-atmosphere conditions[22], implying that \ceN2 cannot be considered a minor component for determining the sputtering rate when it is approximately 10% or more in the bulk atmosphere. Because of this decoupling, can no longer be written as and the steady state no longer exists. The bifurcation can thus be understood as such: when the initial nitrogen pressure is small, the system can quickly reach the steady state following the solution in Eq. (2); when the initial nitrogen pressure is large, the atmosphere must first lose nitrogen relative to carbon, on a linear rather than exponential time dependency, and by the time it starts to converge to the steady state, the timescale is already large, and then the steady state can never be reached within the age of the Solar System.
0.2 Steady-State and Dynamical Solutions.
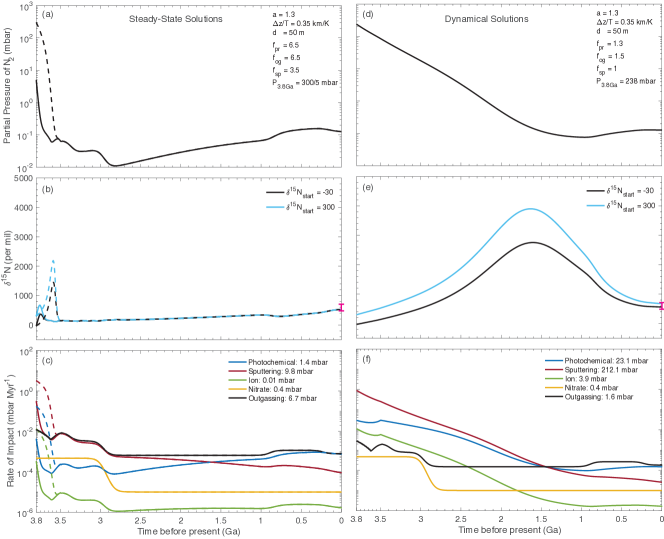
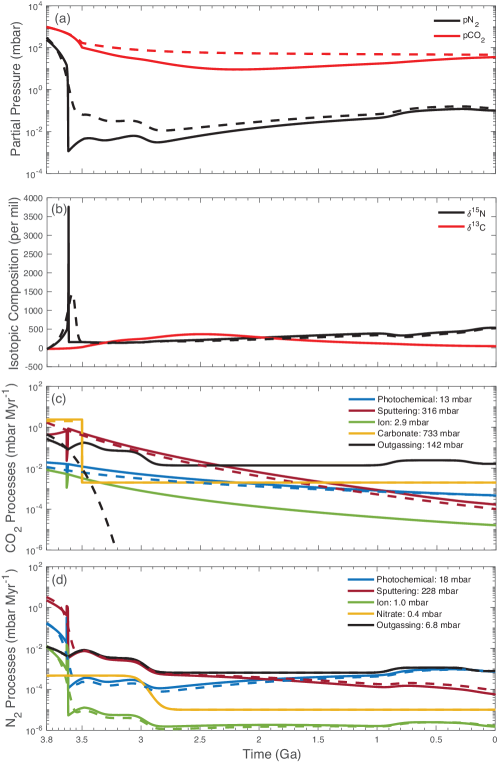
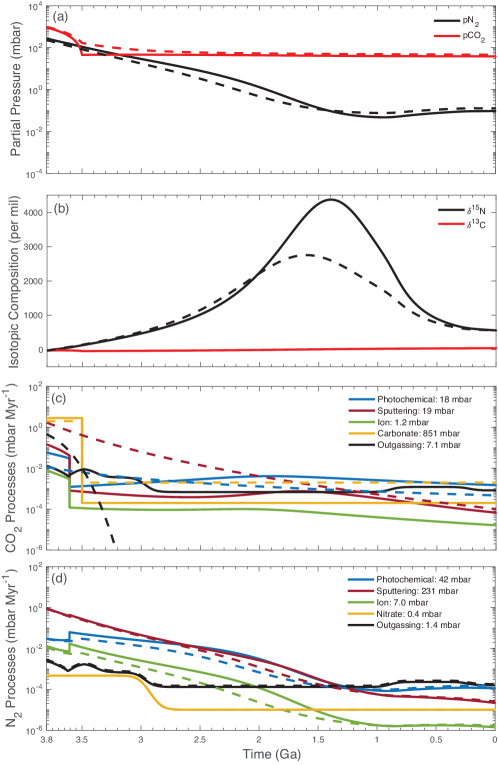
The present-day size and isotopic composition of the nitrogen reservoir can be matched by either the steady-state or the dynamical evolution tracks by adjusting the parameters for the rates of outgassing and escape. Fig. 2 shows example steady-state and dynamical solutions. In these solutions, sputtering removes most of the mass in total, while photochemical escape takes over as the dominant mass-loss mechanism around Ga before present. In the dynamical solution, the initial partial pressure is 238 mbar, and sputtering removes 212 mbar and photochemical escape removes 23 mbar. Nitrate deposition, which can be comparable to volcanic outgassing in rates Ga before present, is not a dominant sink in the more recent history. Outgassing is an important process in the recent history, and as a result, specific implementation of the outgassing baseline model (Fig. E3) can affect the evolutionary outcome.
For the steady-state solutions shown in Fig. 2, increasing the initial partial pressure to a critical value of bars does not change the evolutionary outcome, but an even higher initial pressure would lead to bifurcation and a dynamical track. That track is no longer a solution because the final pressure would be too high. For the dynamical solution shown in Fig. 2, which uses smaller rate multipliers ( and ) compared to the steady-state solutions, an initial partial pressure of mbar already causes the dynamical evolution. Further decreasing the initial partial pressure would result in a steady-state track in this case, but that track is not a solution either because the final N would be substantially smaller than the observed. From these examples, we make the following three observations. (1) The insensitivity to the initial pressure of the steady-state solutions is consistent with the understanding in the past, that the memory of the initial state is ‘lost’ for the nitrogen evolution[12]. However, this understanding only applies to the scenarios where the initial partial pressure is less than a critical value at which the bifurcation occurs. (2) The critical pressure increases for higher escape rates or greater photochemical loss and sputtering multipliers ( and ). (3) The dynamical solutions are typically the evolution tracks that are quite close to the transitional track between the steady-state and the dynamical tracks. This is not surprising because the final partial pressure of the dynamical tracks quickly diverge to large values, which would be inconsistent with the present-day Mars (Fig. 1). As a result of this adjacency to the steady-state solutions, the final isotopic composition only moderately depends on the initial value (Fig. 2). Because of all these features, if the dynamical solutions indeed apply to Mars, the current isotopic composition can be used to infer the partial pressure of nitrogen in the past.
0.3 A Nitrogen-rich Early Martian Atmosphere.
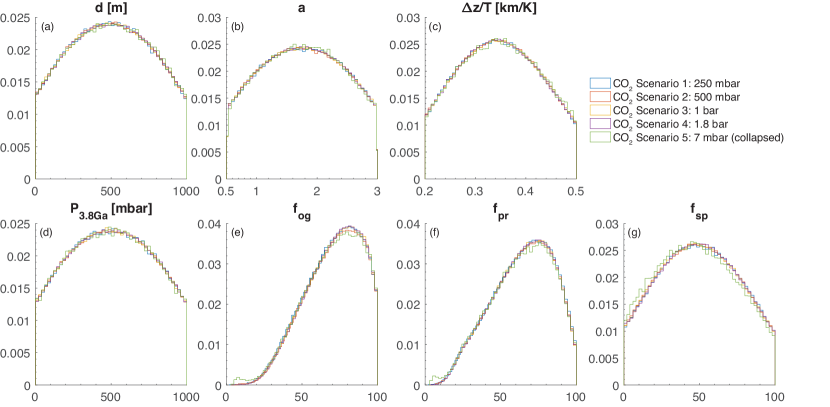
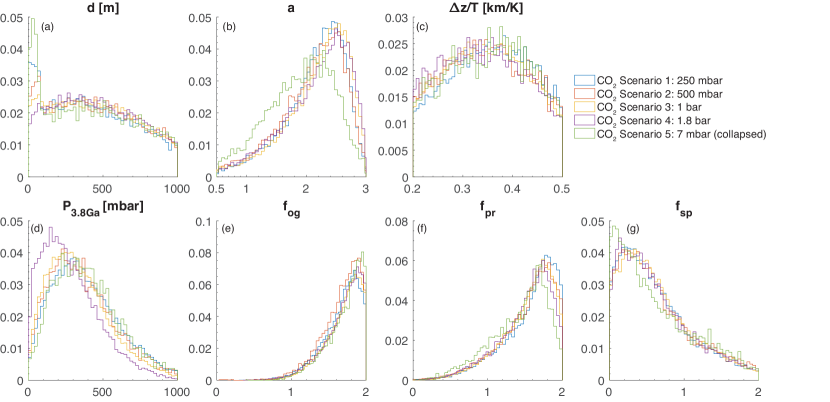
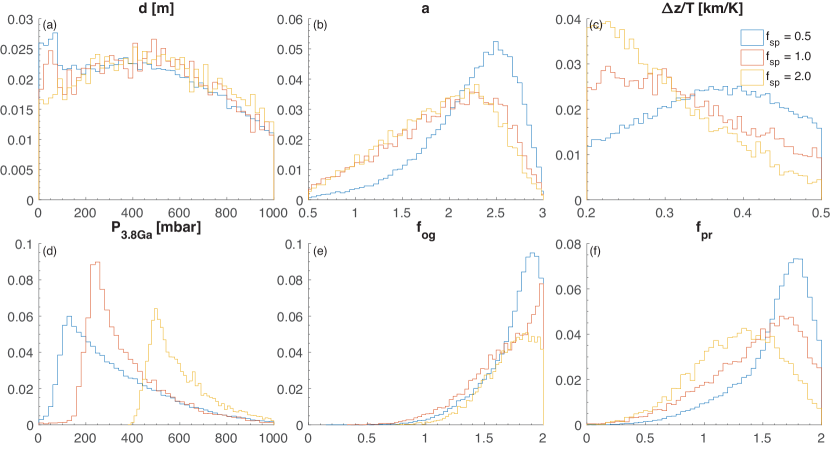
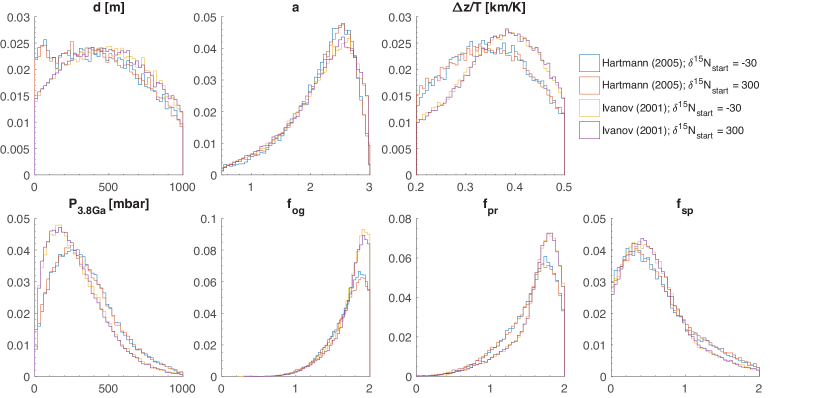
We have systematically explored the potential evolutionary paths of Mars nitrogen with the Markov-Chain Monte Carlo (MCMC) method to fit the present-day partial pressure and isotopic composition. Using the parameters listed in Table 1, we have run ‘unconstrained MCMC’ where the rate multipliers are allowed to vary in wide ranges, and also ‘constrained MCMC’ where the outgassing multiplier is only allowed to vary within the upper limit derived from argon isotopes[15] and the escape rates are allowed to vary up to twice the baseline models[8, 23]. Because the baseline volcanism model is consistent with the one adopted in the argon isotope study (Fig. E3), the argon-based constraint is applicable here to the extent that Mars’s mantle has a similar N/Ar ratio as Earth. The constrained MCMCs can thus be understood as exploring the scenarios permitted by the argon isotopes and the current understanding of nonthermal escape from Mars. The posterior distributions of parameters are shown in Figs. E4-E6, and solutions randomly selected from the unconstrained and constrained MCMCs are shown in Fig. 3.
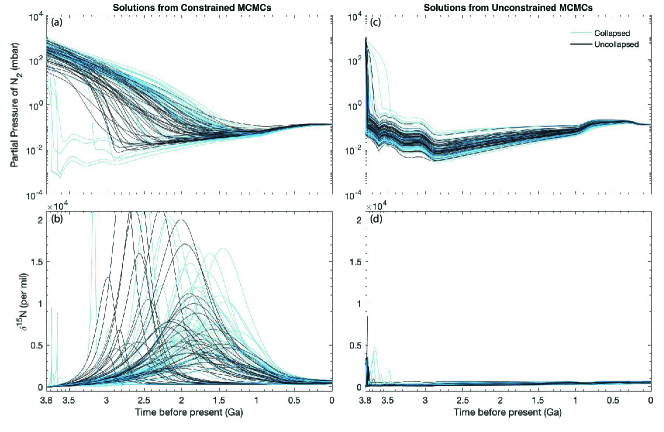
When there is essentially no limit on the rate multipliers, the steady-state solutions can be found with large escape and outgassing rates (Supplementary Information E). When we impose the upper limits on the rate multipliers (i.e., the constrained MCMCs), the escape rates are smaller, and thus the solutions take a longer time to reach the corresponding steady states, or cannot reach the steady states at all (Fig. 3). In this case, the initial partial pressure of \ceN2 is constrained despite all other model parameters (Figs. E5 and E6) and is not sensitive to the specific implementation of the baseline outgassing model, the initial N value, or potential variation of the parameter over the course of evolution (Supplementary Information F). The spread in the posterior distribution of the initial pressure mainly comes from the uncertainty of the sputtering rate as sputtering is the dominant mass removal mechanism. Fig. E6 shows that the posterior distribution becomes very narrow when the sputtering multiplier is fixed and moves to higher values when the multiplier increases.
For the sputtering rate within a factor of 2 from the current estimate[23], the evolution model constrains the partial pressure of nitrogen at 3.8 Ga to 60 – 740 mbar (90% confidence), with a median value of 310 mbar (Fig. E5). The median value increases to 370 mbar when the atmosphere collapse is enforced. While we caution against placing too much emphasis on these specific values, the MCMCs clearly indicate a nitrogen-rich early Martian atmosphere. The ability to constrain the early abundance of \ceN2 fundamentally comes from the solutions being (close to) dynamical when the realistic constraints from argon isotopes and nonthermal escape models are imposed. We thus suggest that the dynamical solutions or the solutions that reach the steady states late in the evolution may better represent the evolution of nitrogen on Mars.
The dynamical solutions imply an \ceN2-rich atmosphere on early Mars, for which the escape rate of carbon would be reduced compared to the rate for a \ceCO2-dominated atmosphere. We thus present models of the \ceCO2-\ceN2 evolution that include this feedback in Supplementary Information G. In essence, self-consistent solutions can be found with small changes of the input parameters, and the character of the steady-state and dynamical solutions remains unchanged. While the high initial \ceN2 in the dynamical solutions may suppress the escape of carbon, the amount of early carbonate deposition is poorly constrained[16] and so is the initial partial pressure of \ceCO2. Figs. E4 and E5 show that the nitrogen evolution models and the associated constraints on the nitrogen’s partial pressure at 3.8 Ga are insensitive to the specifics of the adopted \ceCO2 evolutionary history in the wide range that has been explored. Therefore, an initially large \ceN2 reservoir preferred by the isotopic constraints is fully compatible with an initially large \ceCO2 reservoir.
One might ask if Mars started with nearly equal abundances of \ceN2 and \ceCO2 in the atmosphere, why does it currently have a \ceCO2-dominated atmosphere? The atmospheric composition is deflected towards \ceCO2 dominance because \ceN2 is much more prone to sputtering loss than \ceCO2. With equal mixing ratios in the bulk atmosphere, the sputtering loss rate of \ceN2 is times higher than that of \ceCO2, with a factor of from diffusive enrichment and a factor of from the difference in the sputtering yield (see Eq. 7). Thus, sputtering can quickly reduce the \ceN2 abundance in the Noachian and Hesperian periods to establish the \ceCO2-dominated atmosphere. This preferential lost of \ceN2 versus \ceCO2 may well be a common feature of nonthermal escape from unmagnetized planets and might affect the evolutionary outcomes of terrestrial exoplanets.
Another question is how to form the nitrogen-rich atmosphere on Mars in the first place. The ratio between \ceCO2 and \ceN2 was probably in volcanic outgassing[24, 25, 26]. Thus, we speculate that the atmosphere at 3.8 Ga primarily came from the late veneer of primitive bodies such as comets that have low C/N ratios[27], after the atmosphere built by earlier volcanic outgassing had been removed by hydrodynamic escape[28]. If the cometary origin was the case, the initial N might be higher than what we have assumed ([29]). Nonetheless, the evolution models and isotope-based constraints are not sensitive to this variation of the initial N.
Measurements of future in-situ or sample return exploration can further delineate the steady-state versus dynamical nitrogen evolution. Fig. 3 shows that the N value of the dynamical solutions has a broad peak between 3.5 and 1 Ga (i.e., the Hesperian and early Amazonian periods), and that of the steady-state solutions does not. The magnitude of the peaks with a non-collapsed atmosphere is , and that with a collapsed atmosphere can be even larger. If some of this signal is transferred to the nitrates formed in the early Amazonian, isotopic analyses of nitrate samples could provide additional evidence for the dynamical evolution of nitrogen as well as the atmospheric collapse in the history of Mars.
Under the new interpretation of nitrogen’s isotopic composition presented here, a few hundred mbar \ceN2 may have existed in the Martian atmosphere at 3.8 Ga. Previous one-dimensional (1D) radiative-convective climate models have determined that this amount of additional nitrogen could cause the mean surface temperature to be K warmer than a pure, 1-bar \ceCO2 atmosphere via pressure broadening of \ceCO2 absorption bands[21]. The additional few hundred mbar \ceN2, coupled with substantial early carbonate deposition, may thus be particularly meaningful for sustaining surface melting at low topographic regions[20]. The climate conditions on early Mars have been a conundrum[30, 31, 32], and our findings may provide a new path forward for explaining the geologic records[33] that suggest persisting liquid-water conditions on ancient Mars’s surface.
References
- [1] Fassett, C. I. & Head, J. W. Sequence and timing of conditions on early mars. Icarus 211, 1204–1214 (2011).
- [2] Robbins, S. J., Hynek, B. M., Lillis, R. J. & Bottke, W. F. Large impact crater histories of mars: The effect of different model crater age techniques. Icarus 225, 173–184 (2013).
- [3] Mathew, K. & Marti, K. Early evolution of martian volatiles: Nitrogen and noble gas components in alh84001 and chassigny. Journal of Geophysical Research: Planets 106, 1401–1422 (2001).
- [4] Wong, M. H. et al. Isotopes of nitrogen on mars: Atmospheric measurements by curiosity’s mass spectrometer. Geophysical Research Letters 40, 6033–6037 (2013).
- [5] McElroy, M. B. & Yung, Y. L. Isotopic composition of the martian atmosphere. Science 194, 68–70 (1976).
- [6] McElroy, M. B., Yung, Y. L. & Nier, A. O. Isotopic composition of nitrogen: Implications for the past history of mars’ atmosphere. Science 194, 70–72 (1976).
- [7] Fox, J. L. & Dalgarno, A. Nitrogen escape from mars. Journal of Geophysical Research: Space Physics 88, 9027–9032 (1983).
- [8] Fox, J. L. The production and escape of nitrogen atoms on mars. Journal of Geophysical Research: Planets 98, 3297–3310 (1993).
- [9] Jakosky, B. M., Pepin, R. O., Johnson, R. E. & Fox, J. L. Mars atmospheric loss and isotopic fractionation by solar-wind-induced sputtering and photochemical escape. Icarus 111, 271–288 (1994).
- [10] Zent, A. P. & McKay, C. P. The chemical reactivity of the martian soil and implications for future missions. Icarus 108, 146–157 (1994).
- [11] Fox, J. L. & Hać, A. The 15n/14n isotope fractionation in dissociative recombination of n2+. Journal of Geophysical Research: Planets 102, 9191–9204 (1997).
- [12] Kurokawa, H., Kurosawa, K. & Usui, T. A lower limit of atmospheric pressure on early mars inferred from nitrogen and argon isotopic compositions. Icarus 299, 443–459 (2018).
- [13] Stern, J. C. et al. Evidence for indigenous nitrogen in sedimentary and aeolian deposits from the curiosity rover investigations at gale crater, mars. Proceedings of the National Academy of Sciences 112, 4245-4250 (2015).
- [14] Sutter, B. et al. Evolved gas analyses of sedimentary rocks and eolian sediment in gale crater, mars: Results of the curiosity rover’s sample analysis at mars instrument from yellowknife bay to the namib dune. Journal of Geophysical Research: Planets 122, 2574–2609 (2017).
- [15] Slipski, M. & Jakosky, B. M. Argon isotopes as tracers for martian atmospheric loss. Icarus 272, 212–227 (2016).
- [16] Hu, R., Kass, D. M., Ehlmann, B. L. & Yung, Y. L. Tracing the fate of carbon and the atmospheric evolution of mars. Nature communications 6, 10003 (2015).
- [17] Song, Y. et al. Quantum-state dependence of product branching ratios in vacuum ultraviolet photodissociation of n2. The Astrophysical Journal 819, 23 (2016).
- [18] Jakosky, B. M. et al. Loss of the martian atmosphere to space: Present-day loss rates determined from maven observations and integrated loss through time. Icarus 315, 146–157 (2018).
- [19] Jakosky, B. M. The co2 inventory on mars. Planetary and Space Science 175, 52–59 (2019).
- [20] Forget, F. et al. 3d modelling of the early martian climate under a denser co2 atmosphere: Temperatures and co2 ice clouds. Icarus 222, 81–99 (2013).
- [21] von Paris, P., Grenfell, J. L., Rauer, H. & Stock, J. W. N2-associated surface warming on early mars. Planetary and Space Science 82, 149–154 (2013).
- [22] Jakosky, B. M. et al. Mars’ atmospheric history derived from upper-atmosphere measurements of 38ar/36ar. Science 355, 1408–1410 (2017).
- [23] Leblanc, F. & Johnson, R. Role of molecular species in pickup ion sputtering of the martian atmosphere. Journal of Geophysical Research: Planets 107, 5010 (2002).
- [24] McKay, C. P. & Stoker, C. R. The early environment and its evolution on mars: Implication for life. Reviews of Geophysics 27, 189–214 (1989).
- [25] Marty, B. & Dauphas, N. The nitrogen record of crust–mantle interaction and mantle convection from archean to present. Earth and Planetary Science Letters 206, 397–410 (2003).
- [26] Hirschmann, M. M. & Withers, A. C. Ventilation of co2 from a reduced mantle and consequences for the early martian greenhouse. Earth and Planetary Science Letters 270, 147–155 (2008).
- [27] Bergin, E. A., Blake, G. A., Ciesla, F., Hirschmann, M. M. & Li, J. Tracing the ingredients for a habitable earth from interstellar space through planet formation. Proceedings of the National Academy of Sciences 112, 8965–8970 (2015).
- [28] Tian, F., Kasting, J. F. & Solomon, S. C. Thermal escape of carbon from the early martian atmosphere. Geophysical Research Letters 36, L02205 (2009).
- [29] Marty, B. The origins and concentrations of water, carbon, nitrogen and noble gases on earth. Earth and Planetary Science Letters 313, 56–66 (2012).
- [30] Ramirez, R. M. et al. Warming early mars with co 2 and h 2. Nature Geoscience 7, 59–63 (2014).
- [31] Kite, E. S. et al. Methane bursts as a trigger for intermittent lake-forming climates on post-noachian mars. Nature Geoscience 10, 737–740 (2017).
- [32] Wordsworth, R. et al. Transient reducing greenhouse warming on early mars. Geophysical Research Letters 44, 665–671 (2017).
- [33] Grotzinger, J. et al. Deposition, exhumation, and paleoclimate of an ancient lake deposit, gale crater, mars. Science 350, aac7575 (2015).
0.4 Overview.
The model starts at 3.8 Ga before the present and simulates the loss and addition of \ceN2 in a combined reservoir of the atmosphere and the regolith (by adsorption) until the present day. It includes five addition and loss mechanisms shown in Fig. E1. When tracing the evolution, the model uses a variable time step adapted to allow no more than 0.05% change in the \ceN2 reservoir per step. This ensures that the temporal resolution is high enough to capture important details of the atmosphere’s evolution.
An evolutionary solution must reach the present-day size and isotopic composition of the \ceN2 reservoir. The size of the atmospheric reservoir is 0.12 mbar and that of the regolith reservoir is up to 0.01 mbar[1]. The upper limit corresponds to adsorption in up to 10 m global equivalent of the Martian regolith having m2 g-1 surface area[2]. The isotopic composition of the present-day nitrogen reservoir is N [4]. We do not include potential fractionation between the atmosphere and the regolith because the regolith reservoir size is minor compared with the atmosphere.
The initial size of the nitrogen reservoir is a free parameter of the model. The initial N value of the reservoir, however, is uncertain. For the nominal cases, we assume the initial reservoir to have the isotopic composition of the mantle component of the nitrogen measured in the Martian meteorite ALH 84001[3] (N). Nonetheless, escape and giant impacts that occurred before the modeled period may have modified the N value from the mantle value, and previous estimates suggest that the N value can vary rapidly between the mantle value and up to more than 3.8 Ga before the present[12]. We thus explore the effect of an elevated initial N value (e.g., , Supplementary Information F).
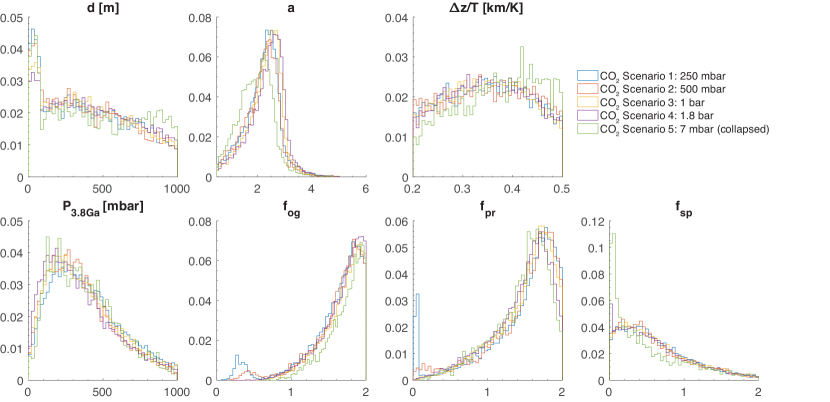
To calculate the mixing ratio of \ceN2 (needed for calculating the escape rates), the model is coupled with an evolution model of \ceCO2[16] for the same modeled period. The model of \ceCO2 includes photochemical loss, sputtering loss, volcanic outgassing, and carbonate deposition[16], but not the feedback of the \ceN2 mixing ratio on the escape rates of carbon. We present fully coupled carbon and nitrogen evolution models in Supplementary Information G. Otherwise, we explore nitrogen’s evolutionary history by adopting the \ceCO2 evolutionary scenarios with an initial partial pressure of \ceCO2 ranging from 0.25 to 1.8 bar (Scenarios 1 – 4 in Fig. E2). These scenarios are selected to represent a wide range of possible \ceCO2 evolutionary tracks: in essence, carbon’s isotopic composition constrains the relative strengths between photochemical loss and carbonate deposition, while the amount of carbonate deposition – and thus the initial pressure – can typically vary by a few hundred mbars due to the range in the possible timing and fractionation factor of carbonate deposition, as well as the uncertainties in the carbon isotope’s measurement, outgassing models, and sputtering rates. The representative scenarios adopted here approximately encompass the lower and upper bounds of the \ceCO2 partial pressure at 3.8 Ga allowed by the carbon isotopic composition[16].
We also include the endmember scenario of a collapsed atmosphere (Scenario 5 in Fig. E2). It has been suggested that the atmosphere of Mars can collapse to form large polar \ceCO2 ice caps during low-obliquity periods and the remaining atmosphere would be in vapor pressure balance with the ice caps[3, 20, 4]. The collapse of \ceCO2 may matter for the evolution of nitrogen because it greatly increases the mixing ratio of \ceN2 in the atmosphere. For example, the latest nitrogen evolution model[12] assumed that atmospheres with \ceCO2 partial pressure mbar collapse. Here we explore the effect of the collapse with an endmember scenario where the atmosphere is considered always ‘collapsed,’ i.e., maintaining a \ceCO2 partial pressure of 7 mbar.
0.5 Photochemical Escape.
The photochemical escape rate of nitrogen () is modeled as
| (3) |
where the quantities with the subscript 0 are at the current epoch, is the solar EUV flux for which we adopt as where is the age[5, 6, 7], is the mixing ratio of \ceN2 in the bulk atmosphere, is a power-law index, and is a multiplication factor. The photochemical escape rate is proportional to the mixing ratio of \ceN2 in the atmosphere[7]. The power-law index and the multiplication factor provide sufficient freedom for the model to capture the uncertainties in the photochemical escape rate and how it has changed with the solar input. This parameterization also consolidates the uncertainty in the age dependency of the solar EUV flux into (Supplementary Information F).
We break down the photochemical escape into major escape mechanisms because they have different isotopic fractionation factors, as
| (4) |
where , , and are the rates of escape produced by photodissociation and photoionization, dissociative recombination, and other chemical reactions, respectively. The current-epoch rates of these processes are baselined by the upper-atmosphere models of Fox (1993)[8], except for the photodissociation escape rate, which we reevaluated in Supplementary Information B. We assume that the scaling in Eq. (3) applies equally to these processes. Technically speaking, the photodissociation escape is driven by higher energy parts of the solar EUV flux (e.g., the Lyman continuum) and should have a different scaling. Applying the same scaling however is not a problem because we find that the photodissociation escape rate turns out to be minimal.
The isotopic fractionation factor () of each of these processes is the product of the fractionation factor due to diffusive separation from the homopause to the exobase (), and the fractionation factor when the escaping particles are launched by these processes near the exobase (), as
| (5) |
The diffusive separation is modeled as
| (6) |
where is Mars’s surface gravity, is the mass difference of the atoms or isotopologues in question, is the distance from the homopause to the exobase, is the Boltzmann constant, and is the mean temperature of the thermosphere. We include the effect of diffusive separation from the homopause all the way to the exobase, even though the peak of the photodissociation rate occurs well below the exobase[8], because only the energetic particles sourced at altitudes close to the exobase have a high probability to escape[9, 10]. It is evident from Eq. (6) that is controlled by the quantity , which is constrained by MAVEN measurements of the argon isotopes (Supplementary Information D).
We determine in Supplementary Information B, adopt previous calculations[11] for , and assume . The main chemical reaction that produces escaping nitrogen is \ceN2+ + O -¿ NO+ + N. This reaction produces 10.9 eV as the excess energy, and this energy is partitioned into the products as the kinetic energy[7]. The kinetic energy partitioned to \ceN is much higher than the escape threshold energy ( eV). This process therefore does not strongly fractionate nitrogen. Similarly, because dissociative ionization and electron impact dissociation produce energies more than 10 eV, these processes do not strongly fractionate nitrogen in the escape.
0.6 Sputtering.
Sputtering by oxygen ions picked up and propelled by the magnetic field of the solar wind can also cause escape. The loss due to sputtering is expected to be stronger at earlier epochs, when the solar EUV flux was higher. This process occurs when Mars does not have a strong magnetic field during the modeled period[11], and the atmosphere is exposed to the solar wind. To model the sputtering loss rate of \ceN2 (), we scale the sputtering rate of \ceCO2 () by the yields and mixing ratios[12, 9, 15] of \ceN2 and \ceCO2 as
| (7) |
where is the yield, is the diffusion separation between \ceN2 and \ceCO2 calculated by Eq. (6) with equal to the mass difference between \ceN2 and \ceCO2, is a multiplication factor to account for uncertainties in the flux, and is a dilution factor that accounts for the dilution of \ceN2 by other species at the exobase and is defined as
| (8) |
where is the diffusion separation between the species and \ceCO2 defined similarly to Eq. (6). In addition to \ceN2, we include in this sum the minor species in Mars’ atmosphere: \ceAr, \ceO, and \ceCO, which currently have the abundances of 1.6%, 0.13%, and 0.08% by volume respectively.
Let us consider the dependency of the sputtering rate on the size of the nitrogen reservoir. Expanding in Eq. (7), and only including the terms relevant to , we have
| (9) |
Therefore when the scaled sputtering rate is proportional to the size of the nitrogen reservoir, and when the sputtering rate no longer depends on the size of the nitrogen reservoir. Because for a typical of 0.3 km/K, the sputtering rate becomes decoupled from the size of the nitrogen reservoir when it approaches the size of the carbon reservoir. This decoupling gives rise to slow convergence to the steady states and eventually the dynamical solutions.
We adopt the 3D Monte Carlo simulations[23] as the baseline values of the sputtering rate of \ceCO2, fitted to the following functional form
| (10) |
where in this formula is the sputtering escape flux in particles per s. The basis for this formula comes from the product of the previously calculated fluxes of the incident pickup ions[12] and the yield of escaping carbon particles[23]. The pickup ion fluxes calculated by Luhmann et al. (1992)[12] for the current epoch are remarkably consistent with more sophisticated 3D models within a factor of two[13, 14], and also with the globally averaged precipitating ion flux and its energy spectrum measured by MAVEN[15]. For the sputtering yield of \ceN2 we adopt the value calculated by the Monte Carlo simulations in Jakosky et al. (1994)[9], as it is the latest value.
Lastly, the sputtering loss is energetic enough so that it does not preferentially select the escape of the N isotopes. The fractionation factor in the sputtering loss is the diffusive fractionation from the homopause to the exobase, i.e., given by Eq. (6). While the pickup ion’s energy is principally deposited at altitudes well below the exobase, the recoil particles are quickly thermalized if they are produced at that altitude[16]. Only the particles produced near the exobase can escape. We thus use the exobase as the proxy for the source altitude of the sputtering loss.
0.7 Ion Loss.
Ion loss is the only non-thermal escape process that has been directly measured at Mars[17, 18, 19], and the measured rates of carbon (as \ceCO2+) and oxygen (as \ceO2+ and \ceO+) ion escape are generally consistent with magnetohydrodynamics model predictions[20]. Because the escape rate depends on age, we adopt a parametric model[21] that fits the ion escape rates of the MAVEN-validated MHD model[20] to a power law of the age. The ion loss rate, , is thus modeled as
| (11) |
where and are the present-day mixing ratios measured by MAVEN at the altitude of 160 km[22], is the present-day ion escape rate of \ceCO2+ from the parametric model[21], and the last term accounts for the evolution of the solar EUV flux with the power-law index from the parametric model[21]. Similar to sputtering, the fractionation factor of ion loss is .
MAVEN observations indicated an approximately an-order-of-magnitude increase in the ion fluxes during a large interplanetary coronal mass ejection (ICME) event, while the observations took place at sparse locations[18]. The ensemble collections of MAVEN’s ion observations during ICME events indicated that ICMEs result in a general decrease in the loss rate upstream, at low solar zenith angle (SZA), and an increase downstream, at higher SZA[19]. Integrating over SZA, these observations produced a net factor-of-two enhancement in the loss rate, although most of the events in this sample are small events. The young Sun likely produced more flare events and thus had a larger impact on the atmospheric loss. We do not include a multiplication factor in Eq. (11) because the total amount of \ceN2 lost from 3.8 Ga to the present day via ion loss is less than sputtering by several orders of magnitude. Thus, a variation in the ion loss rate by an order of magnitude would not change our model. We instead explore the sputtering multiplier in a wide range that captures the uncertainty in the pickup ion flux affected by solar activities.
0.8 Nitrate Formation.
See Supplementary Information C.
0.9 Volcanic Outgassing.
We estimate the volcanic outgassing flux () from the history of crustal formation and the \ceN2 content in the source magma. We model this as
| (12) |
where is the crustal production rate, is the density of the crust, is the concentration of \ceN2 in the source magma, and is a multiplication factor that accounts for the uncertainty in the crustal formation rate (including the extrusive-to-intrusive ratio) and the uncertainty in the outgassing efficiency.
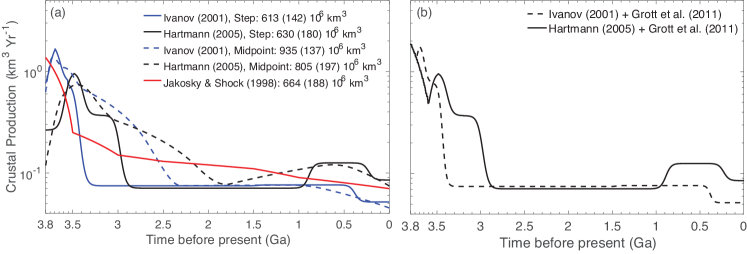
For the crustal production rate, we combine the thermal evolution model estimate (i.e., the ‘global melt’ scenario in Grott et al. 2011[23]) and the photogeological analysis of volcanic provinces on the planet’s surface[24] (Fig. E3). The outgassing factor in our evolution model is directly comparable to the outgassing factor in the argon evolution model (i.e., the parameter in Slipski et al. 2016[15]). The crustal production rate in our model is highest at 3.8 Ga, and remains quite high throughout the Hesperian period. The total volume of volcanic emplacement between 3.8 and 3.0 Ga in our baseline model is approximately km3, compared to km3 as the estimated volume of the Tharsis Rise[25]. Our volcanic outgassing model is thus consistent – within a factor of a few and captured by the multiplication parameter – with the recently revised picture that major volcanic emplacements such as the Tharsis Rise occurred during the late Noachian and the Hesperian[26, 27]. Our volcanic model includes a non-negligible rate in the Amazonian, particularly within the last 500 Myr. This is also consistent with the geological evidence for active volcanism until very recently (0.1 Ga[28]).
Unlike carbon whose concentration in the magma is limited by its solubility[26], the concentration of \ceN2 in the magma is typically not solubility-limited and thus reflects the formation history of the planet itself. In this work we adopt the ‘Silicate Earth’ concentration[25] () as the baseline value, and also recognize that Mars may have a different amount of nitrogen in the first place and may have a non-uniform distribution of nitrogen in the mantle. The uncertainty in can be absorbed into the factor .
Volcanic outgassing introduces fresh nitrogen into the atmosphere and causes its isotopic composition to change with bulk mixing. The isotopic ratio, , is modeled as
| (13) |
where is the partial pressure of \ceN2 outgassed per time step, is the partial pressure of \ceN2 in the bulk atmosphere, and is the isotopic composition of nitrogen in the mantle. We assume to be the value measured in the Martian meteorite ALH 84001[3]. Two isotopically distinct components of nitrogen have been found in ALH 84001[3]. The lighter one () may correspond to the nitrogen from the mantle, and the slightly evolved one may correspond to the early Martian atmosphere.
0.10 Markov-Chain Monte Carlo Simulations.
We employ the MCMC method to explore the vast parameter space of the evolution model. The likelihood function () defined for the MCMC analysis is
| (14) |
where represents and is the uncertainty for the current size and composition of the free nitrogen reservoir. Because the current size is mbar including the regolith adsorption, we adopt the center value of mbar and the uncertainty of mbar. Essentially this gives the nonzero denominator required in the likelihood function, and the small value for means that any successful model must match with the present-day atmospheric pressure. For the isotopic composition we use the values measured by Curiosity’s Sample Analysis at Mars instrument[4]: and .
The seven parameters listed in Table 1 are included as the free parameters in the MCMC simulations, and they have flat prior distributions in the ranges in which they are allowed to vary. For each MCMC simulation, two 2,000,000-element chains are produced starting from the parameters chosen independently and randomly within the allowed ranges. These two chains are then tested for convergence using the Gelman-Rubin method[29], and if converged, combined to derive the posterior distributions.
Methods References
References
- [1] Zent, A., Quinn, R. & Jakosky, B. Fractionation of nitrogen isotopes on mars: The role of the regolith as a buffer. Icarus 112, 537–540 (1994).
- [2] Ballou, E. V., Wood, P. C., WYDEVEN, T., LEHWALT, M. E. & MACK, R. E. Chemical interpretation of viking lander 1 life detection experiment. Nature 271, 644–645 (1978).
- [3] Nakamura, T. & Tajika, E. Climate change of mars-like planets due to obliquity variations: implications for mars. Geophysical research letters 30, 1685 (2003).
- [4] Soto, A., Mischna, M., Schneider, T., Lee, C. & Richardson, M. Martian atmospheric collapse: Idealized gcm studies. Icarus 250, 553–569 (2015).
- [5] Ribas, I., Guinan, E. F., Güdel, M. & Audard, M. Evolution of the solar activity over time and effects on planetary atmospheres. i. high-energy irradiances (1-1700 å). The Astrophysical Journal 622, 680 (2005).
- [6] Claire, M. W. et al. The evolution of solar flux from 0.1 nm to 160 m: quantitative estimates for planetary studies. The Astrophysical Journal 757, 95 (2012).
- [7] Tu, L., Johnstone, C. P., Güdel, M. & Lammer, H. The extreme ultraviolet and x-ray sun in time: high-energy evolutionary tracks of a solar-like star. Astronomy & Astrophysics 577, L3 (2015).
- [8] Bakalian, F. Production of hot nitrogen atoms in the martian thermosphere. Icarus 183, 69–78 (2006).
- [9] Bakalian, F. & Hartle, R. E. Monte carlo computations of the escape of atomic nitrogen from mars. Icarus 183, 55–68 (2006).
- [10] Cui, J., Wu, X.-S., Gu, H., Jiang, F.-Y. & Wei, Y. Photochemical escape of atomic c and n on mars: clues from a multi-instrument maven dataset. Astronomy & Astrophysics 621, A23 (2019).
- [11] Lillis, R., Frey, H. & Manga, M. Rapid decrease in martian crustal magnetization in the noachian era: Implications for the dynamo and climate of early mars. Geophysical Research Letters 35, L14203 (2008).
- [12] Luhmann, J., Johnson, R. & Zhang, M. Evolutionary impact of sputtering of the martian atmosphere by o+ pickup ions. Geophysical research letters 19, 2151–2154 (1992).
- [13] Fang, X. et al. The importance of pickup oxygen ion precipitation to the mars upper atmosphere under extreme solar wind conditions. Geophysical Research Letters 40, 1922–1927 (2013).
- [14] Wang, Y.-C. et al. Statistical studies on mars atmospheric sputtering by precipitating pickup o+: Preparation for the maven mission. Journal of Geophysical Research: Planets 120, 34–50 (2015).
- [15] Leblanc, F. et al. Mars heavy ion precipitating flux as measured by mars atmosphere and volatile evolution. Geophysical Research Letters 42, 9135–9141 (2015).
- [16] Leblanc, F. & Johnson, R. Sputtering of the martian atmosphere by solar wind pick-up ions. Planetary and Space Science 49, 645–656 (2001).
- [17] Barabash, S., Fedorov, A., Lundin, R. & Sauvaud, J.-A. Martian atmospheric erosion rates. Science 315, 501–503 (2007).
- [18] Jakosky, B. M. et al. Maven observations of the response of mars to an interplanetary coronal mass ejection. Science 350, aad0210 (2015).
- [19] Curry, S. et al. Observations of ICMEs at Mars: past and present. AGU Fall Meeting Abstracts 2018, P51H–2971 (2018).
- [20] Ma, Y.-J. & Nagy, A. F. Ion escape fluxes from mars. Geophysical Research Letters 34, L08201 (2007).
- [21] Manning, C. V., Ma, Y., Brain, D. A., McKay, C. P. & Zahnle, K. J. Parametric analysis of modeled ion escape from mars. Icarus 212, 131–137 (2011).
- [22] Bougher, S. et al. Early maven deep dip campaign reveals thermosphere and ionosphere variability. Science 350, aad0459 (2015).
- [23] Grott, M., Morschhauser, A., Breuer, D. & Hauber, E. Volcanic outgassing of co2 and h2o on mars. Earth and Planetary Science Letters 308, 391–400 (2011).
- [24] Greeley, R. & Schneid, B. D. Magma generation on mars: Amounts, rates, and comparisons with earth, moon, and venus. Science 254, 996–998 (1991).
- [25] Phillips, R. J. et al. Ancient geodynamics and global-scale hydrology on mars. Science 291, 2587–2591 (2001).
- [26] Tanaka, K. L., Robbins, S., Fortezzo, C., Skinner Jr, J. & Hare, T. M. The digital global geologic map of mars: Chronostratigraphic ages, topographic and crater morphologic characteristics, and updated resurfacing history. Planetary and Space Science 95, 11–24 (2014).
- [27] Bouley, S., Baratoux, D., Paulien, N., Missenard, Y. & Saint-Bézar, B. The revised tectonic history of tharsis. Earth and Planetary Science Letters 488, 126–133 (2018).
- [28] Werner, S. C. The global martian volcanic evolutionary history. Icarus 201, 44–68 (2009).
- [29] Gelman, A., Rubin, D. B. et al. Inference from iterative simulation using multiple sequences. Statistical science 7, 457–472 (1992).
- [30] Laskar, J. et al. Long term evolution and chaotic diffusion of the insolation quantities of mars. Icarus 170, 343–364 (2004).
- [31] Manning, C. V., McKay, C. P. & Zahnle, K. J. The nitrogen cycle on mars: Impact decomposition of near-surface nitrates as a source for a nitrogen steady state. Icarus 197, 60–64 (2008).
- [32] Werner, S. & Tanaka, K. Redefinition of the crater-density and absolute-age boundaries for the chronostratigraphic system of mars. Icarus 215, 603–607 (2011).
- [33] Ivanov, B. A. Mars/moon cratering rate ratio estimates. Space Science Reviews 96, 87–104 (2001).
- [34] Hartmann, W. K. Martian cratering 8: Isochron refinement and the chronology of mars. Icarus 174, 294–320 (2005).
We thank Yuk L. Yung, Bethany Ehlmann, Bruce Jakosky, Hiroyuki Kurokawa, Curtis Manning, Robert Johnson, Matthias Grott, Fabrice Gaillard, Marek Slipski, and Cheuk-Yiu Ng for helpful discussions. This work was supported by NASA Habitable Worlds grant NNN13D466T, later changed to 80NM0018F0612. The research was carried out at the Jet Propulsion Laboratory, California Institute of Technology, under a contract with the National Aeronautics and Space Administration.
R.H. designed the study and the evolution model, interpreted the results, and wrote the manuscript. T.B.T. implemented the evolution model, carried out the simulations, and interpreted the results.
The authors declare no competing interests.
Correspondence and requests for materials should be addressed to Renyu Hu (email: renyu.hu@jpl.nasa.gov).
The data needed to generate all figures in the main text (Figs. 1–3) and Extended Data Figs. 2 and 3 are publicly available at Zenodo (https://doi.org/10.5281/zenodo.5760095).
The source code of the nitrogen evolution model and the associated configuration files used in this study are publicly available at Zenodo (https://doi.org/10.5281/zenodo.5760095).
Supplementary Information is available for this paper.
Extended Data
Extended Data
Extended Data
Extended Data
Extended Data
Extended Data
Supplementary Information for
“A nitrogen-rich atmosphere on ancient Mars consistent with isotopic evolution models”
Renyu Hu and Trent B. Thomas
Jet Propulsion Laboratory, California Institute of Technology, Pasadena, CA 91109
renyu.hu@jpl.nasa.gov
Supplementary Information A: Summary of Previous Evolutionary Models of Mars Nitrogen
Table S1 summarizes the previously proposed solutions to explain Mars’s nitrogen isotopic composition and their unresolved issues.
To explain the initial measurement of the nitrogen’s isotopic composition by Viking[5], McElroy et al. (1976)[6] firstly modeled the photochemical escape of nitrogen and found that the escape caused much more fractionation than what was measured (Table S1). The proposed solution for this over-enrichment problem is to have a large amount of \ceN2 deposited as nitrates. However, the work did not include sputtering loss or the enhanced photochemical escape when the solar EUV flux was higher.
Fox & Dalgarno (1983)[7] and Fox (1993)[8] substantially improved the estimates of the photochemical escape rate with realistic upper-atmosphere models and determined its dependency on the mixing ratio of \ceN2 in the atmosphere. These papers showed that the photochemical escape would cause substantial over-enrichment, and proposed that an initial \ceCO2 pressure of bar that diminished exponentially with a time constant in the range of 0.7 – 1 billion years to the value today could reproduce the measured isotopic ratio of nitrogen. Still, these papers did not include sputtering loss or the enhanced photochemical escape when the solar EUV flux was higher.
Jakosky et al. (1994) presented the first comprehensive model of nitrogen evolution that includes sputtering loss and photochemical loss and their dependency on the evolving solar EUV flux. Their standard model reproduced the present-day nitrogen isotopic composition with a combination of the reduced sputtering rate (25% of Luhmann et al. 1992[1]), an initial \ceCO2 pressure of 0.75 bar, and a substantial and temporally spread outgassing profile that peaks at 3 Ga and extends well into 1 – 2 Ga. A collapsed atmosphere scenario where the partial pressure of \ceCO2 was kept at 7 mbar was considered, and that scenario required an even smaller sputtering rate. In these models, nitrogen is in a steady state, where sputtering balances outgassing, until Ga and then deviates from the steady state due to the reduction of outgassing. This is, to our knowledge, the first time that the steady state in Mars nitrogen’s evolution has been shown. Without the substantial outgassing, however, 1 – 3 bar initial \ceCO2 would be required to mitigate the over-enrichment problem. While the reduced sputtering rate may be plausible given the uncertainties in the sputtering models, the massive outgassing that extends well into the Amazonian appears to be at odds with the current geologic mapping[28]. The total amount of \ceN2 outgassing required is 16 mbar, but more recent argon isotope measurements and models indicate that the total outgassing should be mbar[15] if Mars has the same N/Ar ratio as Earth. Without the outgassing, the required massive early \ceCO2 atmosphere is not supported by the lack of widespread carbonate deposits on the Martian surface or the atmospheric carbon’s isotopic composition[2, 16].
Zent et al. (1994)[10] presented the experimental data for the \ceN2 adsorption capacities of Martian regolith and assessed whether regolith adsorption of \ceN2 can mitigate the over-enrichment problem as an alternative to the thick \ceCO2 atmosphere and substantial volcanic outgassing. They determined that 2.4 mbar \ceN2 adsorbed by the regolith would be required, which is about two orders of magnitude greater than a plausible amount.
Fox & Hać (1997)[11] determined the isotopic fractionation factor in the dissociative recombination of \ceN2+, one of the main photochemical loss mechanisms. Without including sputtering, they suggested that the present-day isotopic composition can be matched by a moderate-size early \ceCO2 atmosphere that has a time constant of more than 1 billion years.
Finally, Kurokawa et al. (2018)[12] presented the most up-to-date and comprehensive analysis of the nitrogen’s isotopic composition together with the evolution of \ceCO2 and noble gases. Their models traced the evolution from 4.5 Ga (compared to 3.8 Ga in Jakosky et al. 1994[9] and this work) and included impacts of asteroids and comets. Their models assumed the atmosphere collapse if the atmospheric pressure is bar. The preferred nitrogen evolution scenario features the steady state between the outgasssing and the sputtering until Ga, and after that, the outgassing stops and the photochemical escape raises N to the final value. The cessation of outgassing at Ga is inconsistent with the geological evidence for active volcanism until very recently (0.1 Ga[28]). We suspect that this assumption of Kurokawa et al. (2018) might have originated from taking the data in Fig. 2 of Craddock & Greeley (2009)[3] as the face value. The outgassing values drawn at the midpoint of each geologic period in Fig. 2 of Craddock & Greeley (2009) are the mean flux for the period and thus should be applied to the whole period.
| Paper | N (‰) | EUV | Proposed Solutions | Unresolved Issues |
|---|---|---|---|---|
| McElroy et al. 1976 [6] | 1440 | No | mbar \ceN_2 deposited as nitrates | Did not include enhanced escape at early epochs |
| Fox & Dalgarno 1983 [7] | 1510 | No | Initial bar \ceCO_2 lasting for Ga | Did not include enhanced escape at early epochs |
| Fox 1993 [8] | 1530 | No | Initial bar \ceCO_2 lasting for Ga | Did not include enhanced escape at early epochs |
| Jakosky et al. 1994 [9] | N/A | Yes | Initial 0.75 bar \ceCO2 and large outgassing after 3.0 Ga (total outgassing 16 mbar \ceN2), or initial bar \ceCO2 without outgassing | Outgassing profile and amount inconsistent with geologic mapping and argon isotopes, and massive \ceCO2 inconsistent with the lack of carbonates |
| Zent et al. 1994 [10] | 3900 | Yes | 2.4 mbar \ceN_2 adsorbed in regolith | Not achievable for reasonable thickness of regolith |
| Fox & Hać 1997 [11] | N/A | Yes | Initial 0.26 bar \ceCO_2 lasting for 1.1 Ga | Did not include sputtering |
| Kurokawa et al. 2018 [12] | N/A | Yes | Steady state until 0.5 Ga followed by a cessation of outgassing | Inconsistent with geologic evidence of volcanism active until 0.1 Ga |
Supplementary Information B: Fractionation Factor in the Escape Driven by Photodissociation of \ceN2
The photodissociation of \ceN2 has been recognized as a mechanism to produce escaping nitrogen on Mars[4]. It is also known that photodissociation of \ceN2 does not produce two nitrogen atoms in the ground state N(4S), and previous works have assumed that it produces one N in the ground state, and the other N is the first excited state N(2D)[8, 8]. Here we determine the rate and the fractionation factor of the escape driven by the photodissociation of \ceN2 on Mars using the “Photochemical Isotope Effect” (PIE) method[16]. We also incorporate the latest experimental data[17] that suggest the production of higher excited states and a complex relationship between the quantum yields of the dissociation channels and the energy of the incident photon (Table S2).
In short, the PIE method distributes the energy of the incident photon that is more than the threshold energy of each channel into the two nitrogen atoms as the kinetic energy. This calculation uses the solar spectrum, the cross-sections of \ceN2 photodissociation, and the quantum yields as a function of wavelength as the input. We use the data compilation of Fennelly & Torr (1992)[5] for the cross-sections of photoabsorption and photoionization. Two energy limits are noteworthy: (1) photons with energy higher than eV (or wavelength nm) cause ionization in addition to dissociation; (2) photons with energy higher than eV (or wavelength nm) only cause ionization.
| No. | Channel | Threshold Energy | Min. Photon Energy | Quantum yields for photons with energy |
|---|---|---|---|---|
| (1) | N(4S) + N(4S) | 9.76 eV | 13.22 eV | 0 |
| (2) | N(4S) + N(2D) | 12.14 eV | 15.60 eV | 1 for eV, 0.6 for eV, |
| 0.4 for eV, unknown for eV | ||||
| (3) | N(4S) + N(2P) | 13.33 eV | 16.79 eV | 0.4 for eV, 0 for eV, |
| unknown for eV | ||||
| (4) | N(2D) + N(2D) | 14.53 eV | 17.99 eV | 0.6 for eV, unknown for eV |
| (5) | N(2D) + N(2P) | 15.72 eV | 19.18 eV | unknown |
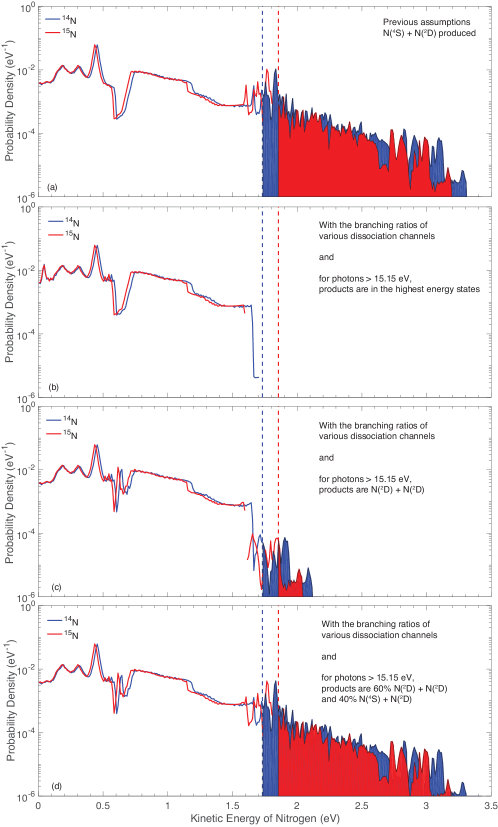
Using the previous assumption[8, 8] that all the photons more energetic than 12.14 eV produce N(4S) and N(2D), we find that 6.03% of the 14N and 1.75% of the 15N produced in the photodissociation would escape (Fig. S1). For the first time we determine the fractionation factor to be .
With the possibility to produce the higher energy dissociation channels listed in Table S2, the rate of escape is much reduced compared with the previous estimate[8]. Because we do not have experimental data for the quantum yields from photons more energetic than 15.15 eV, we consider the following three scenarios to calculate the escape rate and the fractionation factor (Fig. S1). (1) First, the produced nitrogen atoms are always in the highest energy states allowed. In this case, it is evident from Table S2 that no produced nitrogen atoms would have enough energy to escape. (2) Second, the photons more energetic than 15.15 eV produce two N(2D)s, the highest-energy dissociation channel observed in the laboratory. In this case, only the photons with energy between 17.99 eV (see Table S2) and 18.8 eV (i.e., the upper limit of the energy of the photon that causes dissociation) can drive escape. We find that only 0.06% of the produced 14N have enough energy to escape (or 1% of the result using previous assumption), and the fractionation factor would be . The process is highly selective between the isotopes because only the incident photons in the narrow range of energy can produce escape. The whole process nonetheless stops being important for evolution because the escape rate is too small. (3) Third, we extrapolate the measured quantum yields between 14.53 and 15.15 eV (Table S2) to higher energies. In this case, we find that 2.5% of the produced 14N have enough energy to escape (or 41% of the result using previous assumption), and the fractionation factor would be . For the evolution model, we scale the previous estimate[8] by the new yields for and use the newly determined fractionation factor for , and thus complete the treatment for photochemical escape.
To summarize, because more energetic photons produce nitrogen atoms in increasingly higher excited states, much of the energy from the solar irradiation does not drive escape. We find that % of the 14N produced by the photodissociation can escape, which is maximally 40% of the previous estimate[8], depending on how the experimental data are extrapolated to higher-energy photons (Fig. S1). If the produced nitrogen atoms are always in the highest energy states allowed, including a never-observed channel of N(2D)+N(2P), none of the produced atoms would have enough energy to escape. If some nitrogen escapes, the PIE in this process is severe because the escaping particles are produced in a very narrow energy window, and the fractionation factor is .
Supplementary Information C: Constraints of the Amount and Fractionation Factor of Nitrate Formation
Evolved gas experiments with SAM on Curiosity have determined the concentration of nitrate in the Martian soil and rocks[13, 14]. Here we adopt the concentration measured in the Rocknest samples as representative of the Martian soil ( ppm by weight in \ceNO3[14]). For a globally average regolith depth of 10 m, this corresponds to mbar of \ceN2. We evenly distribute this amount in the Amazonian period to estimate the removal rate of nitrogen from the free reservoir in this period. For the nitrate content in Noachian and Hesperian rocks, the SAM measurements have suggested highly variable nitrogen concentration. The weighted average of all rock samples measured by SAM is ppm by weight in \ceNO3, and the weighted average of only the Cumberland samples is ppm[14]. Also, the thickness of the crust affected by nitrate deposition is essentially unknown. Because the concentration and the depth are degenerate for our purpose, we use a default rock concentration of 300 ppm by weight in \ceNO3, and explore an equivalent depth () as a free parameter that can be as large as m. We evenly distribute the nitrate amount determined by the parameter in the modeled Noachian and Hesperian period (i.e., 3.8 – 3.0 Ga) to estimate the removal rate of nitrogen from the free reservoir in this period. As a guiding estimate, the nitrate concentration in 500 m of crust corresponds to mbar of \ceN2, larger than the size of the current reservoir by more than one order of magnitude. The crustal sequestration is thus potentially a significant loss for the nitrogen evolution in the atmosphere.
To estimate the fractionation factor for the nitrate formation we consider the formation processes. The nitrate formation must start from energetic processes that break \ceN2 into \ceNO, and the relevant energetic processes include lightning, bolide impact, and high-temperature volcanism[6, 7, 8, 9, 10]. Subsequent conversion from \ceNO to nitrates probably involved photochemical oxidation in the atmosphere[11] or conversion to \ceHNO and then disproportionation in the dissolved phase on or beneath the surface[12, 13, 14]. The latter pathway requires alkaline solutions with pH [14] and may be consistent with the early Martian subsurface environments[15]. We do not expect significant fractionation between the \ceNO produced by the energetic processes and the background \ceN2. Then, is there fractionation in the conversion from \ceNO to nitrate? Terrestrial measurements indicate that N in \ceHNO3 or particulate nitrates can be greater than that of the source atmospheric \ceNOx (i.e., \ceNO and \ceNO2) by up to , and most of this fractionation probably comes from the isotope exchange reaction between \ceNO and \ceNO2[16, 17, 18, 19]. This empirical datum can be considered as a proxy for the fractionation in the photochemical oxidation pathway, and meanwhile, the fractionation in the \ceHNO pathway is essentially unknown. In this work, we consider no fractionation for nitrate formation in the standard scenarios and discuss the impact of a fractionation (i.e., ) as a variation. The fractionation in nitrate deposition can only lead to change in the final N (Fig. 2).
Supplementary Information D: Constraints of
The quantity denotes the difference in altitude between the homopause and the exobase divided by the temperature of the atmosphere at this interval. This parameter is important to the diffusive fractionation as well as the sputtering loss rate. In the previous atmospheric evolution models[9, 12], this parameter was either adopted to be a single value or chosen as several values for different epochs corresponding to the varying solar EUV flux. Recently, MAVEN has measured this parameter on Mars using argon as a tracer[22], and found that this parameter changes in the range of km K-1 in a short period. This range also encompasses the entire range adopted in the previous evolution models. We therefore consider as a free but constant parameter that varies in km K-1 in this work.
Supplementary Information E: Correlated Parameters for the Steady-State Solutions
The steady-state solutions can typically be found with large escape and outgassing rates that fit the correlation displayed in Fig. S2. This is because the present-day N value allows the current atmosphere to be in the steady state. The steady-state isotopic composition of atmospheric nitrogen is , where is the isotopic composition of outgassing and is the end-to-end fractionation factor of escape[6]. Using the measured values of and , must be to allow the steady-state solutions. of sputtering is from diffusive fractionation and is given MAVEN measurements[22]. of photochemical loss includes additional fractionation due to PIE (Methods) and electron energy distributions[11], and is . Therefore, the steady-state solutions require the current escape to be almost entirely made of photochemical loss. Meanwhile, the baseline outgassing, photochemical loss, and sputtering loss rates are , , and mbar Myr-1 at the present day; as a result, the following relationship should hold for mass balance: . Putting the analyses together, the steady-state solutions would exist when . Thus, the solutions found by the unconstrained MCMCs (mostly steady-state solutions) often have large , , and .
Supplementary Information F: Sensitivity of Posterior Distributions on Input Parameters
We have run MCMC simulations for varied initial N values and specific implementation of the baseline volcanism model. We have also tested sensitivity on the assumed upper bound of the power-law index of photochemical loss () and a scaling. The resulting posterior distributions are shown in Figs. S3-S5.
The constraints on the initial partial pressure of \ceN2 are not sensitive to the initial N value assumed in the simulations (Fig. S3), and this is because most of the dynamical solutions are close to the transitional solutions. The sensitivity on the baseline outgassing model is largely compensated by the uncertainty in and only leads to moderate changes in the constraints on the initial partial pressure (Fig. S3).
The wide range of the power-law index explored in this study (Table 1) captures the uncertainty in the age dependency of the solar EUV flux. Tu et al. (2015) suggested that the range of the exponent for power-law fits of the evolution would be between and , corresponding to the 10th and 90th percentile of the distribution of possible early solar rotation rates[7]. Given that the saturation phase of the Sun concluded Myr after formation[20], the power-law fit of is a valid approximation within our model domain. For a “fixed” exponent () of the EUV luminosity history, the range of in 0.5 – 3.0 corresponds to a compounded power-law exponent between and as a function of time. Technically, the compounded exponent may be steeper than if both and the age dependency are close to their upper bounds; nonetheless, the MCMC simulations with an extended upper bound for (from 3.0 to 6.0) do not show any appreciable changes (Fig. S4). Our parameterization to consolidate the uncertainty into thus explores a reasonably wide range of early solar rotation rates.
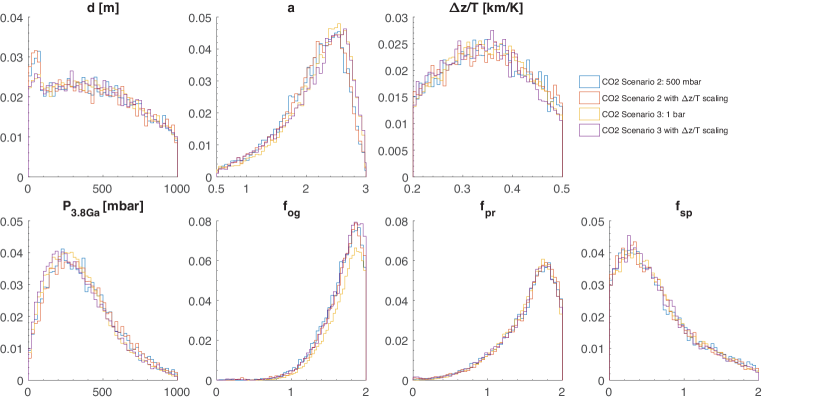
It is conceivable that the value of may vary over the course of an evolution because it may depend on the \ceN2/\ceCO2 mixing ratio. We additionally consider this effect, by scaling the value of as inverse-proportional to the mean molecular weight of the atmosphere to mimic the scale height variation from an \ceN2-poor atmosphere to an \ceN2-rich atmosphere. However, the MCMC simulations using the scaling do not lead to any appreciable changes in the posterior distributions from the standard models (Fig. S5), indicating that the potential effect of variation is limited.
Supplementary Information G: Coupled carbon and nitrogen evolution models
In this section, we present coupled and self-consistent carbon and nitrogen evolution models. These models are comparable to the representative cases of Fig. 2, but now include a self-consistent tracing of the \ceCO2 abundance and C. These models confirm that an initially large \ceN2 reservoir can exist alongside an initially large \ceCO2 reservoir and still satisfy the present-day constraints on the Martian atmosphere.
The \ceCO2 evolution model is based on the model in Hu et al. (2015)[16] but includes a few modifications. The most important modification is that the calculation of the escape rates of carbon now takes into account the mixing ratio of \ceCO2, which is no longer defaulted to unity as before. The coupled model thus proportionally reduces the escape rates of carbon when \ceN2 is an important component of the atmosphere. Additionally, to maintain consistency with the nitrogen evolution model, several technical modifications have been included. First, to trace the instantaneous mixing ratios of \ceCO2 in the atmosphere, the partitioning of \ceCO2 among the atmosphere, the polar caps, and the regolith is modeled. Before, these components are treated as a combined reservoir. Here we adopt a simplifying assumption that \ceCO2 was mostly in the atmosphere before the atmospheric collapse, and after the collapse, 7 mbar of \ceCO2 was in the atmosphere in vapor equilibrium with the polar caps. We assume that the collapse occurred when the total pressure of the atmosphere drops below 500 mbar[20]. Second, the crustal production rate profile as shown in Fig. E3 is now adopted as the basis for calculating the outgassing rate in the \ceCO2 evolution. Third, for completeness, we have included ion escape of \ceCO2+ utilizing the same parametric model[21] we have utilized for the \ceN2+ escape in this work. In total, the updated \ceCO2 evolution includes sputtering loss, photochemical loss, ion loss, carbonate deposition, and volcanic outgassing. The three escape processes depend on the mixing ratio of \ceCO2 in the atmosphere, which now depends on the partial pressure of \ceN2 in the atmosphere, making the evolution self-consistent.
We have used the coupled model to study how the inclusion of a potentially important \ceN2 component modifies the \ceCO2 evolution, and in turn, the \ceN2 evolution itself. To do this, we start from the representative steady-state and dynamical solutions presented in Fig. 2. After coupling, the evolution of the carbon reservoir would result in a value of pCO2 and C different from the present day if keeping all parameters the same. As we will show in the following, however, modification of some parameters in the reasonable range can readily restore both \ceCO2 and \ceN2 evolutionary solutions (Figs. S6 and S7).
For the steady-state solutions, the coupling generally does not impact the evolution of \ceCO2 except for the very early period when the steady state has not been established. The model in Fig. S6 is calculated by modifying the parameters of the steady-state solution presented as the dashed line in the left column of Fig. 2. In this model, the \ceCO2 escape rates are reduced only when pN2 is large such that it has a non-negligible effect on the mixing ratio of \ceCO2, which only happens before \ceN2 descends to the steady state at Ga. We find that 725 mbar of early carbonate deposition (i.e., a moderate increase from 600 mbar before) would be sufficient to compensate for the reduction in the escape rates of carbon and maintain the initial \ceCO2 partial pressure at bar. Additionally, the difference in the crustal production rates results in a \ceCO2 solution with increasing pressure during the Amazonian as opposed to the monotonically decreasing pressure of the previous \ceCO2 solution. Then, the \ceN2 escape rates would be moderately enhanced during the Amazonian if all parameters are kept the same. In Fig. S6, we have decreased the sputtering multiplier () from 3.5 to 2.5 and increased the photochemical multiplier () from 6.5 to 7 to reproduce the nitrogen solution.
The coupled evolution is typically more impacted in dynamical solutions when \ceN2 has a non-negligible mixing ratio for a longer period. The model in Fig. S7 is calculated by modifying the parameters of the dynamical solution presented in the right column of Fig. 2. Here we see that the sputtering rate of \ceCO2 is significantly reduced before Ga, because the atmospheric pN2 remains high for a long period after the atmospheric collapse, while the partial pressure of \ceCO2 is kept at 7 mbar. We have applied 850 mbar of early carbonate deposition (compared to 600 mbar before) in this case to maintain the initial \ceCO2 partial pressure at bar. This moderate increase in the early carbonate deposition remains consistent with geologic constraints[16]. On the nitrogen side, because slightly more sputtering loss takes place in Ga, we have decreased the photochemical multiplier () from 1.3 to 1.15 to reproduce the present-day value of N and decreased the outgassing multiplier () from 1.5 to 1.3 accordingly to reproduce the present-day partial pressure of \ceN2. These moderate changes in the nitrogen evolution’s parameters eventually result in a small increase of the initial pN2 from 240 to 280 mbar.
To summarize, Figs. S6 and S7 show self-consistent, coupled \ceCO2-\ceN2 solutions that reproduce the partial pressures and isotopic composition of carbon and nitrogen on present-day Mars. The character of the steady-state and dynamical evolutionary solutions remains unchanged from the stand-alone \ceN2 models, despite the inclusion of \ceCO2 and the modifications described above. The coupled solutions are found by moderate changes in certain input parameters based on the stand-alone solutions presented in the main text. In particular, the large initial pN2 in dynamical solutions may have suppressed the escape of carbon during Hesperian and early Amazonian, and thus require a greater amount of early carbonate deposition to have an initial pCO2 of bar. The amount of the early carbonate deposition is however poorly constrained, and so is the initial pCO2. The self-consistent solutions demonstrate that a large initial \ceN2 reservoir is fully compatible with a large initial \ceCO2 reservoir. \ceN2 thus likely contributed to early surface warming on Mars.
Supplementary Information H: Re-evaluation of the impact decomposition of nitrates as a potential source
Manning et al. (2008)[31] proposed an innovative scenario for the evolution of atmospheric nitrogen on Mars, in which the present-day nitrogen is in a steady state between escape and impact decomposition of previously deposited near-surface nitrates. Because we now have measurements of near-surface nitrates on Mars[13, 14], we can re-evaluate this scenario and determine whether the impact decomposition may serve as an important source of nitrogen on today’s Mars.
Based on impact models, Manning et al. (2008) estimated that the surface area affected by impact is 475 m2 yr-1 currently. Assuming an average 10-m depth affected by impacts (i.e., a generous estimate of impactors having a 10-m diameter, which only occurs once every years[33]), and using the high end of the nitrite concentration detected on Mars (550 ppm by weight in \ceNO3, measured in the Cumberland rock sample by Curiosity[14]), we estimate an upper limit of nitrogen that can be released by impact decomposition, in planetary average, to be N cm-2 s-1, or mbar Myr-1 using the same unit for fluxes as Fig. 2. The actual flux is likely lower by more than one order of magnitude because smaller impacts dominate and because the nitrite content measured in all other rock and soil samples are less than the Cumberland sample by a factor of a few. This upper-limit flux compares minimally to the present-day outgassing and photochemical escape rate of N, on the order of mbar Myr-1 (Fig. 2). Our estimate of the nitrate formation rate in the recent history is mbar Myr-1, assuming that the nitrates found in the Martian soil were formed at a constant rate during the Amazonian[11]. This rate is also significantly higher than the upper limit of nitrate decomposition. We thus find that, given the near-surface nitrate concentrations measured by Curiosity, the escape of nitrogen from Mars’s atmosphere cannot be in a steady state with the impact decomposition of nitrate.
Also, because the nitrate formation rate is modeled as a constant in this work, and because the impact decomposition flux would also be modeled as a constant, our model that explores a varied rate of nitrate formation implicitly includes the potential effect of a partial decomposition due to impact.
Supplementary Information References
References
- [1] Luhmann, J., Johnson, R. & Zhang, M. Evolutionary impact of sputtering of the martian atmosphere by o+ pickup ions. Geophysical research letters 19, 2151–2154 (1992).
- [2] Edwards, C. S. & Ehlmann, B. L. Carbon sequestration on mars. Geology 43, 863–866 (2015).
- [3] Craddock, R. A. & Greeley, R. Minimum estimates of the amount and timing of gases released into the martian atmosphere from volcanic eruptions. Icarus 204, 512–526 (2009).
- [4] Brinkmann, R. Mars: Has nitrogen escaped? Science 174, 944–945 (1971).
- [5] Fennelly, J. & Torr, D. Photoionization and photoabsorption cross sections of o, n2, o2, and n for aeronomic calculations. Atomic Data and Nuclear data tables 51, 321–363 (1992).
- [6] Yung, Y. & McElroy, M. Fixation of nitrogen in the prebiotic atmosphere. Science 203, 1002–1004 (1979).
- [7] Kasting, J. F. & Walker, J. C. Limits on oxygen concentration in the prebiological atmosphere and the rate of abiotic fixation of nitrogen. Journal of Geophysical Research: Oceans 86, 1147–1158 (1981).
- [8] McKay, C. P., Scattergood, T. W., Pollack, J. B., Borucki, W. J. & Van Ghyseghem, H. T. High-temperature shock formation of n2 and organics on primordial titan. Nature 332, 520 (1988).
- [9] Mather, T. A., Pyle, D. M. & Allen, A. G. Volcanic source for fixed nitrogen in the early earth’s atmosphere. Geology 32, 905–908 (2004).
- [10] Navarro-González, R. et al. Abiotic input of fixed nitrogen by bolide impacts to gale crater during the hesperian: Insights from the mars science laboratory. Journal of Geophysical Research: Planets 124, 94–113 (2019).
- [11] Smith, M. L., Claire, M. W., Catling, D. C. & Zahnle, K. J. The formation of sulfate, nitrate and perchlorate salts in the martian atmosphere. Icarus 231, 51–64 (2014).
- [12] Mancinelli, R. L. & McKay, C. P. The evolution of nitrogen cycling. Origins of Life and Evolution of the Biosphere 18, 311–325 (1988).
- [13] Summers, D. P. & Khare, B. Nitrogen fixation on early mars and other terrestrial planets: experimental demonstration of abiotic fixation reactions to nitrite and nitrate. Astrobiology 7, 333–341 (2007).
- [14] Hu, R. & Diaz, H. D. Stability of nitrogen in planetary atmospheres in contact with liquid water. The Astrophysical Journal 886, 126 (2019).
- [15] Ehlmann, B. L. et al. Subsurface water and clay mineral formation during the early history of mars. Nature 479, 53 (2011).
- [16] Freyer, H. Seasonal variation of 15n/14n ratios in atmospheric nitrate species. Tellus B 43, 30–44 (1991).
- [17] Freyer, H., Kley, D., Volz-Thomas, A. & Kobel, K. On the interaction of isotopic exchange processes with photochemical reactions in atmospheric oxides of nitrogen. Journal of Geophysical Research: Atmospheres 98, 14791–14796 (1993).
- [18] Jarvis, J. C., Steig, E. J., Hastings, M. G. & Kunasek, S. A. Influence of local photochemistry on isotopes of nitrate in greenland snow. Geophysical Research Letters 35 (2008).
- [19] Chang, Y. et al. Nitrogen isotope fractionation during gas-to-particle conversion of no x to no 3- in the atmosphere–implications for isotope-based no x source apportionment. Atmospheric Chemistry and Physics 18, 11647–11661 (2018).
- [20] Jackson, A. P., Davis, T. A. & Wheatley, P. J. The coronal x-ray–age relation and its implications for the evaporation of exoplanets. Monthly Notices of the Royal Astronomical Society 422, 2024–2043 (2012).