A very low central oxygen mass in the peculiar type Ia SN 2010lp: further diversity at the low-luminosity end of SNe Ia
Abstract
A nebular spectrum of the peculiar, low-luminosity type Ia supernova 2010lp is modelled in order to estimate the composition of the inner ejecta and to illuminate the nature of this event. Despite having a normally declining light curve, SN 2010lp was similar spectroscopically to SN 1991bg at early times. However, it showed a very unusual double-peaked [O i] emission at late times (Taubenberger et al. 2013). Modelling of the nebular spectrum suggests that a very small amount of oxygen ( ), expanding at very low speed ( km s-1) is sufficient to reproduce the observed emission. The rest of the nebula is not too dissimilar from SN 1991bg, except that SN 2010lp is slightly more luminous. The double-peaked [O i] emission suggests that SN 2010lp may be consistent with the merger or collision of two low-mass white dwarfs. The low end of the SN Ia luminosity sequence is clearly populated by diverse events, where different channels may contribute.
keywords:
supernovae: general – supernovae: individual (SN 2010lp) – techniques: spectroscopic – radiative transfer1 Introduction
While there is general consensus that type Ia supernovae (SNe Ia) result from the explosion of carbon-oxygen white dwarfs in binary systems, there is no agreement as to the detailed properties of the progenitor system or how the white dwarf is brought to explosion. This is a particularly interesting question given that SNe Ia are used as cosmological standardizable candles (Phillips, 1993) and have heralded dark energy (Riess et al., 1998; Perlmutter et al., 1999).
The two main contenders are the single-degenerate (SD), and the double-degenerate (DD) scenarios. In the SD scenario, a CO white dwarf accretes material from a non-degenerate companion. If the white dwarf has a mass close to the Chandrasekhar limit ( , hereafter referred to as M), accretion causes the central temperature to rise until oxygen burning is triggered (e.g., Whelan & Iben, 1973; Nomoto et al., 1984). If on the other hand the white dwarf has a mass significantly below M, a detonation can be triggered on the surface of the white dwarf if the accreting material is He. Under specific circumstances a shock wave can then propagate to the centre of the white dwarf and detonate it (an “edge-lit” “double detonation”) (Livne & Arnett, 1995). In the DD scenario, two white dwarfs in a close orbit around each other merge after radiating gravity waves (Webbink, 1984; Iben & Tutukov, 1984), and the resulting massive white dwarf explodes, leaving no remnant, if it avoids accretion-induced collapse (Nomoto et al., 1991). Explosion is more likely if the merging occurs “violently” (Pakmor et al., 2010). Recently, two more scenarios have been proposed. The head-on collision of two white dwarfs, possibly aided by a third body in a triple system, is a variation of the DD scenario which may lead to explosion and the creation of two distinct ejecta (Rosswog et al., 2009; Kushnir et al., 2013). This scenario has specific observational consequences (Dong et al., 2015). Finally, the explosion of a white dwarf engulfed in a common envelope by the outer layers of an asymptotic giant branch (AGB) star and merging with the AGB star’s degenerate core, the “core-degenerate” scenario, has also been proposed as a channel to produce SNe Ia (e.g., Livio & Riess, 2003; Kashi & Soker, 2011; Ashall et al., 2021). Livio & Mazzali (2018) review possible progenitor/exposion channels.
While it is difficult to imagine how all these physically motivated scenarios, some of which are quite aspherical in nature, might possibly coexist at all SN luminosities and yield events that follow quite closely the relation between SN luminosity and light curve width (Yungelson & Kuranov, 2017), it is also not unreasonable to expect that they all exist, perhaps in some corner of parameter space, while the main relation may be due to a single, dominant channel.
The question we may ask is then, is there evidence in the data for systematic differences along (or across) the luminosity sequence, which could hint to the presesence, or even dominance, of a particular channel, at least in specific luminosity/light-curve width ranges. This search does not appear to yield clear results if it is performed based on early-time data. The temperature in the line-forming region is a smooth function of luminosity (Nugent et al., 1995; Hachinger et al., 2008). The luminosity distribution of SNe Ia, however, seems to show two peaks: a main one, where all normal and moderately peculiar SNe lie (including the “hot” 1991T class Filippenko et al., 1992b; Phillips et al., 1992), and a secondary, low-luminosity peak, which includes all rapidly declining SNe, most notably the “cool” 1991bg class (Filippenko et al., 1992a; Leibundgut et al., 1993; Turatto et al., 1996). These two peaks appear to be quite distinct, with few transitional events straddling in between (Ashall et al., 2016b). The low-luminosity group is not only sub-dominant in number. It also shows a strong preference for passive galaxies, suggesting that low-luminosity SNe Ia originate from older progenitor systems. Simple evolutionary considerations suggest that scenarios involving DD systems may be on average older than SD ones. Although exceptions are possible that can alter this picture somewhat, the evidence for this remains circumstantial and limited.
We have shown in previous work that the late-time (nebular) spectra of SNe Ia, which probe the inner ejecta, may more easily yield information about the physics of the explosion and thus, more or less directly, those of the progenitors (e.g., Mazzali & Hachinger, 2012). One striking feature distinguishing low-luminosity SNe Ia from normal ones at late times is the dominance of [Fe iii] emission at the lowest velocities. These lines are also present in “normal” SNe Ia, but they typically coexist with [Fe ii] lines. This unexpected property was observed in SN 1991bg, where [Fe iii] lines dominate at epochs beyond 200 days and velocities below 3000 km s-1(Turatto et al., 1996; Mazzali & Hachinger, 2012), and similarly in the 91bg-like SN 1999by (Silverman et al., 2012). They are also strong in SN 2003hv (Leloudas et al., 2009; Mazzali et al., 2011) and in SN 2007on, where a complex spectrum requires two components with different - opposite - line-of-sight velocities (Mazzali et al., 2018). At the low densities of the late-time SN ejecta (at epochs exceeding 300 days for normal SNe, but as early as 200 days for sub-luminous ones), a high ionization is less the result of a high temperature than it is of low density, which suppresses recombination more efficiently than high temperature favours it. Therefore, if low-luminosity SNe Ia show a higher degree of ionization at late times, this is likely to indicate a low central density. These SNe are also typically characterised by lower velocity ejecta at early times (Benetti et al., 2005). The combination of these factors, as well as the early transition to the nebular regime, suggests that low-luminosity SNe Ia are the explosion of progenitors of lower mass than normal SNe Ia. Their progenitors are likely to be white dwarfs that did not reach M when they exploded. Such white dwarfs can only be exploded by compression, in violent events such as mergers or collisions of two white dwarfs.
There are not many low-luminosity SNe Ia for which nebular spectra are available. This is in part due to their faintness, but also to the relative scarceness of these events. It is therefore interesting to analyse data that are available, in order to test different explosion scenarios. This is particularly true when the spectra show peculiarities that had not been seen before.
One outstanding example of this is SN 2010lp. While it appeared to be similar spectroscopically to SN 1991bg near maximum, showing a cool spectrum and low line velocities (Prieto & Morrell, 2011, see also Sect. 2 below), it was not very sub-luminous. An estimated optical peak luminosity of erg s-1 (Kromer et al., 2013) is comparable to that of low-luminosity, transitional SNe Ia such as 1986G (Ashall et al., 2016a). The decline rate of the light curve after maximum, ( mag, Kromer et al., 2013), however, was similar to that of normal SNe Ia. In the nebular phase, SN 2010lp was again similar spectroscopically to SN 1991bg, except that, instead of showing narrow [Fe iii] lines at low velocities, it displayed [O i] 6300,6363 Å emission (Taubenberger et al., 2013). Not only had these lines not been seen before in any SN Ia, but they were very narrow in SN 2010lp, suggesting that they originate in the centre of the ejecta, and they showed two components, one blue-shifted and the other red-shifted by similar velocities. Double-peaked profiles had been observed only in the Na i D line in SN 2007on (Dong et al., 2015), but the two components were not as distinct (Mazzali et al., 2018). The clear separation of the two components of the [O i] line in SN 2010lp suggests that the emission originates in two separate, low-velocity blobs of material, as both spherically symmetric options, a shell and a disc configuration, would not create such sharp separation between the two peaks. A transition to an [Fe iii]-dominated phase was not observed in SN 2010lp, indicating that at low velocities iron was absent, or if it was present either the density was not very low or that the presence of oxygen led to a higher electron density , making recombination easier. The late-time spectrum of SN 2010lp was taken at an epoch of 264 days after maximum. Taubenberger et al. (2013, Fig. 4) compare it to the spectrum of SN 1991bg obtained days after peak, showing the impressive difference between them despite the underlying similarity.
Kromer et al. (2013) compared an early-time spectrum and the light curve of SN 2010lp with their simulation of a violent merger of two CO white dwarfs of mass 0.90 and 0.76 , and showed good agreement, which supports the merger scenario for this peculiar SN Ia. In this particular type of merger, Kromer et al. (2013) found that the centre of the ejecta are dominated by unburned oxygen coming from the disrupted secondary. This is at least one step towards what is observed in SN 2010lp, but the central oxygen has an almost spherically symmetric distribution, which is unlikely to produce two distinct components of the [O i] emission in the nebular phase. The analysis of Kromer et al. (2013) did not extend to the nebular epoch. Further study is therefore warranted. A merger scenario had been proposed for SN 1991bg itself (Pakmor et al., 2011; Mazzali & Hachinger, 2012), suggesting that the merger channel represents a significant contribution to low-luminosity SNe Ia.
As the analysis of the nebular spectrum in Taubenberger et al. (2013) was mostly qualitative, we aim to characterise the inner ejecta more quantitatively. In particular, we determine the abundance and distribution of the central oxygen. To this end we use our non-local thermodynamic equilibrium (NLTE) SN nebular code, which is briefly described in Section 3. Before that, we present a low resolution spectrum of SN 2010lp obtained at Gemini that had not been analysed before. As the spectrum shows interstellar Na i D absorptions from both the Galaxy and the host (which has redshift , Taubenberger et al., 2013), it is very useful in order independently to determine the reddening to SN 2010lp (Sect. 2), which turns out to be smaller than previously estimated. In Sect. 4 our possible solution for the nebular spectrum of SN 2010lp is presented, and in Sect. 5 our results and their implications are discussed. Sect. 6 concludes the paper.
2 Gemini-N spectrum and reddening
One of the most uncertain parameters that may affect the modelling of SN 2010lp is reddening.
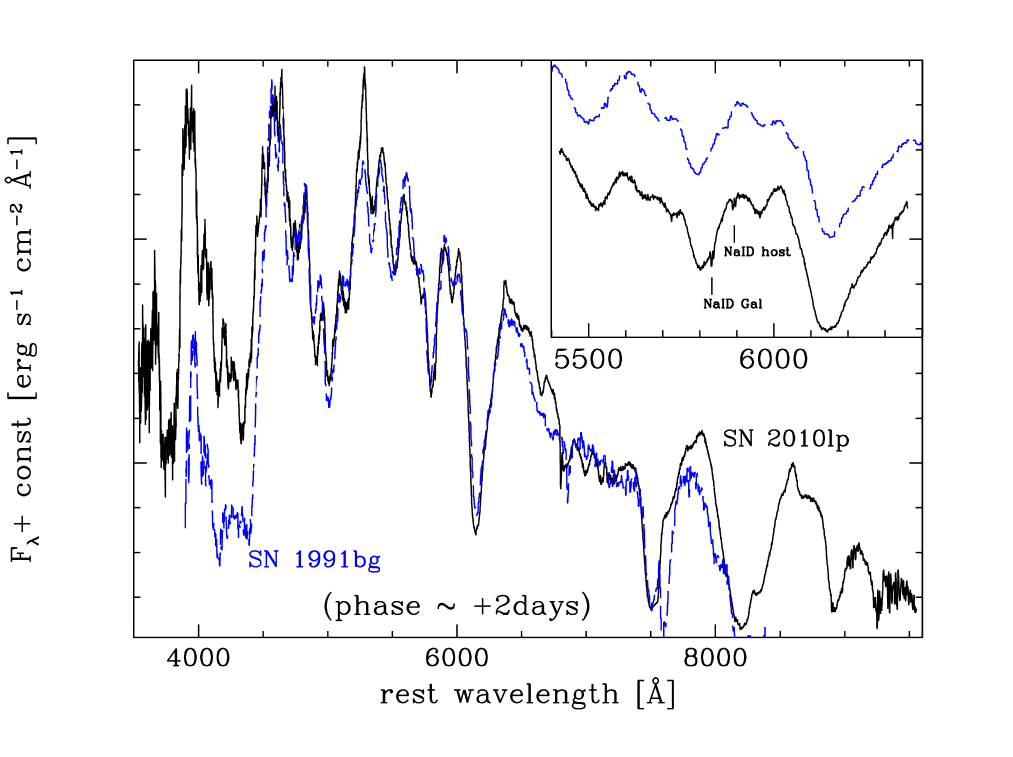
Here we present and analyse an early, unpublished spectrum of SN 2010lp obtained with the 8.1-m Gemini-North telescope equipped with the Multi-Object Spectrograph GMOS-N. The data were obtained using the B600+G5307 disperser with a a central wavelength of 500 nm and the R400+G5305 disperser with a central wavelength of 750 nm. Observations were performed on Jan. 10, 2011 (MJD(avg)=55571.291; i.e., days after the time of maximum assumed by Taubenberger et al. (2013). They consisted of 600 seconds of integration time, and cover the spectral range 3570 to 9625 Å. The data were reduced using the gemini gmos package contained within the IRAF environment. The extracted 1-D spectra of SN 2010lp were flux-calibrated using a sensitivity function computed from archival observations of the standard star BD+28 4211 obtained on MJD 55534.27. The combined, flux-calibrated spectrum is shown in Fig. 1, where it is compared with a coeval spectrum of SN 1991bg dereddened with mag assuming a standard extinction law (Cardelli et al., 1998).
Interestingly, the spectrum of SN 2010lp shows clear Na i D interstellar absorption lines. A Galactic component has equivalent width EW(Na i D) Å, while the component at the redshift of the host galaxy () has EW(Na i D) Å. Since Galactic reddening is E(B–V) mag (Schlafly & Finkbeiner, 2011) using the same relation between EW(Na i D) and E(B–V) as in the Galaxy (E(B–V) / EW(Na i D) mag Å-1), we obtain E(B–V) mag. This is intermediate between the values derived using two empirical relations between EW(Na i D) and reddening. One, presented by Turatto et al. (2003), gives E(B-V) mag, while the other, proposed by Poznanski et al. (2012), yields E(B–V) mag. These relations are subject to a large uncertainty (Phillips et al., 2013), such that we may estimate E(B–V) mag. The total reddening towards SN 2010lp is then E(B-V) mag. When the spectrum of SN 2010lp is dereddened by this amount, both the continuum and line features look very similar to the spectrum of SN 1991bg.
The velocity of the Si ii 6355 Å absorption in this near-maximum spectrum is km s-1. This low expansion velocity is typical of the Faint SN Ia subclass as defined in Benetti et al. (2005), whose prototype is actually SN 1991bg. This confirms the similarity of the two SNe.
3 Method
Synthetic nebular spectra were computed using our NLTE code. The code is based on the assumptions outlined in Axelrod (1980). The gas in the SN nebula is assumed to be heated by collisions with the high-energy particles generated in the thermalization process of the gamma-rays and positrons emitted in the decay chain 56Ni 56Co 56Fe, and it cools via the emission of (mostly) forbidden lines. Some strong permitted transitions are also considered.
The radioactive decay of 56Ni and 56Co produces both gamma-rays and positrons, which deposit their energy in the SN ejecta and thus power the SN light curve. Gamma-rays carry most of the radioactive energy released by the decay. Positrons are responsible for only % of it. Deposition is computed using a Montecarlo method, as outlined in Cappellaro et al. (1997) and Mazzali et al. (2001a). Constant opacities are used for both processes: cm2g-1 for gamma-rays and cm2g-1 for positrons. At the times considered here the density in the ejecta is still high enough that gamma-rays deposit efficiently enough to make the dominant contribution to the energy deposition, despite the significantly lower opacity to which they are subjected.
After computing the energy deposition, the ionization and the thermal balance are solved in NLTE (Ruiz-Lapuente & Lucy, 1992). Ionization is assumed to be entirely due to impact with the high-energy particles produced by the deposition of the radioactive products, while photoionization is assumed to be negligible (Kozma & Fransson, 1998). The rate of impact ionization and the recombination rate are balanced for each ion to compute the degree of ionization. Level populations are computed solving the rate equations under the assumption of thermal balance, i.e., equating the non-thermal heating rate and the rate of cooling via line emission. Under the assumption that the nebula is optically thin, radiation transport is not performed. The resulting line emissivity is used to compute the emerging spectrum.
The code has been used for both SNe Ia (e.g., Mazzali & Hachinger, 2012; Mazzali et al., 2011) and SNe Ib/c (e.g., Mazzali et al., 2007b), and it can yield a description of the inner layers of the SN ejecta. Both a one-zone and a one-dimensional version are available. The latter treats ejecta stratification in both density and abundance.
4 Results
Taubenberger et al. (2013) convincingly showed that SN 2010lp displayed a nebular spectrum closely resembling that of SN 1991bg about 200 days after maximum. The main difference was the absence of the narrow [Fe iii] lines. These were replaced by two narrow (full width at half maximum km s-1) emissions which correspond to [O i] 6300, 6363 Å, with a blue- and a red-shifted component. Mazzali & Hachinger (2012) showed that the higher ionization [Fe iii] lines in SN 1991bg are emitted from a small volume, presumably at the centre of the ejecta, bounded by a velocity of km s-1. A low central density was likely to be responsible for the high ionization.
As Taubenberger et al. (2013) remarked, the width of the [O i] lines suggests that they are also emitted at the centre of the ejecta, by the lowest-velocity material. Taubenberger et al. (2013) wondered how the same ejecta structure that produced Fe iii in SN 1991bg can yield a low ionization and neutral oxygen lines (at a later epoch) in SN 2010lp. We argue that the different mean molecular weight of an oxygen-dominated gas (with mean molecular weight ) with respect to an iron-dominated gas () would lead to a similar electron density in the two gases even if on average only every other oxygen atom released an electron in an oxygen-dominated gas, while every iron atom released electrons (such that both Fe ii and Fe iii are present in similar amounts) in an iron-dominated gas. Recombination depends on the product , where is the number density of ions. Given that in a partially ionized oxygen-dominated gas is times as large as in an iron-dominated gas, we may expect the ionization to be lower in the former at similar mass density.
As a proof of principle, we therefore started from the density/abundance profile (the “explosion model”) that Mazzali & Hachinger (2012) used for SN 1991bg, and replaced iron with oxygen in the innermost layers, up to a velocity of 2000 km s-1, in agreement with the width of the observed [O i] lines. Below we present and discuss the various steps of the procedure we adopted.
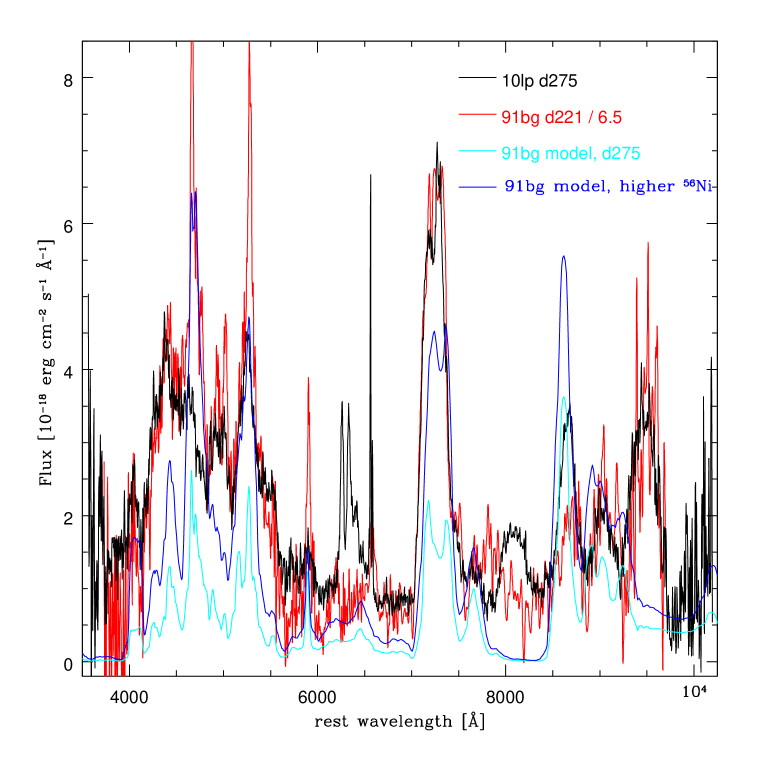
First, we compare the spectra of SNe 2010lp and 1991bg with synthetic spectra obtained with the model that was used to match SN 1991bg. Fig. 2 shows the spectrum of SN 2010lp obtained 264 days after maximum (Taubenberger et al., 2013) and that of SN 1991bg obtained 203 days after maximum (corresponding to an epoch days after explosion), scaled down in flux to match the spectrum of SN 2010lp. Both spectra are shown in the rest frame and without a reddening correction. Two synthetic spectra are also shown: one is the model used for SN 1991bg (Mazzali & Hachinger, 2012), now computed at an epoch of 275 days, which should be a reasonable approximation for the epoch of the spectrum of SN 2010lp, and the other is a spectrum obtained using the same density structure and epoch but with an increased 56Ni mass ( instead of ), which yields a closer match to the observed flux of SN 2010lp (but not to its detailed features). The synthetic spectra are reddened with , the reddening assumed for SN 2010lp. As expected, the synthetic spectrum reproduces some features of SN 2010lp, but shows a narrow [Fe iii] emission feature near 4700 Å, which is absent in SN 2010lp. The feature near 5200 Å contains [Fe ii] emission from the surrounding layers and is not completely suppressed even in SN 2010lp.
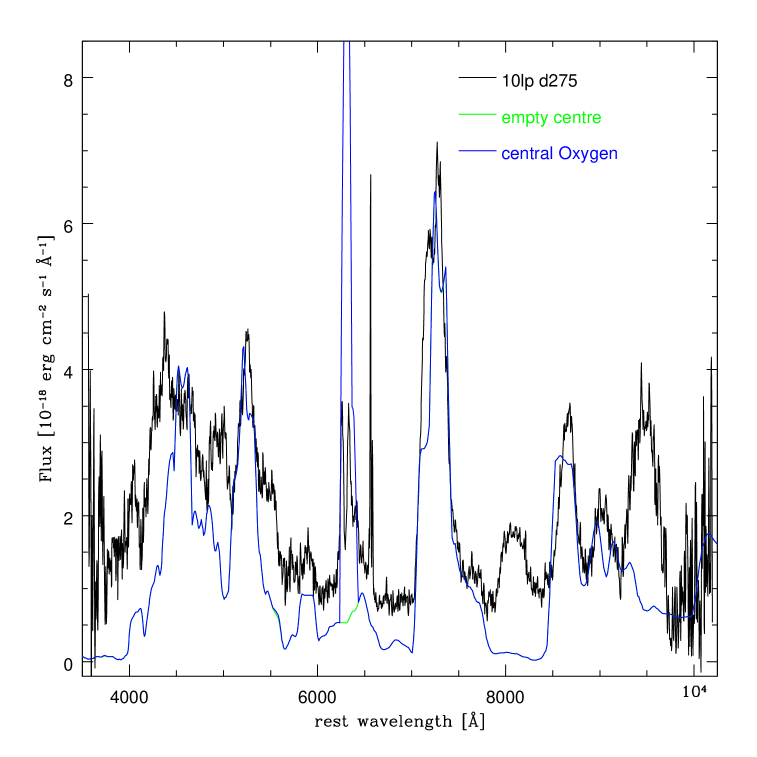
In order to reproduce the spectrum of SN 2010lp we then performed a number of experiments. The lack of central [Fe iii] emission and the presence of the [O i] lines suggest that one should test what happens to the SN 1991bg model if the inner iron-rich zone, inside a velocity of 3000 km s-1 is removed and replaced with oxygen. This is shown in Fig. 3. Two synthetic spectra are shown in that figure. In one the central region has been completely removed. As expected, this spectrum does not show the narrow [Fe iii] peaks. It is characterised by flat-top profiles in several lines (e.g., Na i D/[CoIII], the Ca ii IR triplet, which is however the result of a blend with [Fe ii] emission), reflecting the lack of low-velocity emission. The other synthetic spectrum was obtained by filling the inner region with oxygen only. This corresponds to a low-velocity oxygen mass of 0.065 . The corresponding synthetic spectrum shows an extremely strong [O i] line (obviously the two peaks are not expected to be reproduced in this one-dimensional, spherically symmetric model). Oxygen is heated by the particles produced in radioactive decays just outside the inner zone. The surrounding 56Ni zone, although not particularly rich in 56Ni (0.08 , as in the synthetic spectrum shown in Fig. 2 as “higher 56Ni”), is more than sufficient to excite the upper levels of the [O i] Å transition in the centre of the ejecta.
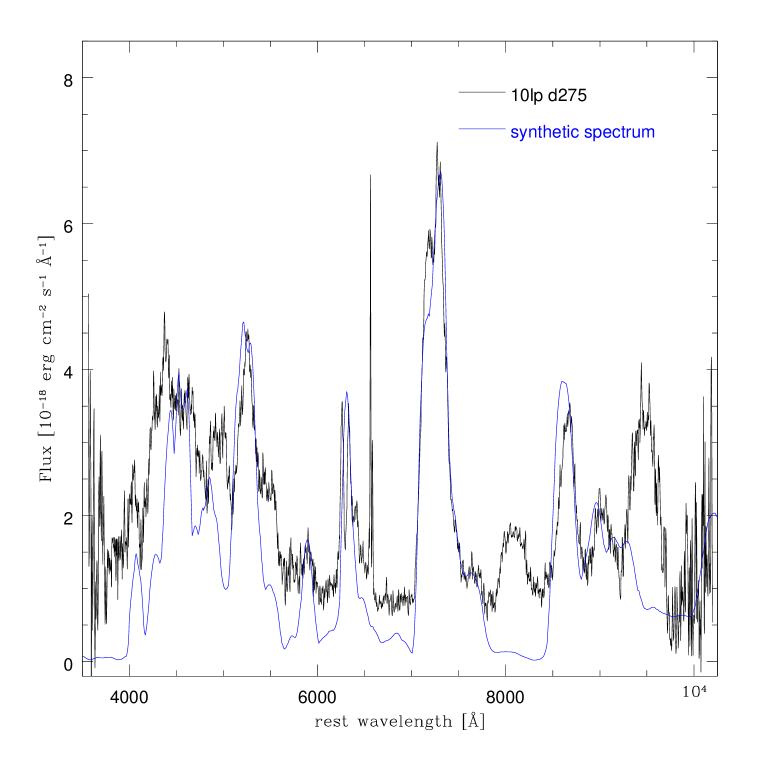
Given that even a rather small amount of 56Ni surrounding a central, oxygen-dominated zone is sufficient to cause much stronger [O i] emission lines than observed, and that the mass of 56Ni is constrained by the overall SN luminosity, it is likely that a smaller mass of central oxygen is present in SN 2010lp than in the model presented in Fig. 3. If we choose not to modify the density structure that was adopetd for SN 1991bg (the main reason for this is to avoid creating an untested explosion model as neither light curve information nor multiple spectra are available for SN 2010lp) we need to replace some of the oxygen at low velocity with other elements. Some lines (e.g., Na i D/[Co iii]) show flat-top profiles in the model with central oxygen only, which justifies this procedure. We therefore replace some of the central oxygen with a mixture containing a small amount of 56Ni, as well as the Intermediate Mass Elements (IME) that are typically abundant in the ejecta of a SN Ia (Si, S, Ca). Despite the additional heating provided by the centrally located 56Ni, cooling by ions other than O i, combined with the reduced oxygen abundance, reduces the emission in the [O i] doublet significantly. The model has a central oxygen mass (below 3000 km s-1) of 0.035 . The 56Ni content inside that velocity is only 0.015 , while IME account for 0.015 . The synthetic spectrum, which is shown in Fig. 4, offers a reasonable reproduction of the observed spectrum. We did not try to optimise it any further, as the observed [O i] profile cannot be reproduced exactly with a one-dimensional model. The important result is that a very small mass of oxygen at low velocity is sufficient to generate emission lines comparable in strength to the observed ones in SN 2010lp. This should impact on the possible explosion scenarios for SN 2010lp.
While the estimate of the oxygen mass appears to be reasonable, in order to reproduce in detail the shape of the [O i] emission a multi-dimensional approach is required. Such a clearly defined double-peaked [O i] emission as is observed in SN 2010lp cannot be obtained from a shell or an edge-on disc. In both of these cases significantly more emission at zero line-of-sight velocity would be seen, while in SN 2010lp the two [O i] peaks, which are blue- and red-shifted by km s-1, respectively, are well separated. The more likely scenario is that two oxygen-rich blobs are ejected in opposite directions when the explosion occurs. As it is most likely that the actual direction of motion of the two blobs is not at a very large angle with respect to the line of sight, we may assume that the blobs have low spacial velocity ( km s-1) and therefore remain embedded within the inner ejecta, where they can be excited by the radioactive decay products from the 56Ni that surrounds them and possibly coexists with them. This is a complicated scenario to simulate, so we attempt to reproduce it qualitatively adding together synthetic spectra computed as one-zone models.
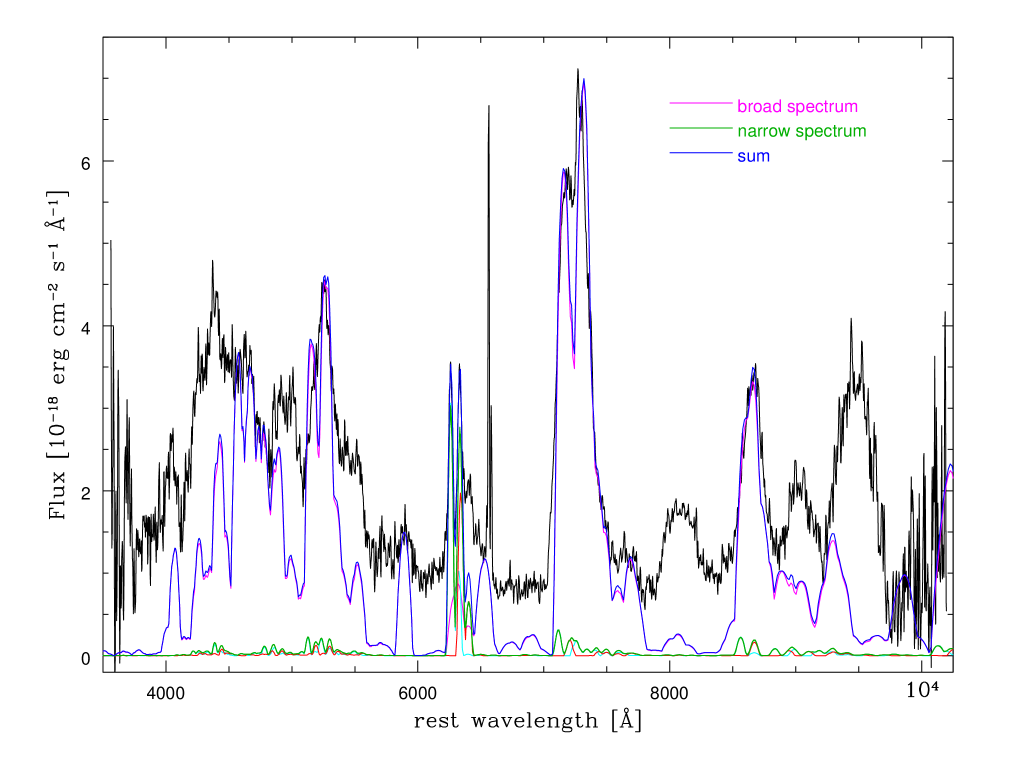
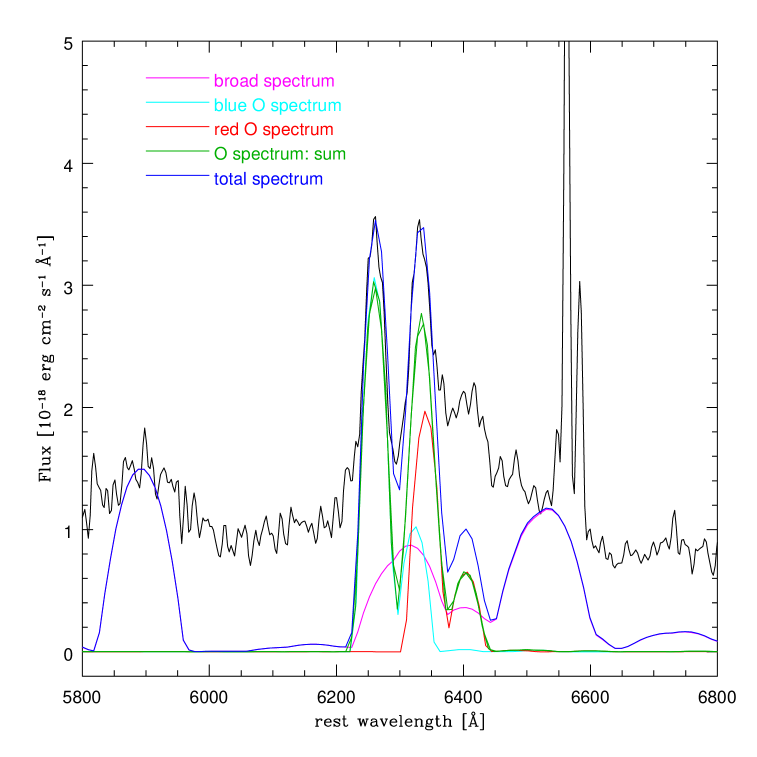
Using a one-zone approach we produce the spectra of two oxygen-rich blobs, and add them to a one-zone simulation of the ejecta. While this is interesting as a proof-of-principle, the details of the result should be treated as an approximation at best. Two small blobs are modelled. One is blue-shifted by 1900 km s-1, the other is red-shifted by the same velocity with respect to the observer. Both blobs have boundary velocity of 1500 km s-1. The blue-shifted blob contains 0.019 of oxygen, 0.002 of 56Ni (which is used in these models to excite the gas), and small amounts of IME, for a total mass of 0.022 . The red-shifted blob contains 0.013 of oxygen and 0.0014 of 56Ni, for a total mass of 0.015 . In both cases, the 56Ni/O ratio is very small, . When the spectra of these two blobs are summed to the rest of the spectrum emitted by SN 2010lp at higher velocities, a reasonable reproduction of the observed profile is obtained. The outer ejecta are treated as a single emitting zone bounded by an outer velocity of 3500 km s-1, containing a total mass of including 0.07 of 56Ni and 0.02 of oxygen. Fig. 5 shows the overall spectrum, while Fig. 6 is a blow-up of the [O i] emission region. The large mass depends on the inclusion of a significant mass of IME (). The relatively low boundary velocity of the nebula leads to a split of the Ca ii] 7291, 7323 Å line from the [Fe ii]-dominated emission, with strongest lines at 7155 and 7172 Å. It also offers a better match to the emission near 8700 Å, which is a blend of the Ca ii IR triplet (8498, 8542, 8662 Å), [Fe ii] 8617 Å, and [C i] 8727 Å.
5 Discussion
While it was not the aim of this work to reproduce the nebular spectrum of SN 2010lp exactly, we have shown that a density structure similar to that of SN 1991bg, characterised by a low central density, reproduces the main features of the observed spectrum. When the inner, 56Ni-rich region is replaced by an oxygen-dominated mixture of lighter elements the [O i] emission seen in SN 2010lp can be reproduced in overall intensity. A more exact match of the double-peaked emission profile requires using two small blobs moving in opposite directions at low velocity. The oxygen mass that is required to match the emission line intensity is quite small, a total of . There is of course significant uncertainty on these values. Lacking a definitive bolometric light curve111Kromer et al. (2013) present a preliminary bolometric light curve of SN2010lp, but we do not know what reddening was used and do not have the original photometry, which is still unpublished. we cannot confidently estimate the overall 56Ni mass, which affects the excitation of the central oxygen at late times. The lack of a nebular spectral series makes it difficult to determine accurately the densities in the inner layers: the changing ionization as a function of time is very important in this respect (e.g., Mazzali & Hachinger, 2012; Mazzali et al., 2020).
We should note here that a few features in the red part of the spectrum are not reproduced. In particular, emissions near 8100, 9000 and 9500 Å are weak or absent in our synthetic spectra. The emission near 8100 Å may have contributions from [Fe i], but the relative expected line strengths do not match the observed profile, and other [Fe i] lines are not seen. Our synthetic spectrum shows a weak feature, which is caused almost entirely by [Fe ii] lines. If a weak underlying continuum was removed from the data the discrepancy would not be as large. Another possibility is poorly known atomic data for these lines. This may also affect the emission near 9000 Å, which our spectra only partially reproduce, while we have no suitable candidate for the emission near 9500 Å. The emissions near 9000 and 9500 Å were also seen in SNe 1991bg and 1999by, while the one near 8100 Å was not (Fig. 2, also Taubenberger et al., 2013).
One scenario in which central oxygen emission has been predicted is that of the deflagration of a Chandrasekhar-mass carbon-oxygen white dwarf. In the slow burning of a deflagration wave mixing can drag unburned material to the inner parts of the ejecta. This configuration is expected to produce strong central [O i] emission (Kozma et al., 2005). However, the low central density and the implied low ejected mass that are inferred from the comparison with SN 1999bg and the nebular spectral modelling both suggest that SN 2010lp was itself a sub-M SN Ia.
A number of possible scenarios may then be invoked. Accretion of helium from a companion on the surface of a sub-M mass white dwarf can cause the surface of the white dwarf to ignite (Livne & Arnett, 1995). If the ensuing shock wave can propagate and focus at the centre of the star, the white dwarf can explode via a central detonation (Shen & Moore, 2014). Given the requirement of central ignition, this scenario is not likely to lead to two distinct blobs of unburned material.
The violent merger of two sub-M mass white dwarfs can also lead to ignition and explosion, as discussed above. If the two white dwarfs are of sufficiently different mass, as in the case presented by Kromer et al. (2013), low-velocity oxygen may be the result of incomplete burning of some part of the less massive white dwarf that is disrupted in the merger process. Kromer et al. (2013) present a simulation of a merger of two white dwarfs of mass 0.9 and 0.76 , respectively, and show that as much as 0.5 of oxygen from the disrupted secondary are left at km s-1. This is much more than we find in our simulations of the nebular spectrum of SN 2010lp, and it has a spherical distribution, which would not be compatible with the spectrum of SN 2010lp, but it is at least one step in the required direction. Compared to their model, SN 2010lp produced much less oxygen, and it ejected it in two blobs. They also used a larger value of the reddening than we find here, and therefore had to use a 0.9 white dwarf as the primary of the system in order to synthesize enough 56Ni (0.18 ). With the smaller reddening determined here the amount of 56Ni necessary to fit the light curve of SN 2010lp would be less. We estimate here that of 56Ni were sufficient to energise the nebular spectrum of SN 2010lp, while for SN 1991bg Mazzali & Hachinger (2012) estimated 0.06 . Some merger scenario with slightly different masses and mass ratios might produce the required mass and distribution of oxygen.
A third possibility is that the two blobs mark part of the material that survives the explosion following the impact (collision) of two sub-M white dwarfs, as in the models of Kushnir et al. (2013). Although the original model of white dwarfs collision envisages the creation of two central blobs of 56Ni it may not be excluded that some particular configuration, or range of white dwarf masses, may lead to an outcome similar to what is diagnosed in SN 2010lp. The question in this case might be, what would then set these inner regions into expansion?
Finally, another possible way to place material at low velocity is for it to be companion material stripped off and swept up by the impact with the SN ejecta, such as is expected for a hydrogen-rich companion (Marietta, Burrows, & Fryxell, 2000). Could oxygen lost from a double-degenerate system during merging lead to such a configuration? What would cause two distinct blobs?
6 Conclusions
Synthetic spectra have been computed for the nebular spectrum of the sub-luminous, peculiar SN Ia 2010lp. The overall spectrum can be reproduced reasonably well if a sub-M explosion model is used, as in SN 1991bg. In SN 1991bg the presence of low-velocity 56Ni is consistent with a scenario that involves the violent merger of two sub-M mass white dwarfs, although the mass of 56Ni synthesised should be less than in the models that have been produced so far.
In the case of SN 2010lp, the observed low-velocity, double peaked [O i] emission can be reproduced replacing the central 56Ni with oxygen. The amount of oxygen that is required to produce the observed emission is actually small ( ), and the emission is caused by two oxygen-rich blobs, moving in opposite directions.
If two low-mass white dwarfs merged or collided to give rise to the SN, their respective central regions should suffer very limited burning in order to reproduce the observations of SN 2010lp. The lack of corresponding low-velocity carbon emission lines suggests that at least carbon from the progenitor did burn to oxygen.
Some merger models predict the presence of unburned oxygen at low velocities, but no published model predicts the formation of separate oxygen blobs. Such blobs may possibly be observed in more detailed three-dimensional hydrodynamical simulations, covering perhaps a different space of parameters (white dwarf masses, mass ratio), or may require the development of a completely new scenario.
Acknowledgments
M. Stritzinger is supported by the VILLUM FONDEN (grant number 28021) and the
Independent Research Fund Denmark (IRFD; 8021-00170B). C. Ashall is supported by
NASA grant 80NSSC19K1717 and NSF grants AST-1920392 and AST-1911074. The
maximum-light spectrum of SN 2010lp was obtained with the Gemini North
telescope as part of program identification GN-2010B-Q-67 (PI M. Stritzinger).
The authors wish to recognize and acknowledge the very significant cultural role
and reverence that the summit of Maunakea has always had within the indigenous
Hawaiian community. We are most fortunate to have the opportunity to conduct
observations from this mountain.
We wish to thank the anonymous referee for a fair, competent report.
Data availability
The photometric and spectroscopic data presented in this article are publicly available via the Weizmann Interactive Supernova Data Repository, at https://wiserep.weizmann.ac.il.
References
- Ashall et al. (2016a) Ashall, C., Mazzali, P. A., Pian, E., & James, P. A. 2016, MNRAS, 433, 1891
- Ashall et al. (2021) Ashall, C., et al. 2021, ApJ, 922, 205
- Ashall et al. (2016b) Ashall, C., Mazzali, P., Sasdelli, M., & Prentice, S. J. 2016, MNRAS, 460, 3529
- Ashall et al. (2019) Ashall, C., et al. 2019, MNRAS, 487, 5824
- Axelrod (1980) Axelrod, T. S. 1980, Ph.D. Thesis, Univ. of California, Santa Cruz.
- Benetti et al. (2005) Benetti, S., et al. 2005, ApJ, 623, 1011
- Cardelli et al. (1998) Cardelli, J. A., Clayton, G. C. & Mathis, J. S. 1998, ApJ, 329, L33
- Cappellaro et al. (1997) Cappellaro, E., Mazzali, P. A., Benetti, S., Danziger, I. J., Turatto, M., della Valle, M., & Patat, F. 1997, A&A, 328, 203
- Dong et al. (2015) Dong, S., Katz, B., Kushnir, D., & Prieto, J. L. 2015, MNRAS, 454, L61
- Filippenko et al. (1992a) Filiipenko, A. V., et al. 1992, AJ, 104, 1543
- Filippenko et al. (1992b) Filiipenko, A. V., et al. 1992, ApJ, 384, L15
- Hachinger et al. (2008) Hachinger, S., Mazzali, P. A., Tanaka, M., Hillebrandt, W., & Benetti, S. 2008, MNRAS, 389, 1087
- Iben & Tutukov (1984) Iben, I., Jr., & Tutukov, A. V. 1984, ApJS, 54, 335
- Kashi & Soker (2011) Kashi, A., & Soker, N. 2011, MNRAS, 417, 1466
- Kozma et al. (2005) Kozma, C., Fransson, C., Hillebrandt, W., Travaglio, C., Sollerman, J., Reinecke, M., Röpke, F. K., & Spyromilio, J. 2005, A&A, 437, 983
- Kozma & Fransson (1998) Kozma, C. & Fransson, C. 1998, ApJ, 497, L431
- Kromer et al. (2013) Kromer, M., et al. 2013, ApJ, 778, L18
- Kushnir et al. (2013) Kushnir, D., Katz, B., Dong, S., Livne, E., & Fernández, R. 2013, ApJ, 778, L37
- Leibundgut et al. (1993) Leibundgut, B., et al. 1993, AJ, 105, 301
- Leloudas et al. (2009) Leloudas, G., et al. 2005, A&A, 505, 265
- Livio & Mazzali (2018) Livio, M. & Mazzali, P. 2018, Phys. Rep., 736, 1
- Livio & Riess (2003) Livio, M. & Riess, A. G. 2003, ApJ, 594, L93
- Livne & Arnett (1995) Livne, E. & Arnett, D. 1995, ApJ, 452, 62
- Marietta, Burrows, & Fryxell (2000) Marietta, E., Burrows, A., & Fryxell, B. 2000, ApJS, 128, 615
- Mazzali et al. (2018) Mazzali, P. A., Ashall, C., Pian, E., Stritzinger, M. D., Gall, C., Phillips, M. M., Höflich, P., & Hsiao, E. 2018, MNRAS, 476, 2905
- Mazzali et al. (2020) Mazzali, P. A., et al. 2020, MNRAS, 494, 2809
- Mazzali & Hachinger (2012) Mazzali, P. A., & Hachinger, S. 2012, MNRAS, 424, 2926
- Mazzali et al. (2011) Mazzali, P. A., Maurer, I., Stritzinger, M., Taubenberger, S., Benetti, S., & Hachinger, S. 2011, MNRAS, 416, 881
- Mazzali et al. (2001a) Mazzali, P. A., Nomoto, K., Cappellaro, E., Nakamura, T., Umeda, H., & Iwamoto, K. 2001a, ApJ, 547, 988
- Mazzali et al. (2007b) Mazzali, P. A., et al. 2007b, ApJ, 661, 892
- Nomoto et al. (1991) Nomoto, K., & Kondo, Y. 1984, ApJ, 367, L19
- Nomoto et al. (1984) Nomoto, K., Thielemann, F., & Yokoi, K. 1984, ApJ, 286, 644
- Nugent et al. (1995) Nugent, P., Phillips, M., Baron, E., Branch, D., & Hauschildt, P. 1995, ApJ, 455, L147
- Pakmor et al. (2011) Pakmor, R., Hachinger, S., Röpke, & Hillebrandt, W. 2010, A&A, 528, A117
- Pakmor et al. (2010) Pakmor, R., Kromer, M., Röpke, F. K., Sim, S. A., Ruiter, A. J., & Hillebrandt, W. 2010, Nature, 463, 61
- Perlmutter et al. (1999) Perlmutter S., et al. 1999, ApJ, 517, 565
- Prieto & Morrell (2011) Prito, J.L. & Morrell, N. 2011, CBET, 2613, 11
- Phillips (1993) Phillips, M. M. 1993, AJ, 103, 1632
- Phillips et al. (2013) Phillips, M. M. 2013, ApJ, 779, 38
- Phillips et al. (1992) Phillips, M. M., Wells, L. A., Suntzeff, N. B., Hamuy, M., Leibundgut, B., Kirshner, R. P., Foltz, C. B. 1992, ApJ, 413, L105
- Poznanski et al. (2012) Poznanski, D., Prochaska, J. X., & Bloom, J. S. 2012, MNRAS, 426, 1465
- Riess et al. (1998) Riess A. G., et al. 1998, AJ, 116, 1009
- Ruiz-Lapuente & Lucy (1992) Ruiz-Lapuente, P. & Lucy, L.B. 1992, ApJ, 400, 127
- Schlafly & Finkbeiner (2011) Schlafly, E. F. & Finkbeiner, D. P. 2011, ApJ, 737, 103
- Silverman et al. (2012) Silverman, J. M., et al. 2012, MNRAS, 425, 1789
- Rosswog et al. (2009) Rosswog, S., Kasen, D., Guillochon, J., & Ramirez-Ruiz, E. 2009, ApJ, 705, L128
- Shen & Moore (2014) Shen K. J., Moore K. 2014, ApJ, 797, 46
- Taubenberger et al. (2013) Taubenberger, S., Kromer, M., Pakmor, R., Pignata, G., Maeda, K., Hachinger, S., Leibundgut, B., & Hillebrandt, W. 2013, ApJ, 775, L43
- Turatto et al. (2003) Turatto M., Benetti S., & Cappellaro, E. 2003, in Leibundgut, B., & Hillebrandt, W., eds, ESO Astrophys. Symp., From Twilight to Highlight: The Physics of Supernovae: Proceedings of the ESO/MPA/MPE Workshop. Springer-Verlag, Berlin, p. 200
- Turatto et al. (1996) Turatto, M., Benetti, S., Cappellaro, E., Danziger, I.J., Della Valle, M., Gouiffes, C., Mazzali, P. A., & Patat, F. 1996, MNRAS, 283, 1
- Webbink (1984) Webbink, R. F. 1984, ApJ, 277, 355
- Whelan & Iben (1973) Whelan, J., & Iben, I., Jr. 1973, ApJ, 186, 1007
- Yungelson & Kuranov (2017) Yungelson, L. R., & Kuranov, A. G. 2017, MNRAS, 464, 1607