Solar-like dynamos and rotational scaling of cycles from star-in-a-box simulations
Abstract
Magnetohydrodynamic star-in-a-box simulations of convection and dynamos in a solar-like star with different rotation rates are presented. These simulations produce solar-like differential rotation with a fast equator and slow poles, and magnetic activity that resembles that of the Sun with equatorward migrating activity at the surface. Furthermore, the ratio of rotation to cycle period is almost constant as the rotation period decreases in the limited sample considered here. This is reminiscent of the suggested inactive branch of stars from observations and differs from most earlier simulation results from spherical shell models. While the exact excitation mechanism of the dynamos in the current simulations is not yet clear, it is plausible that the greater freedom that the magnetic field has due to the inclusion of the radiative core and regions exterior to the star are important in shaping the dynamo.
1 Introduction
The Sun maintains a global dynamo with a magnetic cycle of approximately 22 years, with activity appearing at the surface at midlatitudes and propagating equatorward as the cycle progresses (e.g. Hathaway, 2010). Three-dimensional magnetohydrodynamic (MHD) simulations struggle to reproduce such cycles: often the activity propagates poleward (e.g. Brown et al., 2011; Nelson et al., 2013), active latitudes do not coincide with those in the Sun (e.g. Ghizaru et al., 2010), or there is a mismatch between the simulated and solar cycle periods (e.g. Käpylä et al., 2012; Warnecke, 2018). Furthermore, the simulations usually require substantially faster rotation than in the Sun to achieve cyclic dynamos (e.g. Viviani et al., 2018). Another issue arises when simulations at different rotation rates are confronted with observations: cycles observed from stars other than the Sun suggest that in the vicinity of the solar Rossby number, which is the ratio of the rotation period to convective turnover time, the ratio of rotation to cycle period is increasing as the Rossby number decreases (e.g. Olspert et al., 2018). Simulations often produce the opposite trend (e.g. Warnecke, 2018; Strugarek et al., 2018). Typically more than one of these defects is found in any given simulation.
There are several possible reasons for the mismatch between simulations and reality. A major factor in this is likely to be the inability of current simulations to capture stellar convective flows accurately enough. This is known as the convective conundrum, and manifested by too high large-scale velocity amplitudes in simulations in comparison to the Sun (e.g. Hanasoge et al., 2012; O’Mara et al., 2016; Schumacher & Sreenivasan, 2020). This often leads to anti-solar differential rotation in simulations with solar luminosity and rotation rate (e.g. Käpylä et al., 2014), and very high resolutions in addition to highly supercritical dynamos are likely needed to overcome this (Hotta & Kusano, 2021).
Another factor is that stellar dynamo simulations are often done in spherical shells where only the convection zone (CZ), or additionally a part of the radiative core is modeled (e.g. Guerrero et al., 2019; Bice & Toomre, 2020). This necessitates the use of boundary conditions which may not always be appropriate and which can affect the dynamo solutions in ways that are a priori not obvious (e.g. Cole et al., 2016). In the present study a star-in-a-box model, where a spherical star is embedded into a Cartesian cube, is used to model a solar-like star in a rotational regime where cyclic solutions are excited. The model thus includes the radiative core and regions exterior to the star. The former enables contributions to the dynamo from the interface between radiative and convective zones, whereas the latter is usually not considered to be important in the maintenance of the dynamo. However, including the outer layers is less restrictive than imposing mathematically or numerically convenient boundary conditions on the flows and magnetic fields, and which can also affect the resulting dynamo solution (e.g. Warnecke et al., 2016).
2 Model
The star-in-a-box model described in Käpylä (2021) is used; see also Dobler et al. (2006). A star of radius is embedded into a Cartesian cube with a side length . Equations governing the system are:
| (1) | |||||
| (2) | |||||
| (3) | |||||
| (4) |
where is the magnetic vector potential, is the velocity, is the magnetic field, is the current density, is the permeability of vacuum, is the magnetic diffusivity, is the advective derivative, is the fluid density, is the gravitational potential, is the pressure, and is the kinematic viscosity. The traceless rate-of-strain tensor is given by , where is the Kronecker delta. The angular velocity is given by , is a damping function, is the temperature, and is the specific entropy. and are the radiative and subgrid-scale (SGS) entropy fluxes, and and describe heating and cooling, respectively.
The gas obeys an ideal gas equation of state with , where is the gas constant, and and are the heat capacities at constant pressure and volume, respectively. The gravitational potential corresponds to a polytrope of index of a main-sequence M5 star (see Appendix A of Dobler et al., 2006). Flows in the exterior to the star are damped through the term , where is a damping timescale, and , where and . The damping timescale , where is the free-fall time, is the gravitational constant, and is the mass of the star.
The radiative flux is given by , where
| (5) |
with and corresponds to the Kramers opacity law (e.g. Brandenburg et al., 2000). Additional SGS entropy flux is included with , where , are the fluctuations of the entropy, and is a running temporal mean computed over an interval of ten free-fall times. Nuclear energy production in the core of the star is parameterized by the heating term with a Gaussian profile, , where is the luminosity and is the width of the Gaussian. The cooling term models radiative losses above the stellar surface with , where is a cooling timescale and the fixed surface temperature.
The fluid and magnetic Reynolds numbers, and the Péclet number are given by , , , where is the volume-averaged rms-velocity in the CZ and the wavenumber corresponding to the approximate depth of the CZ with , and where and are the magnetic and SGS Prandtl numbers, respectively. Rotational influence on the flow is measured by the Coriolis number, . Magnetic fields are measured in terms of the equipartition field strength where refers to volume averaging over the CZ. Mean values are taken to be azimuthal averages and denoted by overbars. The Pencil Code (Pencil Code Collaboration et al., 2021)111https://github.com/pencil-code/ was used to make the simulations.
| Run | Grid | |||||||||||
|---|---|---|---|---|---|---|---|---|---|---|---|---|
| A | 5.6 | 55 | 11 | 27 | 0.61 | 0.011 | 0.038 | 0.091 | 0.128 | |||
| B | 7.0 | 53 | 10 | 26 | 0.63 | 0.010 | 0.050 | 0.094 | 0.152 | |||
| C | 10.0 | 49 | 9 | 24 | 0.61 | 0.008 | 0.050 | 0.096 | 0.146 | |||
| Cm | 9.7 | 102 | 20 | 51 | 0.66 | 0.008 | 0.034 | 0.055 | 0.081 | |||
| C1 | 9.9 | 100 | 20 | 100 | 0.71 | 0.008 | 0.033 | 0.030 | 0.044 | |||
| Ch | 9.5 | 260 | 52 | 130 | 0.69 | 0.008 | 0.035 | 0.026 | 0.041 | (3.6) | (3.6) | |
| D | 17.3 | 42 | 8 | 21 | 0.63 | 0.006 | 0.019 | 0.117 | 0.071 |
The set-up of the simulations is otherwise identical to those in Käpylä (2021) except that the amplitude of the radiative conductivity is enhanced such that in the thermodynamically saturated state the star has a radiative core (CZ) that encompasses roughly two thirds (one third) of stellar radius. Furthermore, the diffusion coefficients , , and have radial profiles such that their values in the radiative core are smaller than in the CZ to avoid diffusive spreading of magnetic fields and flows into the core. This nevertheless happens in many runs during the initial transient toward a statistically steady state for the flow. This is due to the fact that the initial state of the simulations is an isentropic polytrope, and because of this choice, the star is fully convective in the early stages. To circumvent this issue the magnetic field is rescaled to level after a statistically steady state for the flow and thermodynamics is reached. The simulations are then further evolved until the magnetic field reaches a statistically steady state. The simulations at the higher resolutions ( and ) were remeshed from such saturated snapshots from the low resolution () cases.
3 Results
The simulations are summarized in Table 1. The models cover a modest range of Coriolis numbers between 5.6 and 17 where cyclic dynamos with a dominating axisymmetric magnetic fields are found. Runs with slower rotation produce quasi-static magnetic fields whereas for more rapid rotation non-axisymmetric fields and less coherent cycles become dominant. The run with the highest resolution (Ch) has completed only one full cycle and therefore it is not used in the statistical analysis of the cycle periods, but merely to demonstrate that the cycles persists also at higher Reynolds numbers. A more comprehensive study of the simulations including the slower and faster rotation cases will be presented elsewhere.
3.1 Magnetic fields and cycles
The current simulations produce dynamos where the magnetic energy is a significant fraction of the kinetic energy ; see the sixth column of Table 1. The ratio is practically constant as a function of in the parameter regime studied here, which differs from the scaling found in Augustson et al. (2019), and the MAC balance which is often assumed to hold for the saturation level of magnetic fields (e.g. Brun & Browning, 2017).
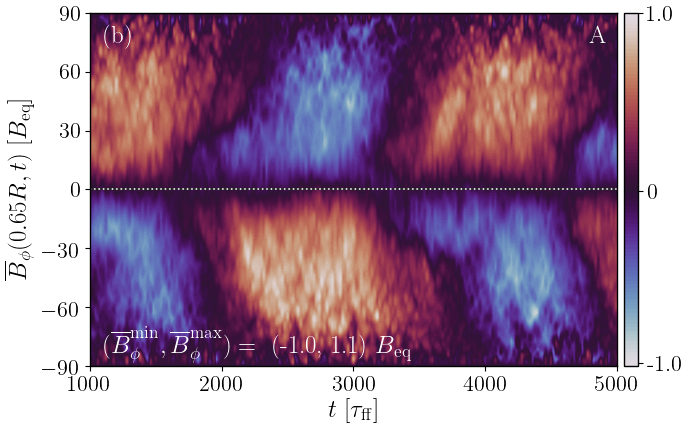
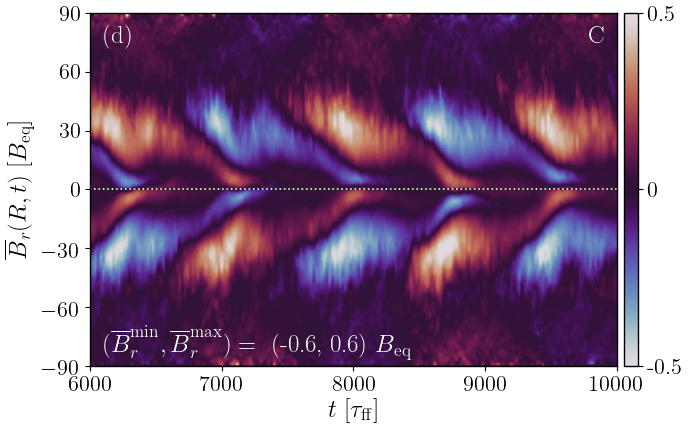
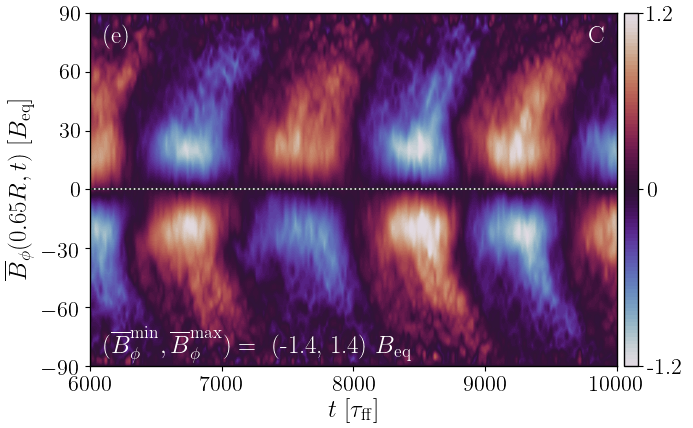
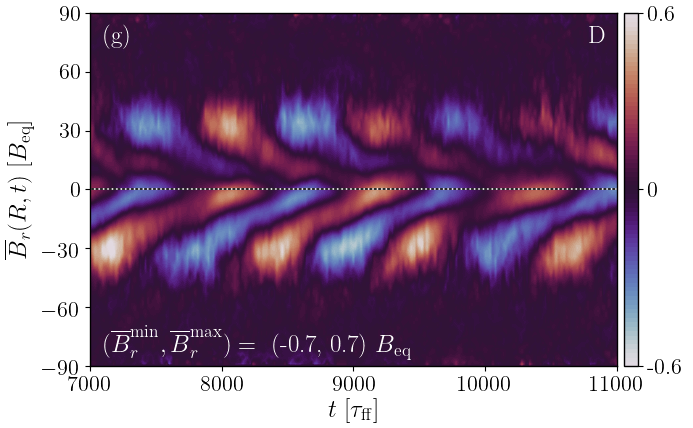
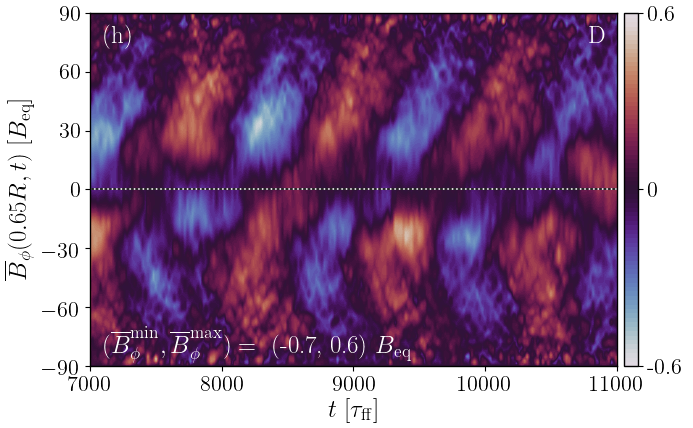
The azimuthally averaged radial magnetic fields near the surface of the star, and the toroidal magnetic field near the base of the CZ for runs A, C, and D are shown in Figure 1 panels (a, d, g) and (b, e, h), respectively. The rest of the runs follow very similar patterns. All of these cases show a solar-like pattern of magnetic field evolution at the surface with strong radial fields concentrated in latitudes and activity propagating equatorward. A weaker poleward branch is visible in some runs; see Figure 1(b). While a similar pattern can be seen for near the surface, the dynamo wave propagates poleward near the base of the CZ.

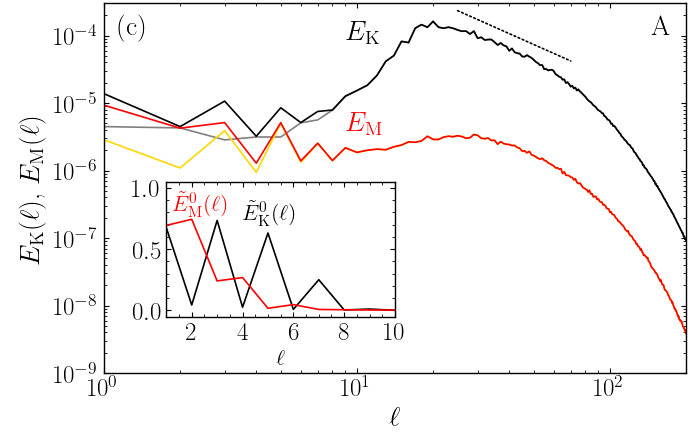
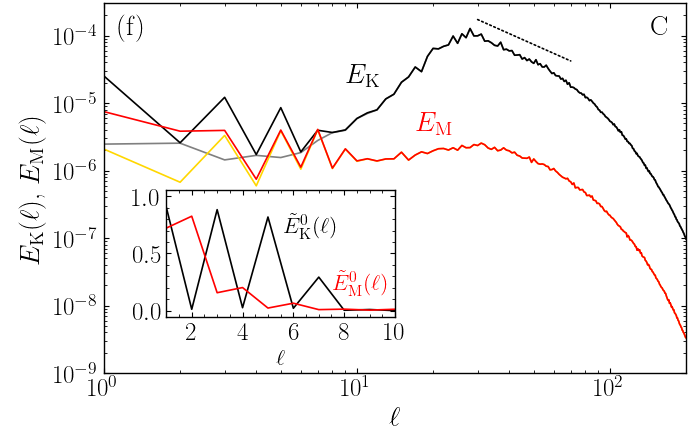
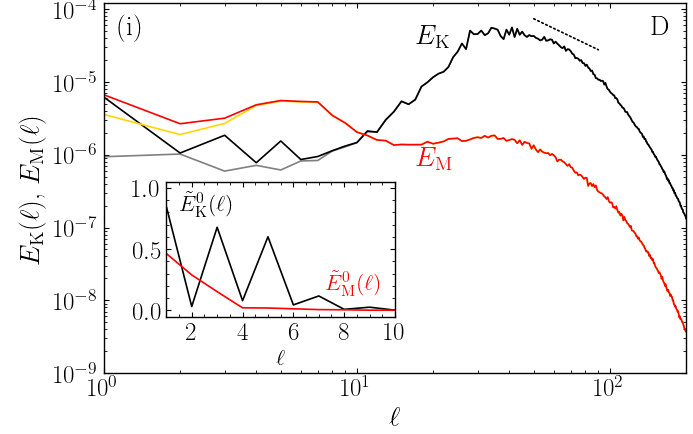
Power spectra of the velocity and magnetic fields from a spherical harmonic decomposition are shown in Figure 1(c, f, i) for runs A, C, and D. The magnetic power spectrum has its maximum at the largest possible scale () for all runs. The maximum of the velocity power occurs at , and the peak moves to larger with increasing rotation as the convective cells become smaller. The spectra indicate a clear separation of scales between the dominant scales of convection and those of the magnetic field. The insets of Figure 1(c, f, i) show the fraction of the power in the axisymmetric () part for . In this range, the equatorially asymmetric axissymmetric contributions with odd dominate the velocity field. However, these contributions are still clearly subdominant in the kinetic energy which is dominated by convective flows with . The large-scale magnetic fields are dominated by the axisymmetric component with half or more of the total power in all cases.
The evolution of the mean magnetic fields in runs A, C, and D is shown in the animations in Figure 2. These visualizations show that strong magnetic fields are concentrated near the surface of the star outside the tangent cylinder, and near the interface between radiative and convection zones inside the tangent cylinder. Strong magnetic fields can also be found within the CZ at higher latitudes. This could suggest the presence of multiple dynamo modes which have been detected in simulations previously (e.g. Käpylä et al., 2016; Beaudoin et al., 2016). In distinction to these studies, the cycles in the deep parts and near the surface in the current simulations are synchronised such that their periods are the same. Magnetic fields also penetrate into the upper part of the radiative core down to a depth . The extent of this penetration is highly likely unrealistic but such effects, albeit quantitatively different, can still conceivably occur at the interfaces of stellar radiative and convective zones.
3.2 Flow states and dynamo considerations
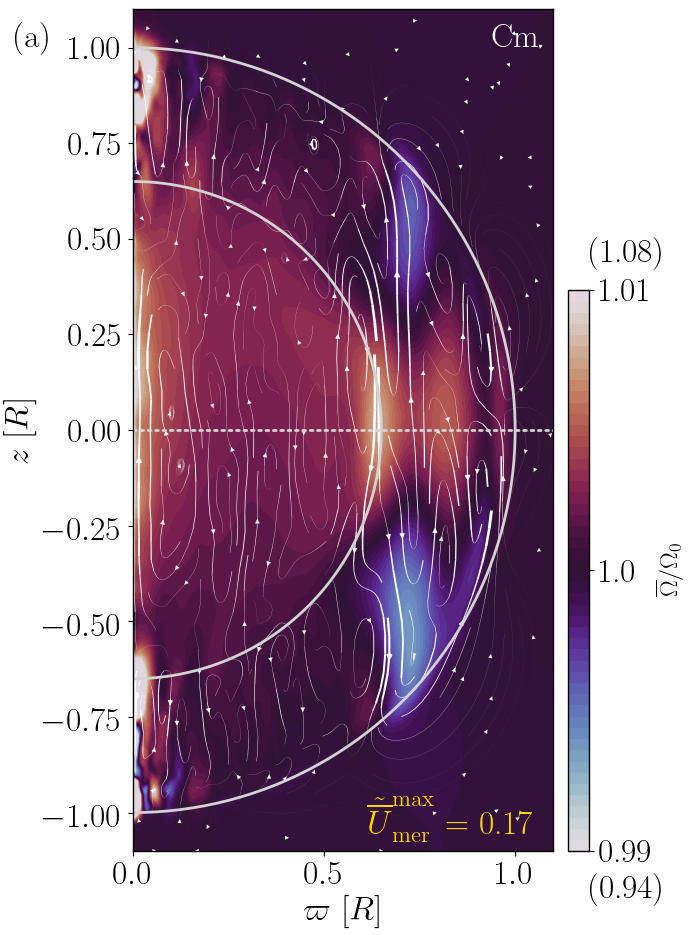
All of the current simulations are in the solar-like differential rotation regime, which is characterised by a faster equator and slower poles; see Figure 3(a). However, the differential rotation is in general weak, such that the amplitude is typically of the order of a couple of per cent of everywhere except near the axis where the data is poorly converged. This is also apparent from the seventh and eighth columns Table 1 which show that the energies associated with differential rotation and meridional circulation are at most a few per cent of the total kinetic energy. This is partly due to the damping of flows in the exterior which exerts a torque that opposes differential rotation. Nevertheless, the current simulations also show a minimum of at mid-latitudes, which has been conjectured to be the cause of equatorward migration by a dominating dynamo in earlier spherical shell simulations (Warnecke et al., 2014).
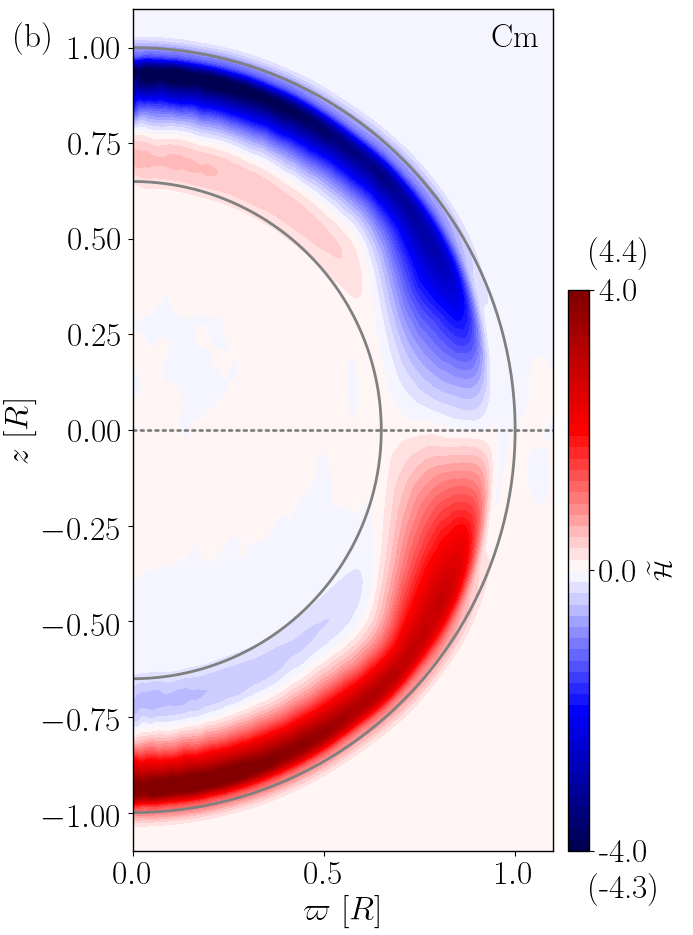
The other ingredient in such models is the kinetic helicity, , where is the vorticity, which is negative (positive) in the upper (lower) part of the CZ in the northern hemisphere; Figure 3(b). A sign change of occurs in the deep layers of the CZ everywhere except near the equator, which is a common feature in overshooting convection (e.g. Ossendrijver et al., 2001; Käpylä et al., 2009). Thus the sign of kinetic helicity follows the sign of in the bulk of the convection zone, and a significant helicity inversion and a consequent reversal of the dynamo wave as suggested by Duarte et al. (2016) does not occur.
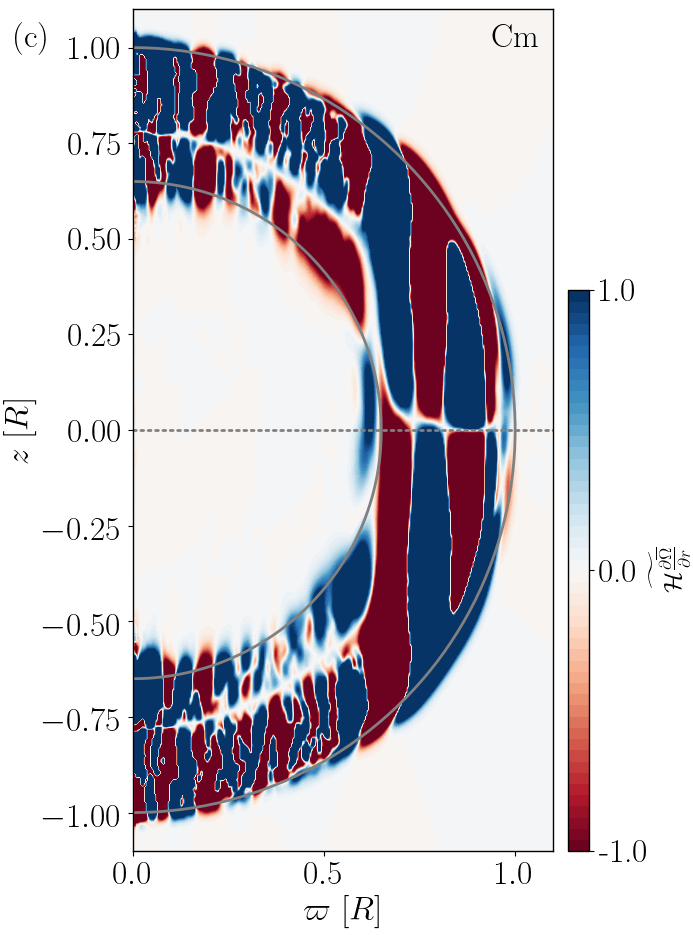
The product of the radial gradient of and determines the propagation direction of the dynamo wave in dynamos (Parker, 1955; Yoshimura, 1975). Figure 3(c) indicates both poleward () and equatorward () regions outside the tangent cylinder, and predominantly poleward propagation in the lower part of the CZ inside the tangent cylinder. It is tempting to associate the equatorward branch near the surface with a corresponding patch of positive and the poleward branch in the deep parts with a corresponding patch of negative (in the northern hemisphere). However, the Parker-Yoshimura rule applies strictly only in the case of a pure dynamo with spatially constant helicity and turbulent diffusion. The low ratio of toroidal to poloidal magnetic energies (10th and 11th columns in Table 1) also suggests that the dynamos in the current simulations are not of type.
In addition to the already mentioned helicity inversion, further possibilities to excite equatorward propagation include the near-surface shear (e.g. Brandenburg, 2005), and an dynamo with a sign change of helicity at the equator (e.g. Mitra et al., 2010). Neither of these possibilities can be ruled out immediately with the data at hand, although the shear near the surface is not very prominent in the current simulations. However, explanations based on such simple models should be considered with caution in light of a recent study by Warnecke et al. (2021), who found that to explanation the cause and evolution of large-scale magnetism in a spherical shell simulation required a mean-field model with 24 turbulent transport coefficients derived using the test-field method (e.g. Schrinner et al., 2007).
3.3 Rotational scaling of dynamo cycles
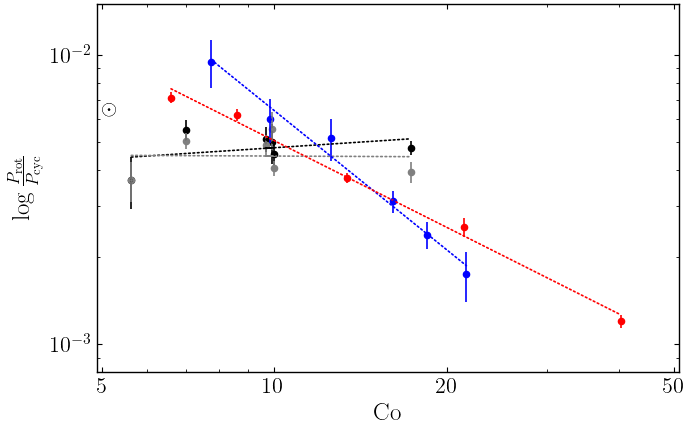
Long-term observations of chromospheric emission of late-type stars suggest that many such stars have magnetic cycles similar to the Sun (e.g. Baliunas et al., 1995). It has also been suggested that the ratio of stellar rotation and cycle periods fall into a number branches as a function of the Coriolis number (e.g. Brandenburg et al., 1998, 2017). These studies suggest inactive and active branches with where . However, the exact nature (Olspert et al., 2018), and the signifigance of the branches continues to be debated (e.g. Boro Saikia et al., 2018). It is nevertheless interesting to measure the ratio from simulations to see if any systematics can be found. This has been done in a handful of studies: Warnecke (2018) found whereas a somewhat steeper relation with was reported by Strugarek et al. (2018). Furthermore, the results from a more heterogeneous set of simulations by Viviani et al. (2018) also suggest . A notable exception is the study of Guerrero et al. (2019) who found a flat () or slightly positive for rapid rotation.
The cycle periods from the current simulations are computed using libeemd library (Luukko et al., 2015) using the ensemble empirical mode decomposition (EEMD). Periods are determined from and , where is the range of latitudes considered. The mode with the largest energy is identified as the primary cycle and the period is computed from zero crossings of that mode. The mean cycle period is taken to be the average over . Error estimates are provided by dividing the time series in three parts and repeating the analysis for each part. The largest deviation from the mean period over the full time series is taken to represent the error. The current results indicate that the ratio is almost independent of in the parameter range explored here with () for the surface (deep) cycles; see Figure 4. These results differ qualitatively from those of Warnecke (2018) and Strugarek et al. (2018) that are also shown in Figure 4222The Rossby numbers from Strugarek et al. (2018) were converted to Coriolis numbers as .. Guerrero et al. (2019) reported results for that are similar to those obtained here from models that also included a radiative layer below the CZ. However, the magnetic field configurations achieved in that study are quite different from those here such that, e.g., no clear equatorward migration is obtained.
The ratio in the current simulations is between which is close to the solar value with days and years. Coupled with the near independence of on suggests that the dynamos in the current simulations might capture some of the characteristics of stars in the inactive branch where also the Sun belongs to (e.g. Brandenburg et al., 1998). However, at the same time it is clear that the current simulations do not reproduce many other aspects of the Sun, such as the structure and magnitude of the differential rotation.
4 Conclusions
Star-in-a-box simulations of a solar-like convective envelope were shown to produce solar-like magnetic activity on a limited range of rotation rates. The current simulations share many characteristics of earlier spherical shells models (e.g. Käpylä et al., 2012), including a local minimum of at midlatitudes which has been conjectured to be the cause of equatorward migration in those studies (Warnecke et al., 2014). However, the magnetic cycles in the current simulations show differences to the earlier studies in that the equatorward migration of the active latitudes is not restricted to mid-latitudes with negative radial differential rotation. Furthermore, the rotational scaling of the cycles is qualitatively different from the earlier studies in spherical shells (e.g. Warnecke, 2018), with a weak dependence of on rotation.
However, several differences to earlier studies can be readily identified. These include the addition of a simplified corona which provides a free surface for the magnetic field rather than imposing simplified surface boundary conditions (see also Warnecke et al., 2016). Another difference is the inclusion of the radiative core where strong magnetic fields can be stored and possibly amplified by means other than helical convection (e.g. Guerrero et al., 2019). Finally, changing the geometry and size of the system also allows, in general, a wider spectrum of dynamo modes that can be excited. A more detailed analysis of the maintenance of the magnetic fields is needed to precisely pinpoint the differences to the earlier studies. Nevertheless, the current results suggest that regions outside of the CZ shape the global dynamo solutions, and that perhaps the dynamos in the Sun and other inactive stars harbor dynamos where such effects are important.
References
- Augustson et al. (2019) Augustson, K. C., Brun, A. S., & Toomre, J. 2019, ApJ, 876, 83, doi: 10.3847/1538-4357/ab14ea
- Baliunas et al. (1995) Baliunas, S. L., Donahue, R. A., Soon, W. H., et al. 1995, ApJ, 438, 269, doi: 10.1086/175072
- Beaudoin et al. (2016) Beaudoin, P., Simard, C., Cossette, J.-F., & Charbonneau, P. 2016, ApJ, 826, 138, doi: 10.3847/0004-637X/826/2/138
- Bice & Toomre (2020) Bice, C. P., & Toomre, J. 2020, ApJ, 893, 107, doi: 10.3847/1538-4357/ab8190
- Boro Saikia et al. (2018) Boro Saikia, S., Marvin, C. J., Jeffers, S. V., et al. 2018, A&A, 616, A108, doi: 10.1051/0004-6361/201629518
- Brandenburg (2005) Brandenburg, A. 2005, ApJ, 625, 539, doi: 10.1086/429584
- Brandenburg et al. (2017) Brandenburg, A., Mathur, S., & Metcalfe, T. S. 2017, ApJ, 845, 79, doi: 10.3847/1538-4357/aa7cfa
- Brandenburg et al. (2000) Brandenburg, A., Nordlund, A., & Stein, R. F. 2000, in Geophysical and Astrophysical Convection, Contributions from a workshop sponsored by the Geophysical Turbulence Program at the National Center for Atmospheric Research, October, 1995. Edited by Peter A. Fox and Robert M. Kerr. Published by Gordon and Breach Science Publishers, The Netherlands, 2000, p. 85-105, ed. P. A. Fox & R. M. Kerr, 85–105
- Brandenburg et al. (1998) Brandenburg, A., Saar, S. H., & Turpin, C. R. 1998, ApJ, 498, L51, doi: 10.1086/311297
- Brown et al. (2011) Brown, B. P., Miesch, M. S., Browning, M. K., Brun, A. S., & Toomre, J. 2011, ApJ, 731, 69, doi: 10.1088/0004-637X/731/1/69
- Brun & Browning (2017) Brun, A. S., & Browning, M. K. 2017, Liv. Rev. Sol. Phys., 14, 4, doi: 10.1007/s41116-017-0007-8
- Cole et al. (2016) Cole, E., Brandenburg, A., Käpylä, P. J., & Käpylä, M. J. 2016, A&A, 593, A134, doi: 10.1051/0004-6361/201628165
- Dobler et al. (2006) Dobler, W., Stix, M., & Brandenburg, A. 2006, ApJ, 638, 336, doi: 10.1086/498634
- Duarte et al. (2016) Duarte, L. D. V., Wicht, J., Browning, M. K., & Gastine, T. 2016, MNRAS, 456, 1708, doi: 10.1093/mnras/stv2726
- Ghizaru et al. (2010) Ghizaru, M., Charbonneau, P., & Smolarkiewicz, P. K. 2010, ApJ, 715, L133, doi: 10.1088/2041-8205/715/2/L133
- Guerrero et al. (2019) Guerrero, G., Zaire, B., Smolarkiewicz, P. K., et al. 2019, ApJ, 880, 6, doi: 10.3847/1538-4357/ab224a
- Hanasoge et al. (2012) Hanasoge, S. M., Duvall, T. L., & Sreenivasan, K. R. 2012, Proc. Natl. Acad. Sci., 109, 11928, doi: 10.1073/pnas.1206570109
- Harris et al. (2020) Harris, C. R., Millman, K. J., van der Walt, S. J., et al. 2020, Nature, 585, 357, doi: 10.1038/s41586-020-2649-2
- Hathaway (2010) Hathaway, D. H. 2010, Living Reviews in Solar Physics, 7, 1, doi: 10.12942/lrsp-2010-1
- Hotta & Kusano (2021) Hotta, H., & Kusano, K. 2021, Nature Astronomy, 5, 1100, doi: 10.1038/s41550-021-01459-0
- Käpylä et al. (2016) Käpylä, M. J., Käpylä, P. J., Olspert, N., et al. 2016, A&A, 589, A56, doi: 10.1051/0004-6361/201527002
- Käpylä (2021) Käpylä, P. J. 2021, A&A, 651, A66, doi: 10.1051/0004-6361/202040049
- Käpylä et al. (2014) Käpylä, P. J., Käpylä, M. J., & Brandenburg, A. 2014, A&A, 570, A43. https://arxiv.org/abs/1401.2981
- Käpylä et al. (2009) Käpylä, P. J., Korpi, M. J., & Brandenburg, A. 2009, A&A, 500, 633, doi: 10.1051/0004-6361/200811498
- Käpylä et al. (2012) Käpylä, P. J., Mantere, M. J., & Brandenburg, A. 2012, ApJ, 755, L22, doi: 10.1088/2041-8205/755/1/L22
- Luukko et al. (2015) Luukko, P., Helske, J., & Räsänen, E. 2015, Comput. Stat., 31, 545, doi: 10.1007/s00180-015-0603-9
- Mitra et al. (2010) Mitra, D., Tavakol, R., Käpylä, P. J., & Brandenburg, A. 2010, ApJ, 719, L1, doi: 10.1088/2041-8205/719/1/L1
- Nelson et al. (2013) Nelson, N. J., Brown, B. P., Brun, A. S., Miesch, M. S., & Toomre, J. 2013, ApJ, 762, 73, doi: 10.1088/0004-637X/762/2/73
- Olspert et al. (2018) Olspert, N., Lehtinen, J. J., Käpylä, M. J., Pelt, J., & Grigorievskiy, A. 2018, A&A, 619, A6, doi: 10.1051/0004-6361/201732525
- O’Mara et al. (2016) O’Mara, B., Miesch, M. S., Featherstone, N. A., & Augustson, K. C. 2016, Adv. Space Res., 58, 1475, doi: 10.1016/j.asr.2016.03.038
- Ossendrijver et al. (2001) Ossendrijver, M., Stix, M., & Brandenburg, A. 2001, A&A, 376, 713, doi: 10.1051/0004-6361:20011041
- Parker (1955) Parker, E. N. 1955, ApJ, 122, 293, doi: 10.1086/146087
- Pencil Code Collaboration et al. (2021) Pencil Code Collaboration, Brandenburg, A., Johansen, A., et al. 2021, The Journal of Open Source Software, 6, 2807, doi: 10.21105/joss.02807
- Schrinner et al. (2007) Schrinner, M., Rädler, K.-H., Schmitt, D., Rheinhardt, M., & Christensen, U. R. 2007, Geophys. Astrophys. Fluid Dynam., 101, 81, doi: 10.1080/03091920701345707
- Schumacher & Sreenivasan (2020) Schumacher, J., & Sreenivasan, K. R. 2020, Reviews of Modern Physics, 92, 041001, doi: 10.1103/RevModPhys.92.041001
- Strugarek et al. (2018) Strugarek, A., Beaudoin, P., Charbonneau, P., & Brun, A. S. 2018, ApJ, 863, 35, doi: 10.3847/1538-4357/aacf9e
- Viviani et al. (2018) Viviani, M., Warnecke, J., Käpylä, M. J., et al. 2018, A&A, 616, A160, doi: 10.1051/0004-6361/201732191
- Warnecke (2018) Warnecke, J. 2018, A&A, 616, A72, doi: 10.1051/0004-6361/201732413
- Warnecke et al. (2014) Warnecke, J., Käpylä, P. J., Käpylä, M. J., & Brandenburg, A. 2014, ApJ, 796, L12, doi: 10.1088/2041-8205/796/1/L12
- Warnecke et al. (2016) —. 2016, A&A, 596, A115, doi: 10.1051/0004-6361/201526131
- Warnecke et al. (2021) Warnecke, J., Rheinhardt, M., Viviani, M., et al. 2021, ApJ, 919, L13, doi: 10.3847/2041-8213/ac1db5
- Yoshimura (1975) Yoshimura, H. 1975, ApJ, 201, 740, doi: 10.1086/153940