Ketamine-Medetomidine General Anesthesia Occurs With Alternation of Cortical Electrophysiological Activity Between High and Low Complex States
Abstract
Anesthetic agents are known to induce a range of alterations in cortical electrophysiological activity, such as the rise of signature patterns, changes in statistical properties, and altered dynamic behavior of neural records. Plenty of methods can be used to track and monitor these changes, among them complexity metrics demonstrated to have the power to discriminate states involving distinct levels of awareness. There is a consensus that anesthetic drugs can interfere with neural activities at different levels and time scales, being able to induce alterations both locally and in the spatiotemporal patterns established throughout the whole cortex. However, it is still unclear how such changes in the complexity of cortical activity are supposed to occur, and experimental evidence is still needed. For this purpose, we have analyzed an ECoG records database of a Ketamine-Medetomidine anesthetic induction experiment in a non-human primate subject. The MDR-ECoG technique provided records of cortical activity with both high temporal and spatial resolution allied with extensive coverage of the cortical surface. The Permutation Entropy and the Fractal Dimension were employed to evaluate the complexity of the neural time series. It was found that the complexity of cortical activity was relatively constant during awakened conditions. The transition to unconsciousness occurred relatively fast; it required about 30 to 40 seconds for the first remarkable changes to take place. During general anesthesia, the complexity assumed a considerable variation at local levels and fluctuated apparently without a defined period. The cortex dynamically alternated between high and low complex states on a global scale. This study provides novel evidence of the effects of anesthetics on neural activity and cortical dynamics, complementing the actual scenario for elucidating anesthetics mechanisms in terms of circuits, pathways, and global brain functioning.
I. Introduction
Electrophysiological cortical records are known to exhibit highly complex patterns, and it is a fact that changes in levels of awareness, whether caused by anesthetic agents, epileptiform activity, or sleep, reflect in signals with characteristic patterns that are distinguished from those typically observed under alert conditions. Since electrophysiological activity signals contain relevant information about the physiological state of individuals, a variety of methods can be used to evaluate changes in behavior, patterns, and the statistical properties of neural time series. In particular, when we are interested in making inferences about different levels of awareness, it is possible to highlight complexity-related metrics, which have proven to have the power to discriminate physiological states involving distinct levels of consciousness. Because of this, complexity metrics are even used in clinical medicine to monitor patients during procedures involving sedation and general anesthesia. However, in these applications and neuroscience experiments, most of the time, a reduced number of electrodes are used, thus giving information about changes that occur locally in certain cortical regions without providing detailed information about what is happening in the cortex as a whole.
Since anesthetic agents can concomitantly interfere with local molecular environments, neuronal circuits in the thalamic nuclei, circuits widespread throughout the cortex, and also the communication established between the thalamus and the cortex, anesthetic drugs are able not only to affect the activity of specific cortical regions but in fact can interfere with the dynamics of neural activities in the brain as a whole, at a systems level. In this manner, we assert that the elucidation of the spatiotemporal organization of the complexity of neural activity over extensive cortical areas may bring new relevant information to complement the actual scenario and contribute with novel experimental evidence for the comprehension of the effects of general anesthesia in terms of neural circuits, pathways, and global brain functioning.
The objective of the present research was to verify and describe how statistical properties associated with the complexity of cortical electrophysiological activity change as soon as an anesthetic induction agent is administered to a subject. Particularly verifying the changes in patterns and dynamics that occur along with the unfolding of the transition to unconsciousness, as well as the spatiotemporal organization of the cortical activity’s complexity during general anesthesia.
For this objective, a database respective to an experiment that involved Ketamine-Medetomidine anesthetic induction in an old-world monkey was analyzed. In this database, electrophysiological neural activity was recorded using a technique that simultaneously offered extensive coverage of cortical surfaces along with high spatial and temporal resolution. Two different complexity-metrics methods, the Fractal Dimension (Higuchi, 1988) and the Permutation Entropy (Bandt and Pompe, 2002) were used to infer the complexity of the neural time series.
In this research, we have characterized the complexity of the electrophysiological neural activity in the awakened resting state, Ketamine-Medetomidine general anesthesia, and during the transition to induced unconsciousness. We have analyzed the complexity of distinct cortical regions at a local level and the spatiotemporal patterns established throughout the cortex at a systems level. Under resting-state conditions, the complexity of cortical activity was demonstrated to be relatively constant over time, despite some events of reduced complexity that appeared and vanished quite frequently, taking place mainly over the temporal and occipital lobes. The transition to unconsciousness was demonstrated to be relatively fast, requiring about 30 to 40 seconds for the first remarkable alterations to occur. First, the complexity decreased in the occipital and temporal lobes and later diminished in the parietal and frontal lobes. However, during the transition, the central sulcus and areas nearby continued to display high complexity. We contemplated that administering the anesthetics promoted novel specific dynamics and not a single overall decrease effect on the complexity of brain activity. Locally, the complexity assumed a higher variation and randomly fluctuated without having a definite period. During general induced anesthesia, the whole cortical spatiotemporal patterns dynamically alternated among high and low complex states; the states of high complexity observed had some features that resembled those respective to the awakened resting state. Nonetheless, we verified that both conditions were distinguishable at all times.
II. Methods
I. Neural Records Database
In the present study, a database of cortical electrophysiological activity was analyzed. The database came from the Laboratory of Adaptive Intelligence at the Riken Brain Science Institute, Japan. All surgical and experimental procedures were idealized and performed by the researchers of the affiliated institution. The Riken’s scientific ethics committee approved experiments following the experimental protocols (No. H24-2-203(4)) and the recommendations of the Weatherall report: "The use of non-human primates in research." Detailed information regarding methodology, subjects, and materials is available at (Nagasaka et al., 2011) and (http://neurotycho.org).
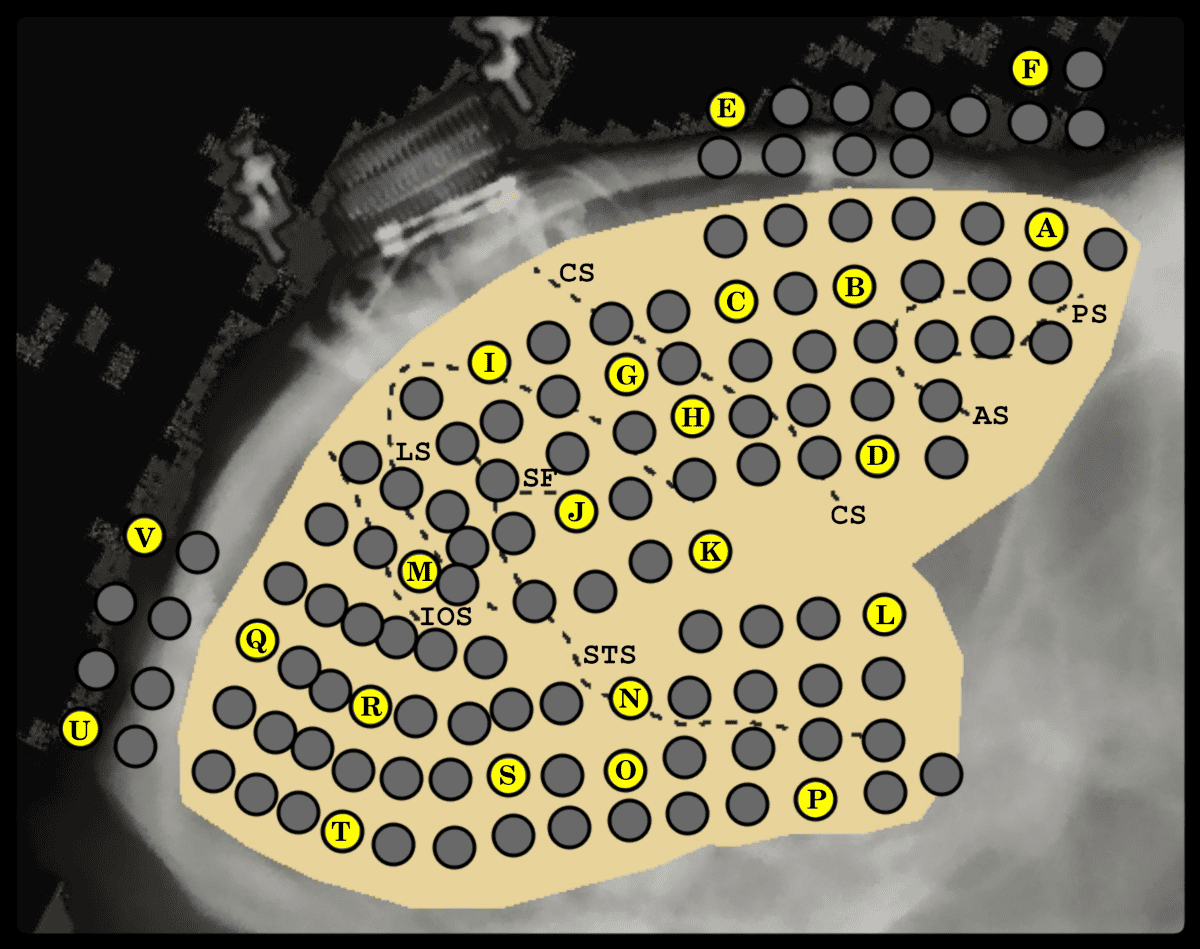
The electrophysiological activity data analyzed is respective to an experiment that involved anesthetic induction in a non-human primate subject of the species Macaca fuscata. The data recording technique adopted was the MDR-ECoG, which is considered one of the most advanced technologies available. This technique provided extensive coverage of the cortical surface and offered concomitant high spatial () and high temporal resolution (). The animal subject had an array of 128 ECoG electrodes chronically implanted in the subdural space covering the lateral cortical surface of the right brain hemisphere as well as some electrodes at the frontal and occipital medial walls.
In the experiment, the macaque was blindfolded and restrained in an appropriate chair. Neural activity was recorded for approximately 10 minutes under these conditions. After that, a cocktail of Ketamine and Medetomidine was administered for the induction of general anesthesia; after that, neural activity continued to be monitored for the next 25 minutes.
II. Complexity-Metrics Methods:
II.1 Permutation Entropy
For the calculation of the Permutation Entropy, we have used the algorithm presented and described in (Bandt and Pompe, 2002). For each of the 128 time series from the ECoG electrode array, the Permutation Entropy was calculated serially over time throughout the experiment as a sliding window. For each calculation, points of the time series were used, equivalent to seconds of recording of neural activity, with the order parameter of the Permutation Entropy and the time delay .
II.2 Fractal Dimension
For each of the 128 time series from the ECoG electrode array, the Fractal Dimension values were calculated serially over time as a sliding window. To decrease the number of measurements, the Fractal Dimension was calculated once every 2.5 seconds, respective to the recording time of the experiment. Higuchi’s algorithm (Higuchi, 1988) was used to calculate the Fractal Dimension. For each calculation, points of the time series were used (equivalent to 1 second of recording the neural activities), with the time interval parameter .
III. Statistical Analysis Wilcoxon Signed-Rank Test
In aiming to verify whether the decrease observed in the complexity during general anesthesia compared to the awake resting state conditions was statistically significant, the Wilcoxon signed-rank test was applied. The resulting p-values of the statistical test are shown in for the Permutation Entropy and for the Fractal Dimension.
IV. t-SNE Plots
We have defined the time-resolved vector states as vectors containing as entries the complexity values at a given time of each one of the 128 electrodes, resulting in 128-Dimensional vectors that were estimated serially over time throughout the experiment. For the permutation entropy, the time-resolved vector states were estimated at every 2.0 seconds of the recording experiment and for the Fractal Dimension at every 2.5 seconds. The time-resolved vector states (128-D) were used as input features into the t-SNE algorithm (Van der Maaten and Hinton, 2008) implemented in the R-CRAN package Rtsne (Krijthe et al., 2018), with the parameters: perplexity , exaggeration factor , and the maximum number of interactions . This analysis was independently performed for the Fractal Dimension and for the Permutation Entropy.
III. Results
In this research, we were able to track the spatiotemporal patterns of the cortical electrophysiological activity’s complexity in the macaque under study. The dynamic patterns were characterized in awakened resting-state conditions and Ketamine-Medetomidine general anesthesia. A substantial difference between these two states has been verified. The unfolding dynamics of the loss of consciousness have also been observed, and we were able to follow the alterations that occurred in specific cortical areas as well as in the cortex at a global level.
Two different methodologies were employed to estimate the complexity of neural time series: the Fractal Dimension and the Permutation Entropy. Although some distinctions were observed among the results from each methodology, in a broad sense, the findings obtained were reasonably equivalent, and we were able to draw the same conclusions from both approaches.
I. Awakened Resting State
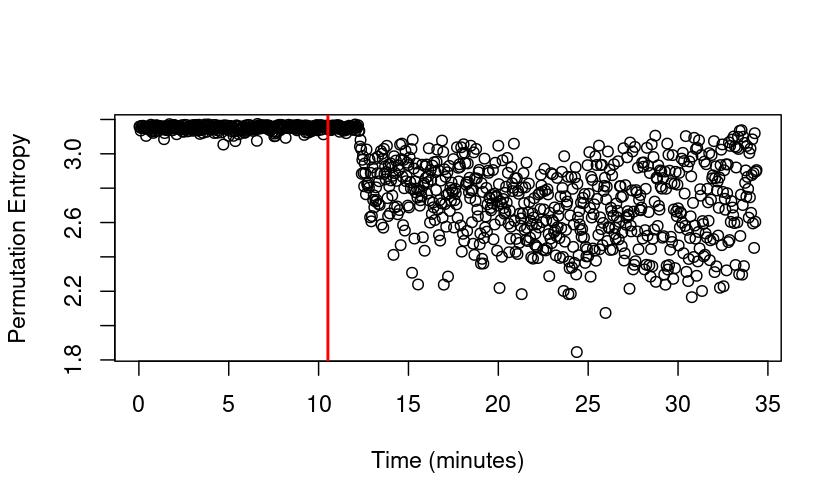
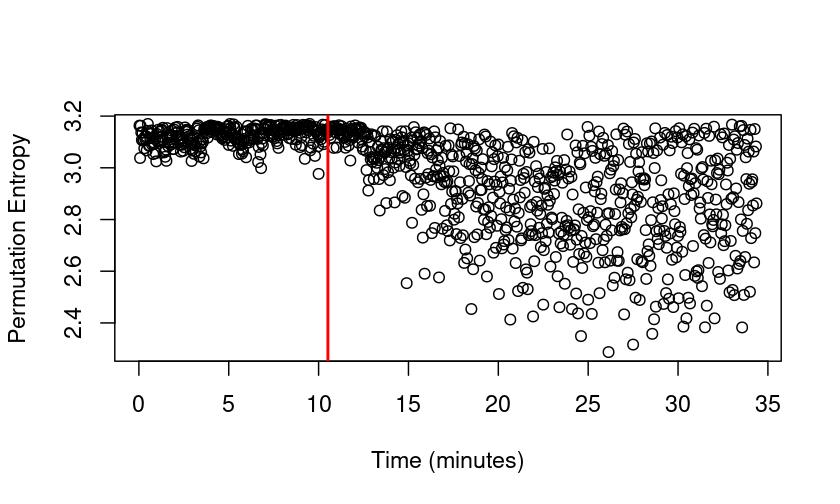
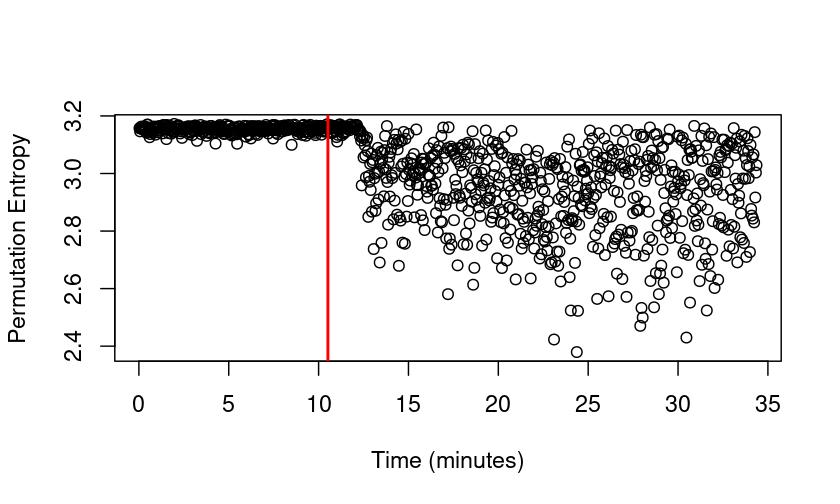
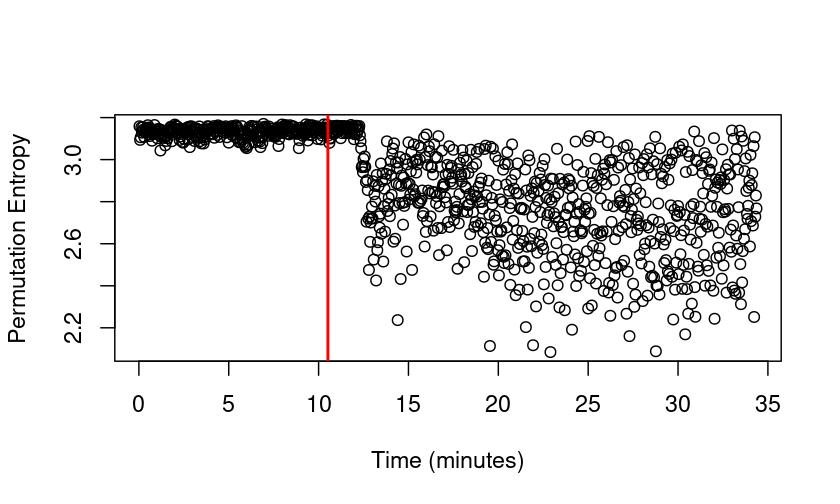
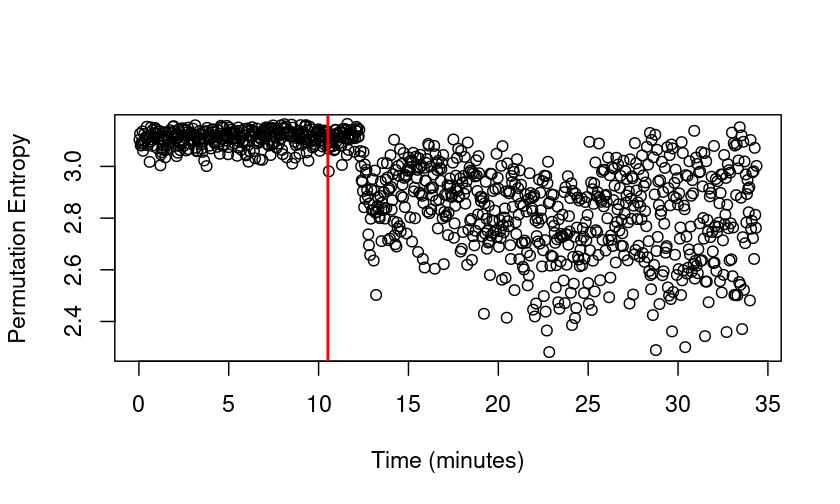
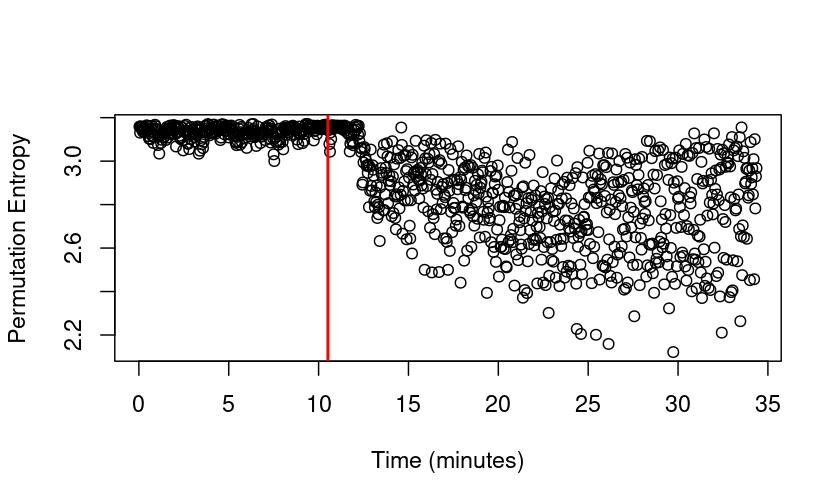
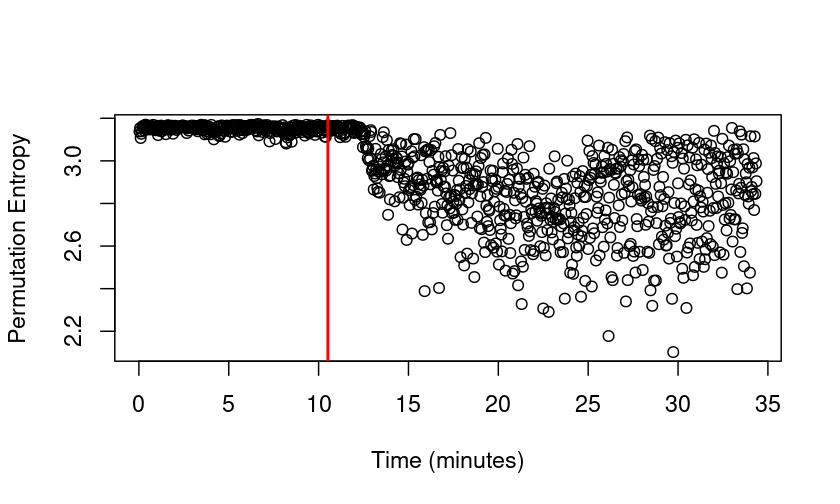
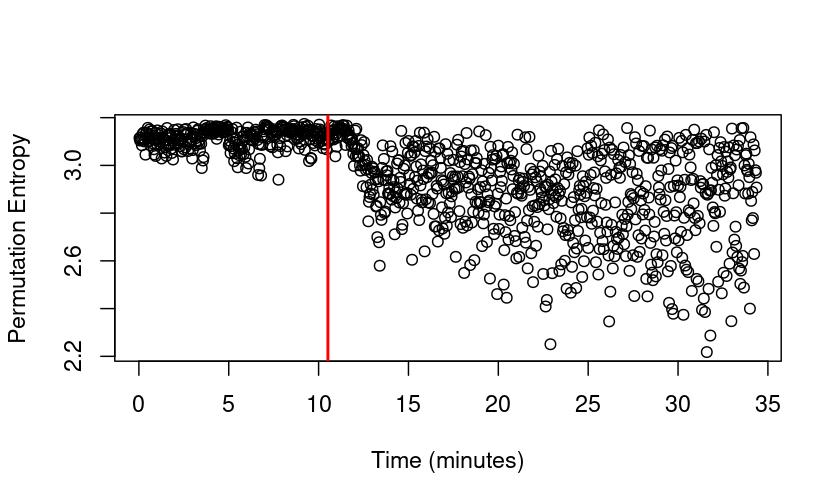
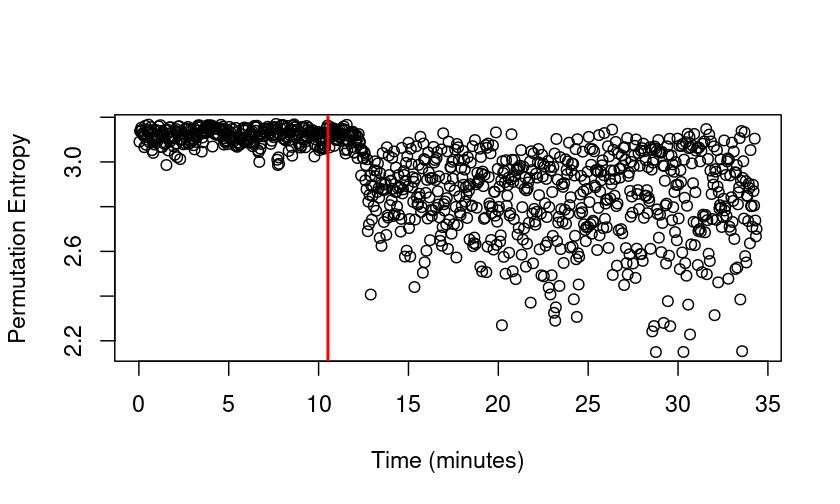
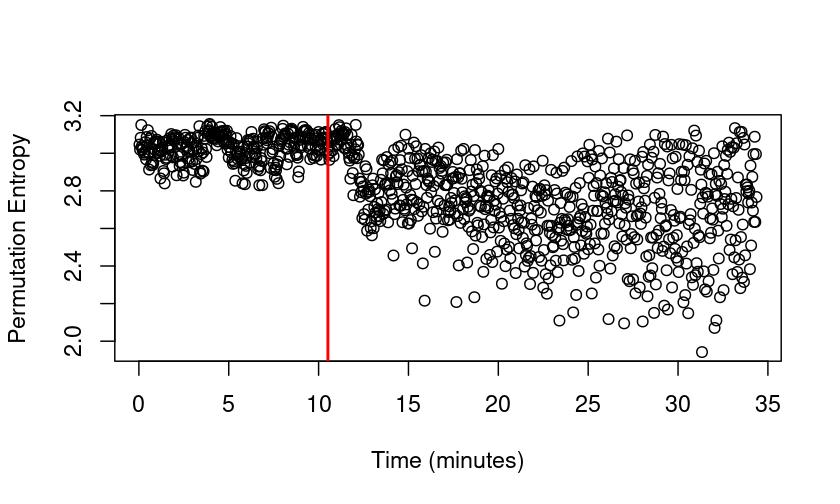
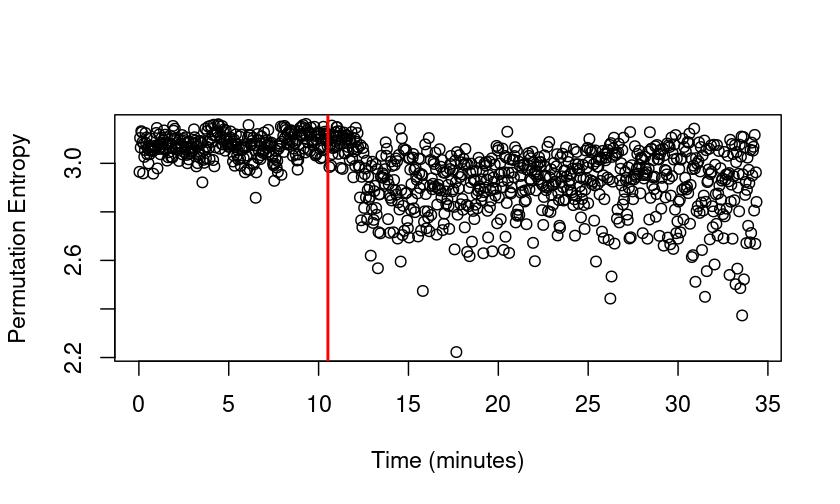
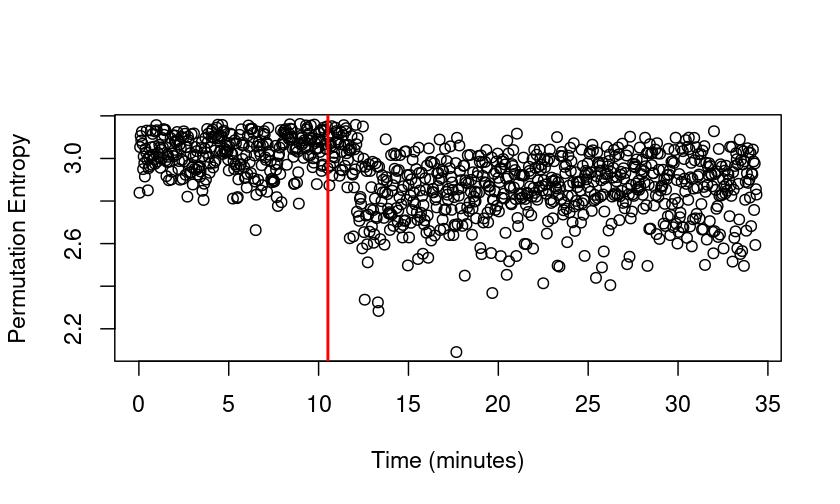
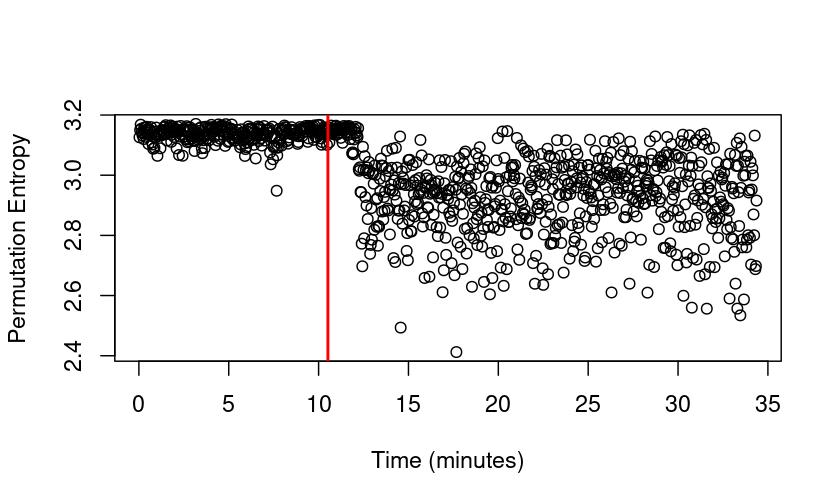
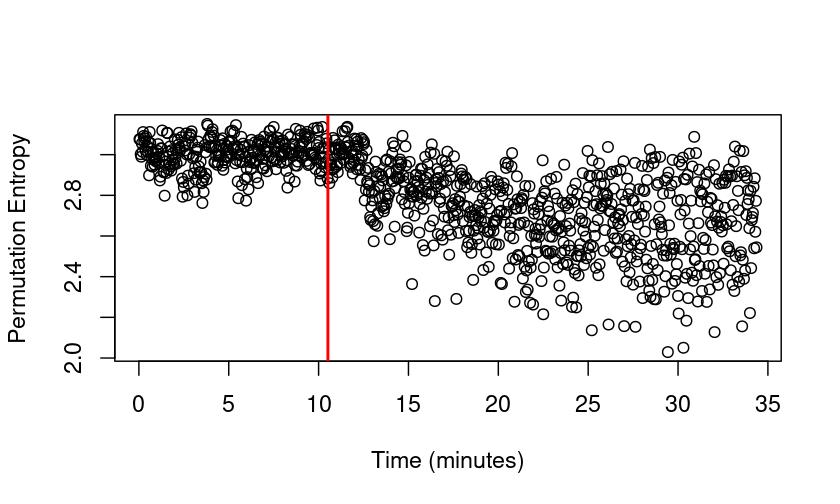
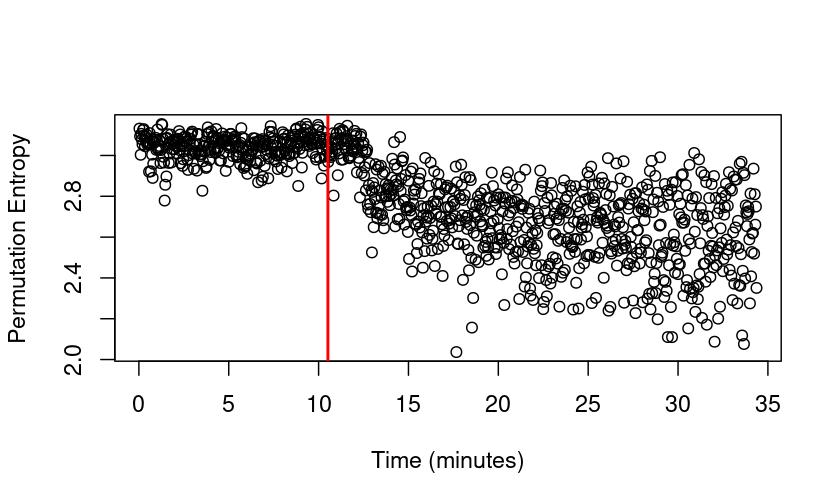
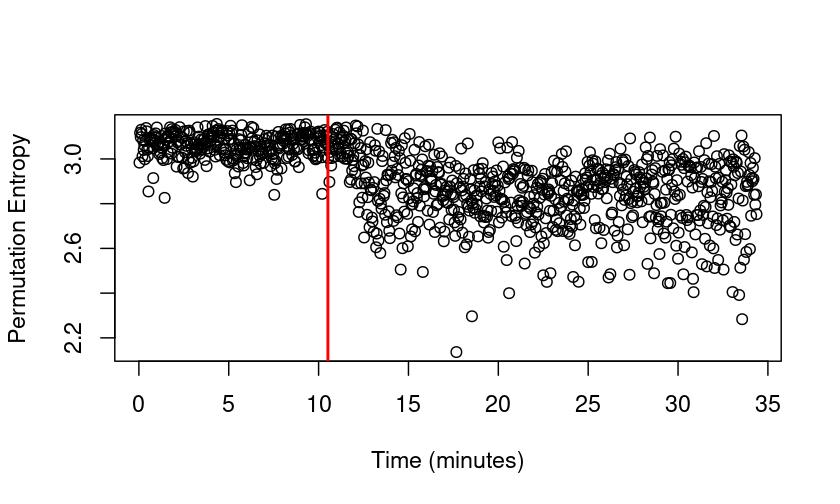
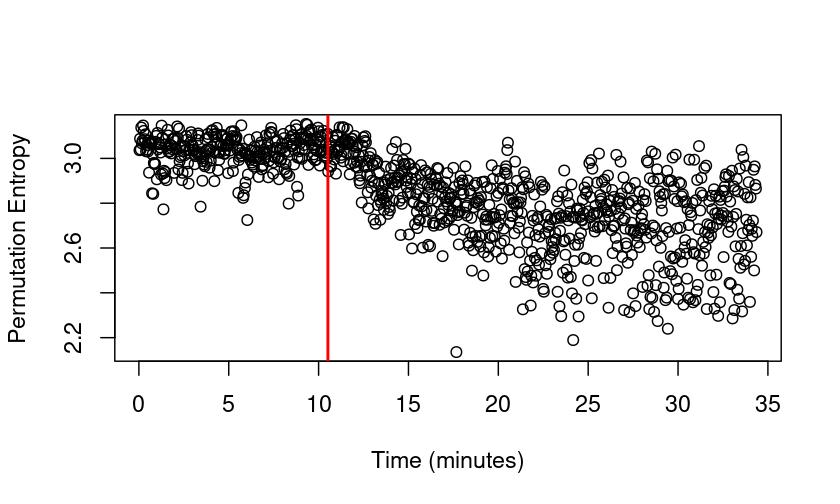
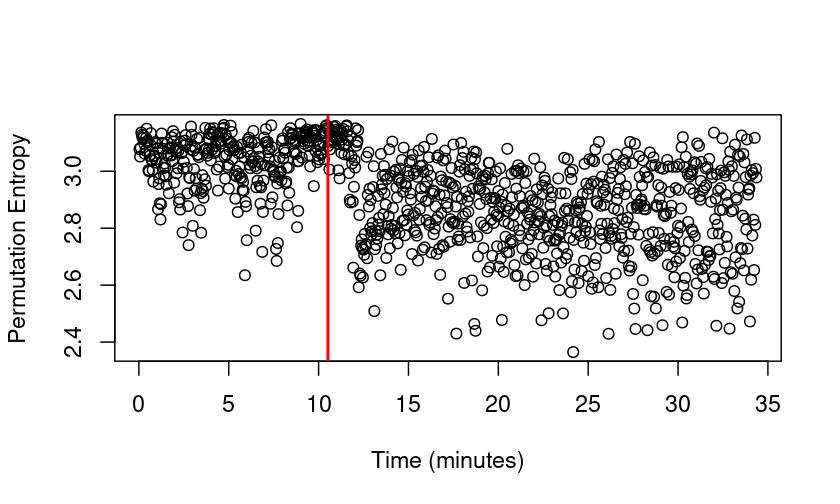
By analyzing the figures of the Permutation Entropy () and the Fractal Dimension () over time throughout the anesthetic induction, we verified that during resting state conditions, the complexity of cortical activity did not present an expressive and remarkable variation, in general being considerably constant over time (see and , the values obtained before the vertical red line at 10.5 minutes in both figures). Regarding the magnitude of the values, during the resting state, the Permutation Entropy varied in the range of to 3.2 (see ), and the Fractal Dimension in the range of to 1.8 (see ). We also noticed some differences in the dynamic behavior according to the position of the electrodes over the cortex. Among all electrodes, those positioned over the frontal lobe (electrodes A to L) were the ones that exhibited the lowest variation, whereas electrodes located over the occipital and temporal lobes (electrodes N to V) were more prone to display some variation (see and for the Permutation Entropy; and for the Fractal Dimension). By analyzing the values of complexity over the coordinates of the electrodes, we verified the spatiotemporal patterns respective to the complexity of neural activity over distinct cortical regions, as well as the behavior of the cortex at a system’s level during the awakened resting-state conditions (see , and ). We have noticed that the complexity of the cortical activity was approximately the same over the whole cortex; no particular region that stood out for presenting complexity intrinsically significantly higher or inferior all the time was verified. We observe in and also in that the general aspect and most frequent patterns consisted of the majority of the electrodes displaying a predominantly red color according to the gradient chart. Localized events characterized by a reduction in the complexity of cortical activity were quite common, although these consisted of events that constantly appeared and vanished, not being present all the time. These events occurred mainly at the occipital and temporal lobes (see and ).
II. Transition
By analyzing the Figures of the Permutation Entropy and the Fractal Dimension over time throughout the anesthetic induction (see , and ), it was verified that after the administration of the anesthetics (indicated by the vertical red line at 10.5 minutes in both Figures), the complexity of the electrophysiological activity remained the same without presenting noticeable changes for approximately 1.5 to 2.0 minutes. After this time interval, we were able to contemplate an abrupt and expressive transition, which seemed to be consistent with a single-step process due to its rapid occurrence. The previously higher and approximately constant values presented a decrease and started to exhibit a considerably more significant variation (see , - A to V; and , - A to L).
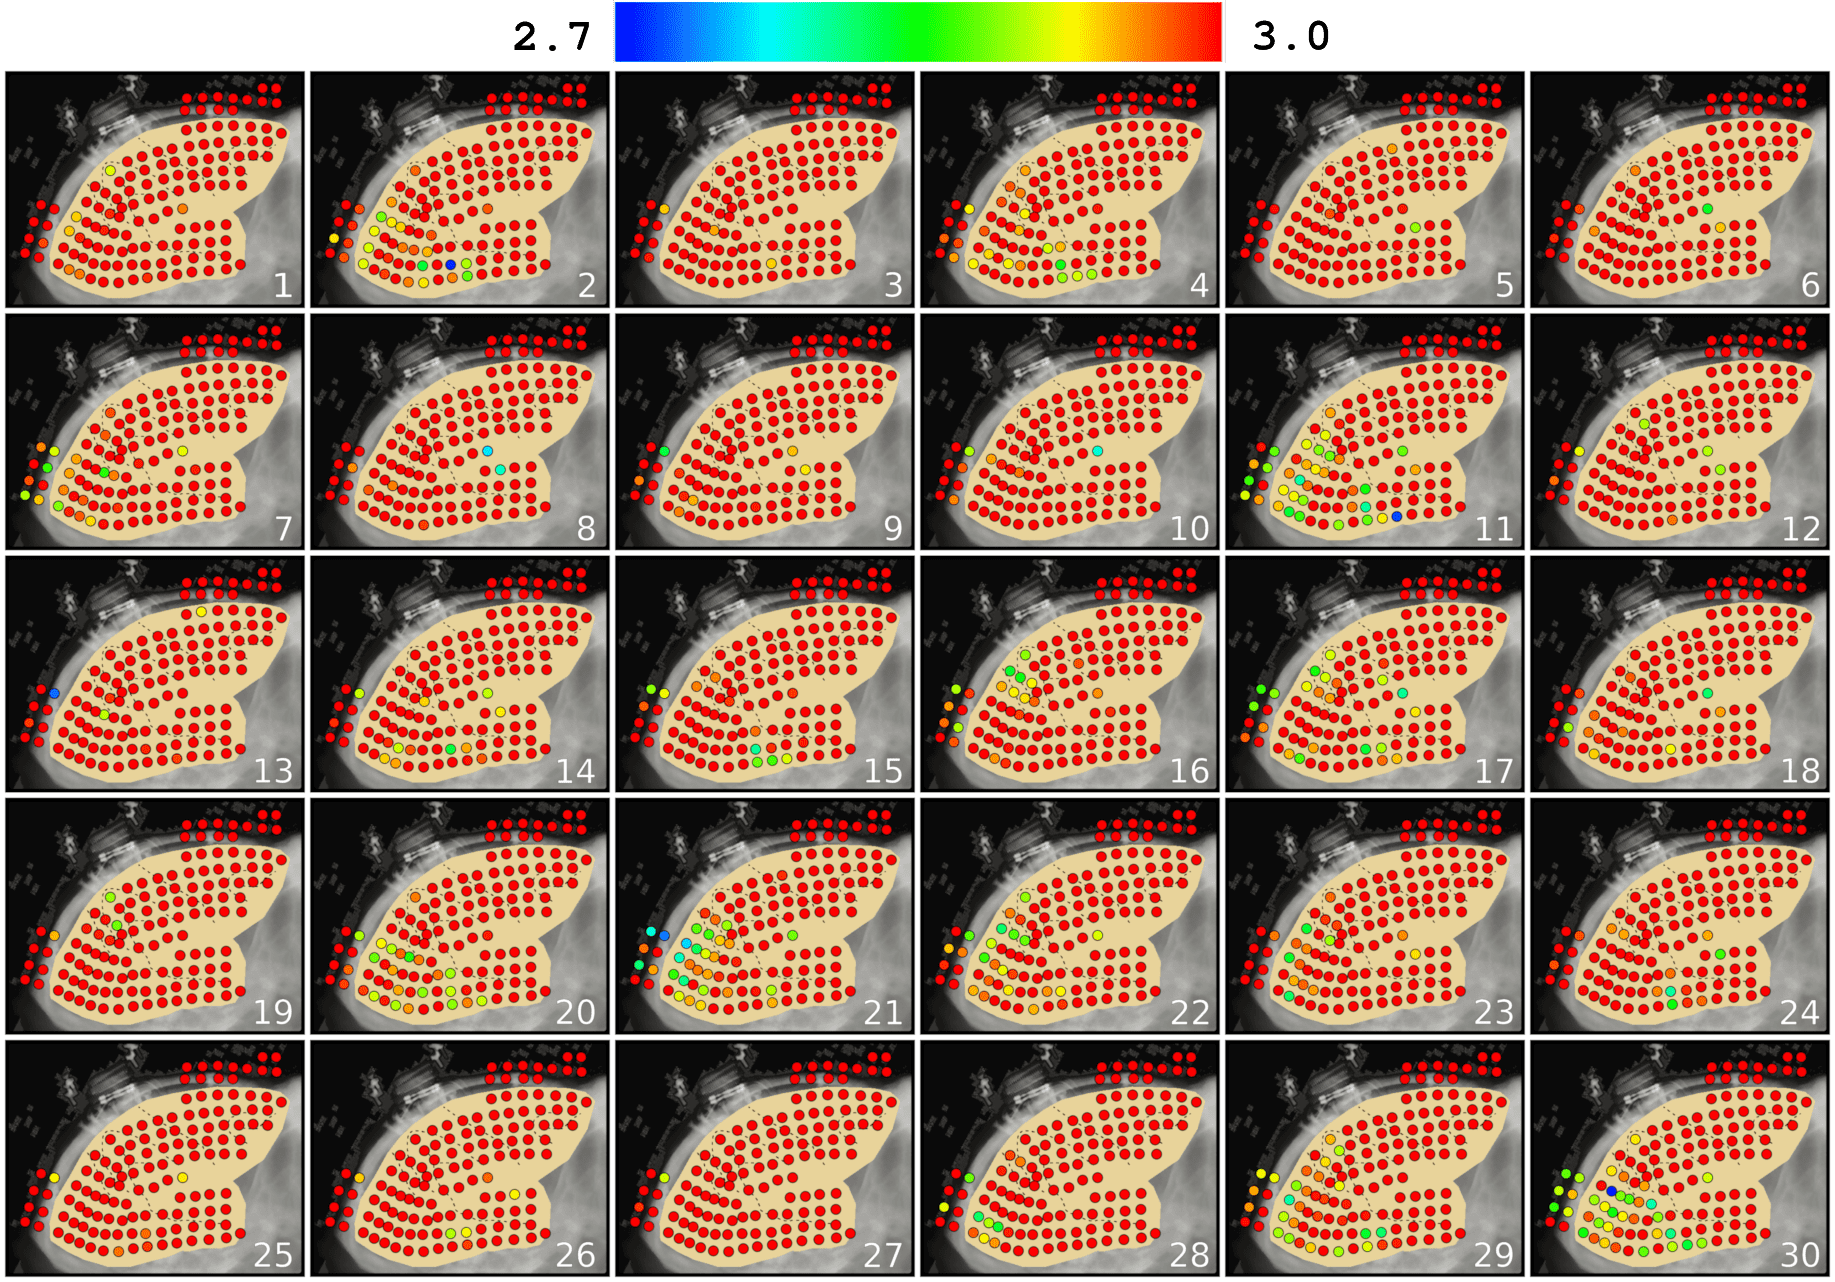
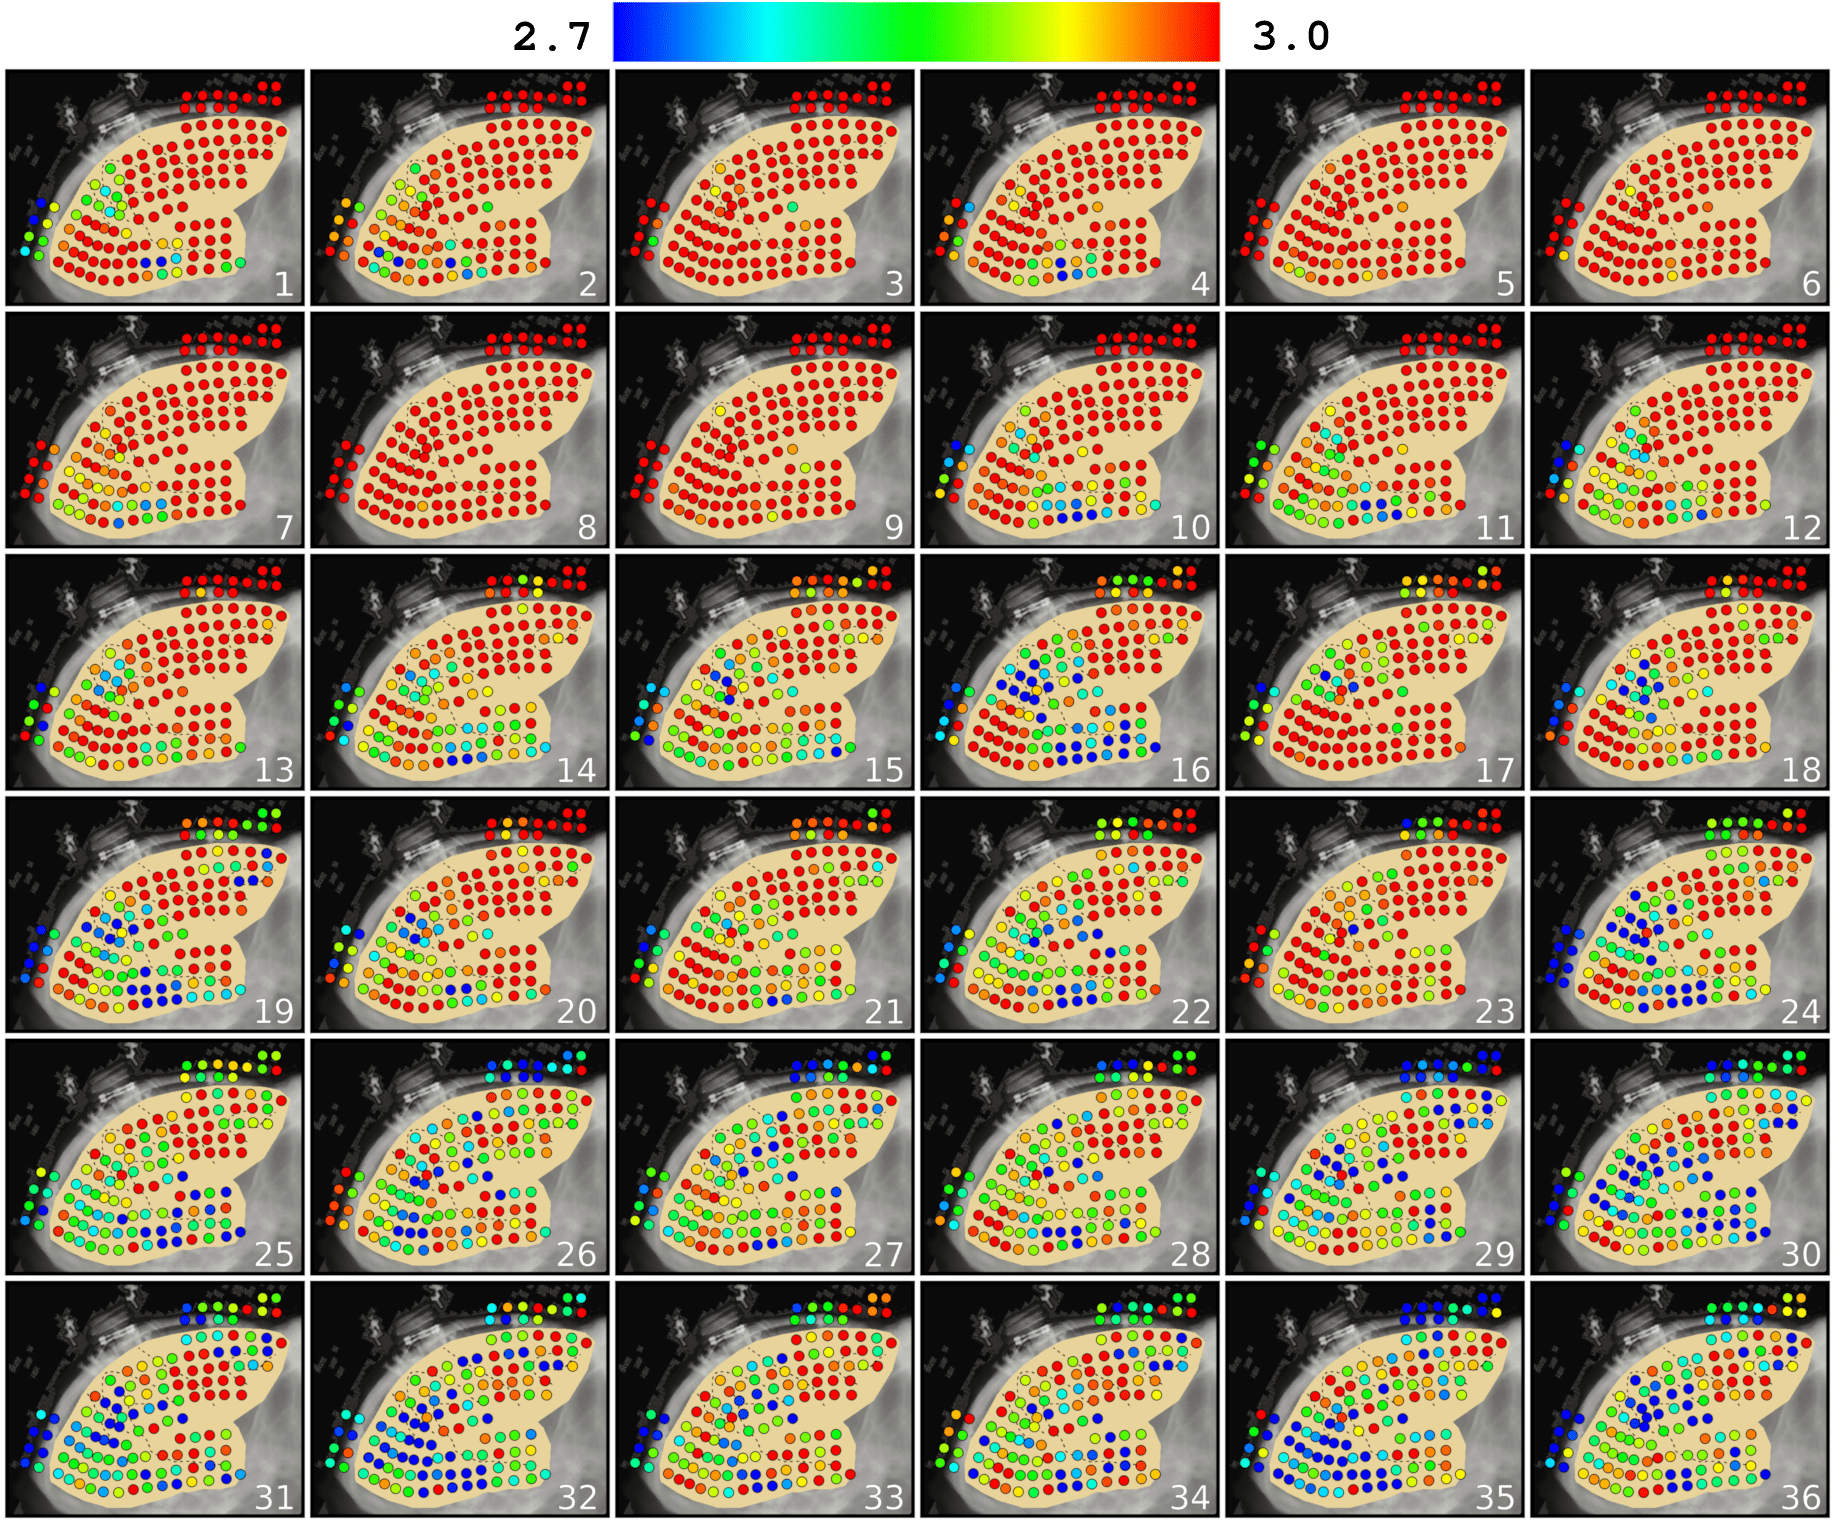
By analyzing the values of complexity over the coordinates of the electrodes, we could contemplate how distinct specialized areas, as well as the cortex at a system’s level, behaved along with the transition (see , and ). Changes were noticeable in both measures of complexity evaluated, (see ) for the Permutation Entropy and (see ) for the Fractal Dimension. Out of these two pictures, the one concerning the Fractal Dimension () had the changes in the spatiotemporal patterns quite more apparent.
The first information we can infer from the Figures is the approximate time needed for the changes to occur. In the Permutation Entropy , we verify that Sub-Figures 8 and 9 presented patterns characteristic of the alert condition, while Sub-Figures 28 and 29 already displayed very distinct patterns from those observed previously (see ). Since the time interval among consecutive Sub-Figures is 2.0 seconds, it is possible to infer that the change in the state occurred within approximately 30 to 40 seconds (see ). Regarding the Fractal Dimension , we verified that Sub-Figures 26 and 27 presented patterns characteristic of the alert condition. In contrast, Sub-Figures 39 and 40 displayed considerably different results from the previous ones (see ). Considering that the time interval between each Sub-Figure and its subsequent Sub-Figure is 2.5 seconds, we estimate that the change between the patterns occurred within approximately 30 to 40 seconds (see ). We thus arrive at the same conclusion from both figures.
The unfolding of the transition over different cortical regions can be ascertained by observing the consecutive Sub-Figures of respective to the Fractal Dimension. First, a substantial decrease in the Fractal Dimension values in the occipital, temporal, and parietal areas occurred without a significant reduction in the electrodes of the frontal region, (see , - and ). Later on, the complexity of the electrodes located over frontal areas also started to decline (see , - 37, 40, 42, 43, and 48). A remarkable feature verified along the transition was that electrodes located over the central sulcus and areas nearby showed a tendency to display higher complexity when compared to the rest of the frontal and parietal lobes (see , - 37 to 48). Another recurrent pattern observed was that both the central sulcus and the occipital lobe displayed a higher complexity in comparison with other areas of the cortex during the transition (see , - 42, 43, 44, 45, and 46). All these changes observed in the spatiotemporal patterns contrast with the features found during awake conditions. However, the recurrent spatiotemporal patterns characteristic of general anesthesia that are represented on and only showed up after a few minutes following the occurrence of the first abrupt changes.
III. General Anesthesia
By analyzing the Figures of the Permutation Entropy () and the Fractal Dimension () over time throughout the anesthetic induction, we have noticed that the first remarkable effects on the electrophysiological cortical activity complexity occurred within about 1.5 to 2.0 minutes after the administration of the anesthetics. After a few minutes following these first substantial changes, the dynamics of the complexity of cortical activity assumed a regime that prevailed during general anesthesia. It was observed in both and that the cortical activity’s complexity started to assume a wider variation and seemed to fluctuate without possessing a definite period, with the upper limits about the same as the values found during the resting state, and the magnitude of the lower values was much smaller. Specifically, the Permutation Entropy varied in the range of 2.2 to 3.2, and the Fractal Dimension in the interval of 1.3 to 1.8. By applying the Wilcoxon signed-rank test with a p-value of 5%, we confirmed that the general decrease observed in the magnitude values of complexity over all the electrodes of the ECoG matrix111This manuscript does not display the statistical test for all 128 electrodes of the ECoG matrix but displays the most representative ones according to their location over the cortical surface (see Supplementary ). was statistically significant on both Permutation Entropy and Fractal Dimension.
Examining the histograms (see and ) we can find a considerable distinction among the distributions of the two conditions. During general anesthesia, the distributions tended to be lower and substantially more widespread than during resting-state conditions. This divergence was markedly pronounced in the electrodes located over the frontal lobe.
When we analyze and that comprise the complexity of neural activity over time, we may have the impression that during general anesthesia, the complexity of each electrode fluctuated in a seemingly random manner. However, a remarkable phenomenon was observed when we plotted the complexity values over the coordinates of the electrodes using a color gradient. We have found that, during general anesthesia, the complexity of cortical activity alternates between high and low complex states. There were times when most of the electrodes presented reduced complexity and thus assumed a predominantly blue color. Moreover, there were periods in which most of the electrodes showed high complexity and had mainly red coloring, apparently resembling the patterns and features observed during alert resting-state conditions (see and ).
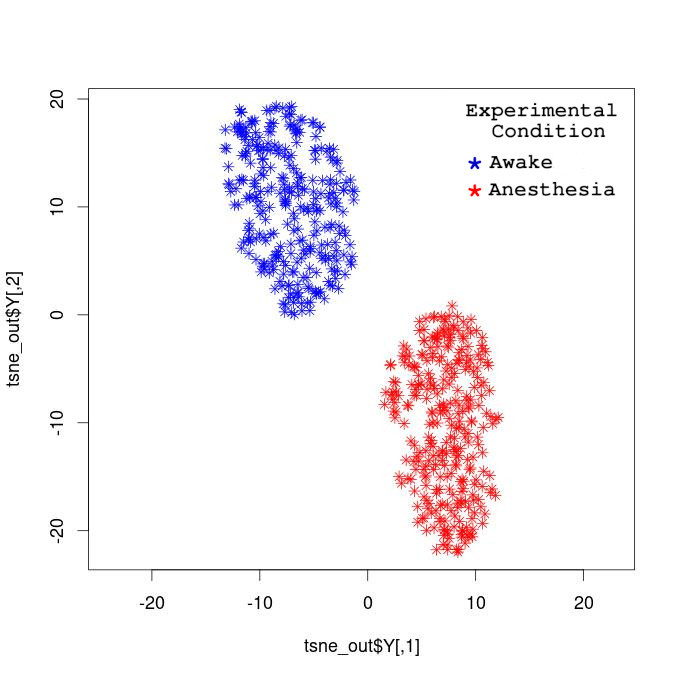
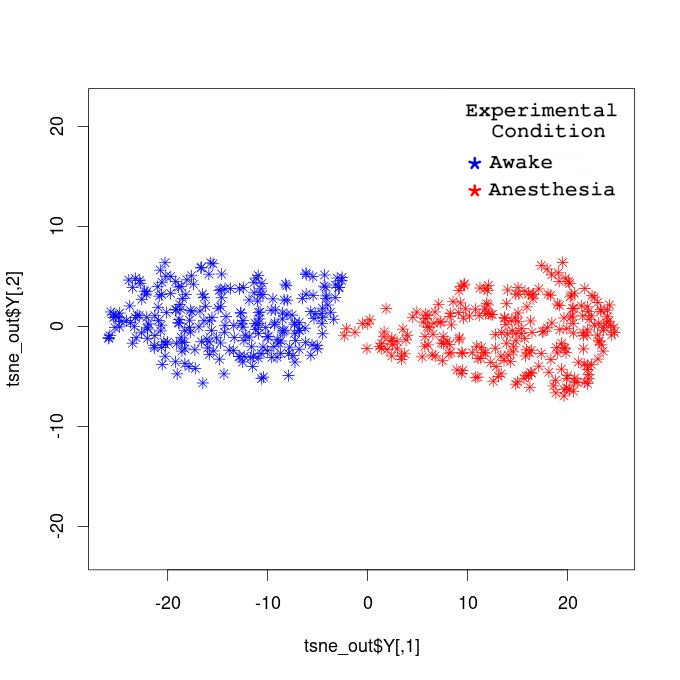
To visualize how the time-resolved complexity vector states (high-dimensional 128-D, see methods section - IV) were spatially distributed, we have used the t-SNE algorithm (Van der Maaten and Hinton, 2008) to project them into a bidimensional map. We have verified that points respective to each experimental condition, awakened resting state, and general anesthesia are positioned at distinct regions of the plane without mixing among themselves (see ). We have verified these results in both complexity measures used, the Permutation Entropy and the Fractal Dimension. From these findings, we can conclude that, regarding the time-resolved complexity vector states, the awakened resting state and general anesthesia compromise two distinct states that are distinguishable from each other at all times. Although some patterns found during general anesthesia (see and ) seemed to resemble those found during alert conditions (see and ), they were in reality distinct.
IV. Conclusions
In the present research, we inferred the complexity of electrophysiological neural records in a database respective to a Ketamine-Medetomidine anesthetic induction experiment in a macaque subject chronically implanted with a dense ECoG electrode array in the subdural space along the right brain hemisphere. We have inferred the dynamics of the complexity of the neural activity over distinct cortical areas and the spatial-temporal patterns established along the cortex during awakened resting state and general anesthesia conditions. The unfolding of the transition to induced unconsciousness has also been observed. We have verified that during awakened resting-state conditions, the complexity is relatively uniform across the cortex, despite some events of localized complexity reduction frequently occurring at the occipital and temporal lobes. We have found that the first remarkable changes in the complexity of neural activity occurred within about 1.5 to 2.0 minutes after the Ketamine-Medetomidine cocktail was administered and unrolled as a considerably rapid process that took about 30 to 40 seconds to succeed. During general anesthesia, at a local level, the complexity of neural activity assumed a remarkably higher variation, with the maximum values about the same as those found during the resting state and the lower values much smaller. The frontal region was the one that presented the most prominent alterations. Regarding the spatiotemporal patterns assumed by the cortex as a whole, we verified that during Ketamine-Medetomidine general anesthesia, the cortex alternated between high and low complex states. Those highly complex states displayed features that resembled the patterns found during the awakened resting-state conditions. Nonetheless, they were still distinguishable at all times.


References
- Bandt and Pompe (2002) Christoph Bandt and Bernd Pompe. Permutation entropy: a natural complexity measure for time series. Physical review letters, 88(17):174102, 2002.
- Higuchi (1988) Tomoyuki Higuchi. Approach to an irregular time series on the basis of the fractal theory. Physica D: Nonlinear Phenomena, 31(2):277–283, 1988.
- Krijthe et al. (2018) Jesse Krijthe, Laurens van der Maaten, and Maintainer Jesse Krijthe. Package ‘rtsne’, 2018.
- Nagasaka et al. (2011) Yasuo Nagasaka, Kentaro Shimoda, and Naotaka Fujii. Multidimensional recording (mdr) and data sharing: an ecological open research and educational platform for neuroscience. PloS one, 6(7):e22561, 2011.
- Van der Maaten and Hinton (2008) Laurens Van der Maaten and Geoffrey Hinton. Visualizing data using t-sne. Journal of machine learning research, 9(11), 2008.